DOI:10.32604/cmc.2022.028878
| Computers, Materials & Continua DOI:10.32604/cmc.2022.028878 | |
| Article |
Improved Metaheuristics with Machine Learning Enabled Medical Decision Support System
1Department of Computer Science, College of Computer and Information Sciences, Majmaah University, Al-Majmaah, 11952, Saudi Arabia
2Research Center - CIENS, Escuela Naval de Suboficiales A.R.C. “Barranquilla”, Barranquilla, Colombia
3Electronics and Telecommunications Engineering Program, Universidad Autónoma del Caribe, Barranquilla, 080001, Colombia
4Departament of Computational Science and Electronic, Universidad de la Costa, CUC, Barranquilla, 080001, Colombia
5Biomedical Engineering Program, Universidad Simón Bolívar, Barranquilla, 080001, Colombia
6Department of Mathematics, Faculty of Science, New Valley University, El-Kharga 72511, Egypt
7Department of Electrical Engineering, College of Engineering, Jouf University, Saudi Arabia
*Corresponding Author: José Escorcia-Gutierrez. Email: jose.escorcia23@gmail.com
Received: 20 February 2022; Accepted: 02 April 2022
Abstract: Smart healthcare has become a hot research topic due to the contemporary developments of Internet of Things (IoT), sensor technologies, cloud computing, and others. Besides, the latest advances of Artificial Intelligence (AI) tools find helpful for decision-making in innovative healthcare to diagnose several diseases. Ovarian Cancer (OC) is a kind of cancer that affects women’s ovaries, and it is tedious to identify OC at the primary stages with a high mortality rate. The OC data produced by the Internet of Medical Things (IoMT) devices can be utilized to differentiate OC. In this aspect, this paper introduces a new quantum black widow optimization with a machine learning-enabled decision support system (QBWO-MLDSS) for smart healthcare. The primary intention of the QBWO-MLDSS technique is to detect and categorize the OC rapidly and accurately. Besides, the QBWO-MLDSS model involves a Z-score normalization approach to pre-process the data. In addition, the QBWO-MLDSS technique derives a QBWO algorithm as a feature selection to derive optimum feature subsets. Moreover, symbiotic organisms search (SOS) with extreme learning machine (ELM) model is applied as a classifier for the detection and classification of ELM model, thereby improving the overall classification performance. The design of QBWO and SOS for OC detection and classification in the smart healthcare environment shows the study’s novelty. The experimental result analysis of the QBWO-MLDSS model is conducted using a benchmark dataset, and the comparative results reported the enhanced outcomes of the QBWO-MLDSS model over the recent approaches.
Keywords: Ovarian cancer; decision support system; smart healthcare; IoMT; deep learning; feature selection
With the expansion of smart sensorial media, things, and cloud techniques, innovative healthcare is gaining considerable interest towards the government, academia, industry, and the health care communities [1]. In recent times, the Internet of Things (IoT) has brought the vision of a smart world into reality with numerous services and a considerable volume of information [2]. Cloud computing is well suited for enabling technologies in the scenarios since it presents a flexible stack of computing, software, and storage services at a lower cost [3]. Cloud-based service could offer a higher quality of experience to clinics, caregivers, and physicians anytime and anywhere continuously. However, the cloud and the convergence of IoT could offer new opportunities for these two techniques. The IoT cloud convergence plays a significant role in smart healthcare by understanding heterogeneous healthcare contents for supporting quality and affordable healthcare [4]. The OC is the third most common gynecologic cancer worldwide after uterine and cervical cancers and has high death rates [5]. Thus, it is essential to understand more about ovarian cancer heterogeneity to choose distinct treatment responses and predict patient medical outcomes. Fig. 1 illustrates the smart healthcare system in IoT.
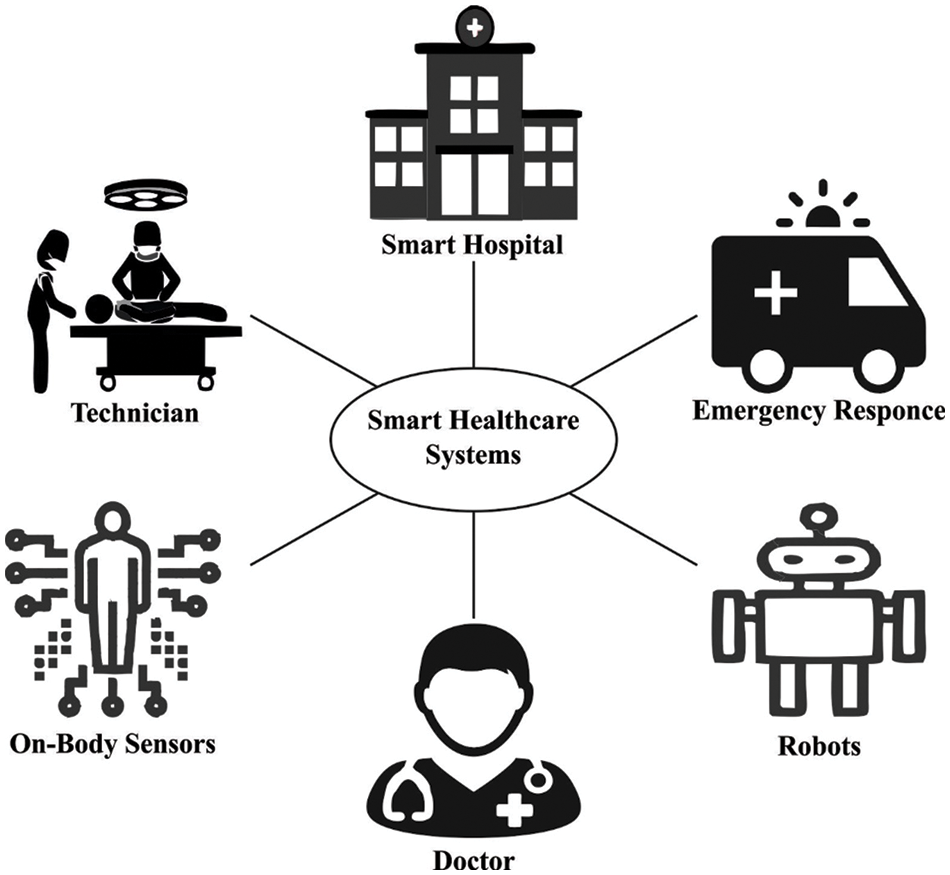
Figure 1: Smart healthcare system in IoT
Even though ovarian cancer is chemo-sensitive and usually shows primary efficiency against taxane or platinum treatment, the five-year recurrence rate is 60% to 80% in those with advanced disease [6]. Hence, significant efforts have been focused on developing novel techniques for predicting disease progression and prognoses for malignancy. On the IoMT, the calculation of OC gets better by using new potential data for experimental purposes [7]. In some cases, earlier diagnosis of OC is essential. Nevertheless, earlier recognition of OC remains a challenge for each of the endeavors. There have been ongoing studies for recognizing cancer markers using proteomic design in serum [8]. The AI is considered a diagnostic approach for medicinal diagnoses. In terms of computer-aid diagnosis (CAD), the possibility of AI usage in medicine has been investigated [9–12].
At first, AI is distinct from conventional computer programming [13]. A preceding programming approach generates output with the input data and the given rule. On the other hand, AI produces rules using the input and output data. Assumed the input and output data of the current data set, the AI approach derive patterns and rules hidden in the data. Moreover, with the recently found patterns and rules, AI could forecast the output eventually from other input data. AI prediction has been studied and applied in different scientific fields. In comparison to the conventional medical image processing method [14], deep learning includes deep belief nets (DBN), which employs image pixel value as input data rather than image feature estimated from the segmented object; therefore, manual object segmentation or feature calculation is no longer needed, that making the procedure efficient and more straightforward. After that, authors in virtually every field, including medical imaging, have actively started participating in the dynamically increasing fields of deep learning.
This paper introduces a new quantum black widow optimization with a machine learning-enabled decision support system (QBWO-MLDSS) for smart healthcare. The QBWO-MLDSS model primarily employs the Z-score normalization approach to pre-process the data. Besides, the QBWO-MLDSS technique designs a novel QBWO algorithm for feature selection (FS). Next, symbiotic organisms search (SOS) with extreme learning machine (ELM) model applied for OC detection and classification. The experimental result analysis of the QBWO-MLDSS model is performed using a benchmark dataset.
Consiglio et al. [15] related a group of fuzzy rule models and genetic algorithm (GA) for analyzing the data set collected of 21 instances and six classes, suitable for exploring expression profiles from OC, related to another ovarian disease. The presented technique has been able to execute a feature selection (FS) amongst genes the GA leads and structure a group of if-then rules that describe that class is well-known by detecting modifies from the expression of chosen genes. Bae et al. [16] proposed a FS technique that effectively differentiates colorectal cancer patients in normal individuals utilizing K-means clustering and the altered harmony search algorithm (HSA). The presented technique has 4 phases. Primary, novel data are Z-normalizing by data pre-processing. The candidate genes are chosen to utilize the Fisher score. Afterward, one representative gene was chosen in all the clusters, then-candidate genes were clustered utilizing the K-means cluster. At last, the FS was implemented utilizing the altered HSA.
Sujamol et al. [17] described a multistage FS technique for identifying critical micro-Ribonucleic acid (MiRNA) and medicinal features to enhance the accuracy of OC recurrence forecasted. The MiRNA expression profiles of OC patients and their equivalent to medicinal information are downloaded in The Cancer Genome Atlas (TCGA) cancer repository. In addition, recurrence forecast is executed utilizing the attained MiRNA expression profiles and medicinal factor selected utilizing correlation study. Paik et al. [18] designed a novel prognostic classifier for epithelial ovarian cancer (EOC) patients utilizing gradient boosting (GB) and for comparing the accuracy of the prognostic method with convention statistical technique. A novel GB-led classifier accurately recognized the prognostic subgroups of patients with EOC and revealed superior accuracy than the convention technique.
The authors in [19] presented the machine learning (ML) technique such as Bagging and random forest (RF) to the classifier as to benign/malignant of OC. The bagging technique is identified for maximizing the classifier and avoiding over-fitting. Regardless, the RF generates a minimal error and is a practical approach to evaluating missing information. Elhoseny et al. [20] employed self-organizing maps (SOM) and Optimal recurrent neural network (ORNN) for classifying OC. Likewise, a better classification named ORNN is utilized. The classifier rate of the OC detections procedure is enhanced by optimizing the weight of RNN infrastructure utilizing the Adaptive Harmony Search Optimization (AHSO) technique.
Manzalawy et al. [21] presented a new structure to integrate multi-omics data utilizing multi-view FS. A novel multi-view FS technique is established, an alteration of famous Min-Redundancy and Maximum-Relevance (MRMR) single-view FS technique to multi-view setting. The outcomes suggested that multi-view techniques demonstrate both view-specific techniques (for instance, techniques training and testing utilized a single type of omics data) and techniques dependent upon two baseline data fusion techniques.
This study has developed a new QBWO-MLDSS technique for OC detection and classification in the smart healthcare environment. The proposed QBWO-MLDSS model encompasses Z-score normalization, QBWO based feature extraction, ELM-based classification, and SOS-based parameter tuning. The utilization of the SOS algorithm assists appropriately in choosing the parameter values of the ELM model. Fig. 2 depicts the block diagram of the QBWO-MLDSS technique.
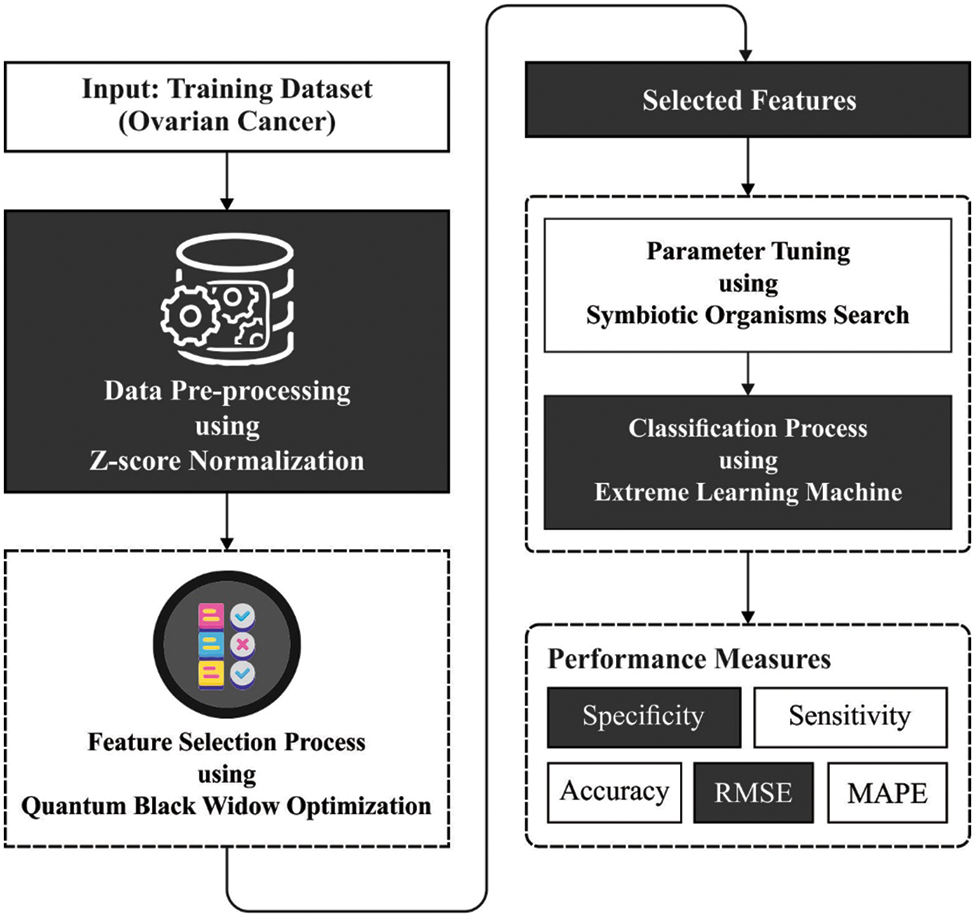
Figure 2: Block diagram of QBWO-MLDSS technique
The z-score is a normalization and standardization approach that characterizes the number of standard deviations (SD), a raw data point below or above the population mean [22]. It preferably lies in the range of
3.2 Process Involved in QBWO Based Feature Selection
Once the medical data is pre-processed, they are passed into the QBWO algorithm to choose an optimal subset of features. Like other evolutionary techniques, the presented technique initiates with the first population of spiders. Thus, every spider signifies the potential solution. Primary spiders within pairs attempt to reproduce a novel generation [23]. The female black widow (BW) eats the male during or after mating. Afterward, she transfers kept sperm from her sperm thecae and releases them into egg sacs. It is left by being implemented on the winds.
For solving an optimized issue, the value of problem variables is created as a suitable infrastructure for solving existing issues. In BWO, the potential solutions to every problem have been assumed as BW spiders. All the BW spiders illustrate the value of problem variables. For resolving the benchmark function, the infrastructure is assumed as an array. In the
All the variable values
For starting the optimized approach, the candidate widow matrix of sizes
As the pairs were independent of everyone, it can begin with a mate for reproducing a novel generation; simultaneously, all the pairs mate from its web individually in the other. In reality, around 1000 eggs were created from all mates; eventually, any spider babies have been survived that are stronger. Afterward, offspring have been created with utilizing
This procedure has been repeated
At this point, it contains three types of cannibalism. A primary one is a sexual cannibalism, whereas the female BW eats her husband during or after mating. Its fitness value finds this approach female and male. The secondary type is sibling cannibalism, whereas the strong spiderlings eat their weaker sibling. This method sets a CR based on that the count of survivors is defined during this method. In particular cases, the tertiary type of cannibalism is frequently detected that the baby spider eats its mother. It utilizes the fitness value for determining strong/weak spiderlings. It is arbitrarily chosen Mutepop amount of individual’s procedure population during the mutation phase. All the selected solutions arbitrarily exchange two elements from the array. The Mutepop has been computed as the mutation rate. Like another evolutionary technique, three end states are assumed: (A) the existing number of iterations. (B) the observance of without altering from the fitness values of the optimum widow to many iterations. (C) Attaining a particular level of accuracy.
The QBWO algorithm is derived using quantum computing concepts to improve global exploration capabilities [24]. The basic unit of quantum computing is the
where
The amplitude
The choice of features using the QBWO algorithm can be represented by a
3.3 Process Involved in Optimal ELM Based Classification
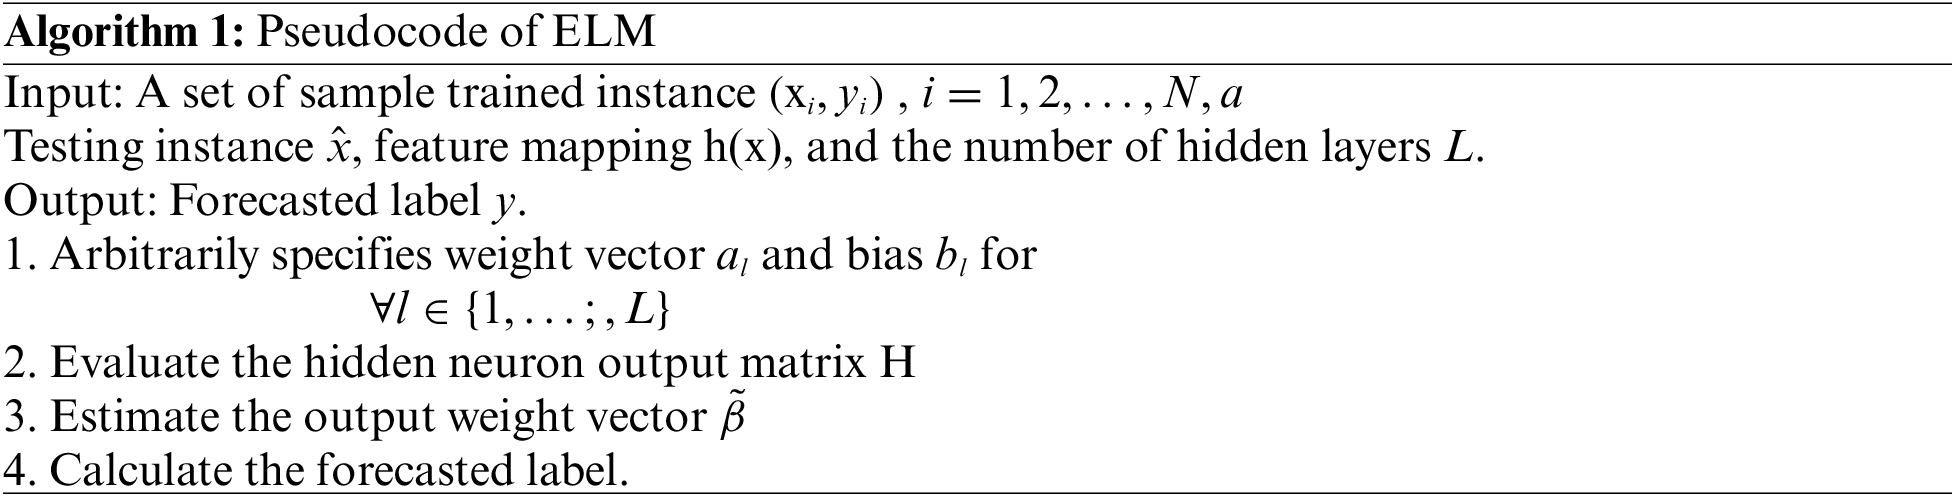
The chosen features are fed into the ELM model during the OC classification process. ELM was presented in [25]. In mathematical procedures, ELM using
whereas
Here
When no gaining is feasible for the solution of Eq. (12) by altering the input weight and hidden neuron bias, ELM arbitrarily assigns and fixes the input weight ai and hidden neuron bias bi. Then, the optimization issues Eq. (12) is converted as:
It is observed that the ELM concept aims to reach the minimum training error and the minimum norm of output weight.
Now
The ELM approach for OC classification has been shown in Algorithm 1.
Finally, the weight and bias values of the ELM model are optimally adjusted using the SOS algorithm. Cheng and Prayogo [26] developed a metaheuristic technique, named SOS, stimulated from the natural ecosystem. The SOS algorithm exploits the symbiotic connection among two different species. Mutualism can be defined as the interdependent relationship among a pair of organisms where both organisms benefit from the interaction. The relationship between bees and flowers is a perfect illustration form mutualism. The bee moves amongst the flower, gather nectar, and converts it to honey. It also assists the flowers in the pollination procedure. The mathematical formulation of this process is defined in the following:
where
The round function can set the BF value as 1 or 2. It helps determine whether the organism partly or entirely benefitted from the interaction amongst the individuals from the population.
The experimental result analysis of the QBWO-MLDSS model is validated using the ovarian cancer dataset from the Kaggle repository (available at https://www.kaggle.com/saurabhshahane/predict-ovarian-cancer). This work takes 178 images under the Benign Ovarian Tumor (BOT) class and 171 images under OC class. Besides, the dataset holds a set of 50 features.
Fig. 3 shows the correlation matrix attained for the chosen 20 features. Fig. 4 exhibits the confusion matrix generated by the QBWO-MLDSS model on the OC classification process on the training/testing dataset of 80:20. The figure indicates that the QBWO-MLDSS model has identified 33 instances in the OC class and 35 in the BOT class.
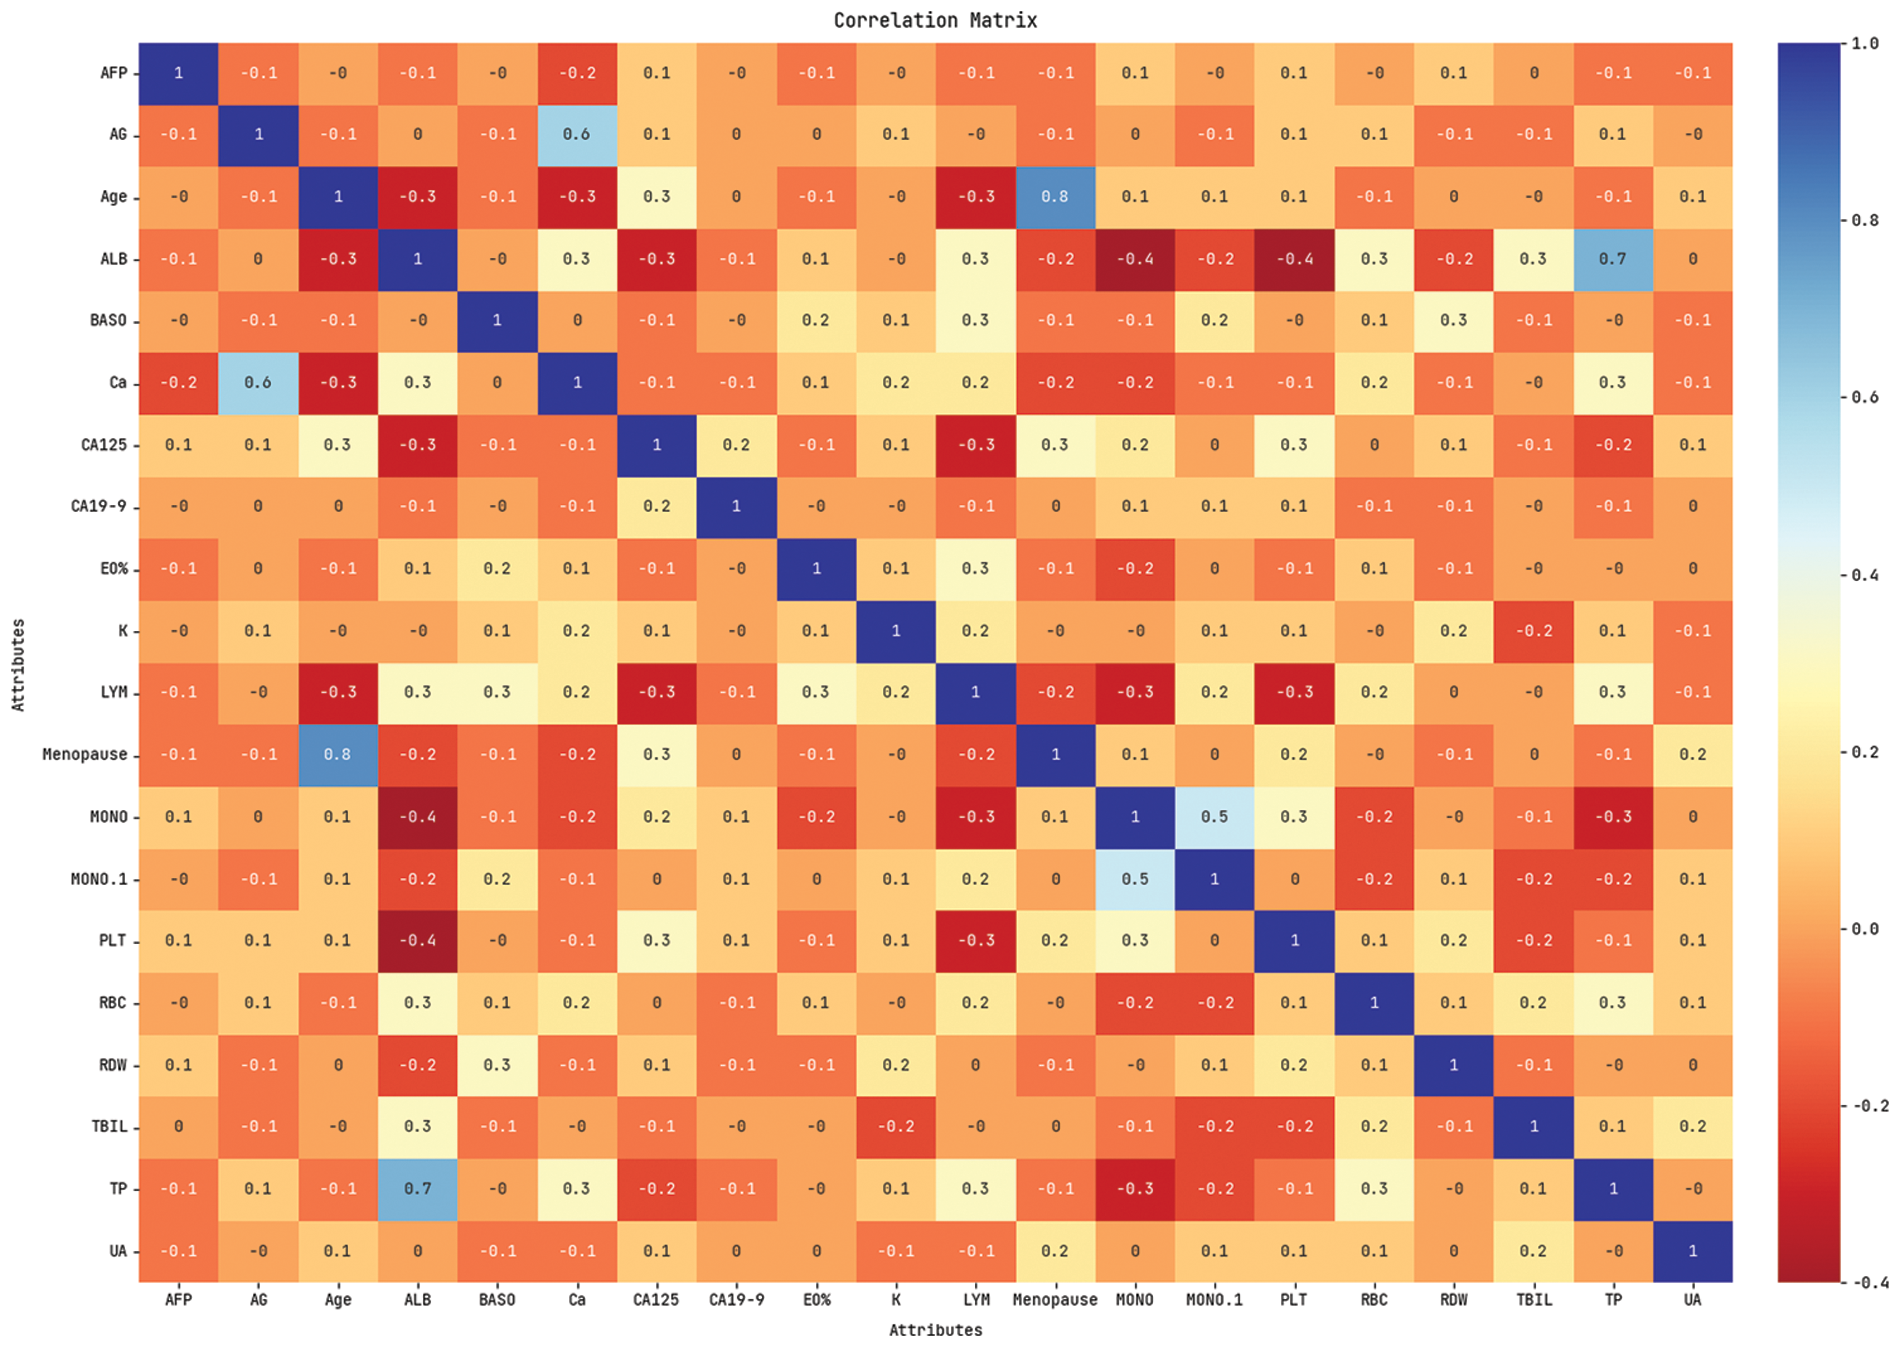
Figure 3: Correlation matrix of QBWO-MLDSS technique
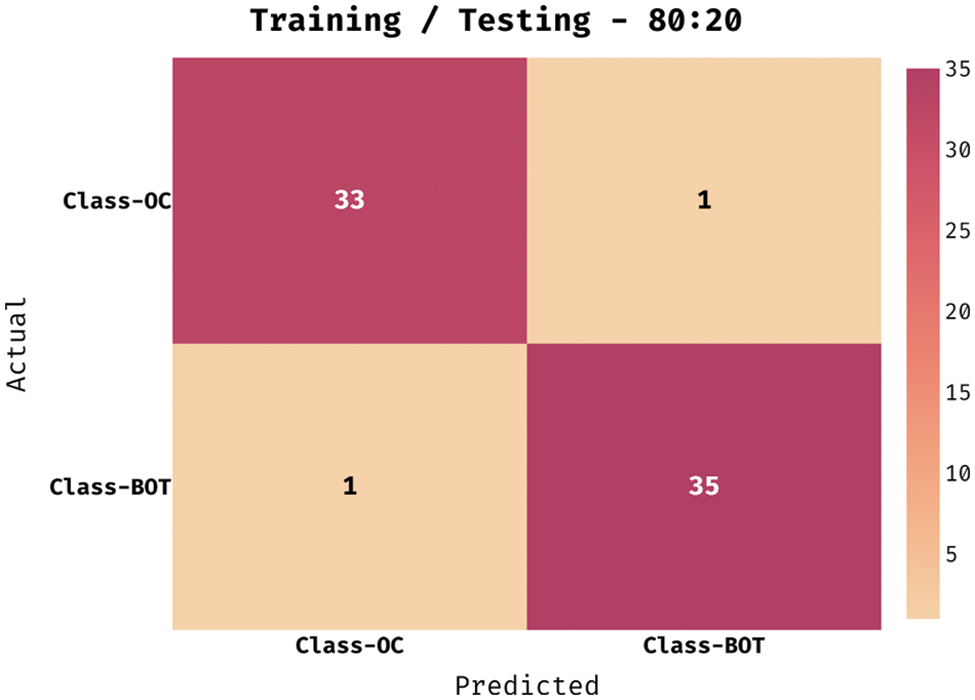
Figure 4: Confusion matrix of QBWO-MLDSS technique under training/testing (80:20) dataset
Fig. 5 demonstrates the confusion matrix created by the QBWO-MLDSS model on the OC classification process on the training/testing dataset of 70:30. The figure signified that the QBWO-MLDSS model had recognized 49 instances in the OC class and 50 in the BOT class.
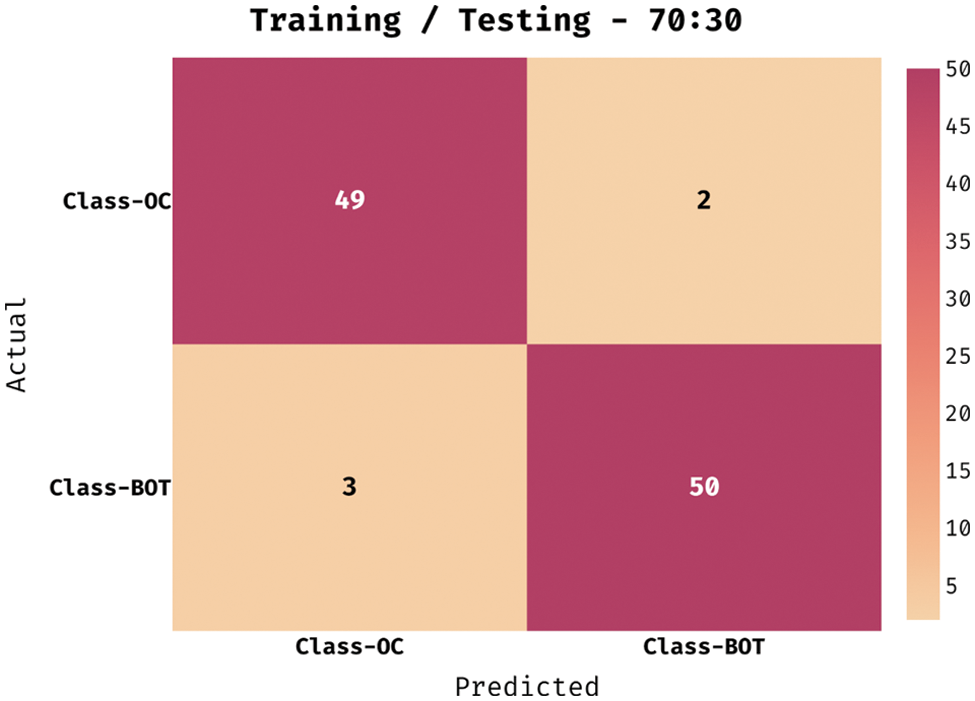
Figure 5: Confusion matrix of QBWO-MLDSS technique under training/testing (70:30) dataset
Tab. 1 provides an overall OC classification outcome of the QBWO-MLDSS model under a distinct training/testing dataset. The experimental values indicated that the QBWO-MLDSS model has resulted in practical outcomes on both sizes of training/testing datasets.
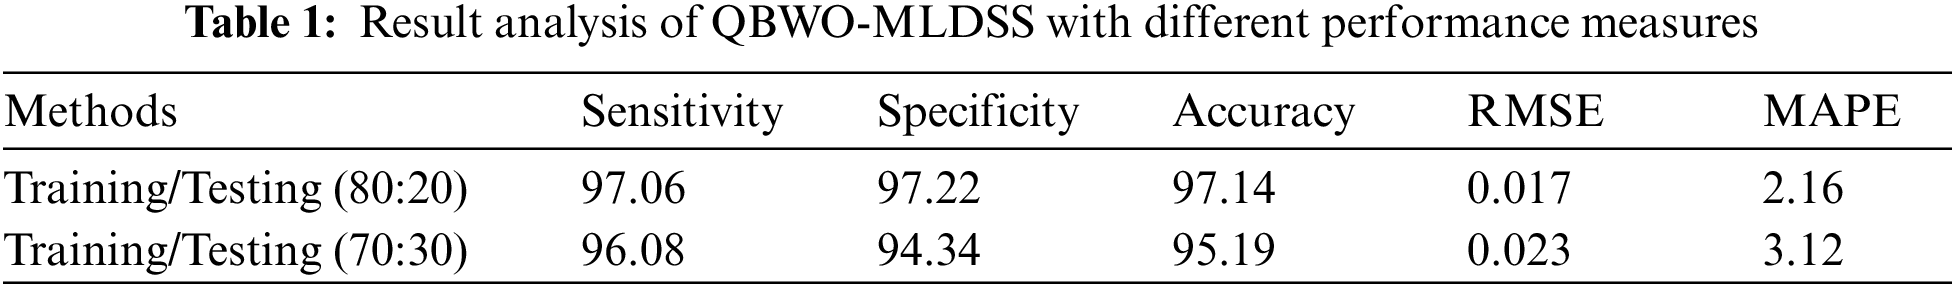
Fig. 6 investigates the performance of the QBWO-MLDSS model in terms of
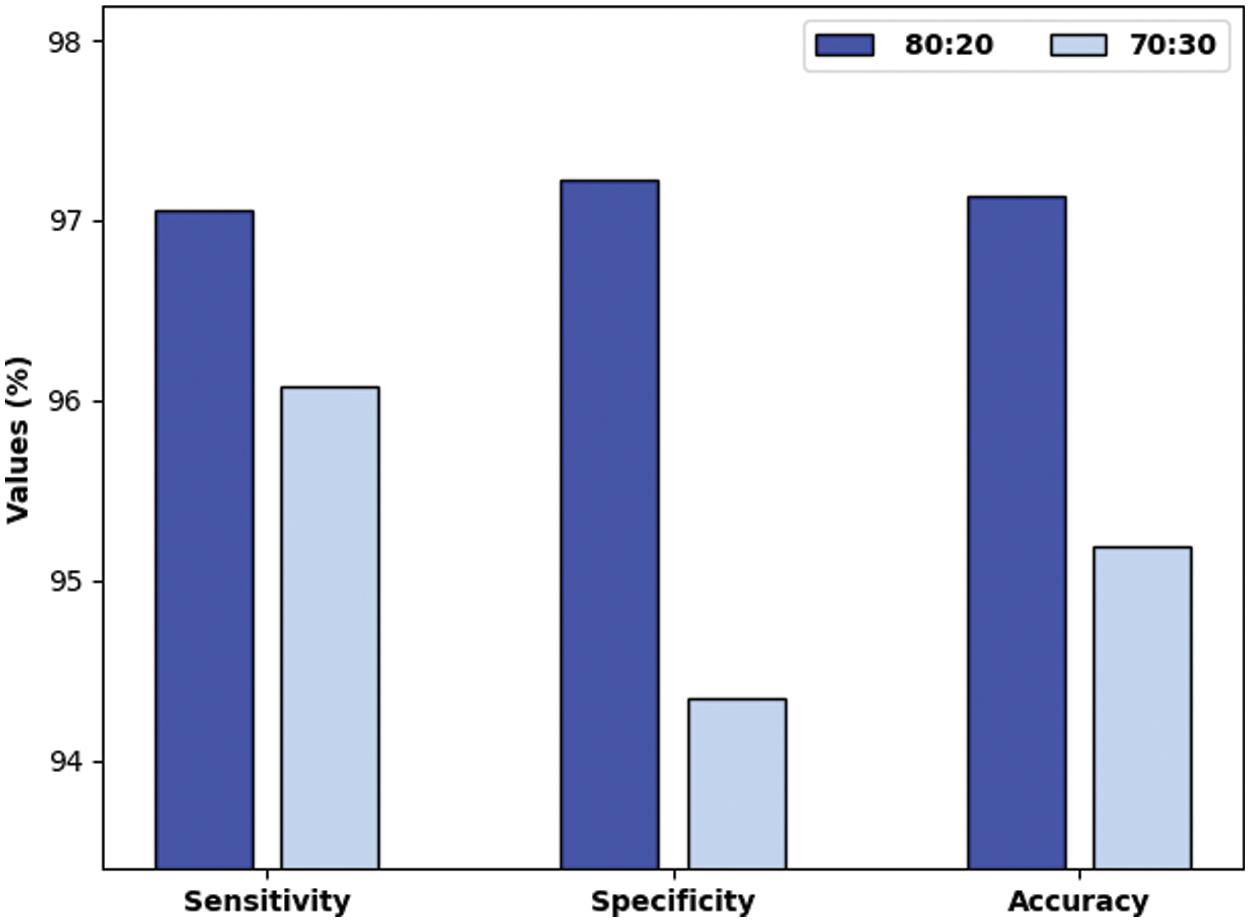
Figure 6: Result analysis of QBWO-MLDSS model technique with various measures
Fig. 7 examines the outcome of the QBWO-MLDSS model in terms of root mean square error (RMSE) and mean absolute percentage error (MAPE). The figure reported that the QBWO-MLDSS model had gained minimal values of RMSE and MAPE. For instance, on the training/testing dataset of 80:20, the QBWO-MLDSS model has provided low RMSE and MAPE of 0.017 and 2.16, respectively. In the same way, on the training/testing dataset of 70:30, the QBWO-MLDSS model has gained RMSE and MAPE of 0.023 and 3.12, respectively.
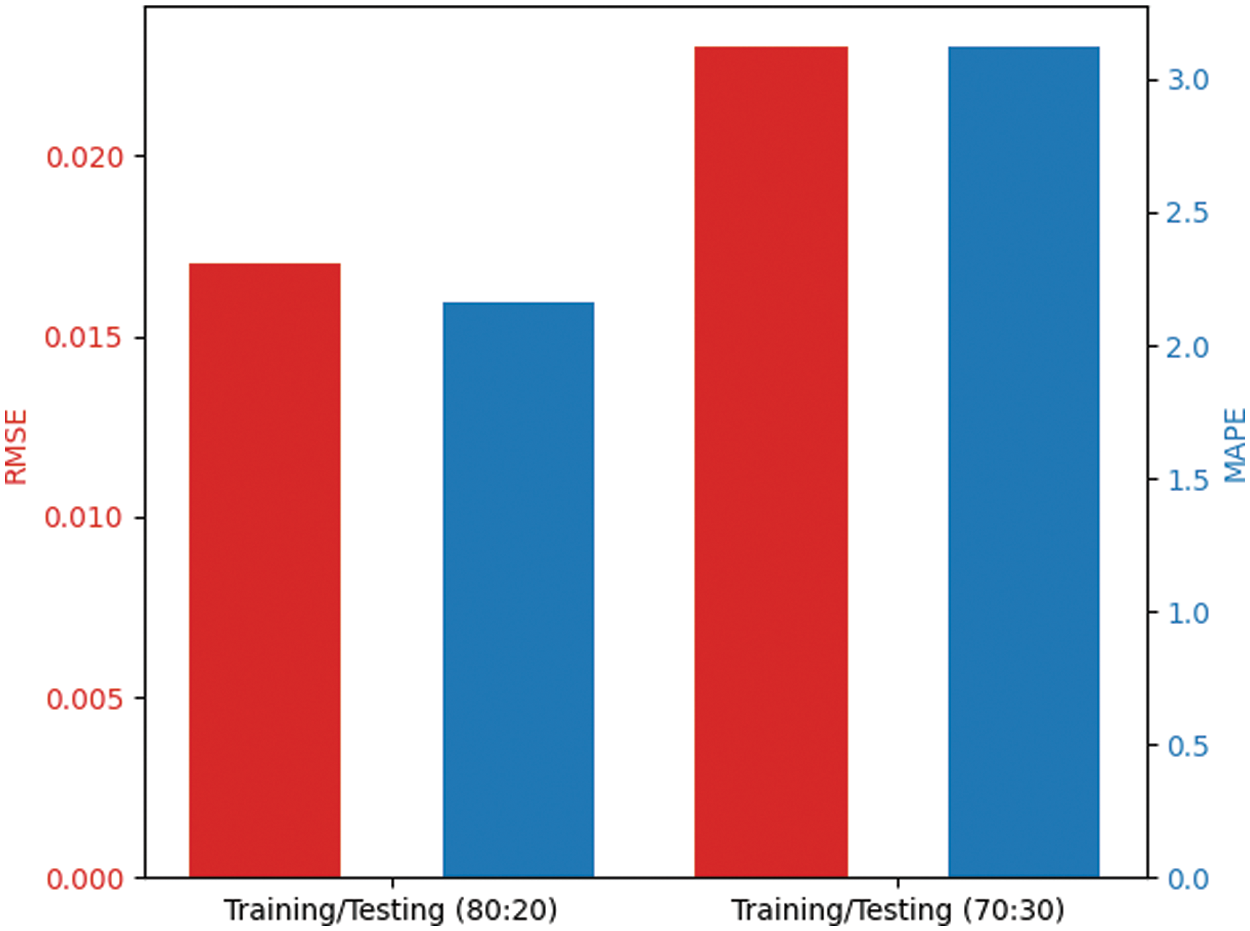
Figure 7: RMSE and MAPE analysis of QBWO-MLDSS technique
The accuracy outcome analysis of the QBWO-MLDSS technique under training/testing (80:20) dataset is portrayed in Fig. 8. The results demonstrated that the QBWO-MLDSS technique improved validation compared to training accuracy. It is additionally observable that the accuracy values with the count of epochs are saturated.
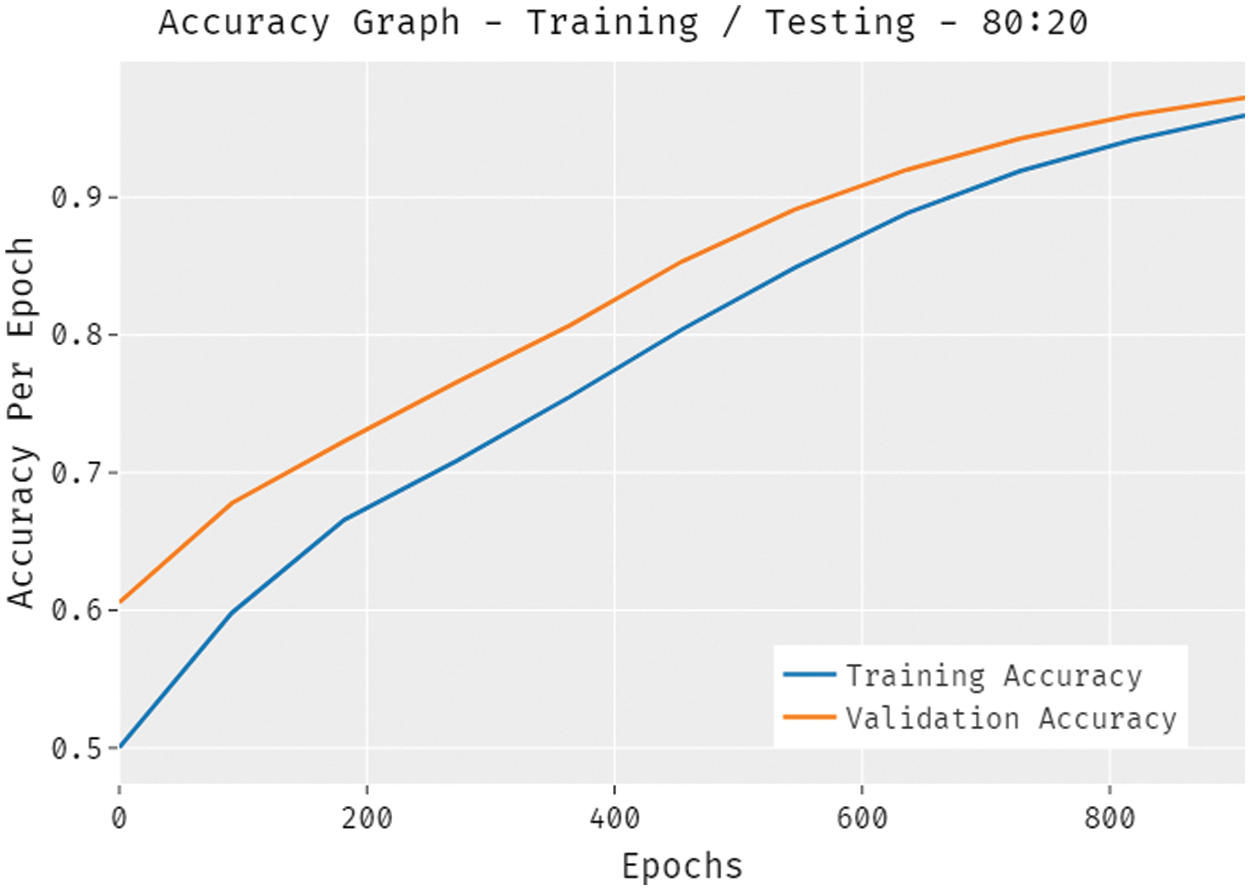
Figure 8: The QBWO-MLDSS accuracy analysis under training/testing (80:20) dataset
The loss outcome analysis of the QBWO-MLDSS technique under training/testing (80:20) dataset is depicted in Fig. 9. The figure revealed that the QBWO-MLDSS technique had signified the decreased validation over the training loss. It is further remarked that the loss values with the count of epochs are saturated.
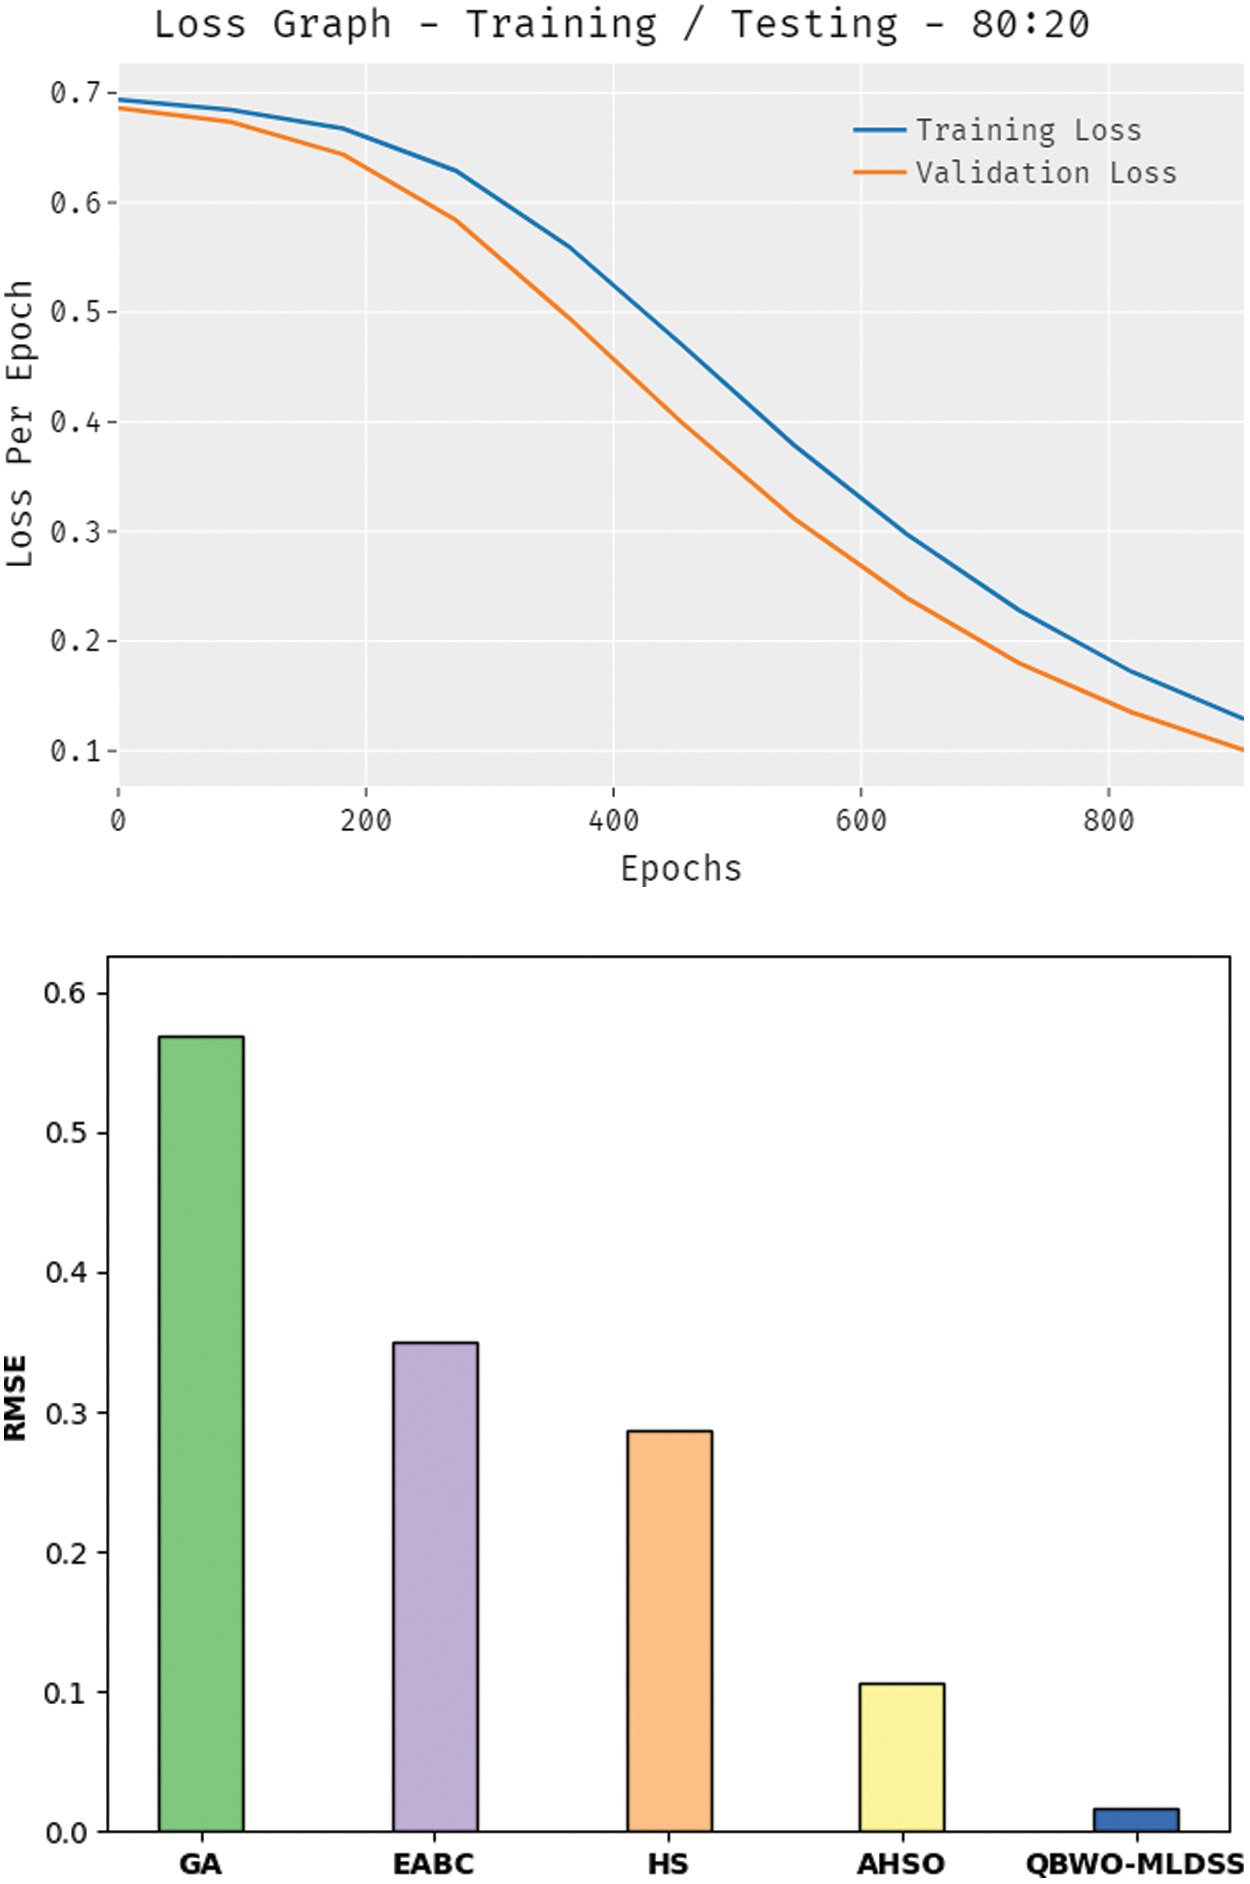
Figure 9: Loss analysis of QBWO-MLDSS technique under training/testing (80:20) dataset
Tab. 2 and Fig. 10 illustrate the result analysis of the QBWO-MLDSS model in terms of RMSE and MAPE. The results indicated that the genetic algorithm (GA) model has worse outcomes with the maximum RMSE and MAPE values of 0.5693 and 5.5620, respectively. Afterward, the enhanced artificial bee colony (EABC) and harmony search (HS) models have certainly improved RMSE and MAPE values. Though the adaptive HS optimization (AHSO) algorithm has resulted in reasonable RMSE and MAPE values of 0.1065 and 3.4720, the presented QBWO-MLDSS model has accomplished effective outcomes with the least RMSE and MAPE values of 0.0170 and 2.1600, respectively.
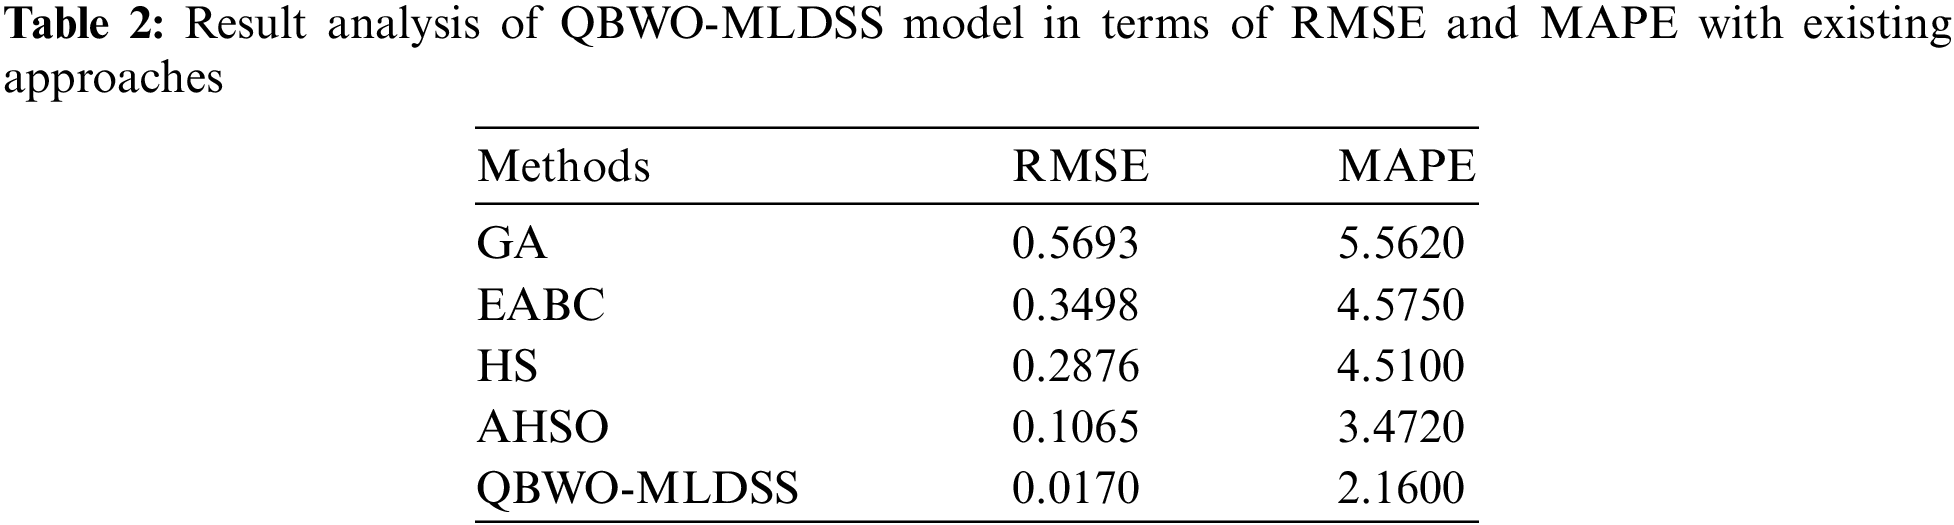
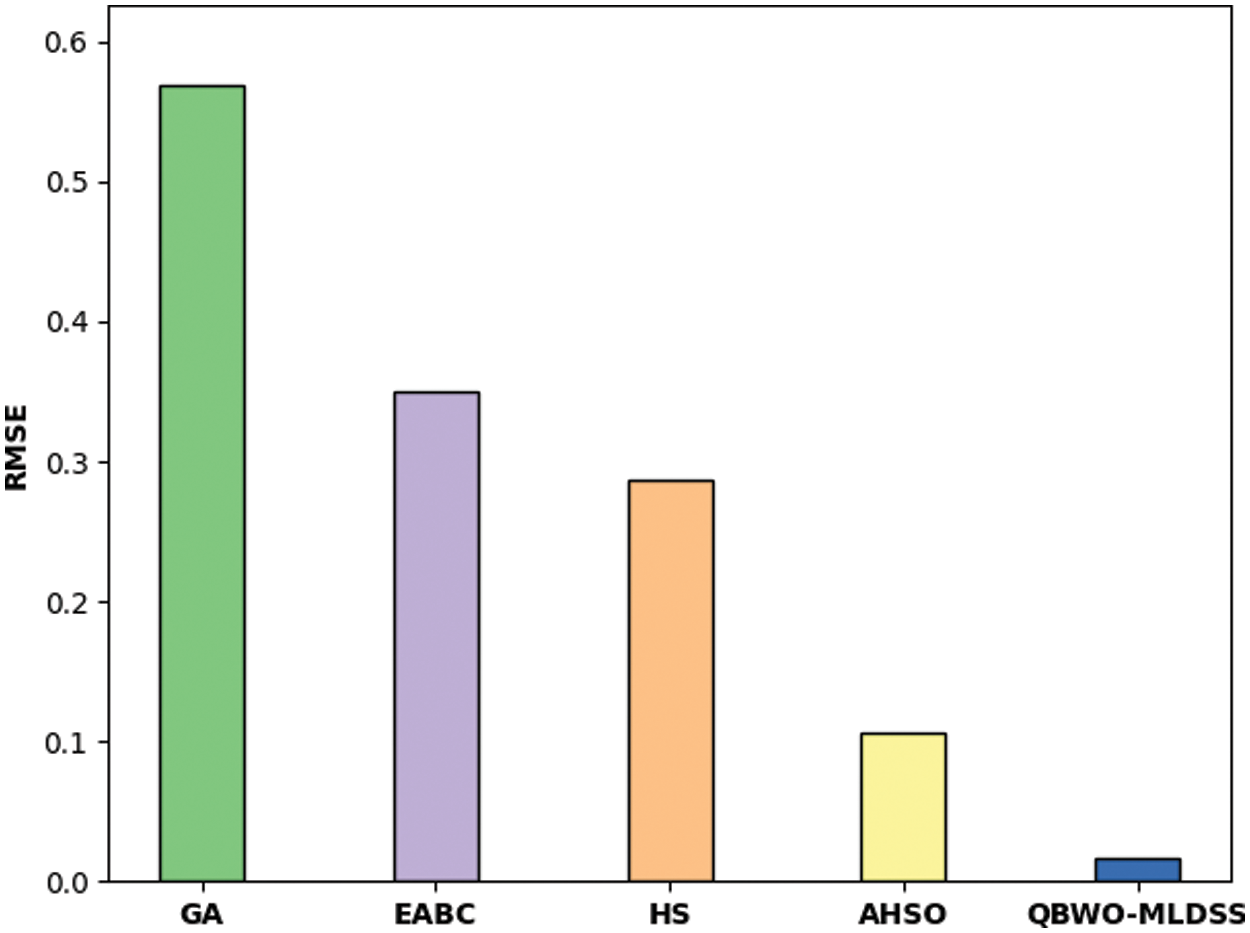
Figure 10: Result analysis of QBWO-MLDSS model with existing approaches
Tab. 3 and Fig. 11 demonstrate the comparative classification results of the QBWO-MLDSS model with existing techniques [20]. The results indicated that the radial basis function network (RBFN) and feed forward neural network (FFNN) models had shown ineffectual outcomes with minimal
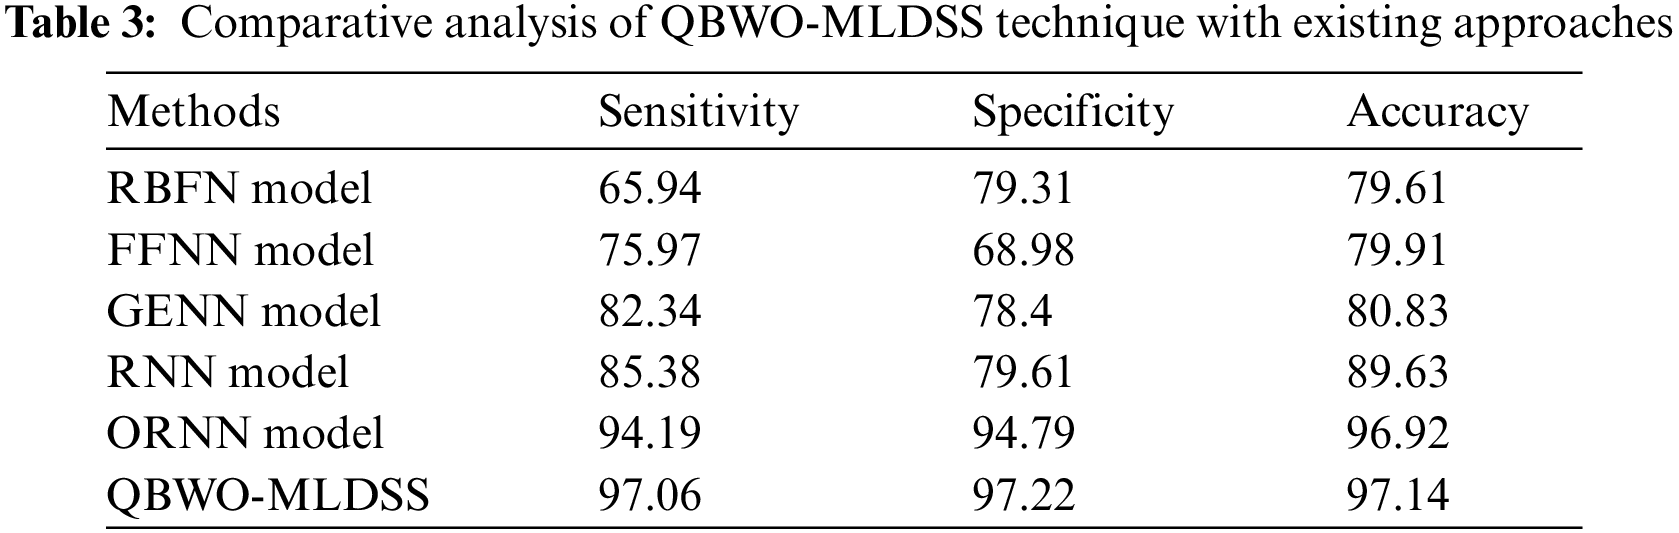
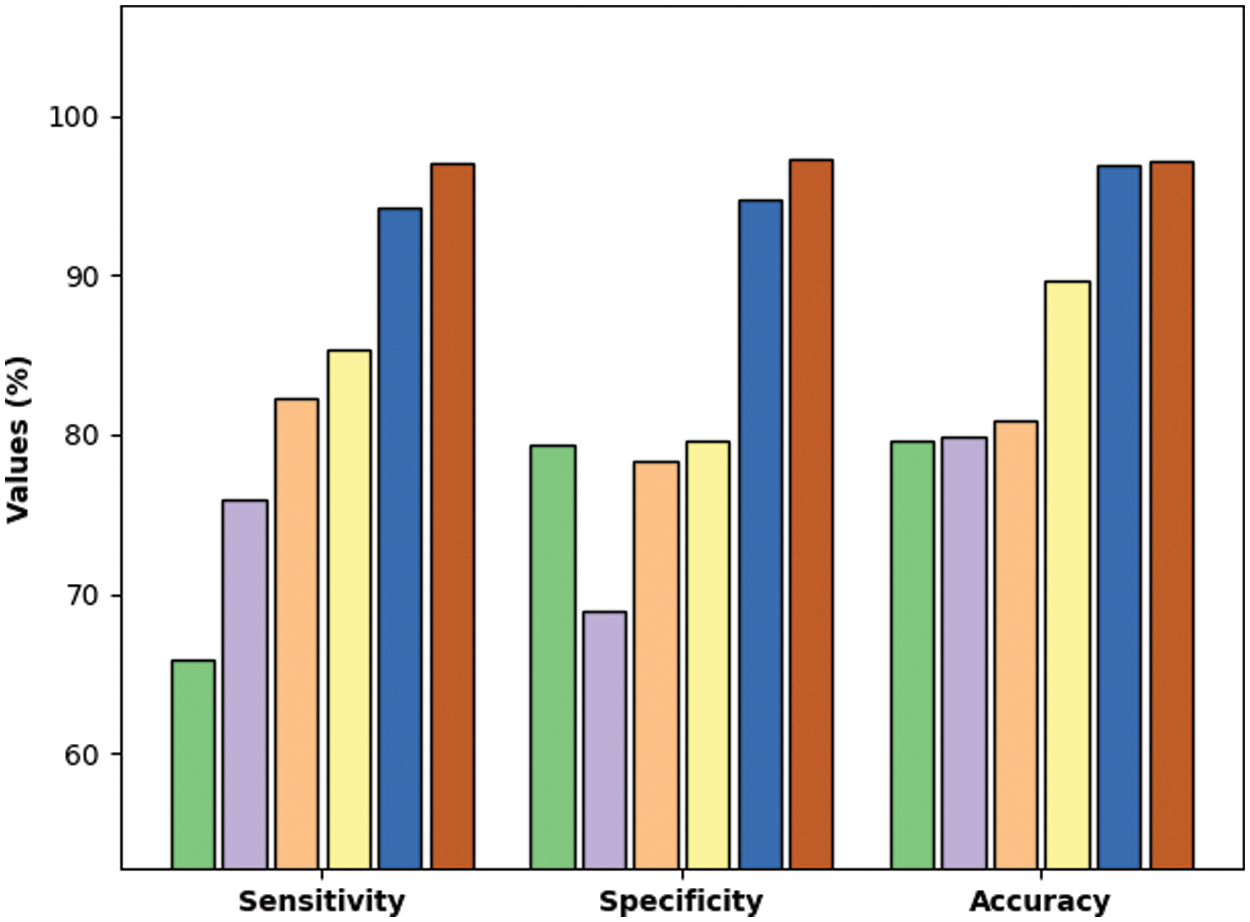
Figure 11: Comparative analysis of QBWO-MLDSS technique with existing approaches
Finally, the fitness value analysis of the QBWO-MLDSS model is performed with other methods in Fig. 12. The results show that the HS model has poor results with a higher fitness value. At the same time, the AHSO algorithm has depicted slightly enhanced outcomes, whereas the GA attains even reduced fitness values. However, the QBWO-MLDSS model has surpassed the other methods with the maximum fitness values under several iterations. The tables and figures mentioned above ensure that the QBWO-MLDSS model can accomplish maximum OC classification performance.
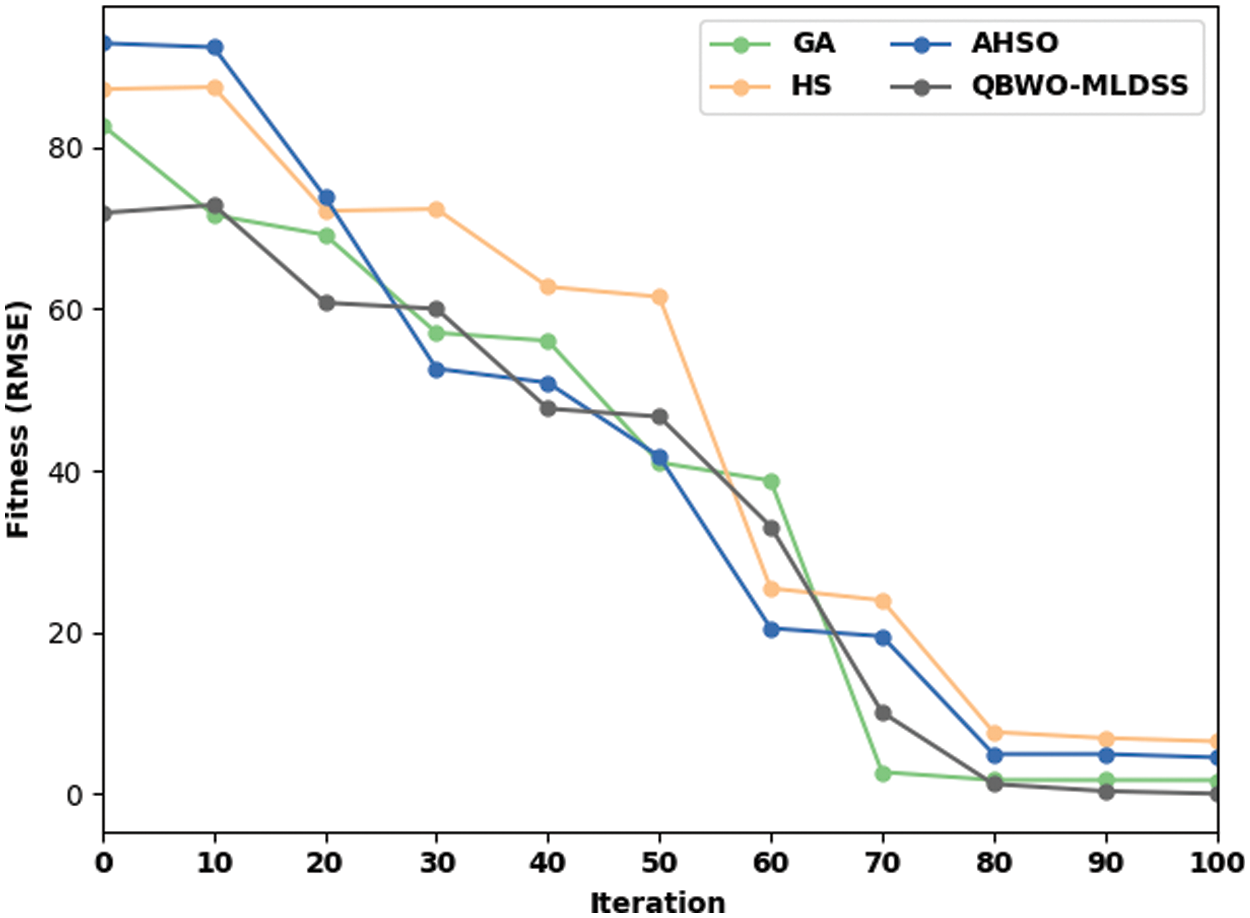
Figure 12: Fitness value analysis of QBWO-MLDSS model
This study has developed a new QBWO-MLDSS technique for OC detection and classification in the smart healthcare environment. The proposed QBWO-MLDSS model encompasses Z-score normalization, QBWO based feature extraction, ELM-based classification, and SOS-based parameter tuning. The utilization of the SOS algorithm assists adequately in choosing the parameter values of the ELM model. The experimental result analysis of the QBWO-MLDSS model is performed using a benchmark dataset, and the comparative results reported the enhanced outcomes of the QBWO-MLDSS model over the recent approaches. Therefore, the QBWO-MLDSS technique can detect and categorize the OC rapidly and accurately. In the future, the proposed QBWO-MLDSS model can be extended to the design of feature reduction and outlier detection approaches to improvise the OC classification performance.
Funding Statement: The authors received no specific funding for this study.
Conflicts of Interest: The authors declare that they have no conflicts of interest to report regarding the present study.
1. M. W. L. Moreira, J. J. P. C. Rodrigues, V. Korotaev, J. Al-Muhtadi and N. Kumar, “A comprehensive review on smart decision support systems for health care,” IEEE Systems Journal, vol. 13, no. 3, pp. 3536–3545, 2019. [Google Scholar]
2. E. S. Kumar and P. S. Jayadev, “Deep learning for clinical decision support systems: A review from the panorama of smart healthcare,” Deep Learning Techniques for Biomedical and Health Informatics, Studies in Big Data Book Series, vol. 68, pp. 79–99, 2020. [Google Scholar]
3. W. Sun, G. Z. Dai, X. R. Zhang, X. Z. He and X. Chen, “TBE-Net: A three-branch embedding network with part-aware ability and feature complementary learning for vehicle re-identification,” IEEE Transactions on Intelligent Transportation Systems, pp. 1–13, 2021. [Google Scholar]
4. W. Sun, L. Dai, X. R. Zhang, P. S. Chang and X. Z. He, “RSOD: Real-time small object detection algorithm in UAV-based traffic monitoring,” Applied Intelligence, vol. 92, no. 6, pp. 1–16, 2021. [Google Scholar]
5. C. A. Kontovas, “The green ship routing and scheduling problem (GSRSPA conceptual approach,” Transportation Research Part D: Transport and Environment, vol. 31, no. 3, pp. 61–69, 2014. [Google Scholar]
6. S. Ganguly, “Multi-objective distributed generation penetration planning with load model using particle SWARM optimization,” Decision Making: Applications in Management and Engineering, vol. 3, no. 1, pp. 30--42, 2020. [Google Scholar]
7. H. Engqvist, T. Z. Parris, J. Biermann, E. W. Rönnerman, P. Larsson et al., “Integrative genomics approach identifies molecular features associated with early-stage ovarian carcinoma histotypes,” Scientific Reports, vol. 10, no. 1, pp. 1–13, 2020. [Google Scholar]
8. M. Akazawa and K. Hashimoto, “Artificial intelligence in ovarian cancer diagnosis,” Anticancer Research, vol. 40, no. 8, pp. 4795–4800, 2020. [Google Scholar]
9. R. F. Mansour, J. Escorcia-Gutierrez, M. Gamarra, V. García, D. Gupta et al., “Artificial intelligence with big data analytics-based brain intracranial hemorrhage e-diagnosis using CT images,” Neural Computing and Applications, vol. 11, no. 1, pp. 1–13, 2021. [Google Scholar]
10. K. Muthumayil, S. Manikandan, K. Srinivasan, J. Escorcia-Gutierrez, M. Gamarra et al., “Diagnosis of leukemia disease based on enhanced virtual neural network, Computers, Materials & Continua, vol. 69, no. 2, pp. 2031–2044, 2021. [Google Scholar]
11. J. Escorcia-Gutierrez, J. Torrents-Barrena, M. Gamarra, N. Madera, P. Romero-Aroca et al., “A feature selection strategy to optimize retinal vasculature segmentation,” Computers, Materials & Continua, vol. 70, no. 2, pp. 2971–2989, 2021. [Google Scholar]
12. J. Escorcia-Gutierrez, R. F. Mansour, K. Beleño, J. Jiménez-Cabas, M. Pérez et al., “Automated deep learning empowered breast cancer diagnosis using biomedical mammogram images,” Computers, Materials & Continua, vol. 71, no. 2, pp. 4221–4235, 2022. [Google Scholar]
13. L. Zhang, J. Huang and L. Liu, “Improved deep learning network based in combination with cost-sensitive learning for early detection of ovarian cancer in color ultrasound detecting system,” Journal of Medical Systems, vol. 43, no. 8, pp. 1–9, 2019. [Google Scholar]
14. M. Wu, C. Yan, H. Liu and Q. Liu, “Automatic classification of ovarian cancer types from cytological images using deep convolutional neural networks,” Bioscience Reports, vol. 38, no. 3, pp. 1–11, 2018. [Google Scholar]
15. A. Consiglio, G. Casalino, G. Castellano, G. Grillo, E. Perlino et al., “Explaining ovarian cancer gene expression profiles with fuzzy rules and genetic algorithms,” Electronics, vol. 10, no. 4, pp. 1–13, 2021. [Google Scholar]
16. J. H. Bae, M. Kim, J. S. Lim and Z. W. Geem, “Feature selection for colon cancer detection using k-means clustering and modified harmony search algorithm,” Mathematics, vol. 9, no. 5, pp. 1–14, 2021. [Google Scholar]
17. S. Sujamol, E. R. Vimina and U. Krishnakumar, “Improving recurrence prediction accuracy of ovarian cancer using multi-phase feature selection methodology,” Applied Artificial Intelligence, vol. 35, no. 3, pp. 206–226, 2021. [Google Scholar]
18. E. S. Paik, J. W. Lee, J. Y. Park, J. H. Kim, M. Kim et al., “Prediction of survival outcomes in patients with epithelial ovarian cancer using machine learning methods,” Journal of Gynecologic Oncology, vol. 30, no. 4, pp. 1–13, 2019. [Google Scholar]
19. A. Arfiani and Z. Rustam, “Ovarian cancer data classification using bagging and random forest,” AIP Conference Proceedings, vol. 2168, no. 1, pp. 1–6, 2019. [Google Scholar]
20. M. Elhoseny, G. B. Bian, S. K. Lakshmanaprabu, K. Shankar, A. K. Singh et al., “Effective features to classify ovarian cancer data in internet of medical things,” Computer Networks, vol. 159, no. 17, pp. 147–156, 2019. [Google Scholar]
21. Y. E. Manzalawy, T. Y. Hsieh, M. Shivakumar, D. Kim and V. Honavar, “Min-redundancy and max-relevance multi-view feature selection for predicting ovarian cancer survival using multi-omics data,” BMC Medical Genomics, vol. 11, no. S3, pp. 20–31, 2018. [Google Scholar]
22. U. Ahmed, R. Mumtaz, H. Anwar, A. A. Shah, R. Irfan et al., “Efficient water quality prediction using supervised machine learning,” Water, vol. 11, no. 11, pp. 1–14, 2019. [Google Scholar]
23. V. Hayyolalam and A. A. P. Kazem, “Black widow optimization algorithm: A novel meta-heuristic approach for solving engineering optimization problems,” Engineering Applications of Artificial Intelligence, vol. 87, no. 1, pp. 1–28, 2020. [Google Scholar]
24. L. T. Brady, C. L. Baldwin, A. Bapat, Y. Kharkov and A. V. Gorshkov, “Optimal protocols in quantum annealing and quantum approximate optimization algorithm problems,” Physical Review Letters, vol. 126, no. 7, pp. 1–11, 2021. [Google Scholar]
25. V. B. Semwal, N. Gaud and G. C. Nandi, “Human gait state prediction using cellular automata and classification using ELM,” in Machine Intelligence and Signal Analysis, Advances in Intelligent Systems and Computing Book Series, vol. 748, Singapore: Springer, pp. 135–145, 2019. [Google Scholar]
26. A. E. Ezugwu and D. Prayogo, “Symbiotic organisms search algorithm: Theory, recent advances and applications,” Expert Systems with Applications, vol. 119, no. 6, pp. 184–209, 2019. [Google Scholar]
 | This work is licensed under a Creative Commons Attribution 4.0 International License, which permits unrestricted use, distribution, and reproduction in any medium, provided the original work is properly cited. |