DOI:10.32604/cmc.2022.029039
| Computers, Materials & Continua DOI:10.32604/cmc.2022.029039 | |
| Article |
LBP–Bilateral Based Feature Fusion for Breast Cancer Diagnosis
1Division of Radiology, Department of Medicine, Medical College, Najran University, Najran 61441, Saudi Arabia
2Department of Computer Science and Information Technology, Ibadat International University, Islamabad, 44000, Pakistan
3Department of Radiology, College of Medicine, Qassim University, Buraidah 52571, Saudi Arabia
4Department of Radiology, King Fahad Specialist Hospital, Buraydah 52571, Saudi Arabia
5Electrical Engineering Department, College of Engineering, Najran University, Najran 61441, Saudi Arabia
6Radiology Department, Human Medicine College, Zagazig University, Zagazig 44631, Egypt
7Department of Surgery, College of Medicine, Najran University, Najran 61441, Saudi Arabia
8Radiological Sciences Department, College of Applied Medical Sciences, Najran University, Najran 61441, Saudi Arabia
*Corresponding Author: Hassan A. Alshamrani. Email: hamalshamrani@nu.edu.sa
Received: 23 February 2022; Accepted: 06 May 2022
Abstract: Since reporting cases of breast cancer are on the rise all over the world. Especially in regions such as Pakistan, Saudi Arabia, and the United States. Efficient methods for the early detection and diagnosis of breast cancer are needed. The usual diagnosis procedures followed by physicians has been updated with modern diagnostic approaches that include computer-aided support for better accuracy. Machine learning based practices has increased the accuracy and efficiency of medical diagnosis, which has helped save lives of many patients. There is much research in the field of medical imaging diagnostics that can be applied to the variety of data such as magnetic resonance images (MRIs), mammograms, X-rays, ultrasounds, and histopathological images, but magnetic resonance (MR) and mammogram imaging have proved to present the promising results. The proposed paper has presented the results of classification algorithms over Breast Cancer (BC) mammograms from a novel dataset taken from hospitals in the Qassim health cluster of Saudi Arabia. This paper has developed a novel approach called the novel spectral extraction algorithm (NSEA) that uses feature extraction and fusion by using local binary pattern (LBP) and bilateral algorithms, as well as a support vector machine (SVM) as a classifier. The NSEA with the SVM classifier demonstrated a promising accuracy of 94% and an elapsed time of 0.68 milliseconds, which were significantly better results than those of comparative experiments from classifiers named Naïve Bayes, logistic regression, K-Nearest Neighbor (KNN), Gaussian Discriminant Analysis (GDA), AdaBoost and Extreme Learning Machine (ELM). ELM produced the comparative accuracy of 94% however has a lower elapsed time of 1.35 as compared to SVM. Adaboost has produced a fairly well accuracy of 82%, KNN has a low accuracy of 66%. However Logistic Regression, GDA and Naïve Bayes have produced the lowest accuracies of 47%, 43% and 42%.
Keywords: Artificial intelligence; machine learning; breast cancer; mammograms; supervised learning; classification; feature fusion
Breast cancer (BC) is the most common type of cancer in women. In a recently published study from Saudi Arabia, it was reported that breast cancer cases increased by 18%, from 783 cases in 2004 to 2240 cases in 2016 [1]; 60% of the cases belonged to women older than 40 years. The reported data contained statistics from different cities in Saudi Arabia such as Makkah, Najran, Qassim and Hail [1]. According to another study, AFHSR hospital in Saudi Arabia witnessed the highest BC rate in 2017 [2]. A study conducted with surveys in Pakistan cities such as Karachi reported that the BC incidence rate would probably increase from 23.1% in 2020 to 60.7% by 2025 [3]. These studies showed a drastic increase in BC incidence rate and emphasized the fact proper measures and screening should be adopted for early detection to ensure the safety of patients. The statistics of breast cancer incidents and mortality rate among young women worldwide are indicated in a pie chart in Fig. 1 [4].
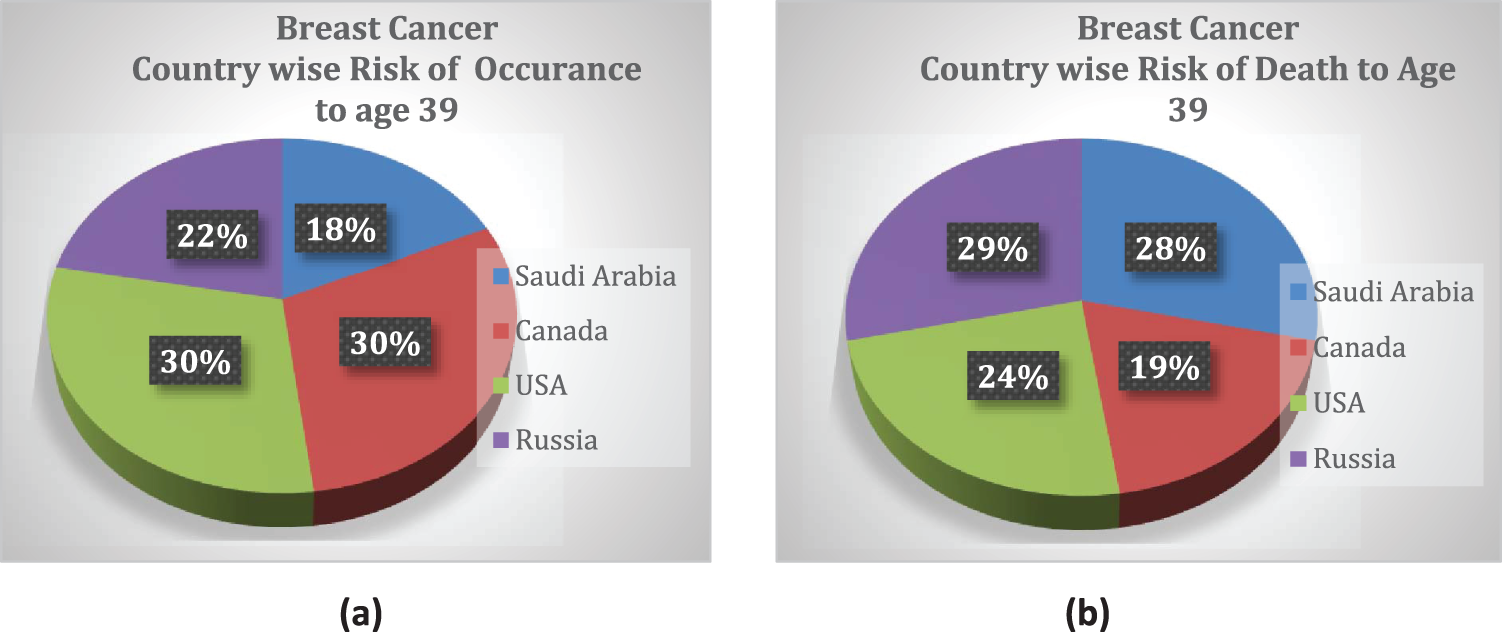
Figure 1: Country-wise cumulative risk of (a) occurrence and (b) death percentage up to age 39 with a population size >10 million
Asia (a massively populated region) was reported to have the highest mortality rate for breast cancer, which was largely attributed to age [5]. The authors of a recent study in Saudi Arabia reported 5411 cases of patient death due to fatal illness; 13% of these deaths were linked to the cases of breast cancer, and 1.69% of those deaths were attributed to men. Although the prevalence of BC was reportedly higher in women than men, 72% of men are likely to die if they suffer from breast cancer [6]. The reported BC mortality (BCM) rates highlight the fact that breast cancer is a threat to our current society that requires special health-intensive programs.
Therefore, breast screening is required on an annual basis for early diagnosis and effective treatment. The technological era has made it possible by revolutionizing advancements in medical diagnosis [7]. Traditionally, doctors and physicians use manual inspections, mammograms, ultrasounds, guided biopsy, and magnetic resonance images for diagnosis. However Computer-aided support is starting to be used [8]. Current methods include machine learning techniques, convolutional neural networks (CNNs), and deep learning methodologies.
Most machine learning (ML) techniques are used to differentiate diseased from non-diseased image scans through a process of feature extraction, feature selection or reduction, and classification [9].
This paper has utilized a different approach for classification and differentiation between malignant and benign breast scans. A dataset containing 800 mammograms was used, and local binary pattern (LBP) and bilateral approaches were applied to the images. Later, it was decided to fuse the extracted features, thus creating a novel spectral extraction algorithm (NSEA). This paper has used all five categories of the Breast Imaging Reporting and Data System (BI-RADS): BI-RADS1, BI-RADS2, BI-RADS3, BI-RADS4 and BI-RADS5. These BI-RADS were divided into two binary classes: benign and malignant. BI-RADS1 and BI-RADS2 were combined into the benign class for annual follow-up, and BI-RADS3, BI-RADS4, and BI-RADS5 were combined into the malignant class, despite the fact that BI-RADS3 has a high probability of benign, therefore their mammograms were carefully collected with prevalent malignant disease pattern. The resulting feature dimensions were reduced. The SVM classifier was applied over a reduced feature set to attain an accuracy score. The contributions of this paper are as follows:
1. This paper developed a novel approach of feature extraction and fusion to attain better accuracy as individual accuracies of LBP and bilateral algorithms were not sufficient. Hence LBP-Bilateral Fusion is performed, forming into the novel spectral extraction algorithm.
2. This paper has used a carefully collected novel dataset containing mammograms of breast cancer patients from hospitals in the Qassim health cluster of Saudi Arabia.
3. Other benchmark classification algorithms were utilized for further comparative performance evaluation.
The rest of the paper is organized as follows. Section 2 is a comprehensive overview of recent work conducted in this field. Section 3 is a discussion of the details of the dataset, image resolution and methodology used in our study, and Section 4 is a discussion of the results and conclusions of our study.
In this section related research work done on machine learning techniques for breast cancer detection that includes discussion of the used techniques, and their accuracies are presented.
For breast cancer detection, Ha et al. employed an improved meta-heuristic algorithm namely balanced deer hunting optimization algorithm (BDHOA). For novelty they used a pre-processed dataset of Magnetic resonance imaging (MRI) and two feature extraction methods, Haralick texture feature and Local binary pattern (LBP) for improved results. To optimize the CNN, a balanced deer hunting optimization algorithm was used. The new hybrid technique demonstrated an accuracy of 98.89% for breast cancer detection. They aimed to apply proposed technique on a different dataset and on other medical imaging tasks. However, the adopted approach inherently created a computational complexity which yielded in a greater accuracy value [10].
Amit et al. proposed a technique for comparing two deep learning approaches for lesion classification. The selected breast scans contained 891 malignant and 365 benign images. Two classification approaches used to classify benign (BI-RADS 2) and malignant (BI-RADS 5) images. Classifier CNN and then support vector machine (SVM) demonstrated accuracies of 91% and 81%, respectively, however data augmentation technique was used to increase the dataset which is not an intelligent approach in machine learning and testing [11].
Antropova et al. used maximum high-intensity projection (MIP) images to improve breast cancer detection. The images were taken at three different angles that ensures maximum projection and presented to a pretrained CNN. Pre-trained CNN then applied linear support vector machines for significantly improved feature extraction. The accuracy of the adopted approach was found to be 88% for MIP images. However, image set was increased via data augmentation which again is not considered a source of reliable diagnosis [12].
Antropova et al. proposed a fusion approach that combines the traditional segmentation-based feature extraction and CNN based feature extraction on dynamic contrast-enhanced (DCE) MRI dataset. The novelty lies in first applying both techniques separately and then make a fusion to compare their resulting accuracies. The resulting approach covers the short comings of both techniques and leads to an accuracy of 91% when using classifier linear discriminant analysis (LDA). However, for handling high dimensional data SVM is more suited as compared to LDA therefore this research leaves a gap to fill for applying it with SVM [13].
Antropova et al. performed breast cancer diagnosis analysis on three different image modalities namely DCE-MRI, mammograms and ultrasound. This fusion approach, consisting of SVM and CNN. SVM provided agreeable results with slightly different accuracies with elimination of preprocessing idea due to the use of multilayer network. However, they have not used higher level layers due to moderate sized dataset. Also, the initial results of fine tuning were underperformed their feature extraction methods which can be improved with proper circumstances [14].
Elshafey et al. adopted a hybrid approach that used a pre-trained Xception model, extracted features using the long short-term memory (LSTM) model. Then employed SVM classifier for breast cancer classification. The approach achieved an accuracy of 94%. However, the authors have applied the technique on massive dataset which requires high end machine for computations. Also, the proposed approach have used data augmentation which is not considered reliable as per data being artificially increased for diagnostic purpose [15].
Hu et al. has used deep transfer learning computer-aided diagnosis (CADx) methodology to diagnose breast cancer, by employing multi-parametric magnetic resonance imaging (mpMRI) as compared to a simple CADx alone. The authors have claimed that their mpMRI based approach yields better results for distinguishing between benign and malignant lesions. The accuracy for DCE images were found to be 85%. However, there are some limitations to this approach. The authors did not include high dimensional images because of the increased complexity. Moreover, the image registration method also required more optimization [16].
In a further study, Hu et al. employed a fuzzy C-means algorithm for the segmentation of lesions from suspected breast cancer scans, then applied radiomics feature extraction. Finally conducted two-classifier feature fusion to consider multi-parametric aspects of radiomics. They used a support vector machine classifier. The accuracy for this approach was 87%. The authors also applied results on single parametric classifiers which yielded less significant results as compared to two multi-parametric classifiers. However, the proposed approach does not perform well for three or more image subsets [17].
Hu et al. employed 4-Dimensional MRI image by taking maximum intensity projection (MIP) at two levels i.e., image level and feature level within an CNN using SVM classifier. The results are promising by showing an accuracy of 91% at image level and 93% at feature level. However, the dataset they used is not generalized and does not include clinically sound data [18].
Antropova et al. employed the same CNN- and SVM-based where they employed a pre-trained VGnet for feature extraction and then employed the Long-Short Term Memory Network (LSTM), which is recurrent network, for classification of benign and malignant tumors. They have promised better results as compared to single feature extraction using SVM classifier. The novelty of the proposed idea lies in classification using temporal sequences of the MRI scans for improved results and yielded an accuracy of 85% [19].
Siddiqui et al. employed a hierarchical deep learning approach based on cloud- and fusion-technology for breast cancer prediction namely cloud based fusion breast cancer prediction (CF-BCP). The proposed CF–BCP methodology used two models: one used a CNN to perform prediction for an image dataset comprising multimodal images such as mammograms, MRI, positron emission tomography (PET) scans, and computed tomography (CT) scans, while other a deep extreme learning machine (DELM) model to the electronic medical record (EMR) dataset. The resulting data were fused based on decision-based fusion for better and intelligent breast cancer prediction resulting in accuracy of 97.97%. However, the large number of images and different modalities increased the overall computational complexity [20].
Yurttakal et al. employed a stacking ensemble approach based on deep learning and gradient boosting to classify breast cancer lesions. They used pre-processing, segmentation, and feature extraction to distinguish between malignant and benign tumors. Their proposed technique resulted in an accuracy of 94.87%. The approach used handcrafted radiomics for image processing rather than DL radiomics which are considered more reliable [21].
Zheng et al. used an efficient AdaBoost algorithm (EABA) with a traditional convolutional neural network, and they applied this technique to diverse imaging modalities. They have used deep neural network layers such as LSTM and Max-pooling resulting in a high accuracy of 97.2%. They employed a massive dataset which increases the computational complexity and usage of high-end machines [22].
Feature fusion techniques have been used in all dimensions and fields of medical imaging. Another important filter LBP is also used in the classification of medical imaging in both breast and brain tumor classification. For instance, the authors of [23–25] applied feature fusion and LBP filters to improve their algorithms’ performance. So far, however, no researchers have used LBP and bilateral filter fusion together.
A lot of progress is being done in the field of image processing whether it is in classification, feature fusion or segmentation. In [26] authors have performed a comparative analysis of images from multiple modalities and diverse fields. Heena et al. performed another comparative analysis of fractional order-based methods in image processing related fields such as image enhancements, image de-noising, image segmentation, image compression and image restoration [27]. The image processing in not just limited to field of diagnosis such as the classification of heart abnormalities done in [28] but it has much broader spectrum such as implementing an efficient tumor coding techniques so that research work can be more focused on code logic and quality rather than on repeated tasks [29] and can be used for deformation simulation for soft tissue grasping in virtual surgery [30].
Tab. 1 summarizes the contributions of different studies on the classification of breast cancer tumors. This table demonstrates that many studies have used feature extraction and feature fusion while developing their algorithms. However, no study has used LBP–bilateral feature fusion.

In this section, this paper has explored the methodology, dataset, and mechanisms of different ML.
Classifiers for the classification of breast cancer tumors. The basic work flow of the current methodology is shown in Fig. 2. State-of-the-art algorithms, LPB and bilateral filters, were fused together, thus unifying their contrasting attributes and constituting an NSEA. The motivation behind Fusion is to attain better accuracy as LBP and Bilateral individual accuracies were not sufficient as shown in Tabs. 5 and 6. This has applied selected ML filters to a dataset of 800 mammograms from approximately 800 different patients for feature extraction. Following extraction, principal component analysis (PCA) was used to reduce dimensions. Our NSEA comprised a fusion matrix to which SVM classifier was applied to label data into malignant and benign classes.
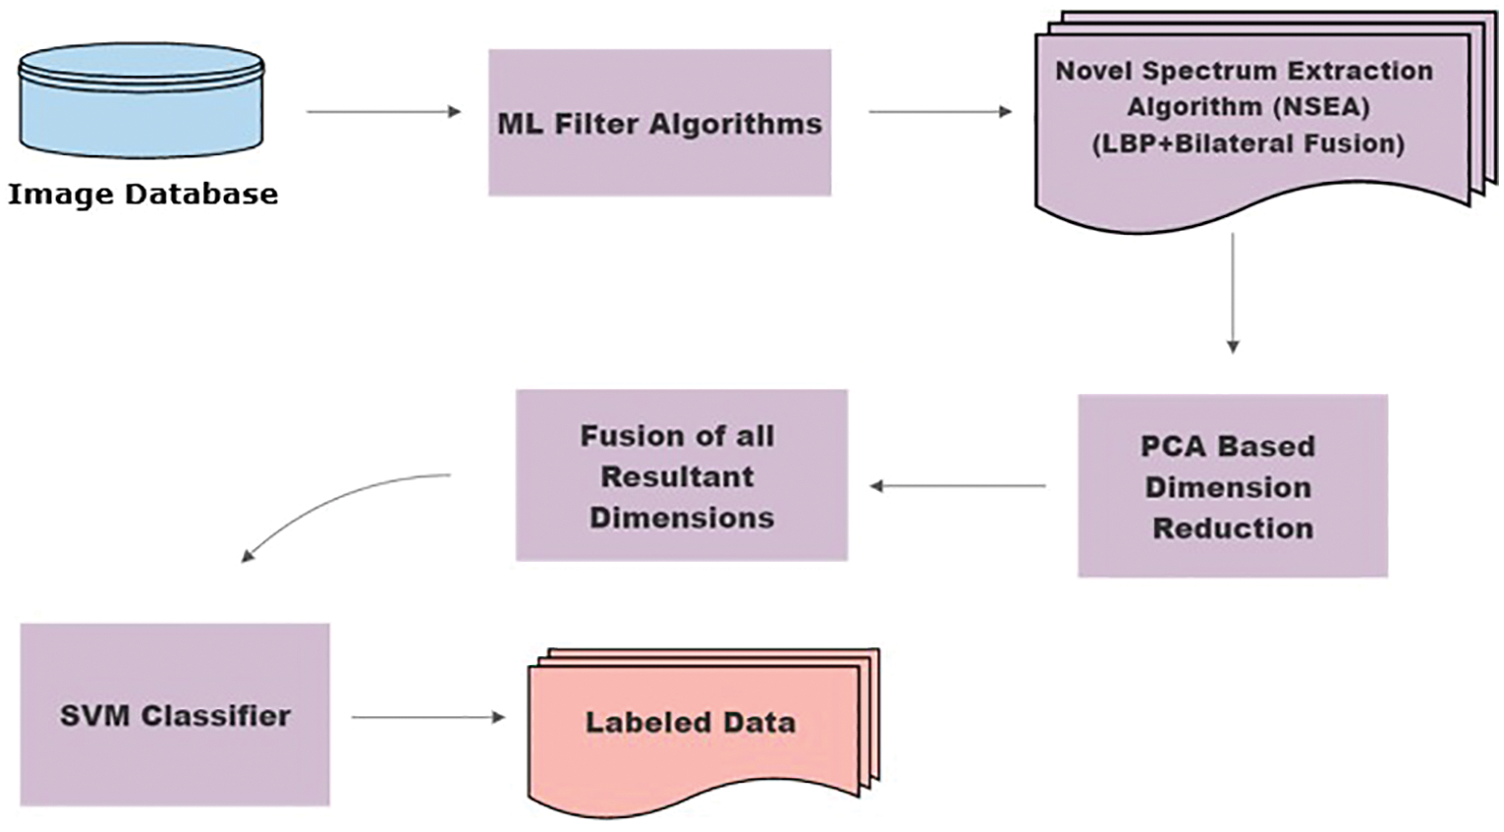
Figure 2: Methodology flow chart
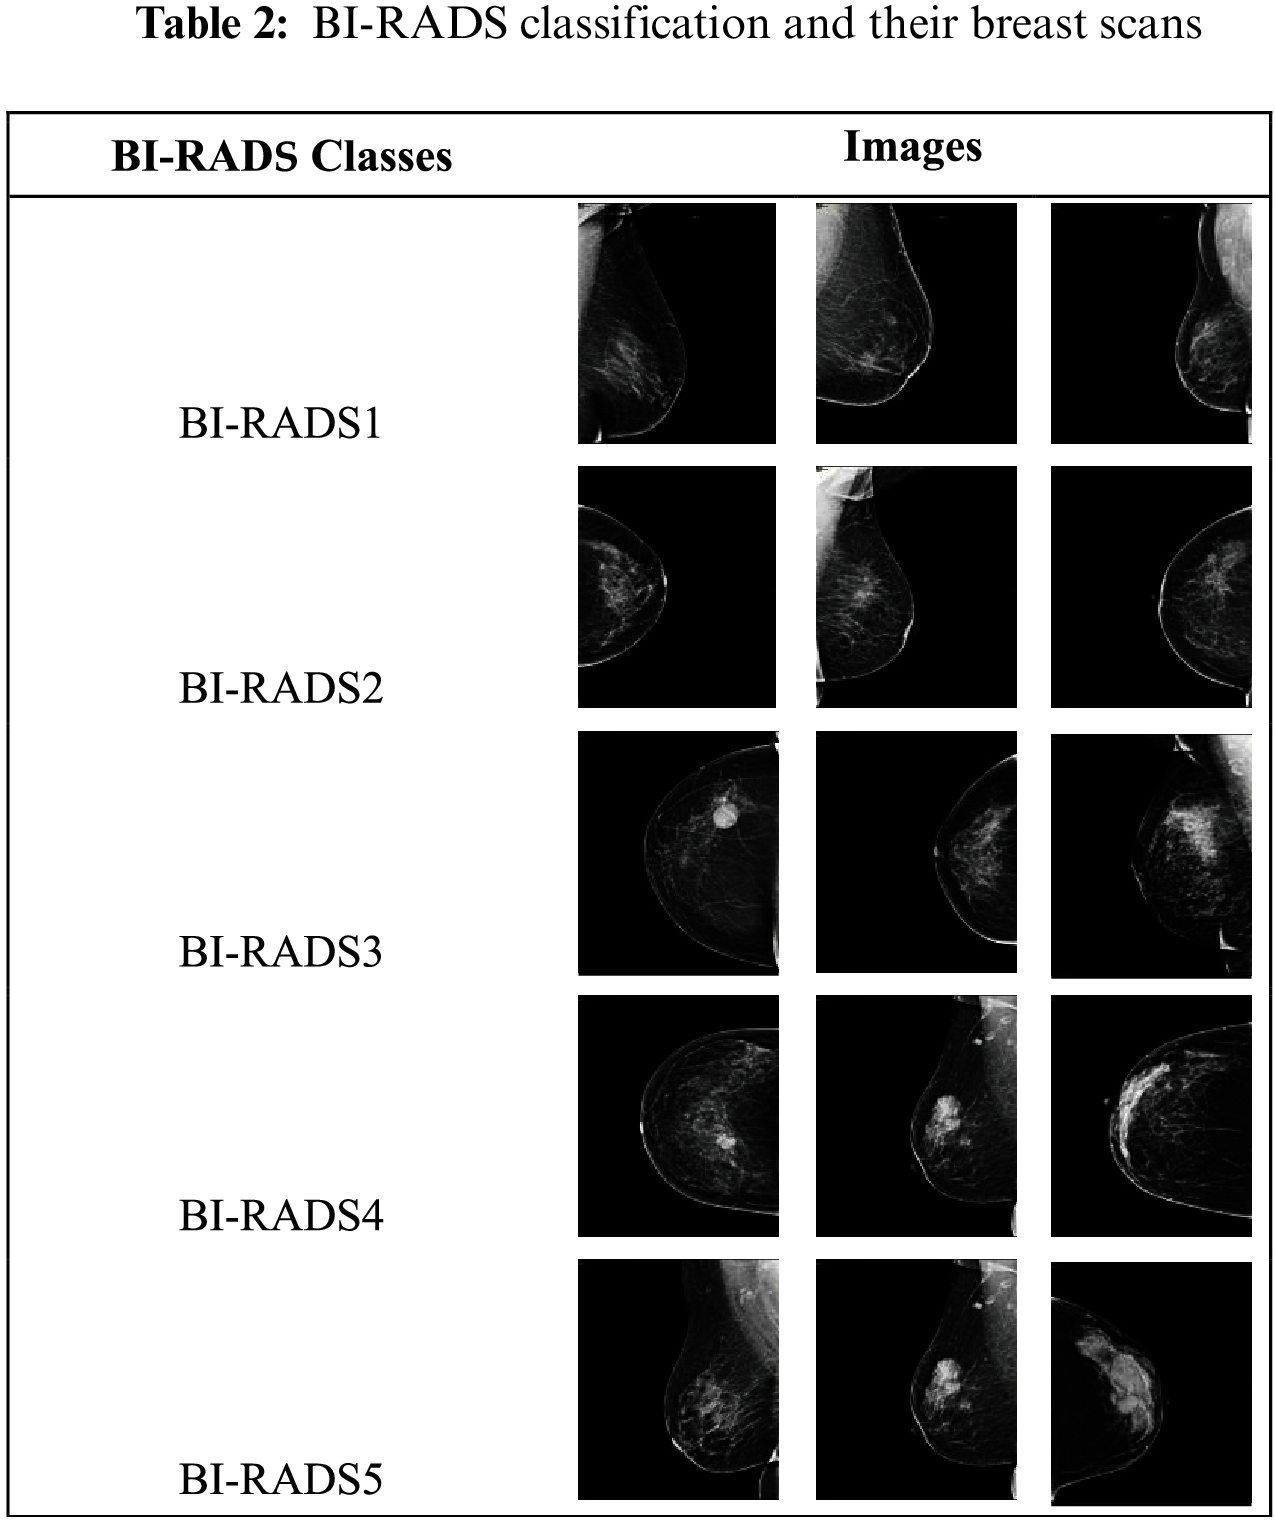
The dataset used in this research consisted of 800 mammogram breast cancer images of approximately 800 patients from a hospital in Saudi Arabia. In a proposed technique all 5 categories of breast cancer is used i.e., BI-RADS1, BI-RADS2, BI-RADS3, BI-RADS4 and BI-RADS5. BI-RADS1 and BI-RADS2 were combined into the benign class, and BI-RADS3 BI-RADS4, and BI-RADS5 were combined into the malignant class. The BI-RADS categories are shown in Tab. 2.
Out of 800 studied mammograms, 600 images (75%) were reserved for training and 200 images (25%) for testing. The 600 training images and 200 testing images were equally divided according to the binary malignant and benign classes, i.e., 300 each and 100 each, respectively. Fig. 3 illustrates this distribution. The breast cancer dataset was obtained from the hospitals in the Qassim Health Cluster of Saudi Arabia. The dataset is not open source.

Figure 3: Distribution of training and testing classes
Tab. 1 shows that the maximum image dataset range was from 800 to 900 in the recent literature. For instance, the authors of [6,10,13,15,17] achieved state-of-the art accuracies with 800+ images, though their diagnostic performance was highly dependent on high-end workstations. Therefore, the proposed methodology relied on the quality rather than quantity of data, which may result in decreased accuracy levels and require high-end systems to cater to the load of thousands of images.
3.2 Machine Learning Classification
In this section, paper has explain the application and processing of multiple machine learning classifiers on the available dataset. Fig. 4 shows the process in steps, indicating how many classifiers are applied and in which order they are used.

Figure 4: Proposed methodology for breast cancer classification
The Proposed methodology includes the application of LBP and bilateral filter to both mammogram classes of Malignant and Benign dataset. The subsequent feature set is then reduced separately using PCA. Among many dimension reduction algorithms, PCA is by far the most effective way of reducing dimensions without losing major details. Thus resulting in a newly enhanced feature vector set.
Then, the separately obtained LBP and bilateral reduced-dimension feature vector set from the application of PCA are then fused together. The reduced dimensions in the LBP–bilateral feature set improve the chances of obtaining results of higher accuracy. This paper has presented that the LBP and bilateral fusion approach along with SVM and ELM classifier among all other classifiers has resulted in a better accuracy of 94%.
3.2.1 Local Binary Pattern (LBP)
A local binary pattern performs a component-wise operation and produces a binary and then greyscale image based on comparisons of each pixel with neighboring pixels. LBP provides a weighted output image. Proposed algorithm took each breast scan from a breast cancer dataset and passed them through the LBP filter.
where:
Proposed technique took the center pixel of each breast scan image y and neighboring pixel x, and we performed piece-wise subtraction, as shown in Eq. (1). Then according to a threshold, 0 s and 1 s were allotted to convert the image into a binary format.
Bilateral filters are a state-of-the-art image-processing technology. They are used to calculate the weighted average before performing the Gaussian smoothing of an image. Bilateral smooth out an image to the point of blurring, though edges are preserved. For image I, to which bilateral smoothing can be performed, pixel y from an image I has been selected, which has a neighboring pixel μ. The complete formula is depicted as Eq. (2).
where
3.2.3 LBP–Bilateral Fusion-Based Novel Spectral Extraction Algorithm (NSEA)
LBP does not blur and smooth out an image; it just produces a coarse image texture. In contrast, a bilateral filter smooth out and preserves the edges of an image. In a proposed scheme it was decided to fuse the LBP and bilateral filters in a way that would bridge up the limitations of both the algorithms to produce enhanced and edgy images with a smooth effect. As shown in Fig. 5, a scheme is formed to concatenate the feature vectors extracted from both the filters and combine them into one file as shown in Eq. (3).
where
NSEA
The novelty and focus of this paper is this approach of fusing both the LBP and bilateral filters, which improved the efficiency of our results to 94%. The detailed mechanisms of the LBP and bilateral fusion methodology, as well as how the resulting labels are generated, are clearly illustrated in Fig. 5 and explained in Algorithm 1. This fusion approach can be understood in the form of a proposed algorithm, in which input image I is N number of images. All raw images

Figure 5: LBP–bilateral fusion: Procedural steps to constitute novel spectral extraction algorithm (NSEA)
Feature vectors from two set of images—one set of all LBP-filtered images

3.2.4 Extreme Learning Machine (ELM)
A single hidden-layer, feedforward, network- and training-based ELM classifier uses the Moore–Penrose generalized inverse for calculating weights. The use of ELM is the fastest way to train and produce classifiers, as confirmed by our results regarding efficiency and performance.
where:
• h is a number of hidden units;
• N is a number of training samples;
• w is a weight vector between the input and hidden layers;
• g is an activation function;
• b is a bias vector;
• x in an input vector.
3.2.5 Support Vector Machine (SVM)
SVM is a known learning algorithm for both supervised classification and regression. SVM draws defined boundaries to classify any new point into a closely associated category. The decision boundary is called a hyperplane, which comprises extreme points called support vectors.
where:
In proposed methodology, the two classes correspond to normal breast scans and breast scans with cancer. As shown in Eqs. (6) and (7), the classes are grouped as +1 or −1 for classes 1 or 2, respectively.
In this section, the paper has discussed the results of our proposed technique and the details of different classifiers. The results achieved using different classifiers are displayed in Tab. 3.
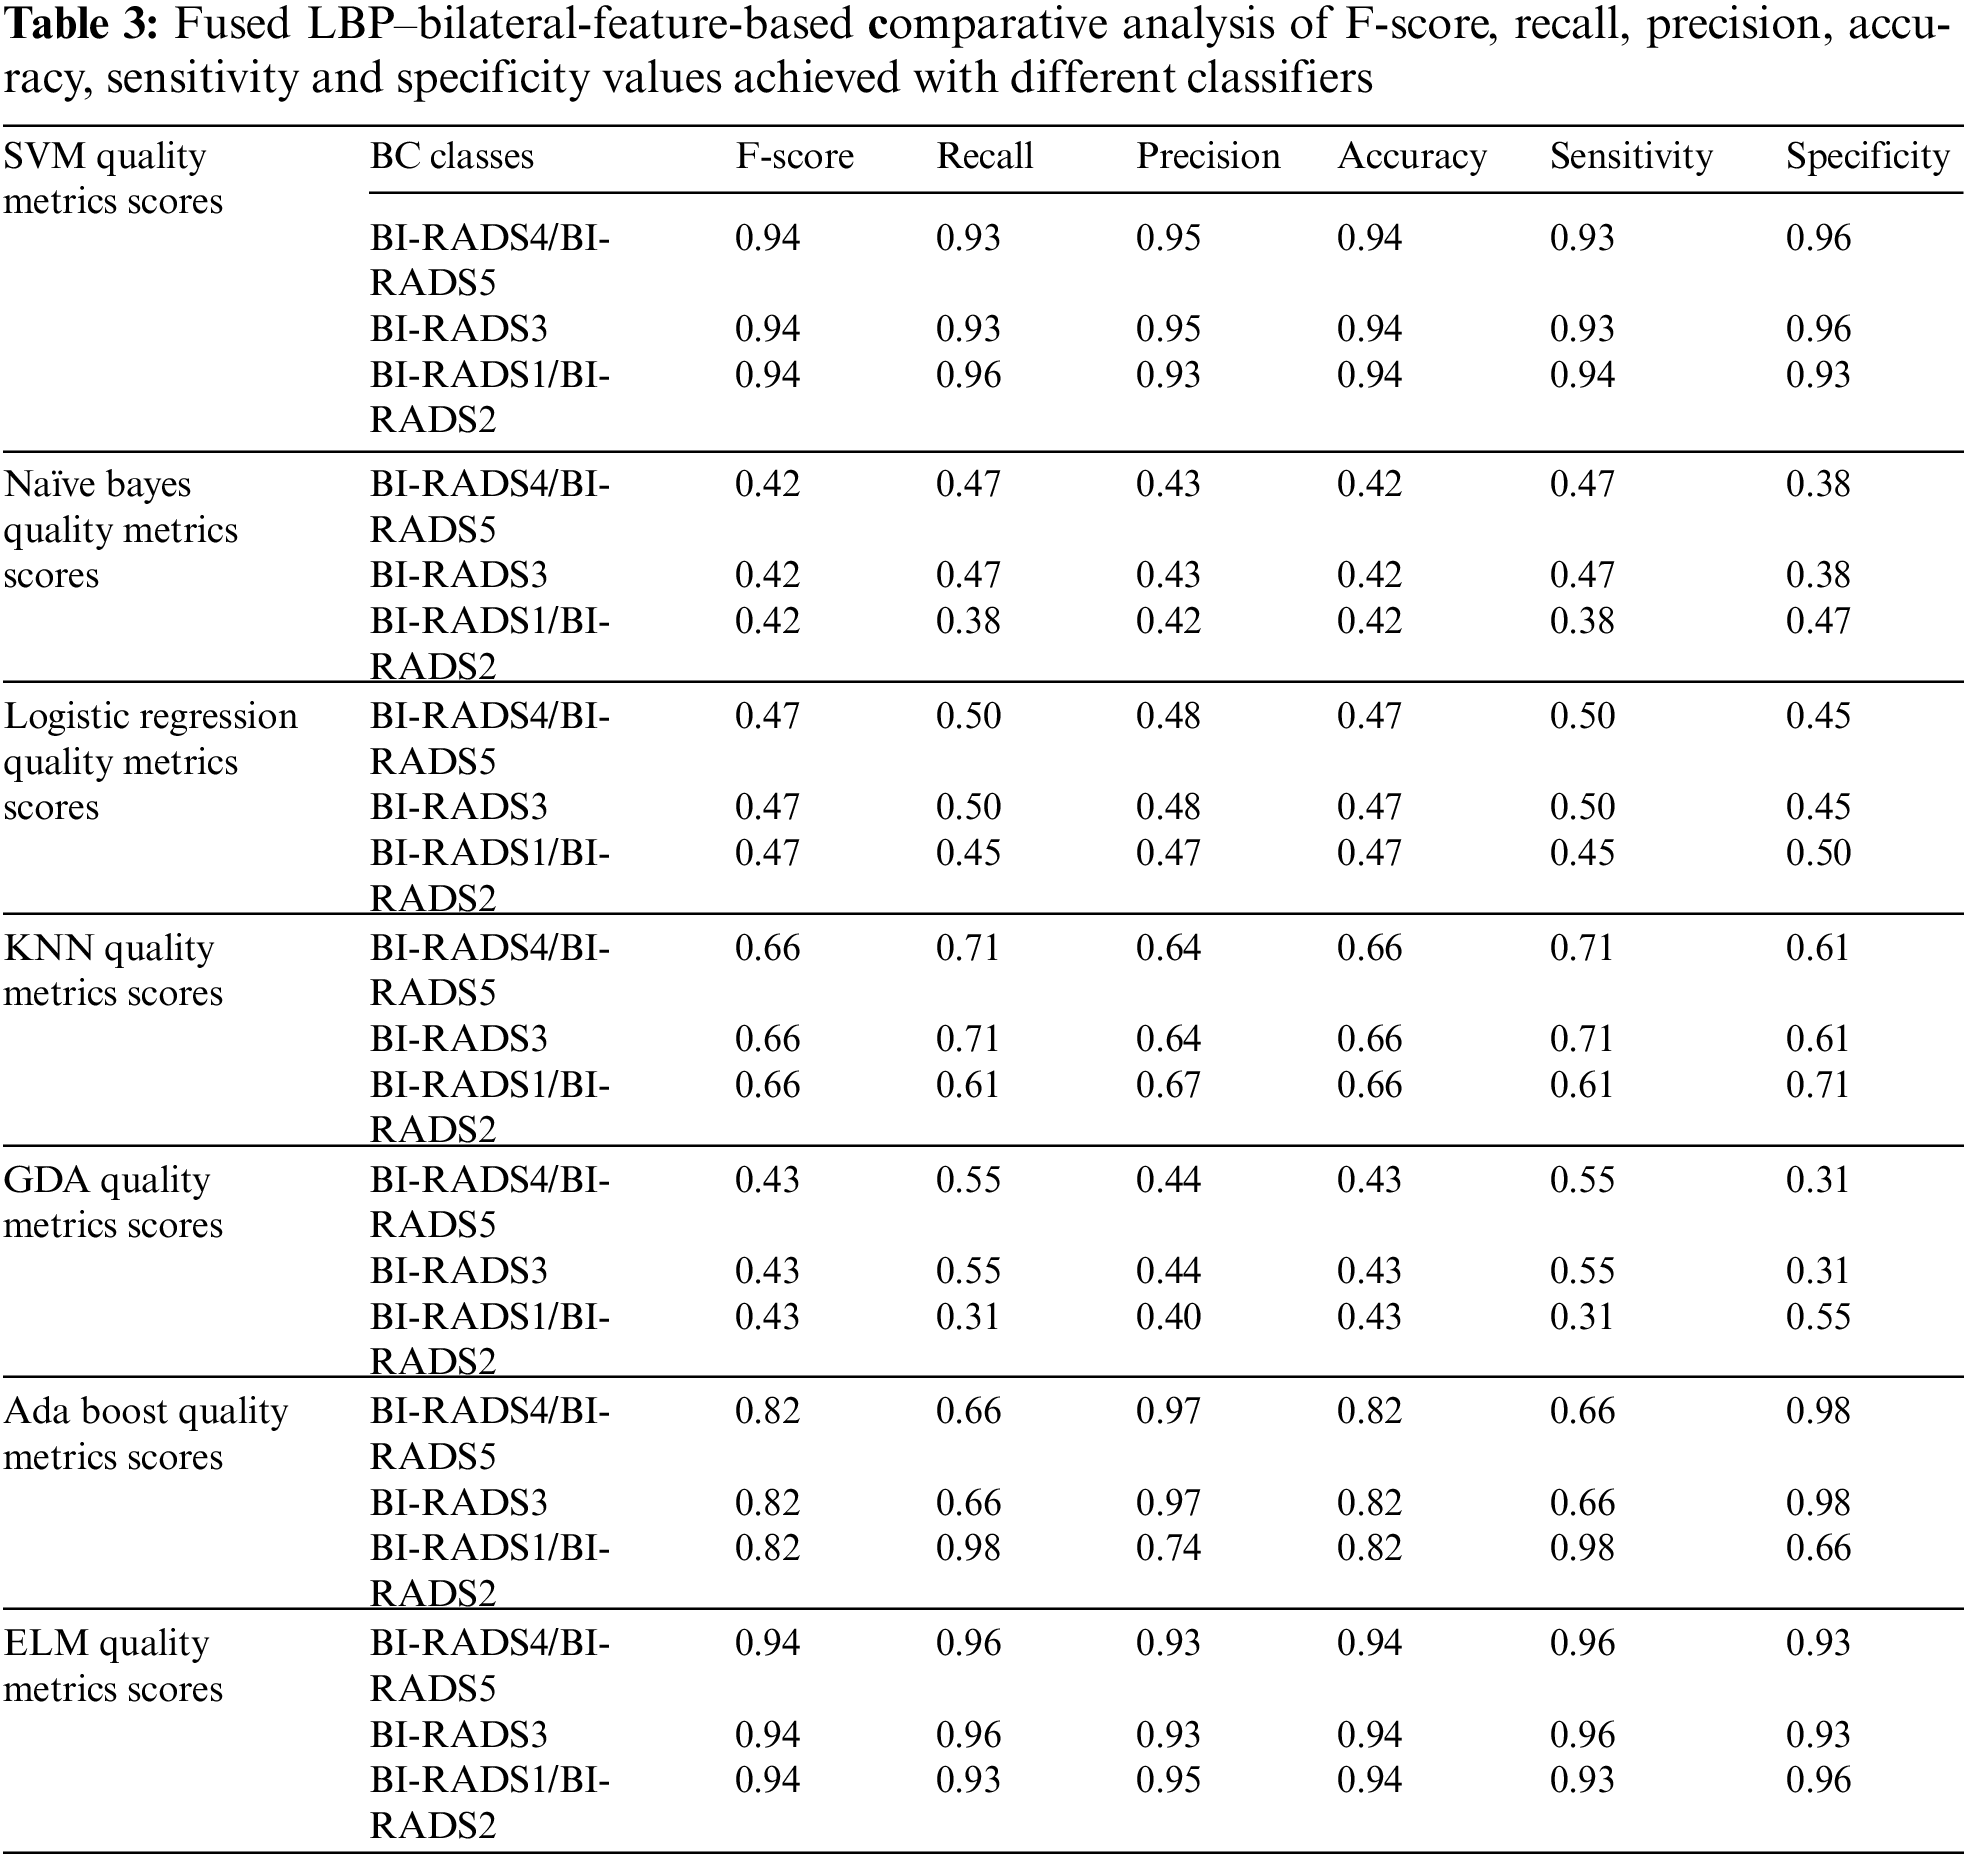
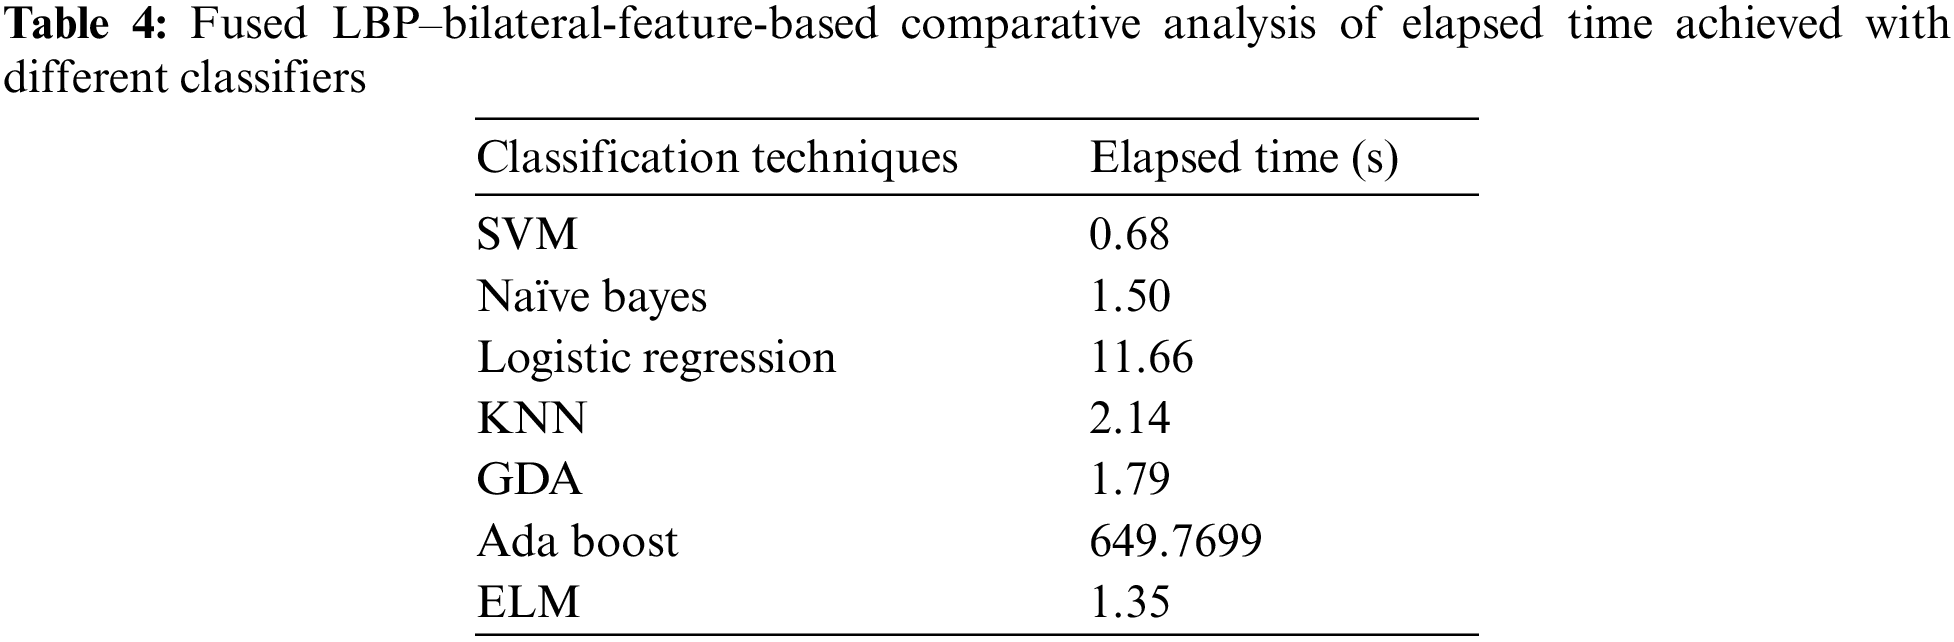
This paper has used SVM, Naïve Bayes, logistic regression, KNN, GDA, AdaBoost, and ELM classifiers for comparative analysis regarding the F-score, recall, precision, accuracy, sensitivity and specificity were the quality measures. Tab. 3 demonstrate that SVM and ELM showed similar accuracies, and the precision, recall, and F-score of both were somewhat similar and better than the rest of the classifiers. Fig. 6 illustrates the accuracies of the compared classifiers. Tab. 4 present the comparative elapse time each classifier takes to train and produce results.

Figure 6: Comparative analysis of the F-score and accuracy of different classifiers
AdaBoost was the second best classifier, with an accuracy of 82%. KNN, Naïve Bayes, logistic regression, and GDA showed the lowest accuracies, with KNN ranked best of these. Ultimately, ELM and SVM proved to be the most efficient and accurate classifiers. Between these, the elapsed time of SVM was shorter than ELM, so SVM was proved to be most efficient.
It can be seen that proposed methodology has obtained promising results, which were compared to those summarized in Tab. 1. Some previous studies reported results that slightly outperformed the proposed one, but they had several other problems. The method for breast tumor diagnosis discussed in [10] had a higher accuracy than this paper because the proposed dataset was highly limited. The authors of [20] found promising results with fusion and deep learning classification for both image and EMR data, demonstrating a high accuracy and long elapsed time; on the contrary, the elapsed time of proposed technique for training and testing over a dataset was the lowest among rest of the studied methods. Similarly, the authors of [22] demonstrated a similar accuracy, but their testing and training times were comparatively long due to their use of deep learning. The method proposed in [21] based on deep learning with the AdaBoost assistance algorithm performed well, with comparative accuracy, but the utilized dataset was considerably smaller than that of the proposed paper. The studies of [11,18,19] (as mentioned in Tab. 1) are the latest in related literature, and all presented lesser accuracies than that of the proposed paper.
The authors of [20] have used feature fusion and reported a competitive accuracy, thus the proposed paper is endorsing the same feature-based fusion as one of a proposed methodology. The proposed paper has presented the experimental results with their LBP–bilateral extracted fused features with maximum classifiers, as shown in Tab. 3. Their comparative accuracies deteriorated while using well-known classifiers such as KNN, Naïve Bayes, GDA, and logistic regression; AdaBoost performed well and can be considered in state-of-the-art comparative analysis; and SVM and ELM performed best among all, SVM demonstrated the shortest elapsed time, as shown in Tab. 4, so SVM was the best among all the classifiers because using it would lead to the most accurate and shortest diagnosis time. The comparative analysis of elapsed time with different classifiers has been shown in Fig. 7.

Figure 7: Comparative analysis of elapsed time (s) achieved with different classifiers
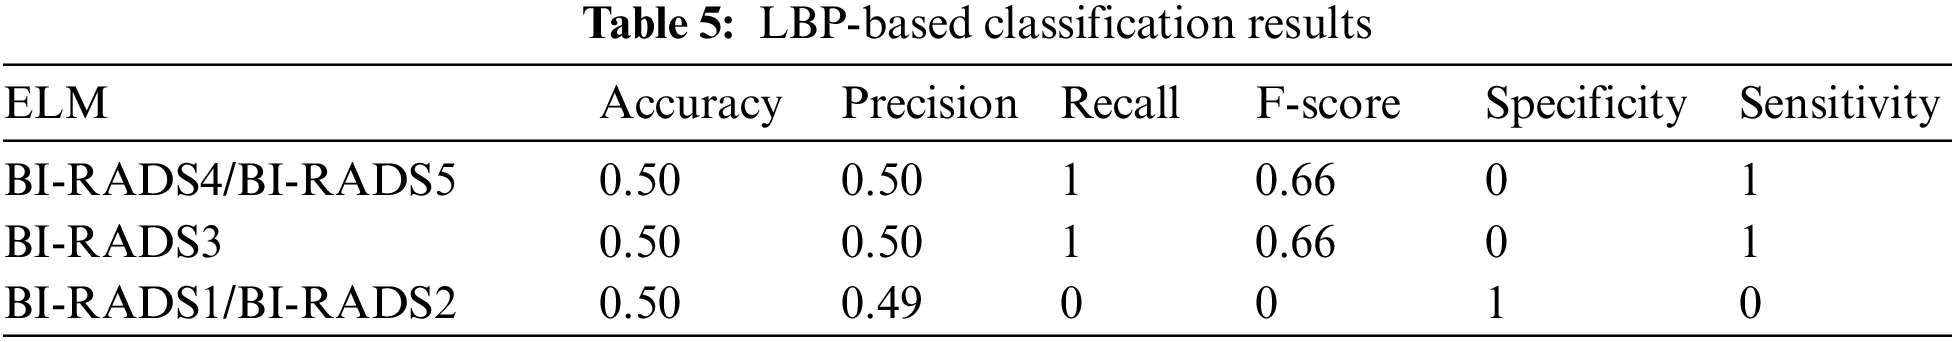
4.1 Individual ELM Classifier Results of LBP
The details of the individual LBP-based classification filter are shown in Tab. 5. LBP showed a drastic decrease in accuracy compared to the fusion when tested individually, as well as poor precision, recall, F-score, specificity, sensitivity, and accuracy measures. Therefore, it is necessary to fuse techniques in order to achieve comparable results.
4.2 Individual ELM Classifier Results of Bilateral
Individual bilateral-based feature selection and classification were performed (as seen in Tab. 6), and as accuracy, precision, recall, F-score, specificity and sensitivity metrics were extracted.
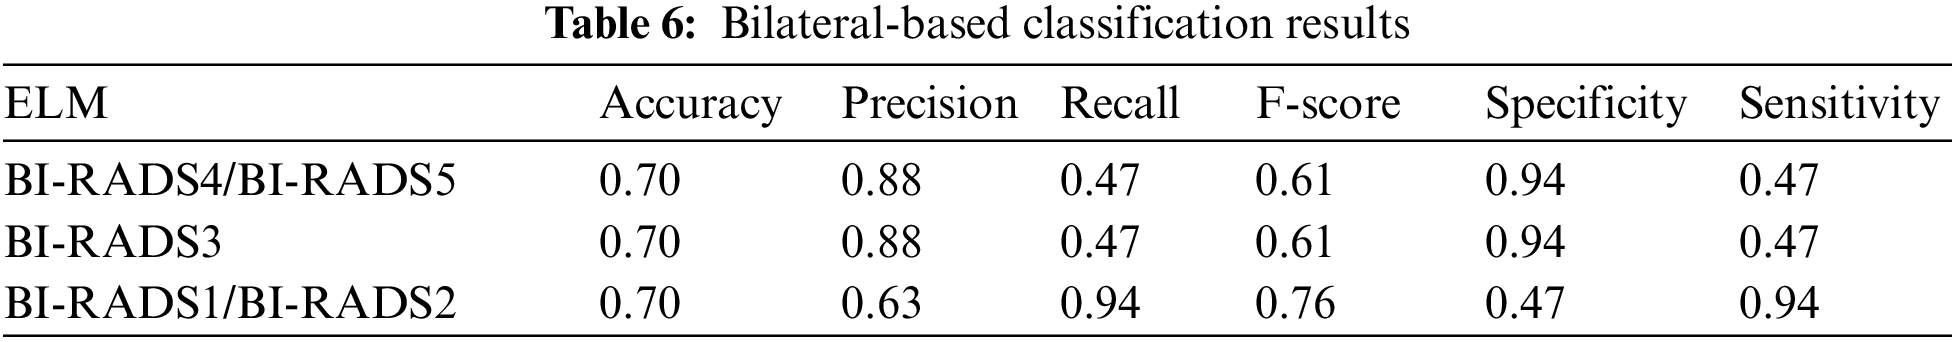
The results shown in Tab. 6 were poor but still better than those shown in Tab. 5, with the exception of the slightly better abnormal class F-score. Ultimately, all the scores were unsatisfactory and required enhanced feature extraction and selection to improve the overall precision and accuracy.
It was concluded that LBP and bilateral independent experiments with Breast cancer dataset produced poor accuracy. Therefore it was decided to fuse both the techniques to cover up the individual limitation of LBP and Bilateral algorithms. The combination of both led to the formation of Novel Spectral Extraction Algorithm (NSEA) hence contributed in optimal feature extraction and produced better results than individual algorithmic evaluations. The results were evaluated with a comparative study of the accuracy, precision, recall, F-score, specificity, sensitivity, and elapsed time of different classification algorithms. ELM and SVM classifiers proved to be the most efficient and accurate with 94% of accuracy score, though the elapsed time of SVM i.e., 0.68 s was lesser than that of ELM. Therefore, SVM was the most efficient and accurate of the tested classifiers.
The Proposed technique lacked usage of a greater dataset and clinical parameterized dataset that would have further made the diagnosis more accurate and reliable. As from proposed system physicians has to manually discover the reports of medical tests and then rely on computer aided diagnosis. Considering this concern the future work is to plan on further optimizing this Breast cancer diagnosis system by adding some clinical parameters of a patient suspected of BC. The voting percentage confirming BC disease will be computed from patient’s clinical parameters (which are based on medical tests) as an added support to mammograms based diagnosis.
Acknowledgement: The authors would like to acknowledge the support of the Deputy for Research and Innovation—Ministry of Education, Kingdom of Saudi Arabia for funding this research through a project grant code (NU/IFC/ENT/01/009) under the institutional Funding Committee at Najran University, Kingdom of Saudi Arabia. The authors are also thankful to the Ministry of Health in the Kingdom of Saudi Arabia as well as the general directorate of health affairs in Al-Qassim region for their approval to conduct this research.
Funding Statement: The authors would like to acknowledge the support of the Deputy for Research and Innovation—Ministry of Education, Kingdom of Saudi Arabia for funding this research through a project grant code (NU/IFC/ENT/01/009) under the institutional Funding Committee at Najran University, Kingdom of Saudi Arabia.
Conflicts of Interest: The authors declare that they have no conflicts of interest to report regarding the present study.
1. S. M. Albeshan and Y. I. Alashban, “Incidence trends of breast cancer in Saudi Arabia: A joinpoint regression analysis (2004–2016),” Journal of King Saud University Science, vol. 33, no. 7, pp. 101578, 2021. [Google Scholar]
2. S. Asiri, A. Asiri, S. Ulahannan, M. Alanazi, A. Humran et al., “incidence rates of breast cancer by age and tumor characteristics among Saudi women: Recent trends,” Cureus, vol. 12, no. 1, pp. 1–6, 2020. [Google Scholar]
3. S. Zaheer, N. Shah, S. A. Maqbool and N. M. Soomro, “Estimates of past and future time trends in age-specific breast cancer incidence among women in Karachi, Pakistan: 2004–2025,” BMC Public Health, vol. 19, no. 1, pp. 1–9, 2019. [Google Scholar]
4. V. Sopik, “International variation in breast cancer incidence and mortality in young women,” Breast Cancer Research and Treatment, vol. 186, no. 2, pp. 497–507, 2021. [Google Scholar]
5. S. Mubarik, F. Wang, M. Fawad, Y. Wang, I. Ahmad et al., “Trends and projections in breast cancer mortality among four Asian countries (1990–2017Evidence from five stochastic mortality models,” Scientific Reports, vol. 10, no. 1, pp. 1–12, 2020. [Google Scholar]
6. R. M. Alotaibi, H. R. Rezk, C. I. Juliana and C. Guure, “Breast cancer mortality in Saudi Arabia: Modelling observed and unobserved factors,” PLoS One, vol. 13, no. 10, pp. 1–16, 2018. [Google Scholar]
7. S. Saadatmand, S. Sepideh, H. A. Geuzinge, E. Rutgers, R. M. Mann et al., “MRI versus mammography for breast cancer screening in women with familial risk (FaMRIscA multicentre, randomised, controlled trial,” The Lancet Oncology, vol. 20, no. 8, pp. 1136–1147, 2019. [Google Scholar]
8. T. G. Debelee, F. Schwenker, A. Ibenthal and D. Yohannes, “Survey of deep learning in breast cancer image analysis,” Evolution Systems, vol. 11, no. 1, pp. 143–163, 2020. [Google Scholar]
9. N. Naheed, M. Shaheen, S. A. Khan, M. Alawairdhi and M. A. Khan, “Importance of features selection, attributes selection, challenges and future directions for medical imaging data: A review,” Computer Modelling in Engineering Sciences, vol. 125, no. 1, pp. 315–344, 2020. [Google Scholar]
10. W. Ha and Z. Vahedi, “Automatic breast tumor diagnosis in MRI based on a hybrid CNN and feature-based method using improved deer hunting optimization algorithm,” Computational Intelligence and Neuroscience, vol. 2021, no. 5396327, pp. 11, 2021. [Google Scholar]
11. G. Amit, R. Ben-Ari, O. Hadad, E. Monovich, N. Granot et al., “Classification of breast MRI lesions using small-size training sets: Comparison of deep learning approaches,” Medical Imaging 2017 Computer Aided Diagnosis, vol. 10134, pp. 101341H, 2017. [Google Scholar]
12. N. Antropova, H. Abe and M. L. Giger, “Use of clinical MRI maximum intensity projections for improved breast lesion classification with deep convolutional neural networks,” Journal of Medical. Imaging, vol. 5, no. 1, pp. 1, 2018. [Google Scholar]
13. N. Antropova, B. Huynh and M. Giger, “Performance comparison of deep learning and segmentation-based radiomic methods in the task of distinguishing benign and malignant breast lesions on DCE-MRI,” Medical Imaging 2017 Computer Aided Diagnosis, vol. 10134, pp. 101341G, 2017. [Google Scholar]
14. N. Antropova, B. Q. Huynh and M. L. Giger, “A deep feature fusion methodology for breast cancer diagnosis demonstrated on three imaging modality datasets,” Medical Physics, vol. 44, no. 10, pp. 5162–5171, 2017. [Google Scholar]
15. M. A. Elshafey and T. E. Ghoniemy, “A hybrid ensemble deep learning approach for reliable breast cancer detection,” International Journal of Advances in Intelligent Informatics, vol. 7, no. 2, pp. 112–124, 2021. [Google Scholar]
16. Q. Hu, H. M. Whitney and M. L. Giger, “A deep learning methodology for improved breast cancer diagnosis using multiparametric MRI,” Scientific Reports, vol. 10, no. 1, pp. 1–11, 2020. [Google Scholar]
17. Q. Hu, H. M. Whitney and M. L. Giger, “Radiomics methodology for breast cancer diagnosis using multiparametric magnetic resonance imaging,” Journal of Medical Imaging, vol. 7, no. 4, pp. 1–15, 2020. [Google Scholar]
18. Q. Hu, H. M. Whitney, H. Li, Y. Ji, P. Liu et al., “Improved classification of benign and malignant breast lesions using deep feature maximum intensity projection MRI in breast cancer diagnosis using dynamic contrast-enhanced MRI,” Radiology: Artificial Intelligence, vol. 3, no. 3, pp. e200159, 2021. [Google Scholar]
19. B. Huynh, N. Antropova and M. L. Giger, “Recurrent neural networks for breast lesion classification based on DCE-MRIs,” Medical Imaging 2018: Computer-Aided Diagnosis, vol. 10575, pp. 593–598, 2018. [Google Scholar]
20. S. Y. Siddiqui, S. Yamin, I. Naseer, M. A. Khan, M. F. Mushtaq et al., “Intelligent breast cancer prediction empowered with fusion and deep learning,” Computers, Material & Continua, vol. 67, no. 1, pp. 1033–1049, 2021. [Google Scholar]
21. A. H. Yurttakal, H. Erbay, T. İkizceli, S. Karaçavuş and C. Biçer, “Classification of breast DCE-MRI images via boosting and deep learning based stacking ensemble approach,” in Conf. on Intelligent and Fuzzy Systems, Istanbul, Turkey, vol. 1197, pp. 1125–1132, 2020. [Google Scholar]
22. J. Zheng, D. Lin, Z. Gao, S. Wang, M. He et al., “Deep learning assisted efficient AdaBoost algorithm for breast cancer detection and early diagnosis,” IEEE Access, vol. 8, pp. 96946–96954, 2020. [Google Scholar]
23. M. Sharif, J. Amin, M. W. Nisar, M. A. Anjum, N. Muhammad et al., “A unified patch based method for brain tumor detection using features fusion,” Cognitive Systems Research, vol. 59, pp. 273–286, 2020. [Google Scholar]
24. J. Amin, M. Sharif, M. Raza, T. Saba and A. Rehman, “Brain tumor classification: Feature fusion,” in Int. Conf. on Computer and Information Sciences (ICCIS) 2019, Sakaka, Saudi Arabia, pp. 1–6, 2019. [Google Scholar]
25. M. I. Sharif, J. P. Li, M. A. Khan and M. A. Saleem, “Active deep neural network features selection for segmentation and recognition of brain tumors using MRI images,” Pattern Recognition Letters, vol. 129, pp. 181–189, 2020. [Google Scholar]
26. A. Heena, N. Biradar and N. M. Maroof, “Comparative analysis of various medical image segmentation techniques,” A Collection of Contemporary Research Articles in Electronics, Communication and Computation, vol. 21, no. 32, pp. 170–177, 2021. [Google Scholar]
27. A. Heena, N. Biradar and N. M. Maroof, “Comparative analysis of fractional order calculus in image processing.” in 1st IEEE Int. Conf. on Advances in Information Technology, ICAIT 2019-Proc., Chikmagalur India, July pp. 180–183, 2019. [Google Scholar]
28. A. Heena, “Analysis and classification of heart abnormalities,” in Biomedical Signal Processing for Healthcare Applications, 1st ed., Boca Raton: CRC press, Chap no. 3, pp. 55–71, July 2021. [Online]. Available: https://www.taylorfrancis.com. [Google Scholar]
29. P. Yang, G. Liu, X. Li, L. Qin and X. Liu, “An intelligent tumors coding method based on drools.” Journal of New Media, vol. 2, no. 3, pp. 111, 2020. [Google Scholar]
30. X. Zhang, X. Sun, W. Sun, T. Xu, P. Wang et al., “Deformation expression of soft tissue based on BP neural network.” Intelligent Automation and Soft Computing, vol. 32, no. 2, pp. 1041–53, 2022. [Google Scholar]
 | This work is licensed under a Creative Commons Attribution 4.0 International License, which permits unrestricted use, distribution, and reproduction in any medium, provided the original work is properly cited. |