DOI:10.32604/cmc.2022.029322
| Computers, Materials & Continua DOI:10.32604/cmc.2022.029322 | |
| Article |
State of Health Estimation of LiFePO4 Batteries for Battery Management Systems
1Department of Electrical Engineering, University of Engineering and Technology, Lahore, Pakistan
2Department of Electrical Engineering, University of Central Punjab, Lahore, Pakistan
*Corresponding Author: Areeb Khalid. Email: areebk@hotmail.com
Received: 01 March 2022; Accepted: 13 April 2022
Abstract: When considering the mechanism of the batteries, the capacity reduction at storage (when not in use) and cycling (during use) and increase of internal resistance is because of degradation in the chemical composition inside the batteries. To optimize battery usage, a battery management system (BMS) is used to estimate possible aging effects while different load profiles are requested from the grid. This is specifically seen in a case when the vehicle is connected to the net (online through BMS). During this process, the BMS chooses the optimized load profiles based on the least aging effects on the battery pack. The major focus of this paper is to design an algorithm/model for lithium iron phosphate (LiFePO4) batteries. The model of the batteries is based on the accelerated aging test data (data from the beginning of life till the end of life). The objective is to develop an algorithm based on the actual battery trend during the whole life of the battery. By the analysis of the test data, the complete trend of the battery aging and the factors on which the aging is depending on is identified, the aging model can then be recalibrated to avoid any differences in the production process during cell manufacturing. The validation of the model was carried out at the end by utilizing different driving profiles at different C-rates and different ambient temperatures. A Linear and non-linear model-based approach is used based on statistical data. The parameterization was carried out by dividing the data into small chunks and estimating the parameters for the individual chunks. Self-adaptive characteristic map using a lookup table was also used. The non-linear model was chosen as the best candidate among all other approaches for longer validation of 8-month data with real driving data set.
Keywords: Aging model; state of health; lithium-ion cells; battery management system; state of charge; battery modeling
The major difference between Electric Vehicles (EV’s) and conventional vehicles is the presence of batteries and motors for traction in place of a combustion engine. The batteries in the EV’s are the major price contributing factor considered within the EV industry and are considered a hurdle in terms of its price and safety.
In comparison to the other battery chemistries, lithium-ion cells are considered suitable for portable and traction-based applications [1]. These batteries have a long life span and have high efficiencies in comparison to other chemistries but only if a few of the conditions are not violated e.g., protection from short circuit, over charging and discharging [2]. Despite the popularity of these batteries, they still have a short life span due to the internal chemical phenomena which are exaggerated under certain conditions. Batteries calendar life and cycling life are both considered important as far as lithium batteries are concerned. Short calendar life and cycling life under certain conditions is the main price contributing factor because the user will have to replace the batteries after a certain period, since the short life and high cost limits the use of these cells. The Research is ongoing and is still finding factors in which the aging of the battery is optimized to its full potential. This can be achieved by creating an efficient aging model which will identify the factors affecting the life of the batteries and based on these factors, optimize the use of the batteries [3].
The behavior of the battery is different under storage and cycling conditions. Therefore, the factors affecting both of these conditions need to be identified in terms of capacity decay and increase in internal resistance. Furthermore, aging under cycling conditions is still a critical task because of uncertain behavior in capacity and resistance, specifically when the battery is at rest and again at cycling [4].
To optimize the use of the battery under all operating conditions, an aging model is required inside a BMS, this then efficiently chooses the best profile from the grid to show the least aging on the battery packs for optimal use. Different battery models have already been developed in the literature but few of them focus on efficient estimation of aging under all conditions [5]. If the efficient model is considered then the model will be complex enough to be implemented on real-life scenario applications, therefore a compromise is to be made between accuracy and complexity.
This paper presents an optimized semi-empirical model based on accelerated data and estimates the parameters offline. The offline parameters often lose validity when conditions change hence different parameters need to be estimated based on battery behaviors and updated in the model accordingly. The states of the model have to be re-calibrated whenever variations are found based on actual estimated values. In this way, optimized model is possible to estimate actual battery conditions by re-calibration without having a complex system.
2 Vehicle to Grid (V2G) System
In vehicle to grid systems, the vehicles are connected to the grid majority of the time. During that scenario, the storage aging could be reduced by supplying electricity to the grid if the battery SOC is above the threshold. From the analysis of accelerated test data, it is evident that if the battery state of charge is above 80 percent the aging process will accelerate. Therefore, the purpose of the research is to reduce the storage aging by supplying back to the grid only if the battery state of charge is at a higher level. By going through this process, the storage aging will be reduced and both utility and the consumers will be a benefit during peak load for power regulation. In the same way, cycling aging needs to be addressed by using the efficient aging model. The intermediate system operator (ISO) sends profiles of the grid to the vehicles and the BMS of the vehicles run those profiles to choose among optimum profiles having the least aging effect on the battery pack, as presented in Fig. 1.
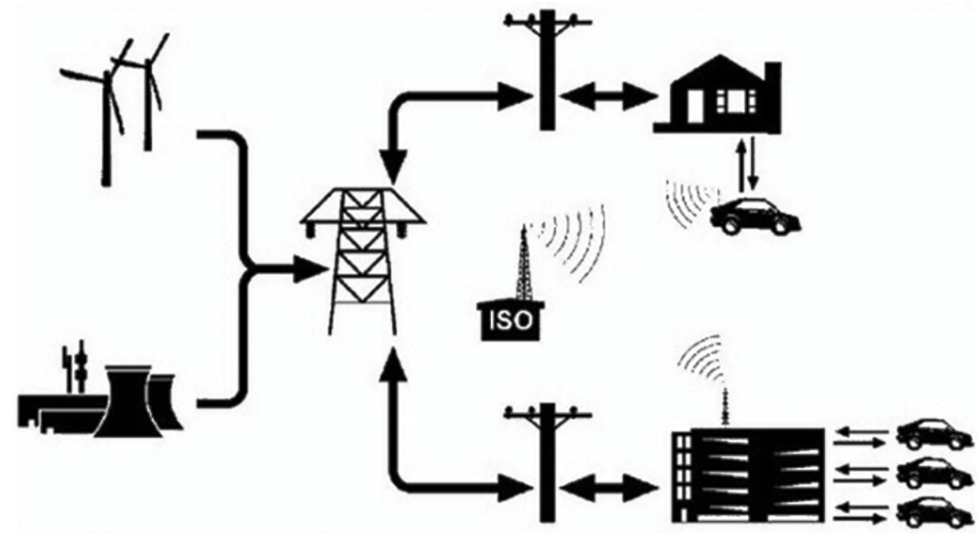
Figure 1: Vehicle to grid (V2G) operation [6]
To precisely estimate the aging of the battery, an aging model is required in BMS which will have the capability to efficiently estimate the actual state of the battery pack under all conditions. The aging model must be simple enough to be easily implementable inside a BMS but must be capable of accurately estimating the actual state of health at all the operating conditions.
Fig. 2 highlights the basic scheme of BMS in which the aging model is based on the pre-processing data and estimated values of resistance, capacity, and energy. The actual values will be estimated from other blocks and compared with the values from an aging model block. The values are recalibrated whenever required.
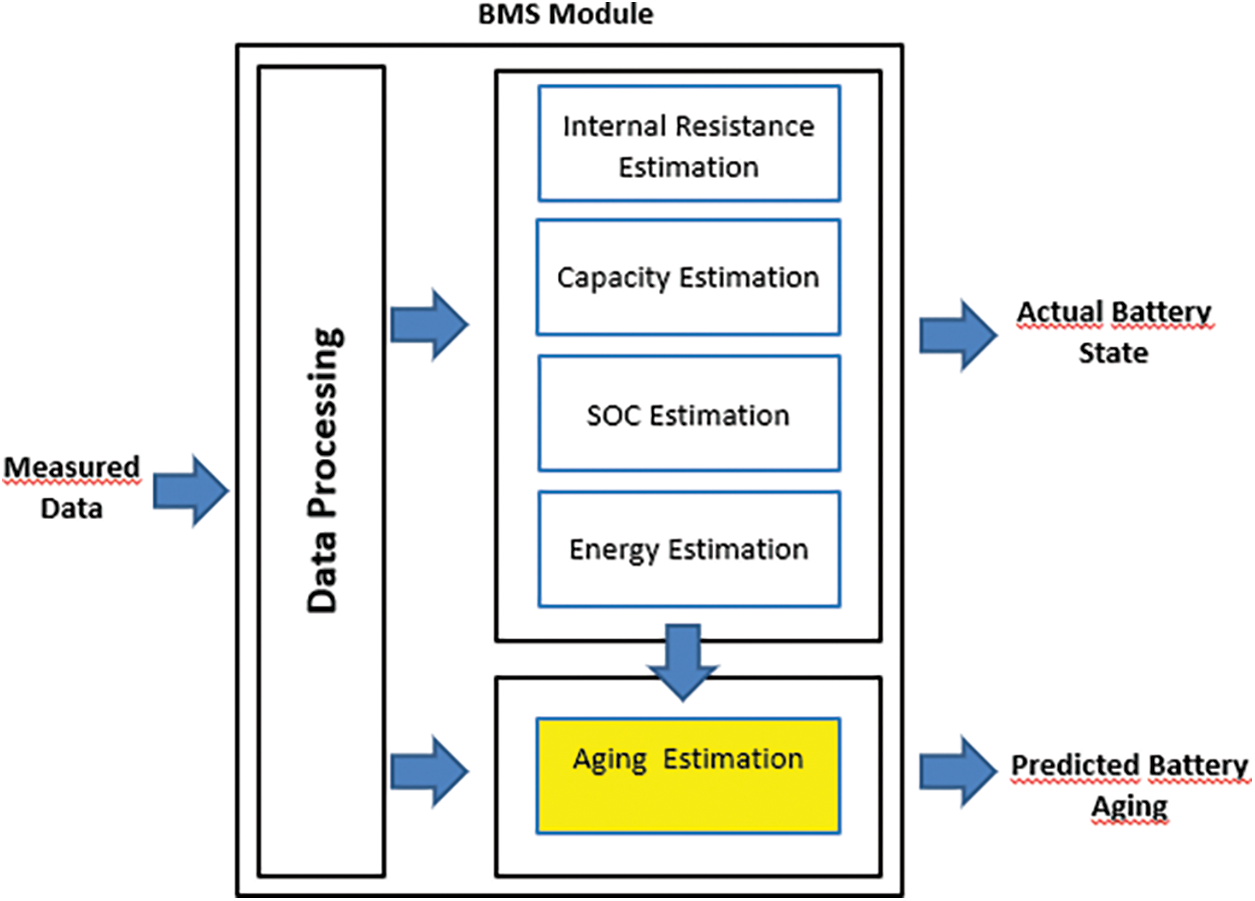
Figure 2: Possible simplified schema of BMS
It is not possible to estimate all internal phenomena inside the battery by using a simple approach so a compromise has to be made. There are many electro-chemical phenomena which are not considered in electrical models e.g., Solid electrolytic interface layer growth. The electro-chemical models are accurate but we need to consider individual equations for each chemical phenomenon inside the battery which increases the complexity of the model. These models are complex enough and are not implementable inside an ordinary microcontroller [7].
To consider all internal processes accurately, empirical and semi-empirical models are appropriate. The Statistical or empirical models are dependent on battery test data through which we know how battery ages from the beginning of life till the end of life. If all the data is available then the model will be selected by the analysis of the data through different fitting techniques. The major disadvantage of this approach as compared to the first principal model is that we need complete test data of the battery which is cost and time-intensive and the validity of the model is limited to specific chemistry [8]. In this work semi-empirical model based on accelerated aging test data is considered for aging prediction by following some physical law e.g., Arrhenius law which states that the reaction rate doubles for every 10% temperature rise.
Accelerated aging means to speed up the normal aging processes e.g., different temperatures, current and state of charge, depth of discharge that normally takes place within the life cycle of the battery. Normally this behavior of battery is visible within the life of the battery (5–10 years and so). Instead of observing within the complete life cycle of the battery, the processes could be observed within a few months. These tests are carried out in the controlled environment in a laboratory. For long-term temperature variations, the cells are stored in a temperature chamber. The climate chamber artificially replicates the conditions under which the batteries might be exposed during their battery life. Climate chambers are normally used to accelerate the effects of temperature exposure, sometimes at extreme conditions that are not normally expected (e.g., 70°C). The main goal is to observe the long-term behavior of the battery at storage and cycling conditions at real environmental operating temperature ranges.
In this research high power 8 Ah with a nominal voltage of 3.2 V LiFePO4 cylindrical cells have been tested and analyzed. The active material of the anode is graphite and the cathode is LiFePO4. For testing three cells of the same production is used under same conditions in order to overcome differences in production spread. For storage, the effect of temperature and SOC and for cycling conditions the effect of current and SOC was quantized. The cells were placed under storage conditions in spite of the floating condition.
The tests at storage conditions were carried out according to the test matrix in Tab. 1. At storage condition, the temperature will be 30°C, 40°C, 50°C, and 70°C according to the text matrix. Data have been collected for 6–8 months by changing temperature and state of charge as per text matrix.
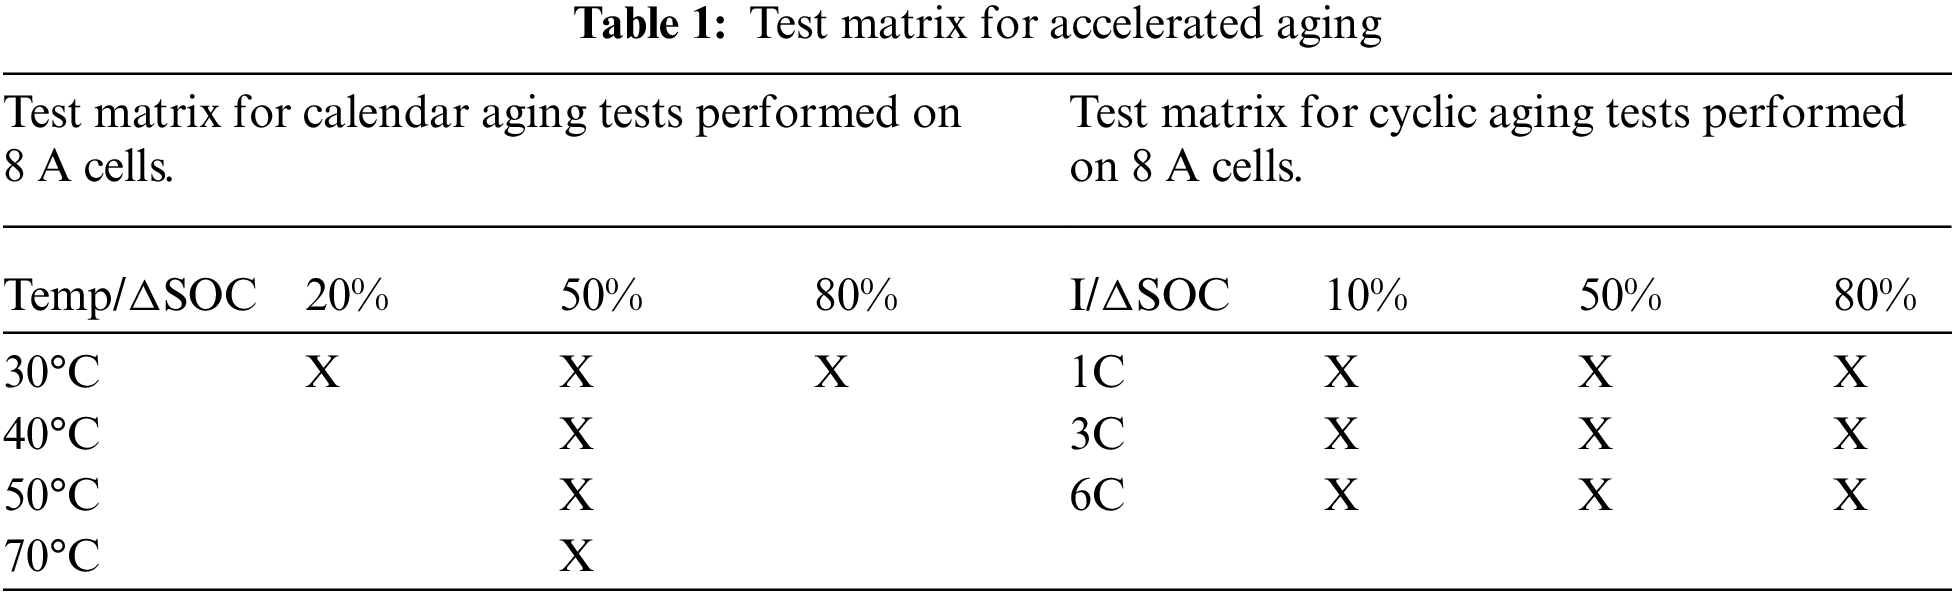
For cycling conditions, the test has been performed according to the text matrix at 1C, 2C, and 6C rates for 10%, 50%, and 80% SOC respectively. The same procedure of storage was repeated for cycling for the analysis of the long-term behavior of cells. All tests were performed at ISEA RWTH Aachen Germany and test data is the property of the institute.
For the storage condition, the test data of capacity and resistance are known. The data provides information about how the battery ages and what are the factors that are affecting the life of the battery. From the analysis of the storage results for all conditions, it can be seen that the capacity of the battery increases for the first few months and resistance decreases respectively. This is because of the Silicon Electric Interface (SEI) layer formation which initially increases the capacity and later on as the growth of the layer increases the capacity decay starts which is also evident from the literature [9]. It can be seen from the given results in Fig. 3 that for a higher temperature the capacity decay and increase of internal resistance are more prominent. To increase the life of the battery, the temperature plays an important role.
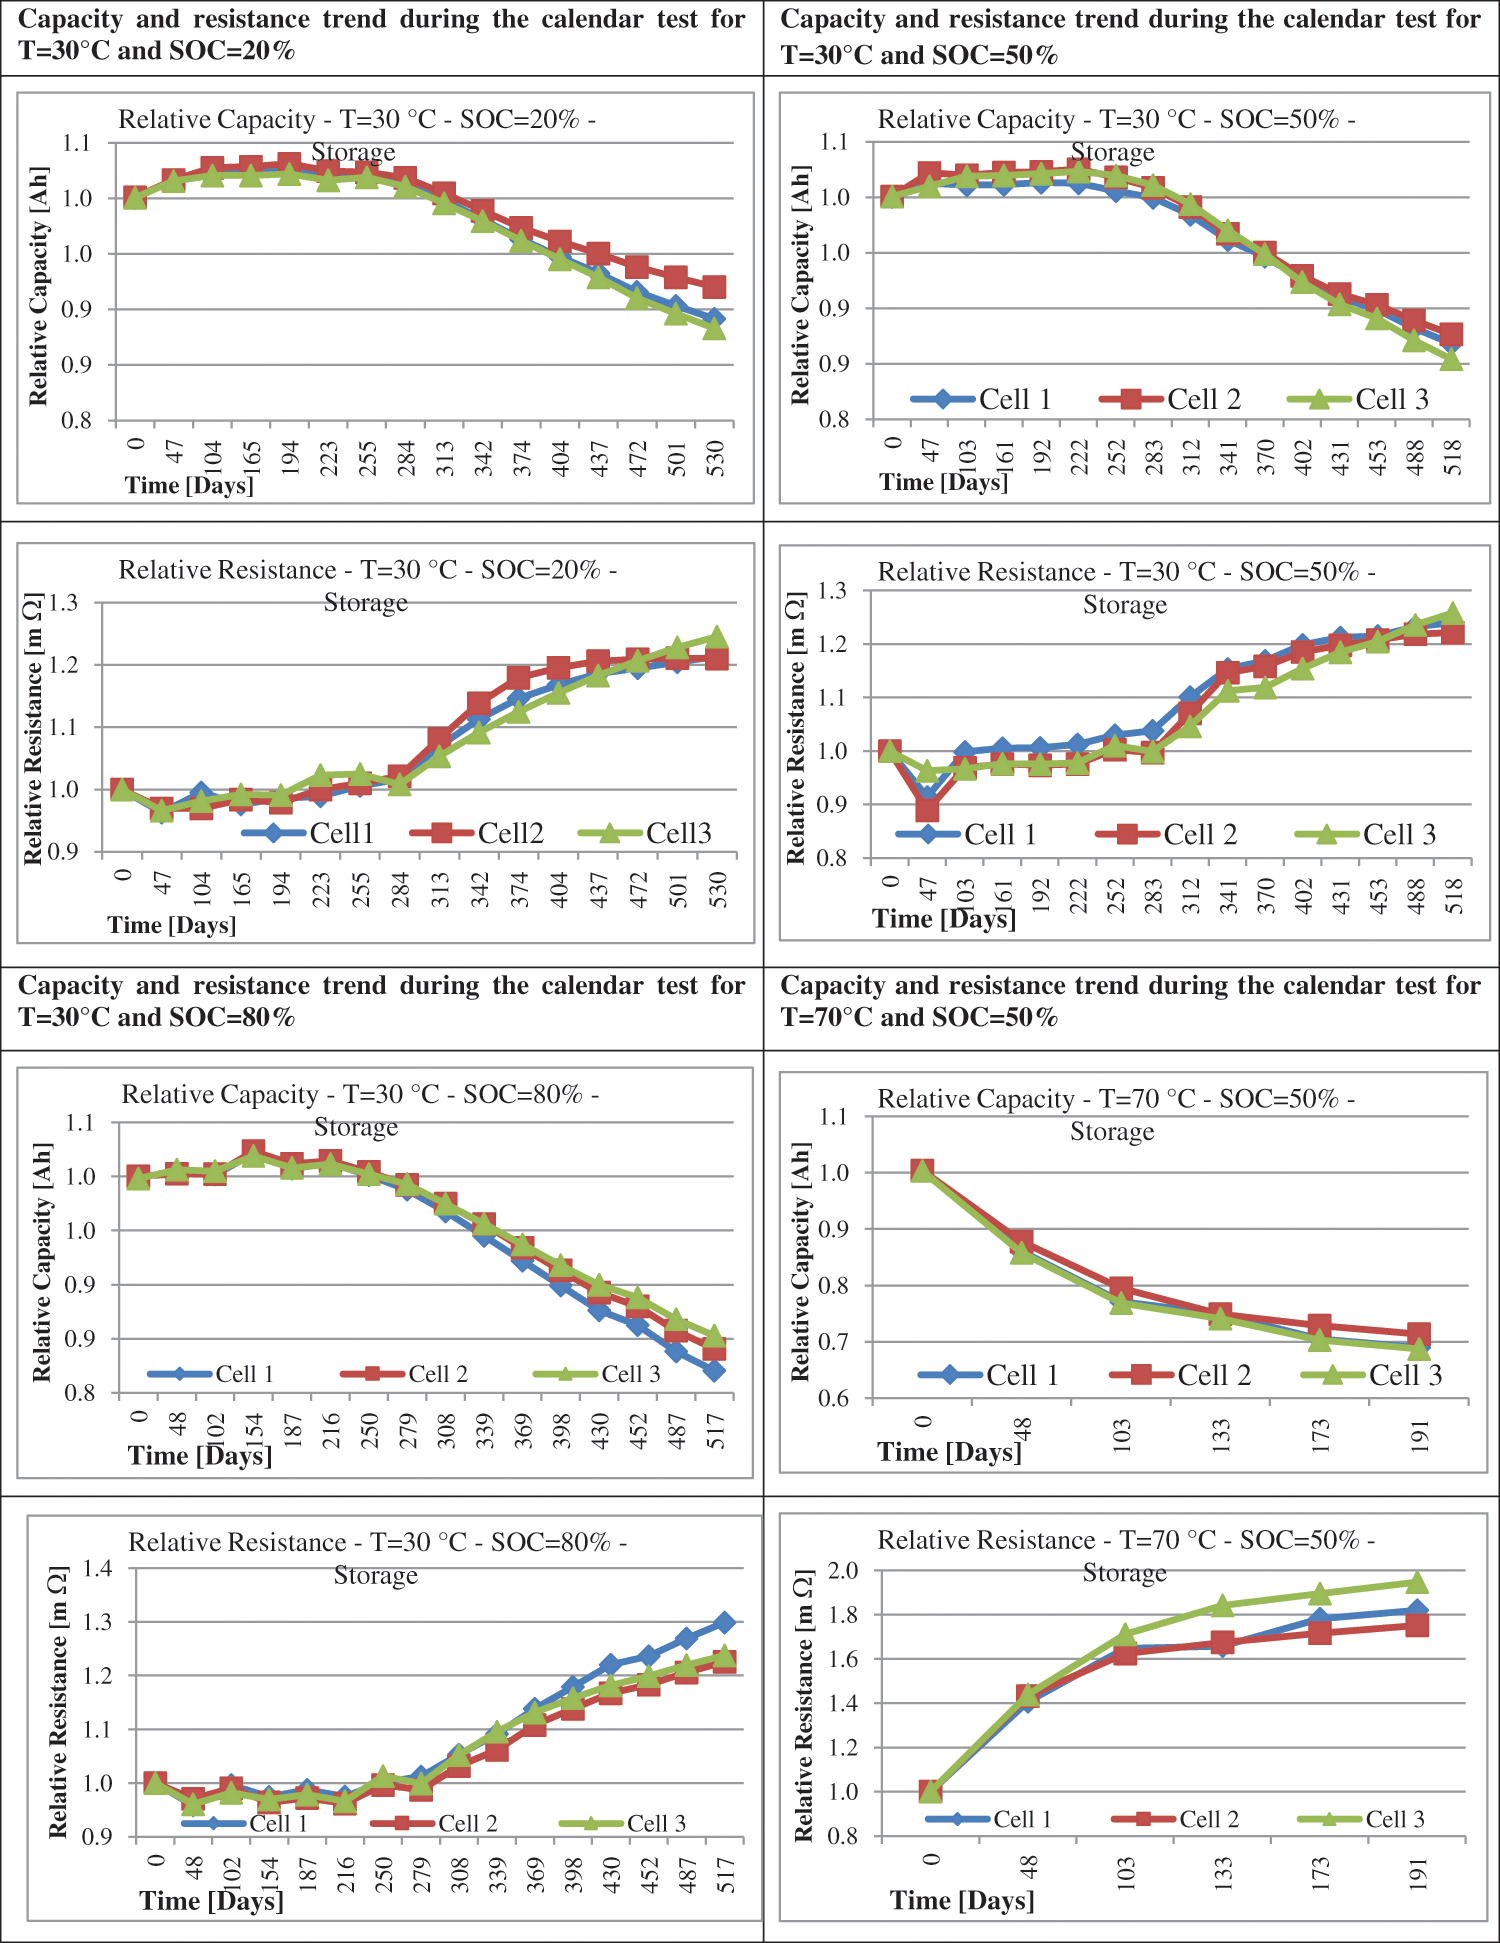
Figure 3: Aging test data at storage conditions
Fig. 3 highlight the cells that are degrading more compared to the cycling condition. Specifically for the cells stored at 70°C with SOC 50%, the cells ages more and reaches their end of life early as compared to cells having a temperature of 30°C with a SOC of 50%. In the same way, the cells having a temperature of 30°C with a state of charge of 80% reach the end of life early compared to the SOC of 20%. For storage condition, it is concluded that for higher SOC at a specific temperature the life of cells decays further and similarly if for the same SOC the temperature increases then the life of cells decay further.
It can be seen from the results in Fig. 4 that the cells behave differently during cycling and storage conditions. The aging effects are dominant during cycling conditions. From the accelerated aging test data of cycling, it can be seen that the cells age more rapidly compared to storage. The cells ages more rapidly for a higher C-rate, the cells having a 6C rate have more aging effects compared to the 1C rate. From the analysis of the data, we have found that the cells have 10% SOC and 80% or more SOC age more rapidly.
For cycling, the cells at 1C rate with 10% depth of discharge age rapidly compared to cells having 80% DOC having a temperature of 30°C at the same C-rate. The cells at 6C rate with DOD of 10% age rapidly compared to cells at 80% DOD having a constant temperature of 30°C at the same C-rate. From the results, it can be observed that more variations specifically for resistance during cycling compared to storage, and this is the reason that the resistance model for cycling is difficult to achieve the best fit equation to replicate the actual behavior of cells.
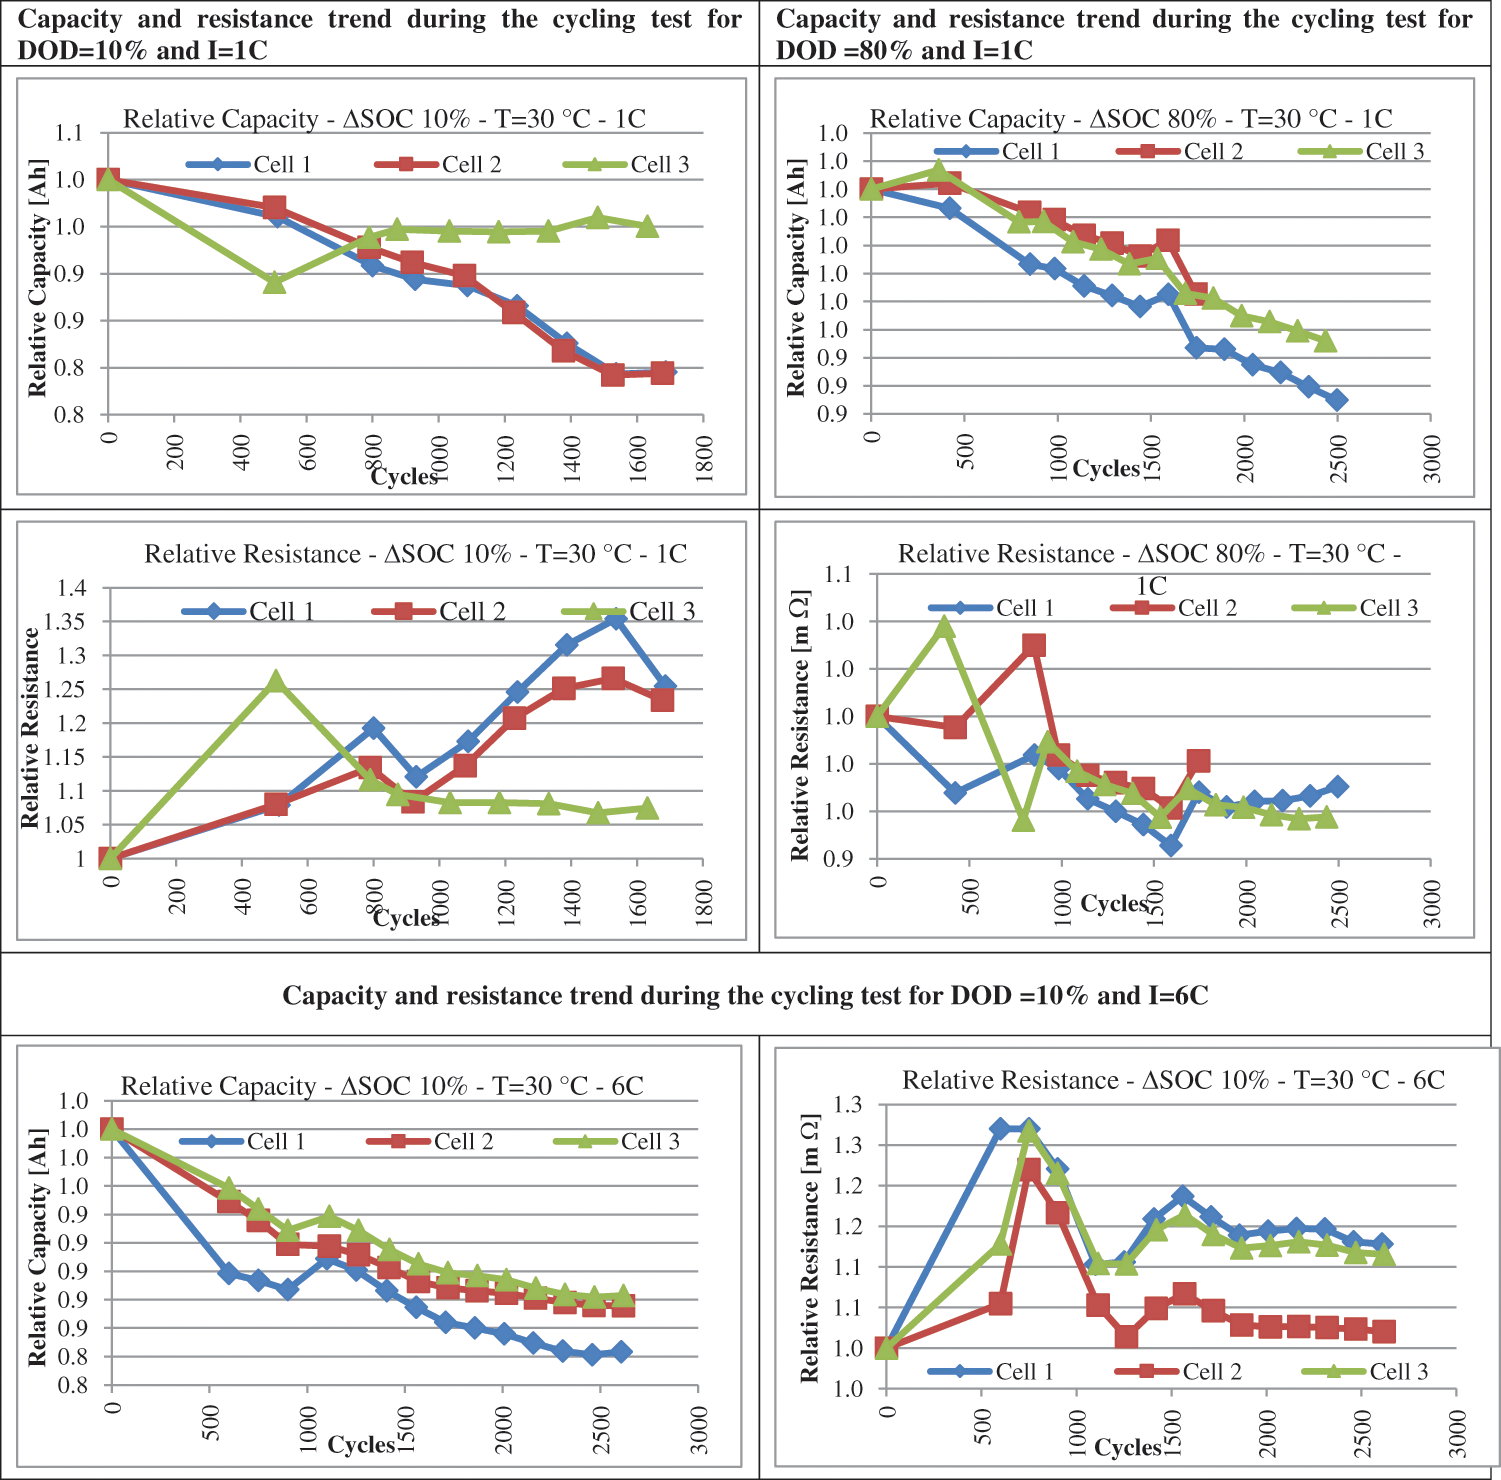
Figure 4: Aging test data at cyclic conditions
6 Implementation of the Algorithm
To efficiently replicate the behavior of the battery, an efficient model is necessary having the capability to operate at all operating conditions. However, many battery models are not precise to replicate the actual battery behavior at all operating points. The models which are precise are too complex have a high number of parameters and need to update these parameters online so these models are not suitable for real-time applications. As already explained in the previous section that this paper presents a semi-empirical model so during the selection of the model some of the factors need to be considered from existing literature and also justified from accelerated aging test data [10]:
Effects of aging on battery characteristics depend on the conditions used (for high power cells, more variation in capacity compared to resistance). The aging effect is purely dependent on the usage conditions.
For storage and cycling only the dominating factors for the respective case will be considered as highlighted by Fig. 5.
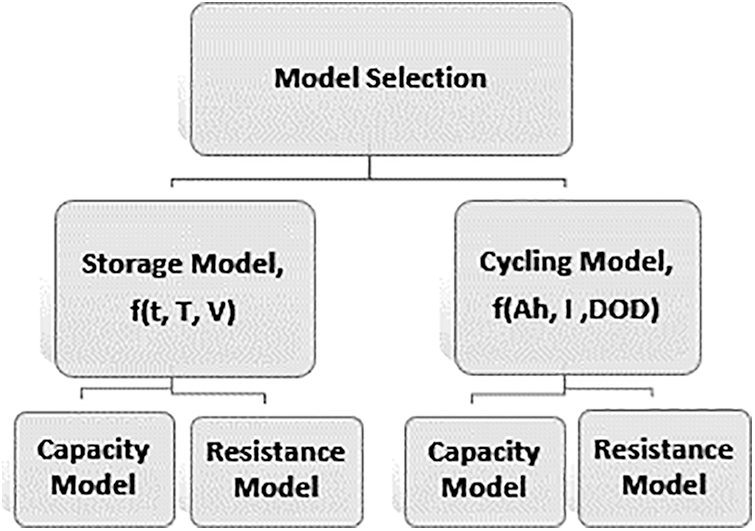
Figure 5: Hierarchy for model selection
The behavior of capacity and resistance is not linear and has a non-monotonic trend.
For the storage model, time, temperature, and voltage are taken into account. For cycling, Ah, current and DOD are taken into account for both resistance and capacity models [11].
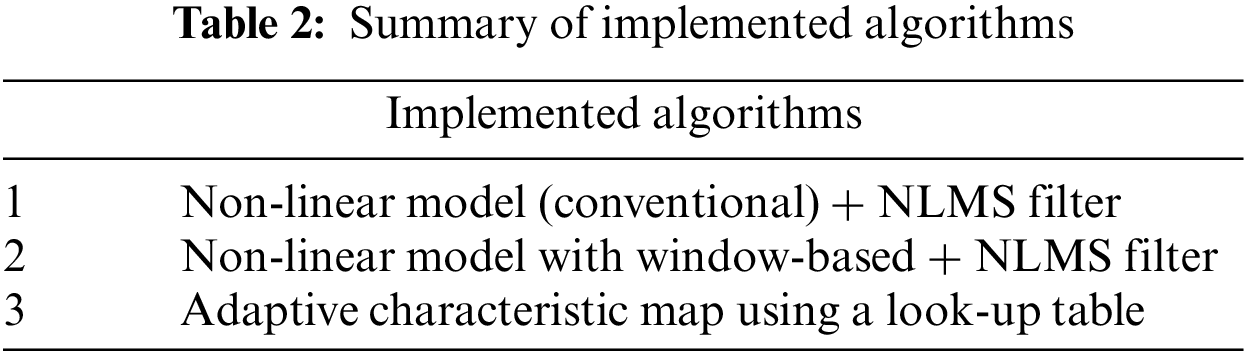
The parameters are estimated based on analysis of test data but still, there is the possibility of error. A recalibration is necessary whenever new values of capacity and resistance are available for the model to be robust as highlighted in Fig. 6. Four different approaches have been considered in this paper as mentioned in Tab. 2.
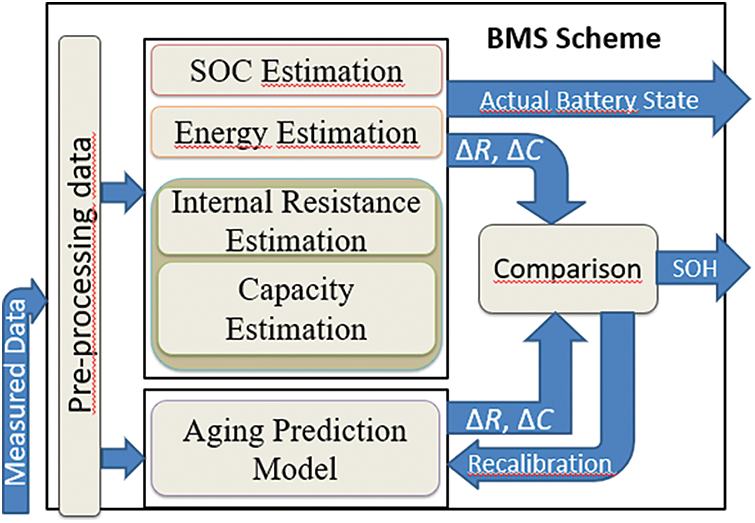
Figure 6: Complete BMS with recalibration concept
Complete test data from BOL to EOL is now available so we know how the battery ages. The idea is to find a model equations by using the curve fitting technique and to find the best fit model for both capacity and resistance in storage and cycling condition. Based on the best fit model for each case, the unknown parameters for best fit are calculated.
For the storage condition, regarding the capacity:
For the storage condition, regarding the resistance:
For the cycling condition, regarding the capacity:
For the cycling condition, regarding the resistance:
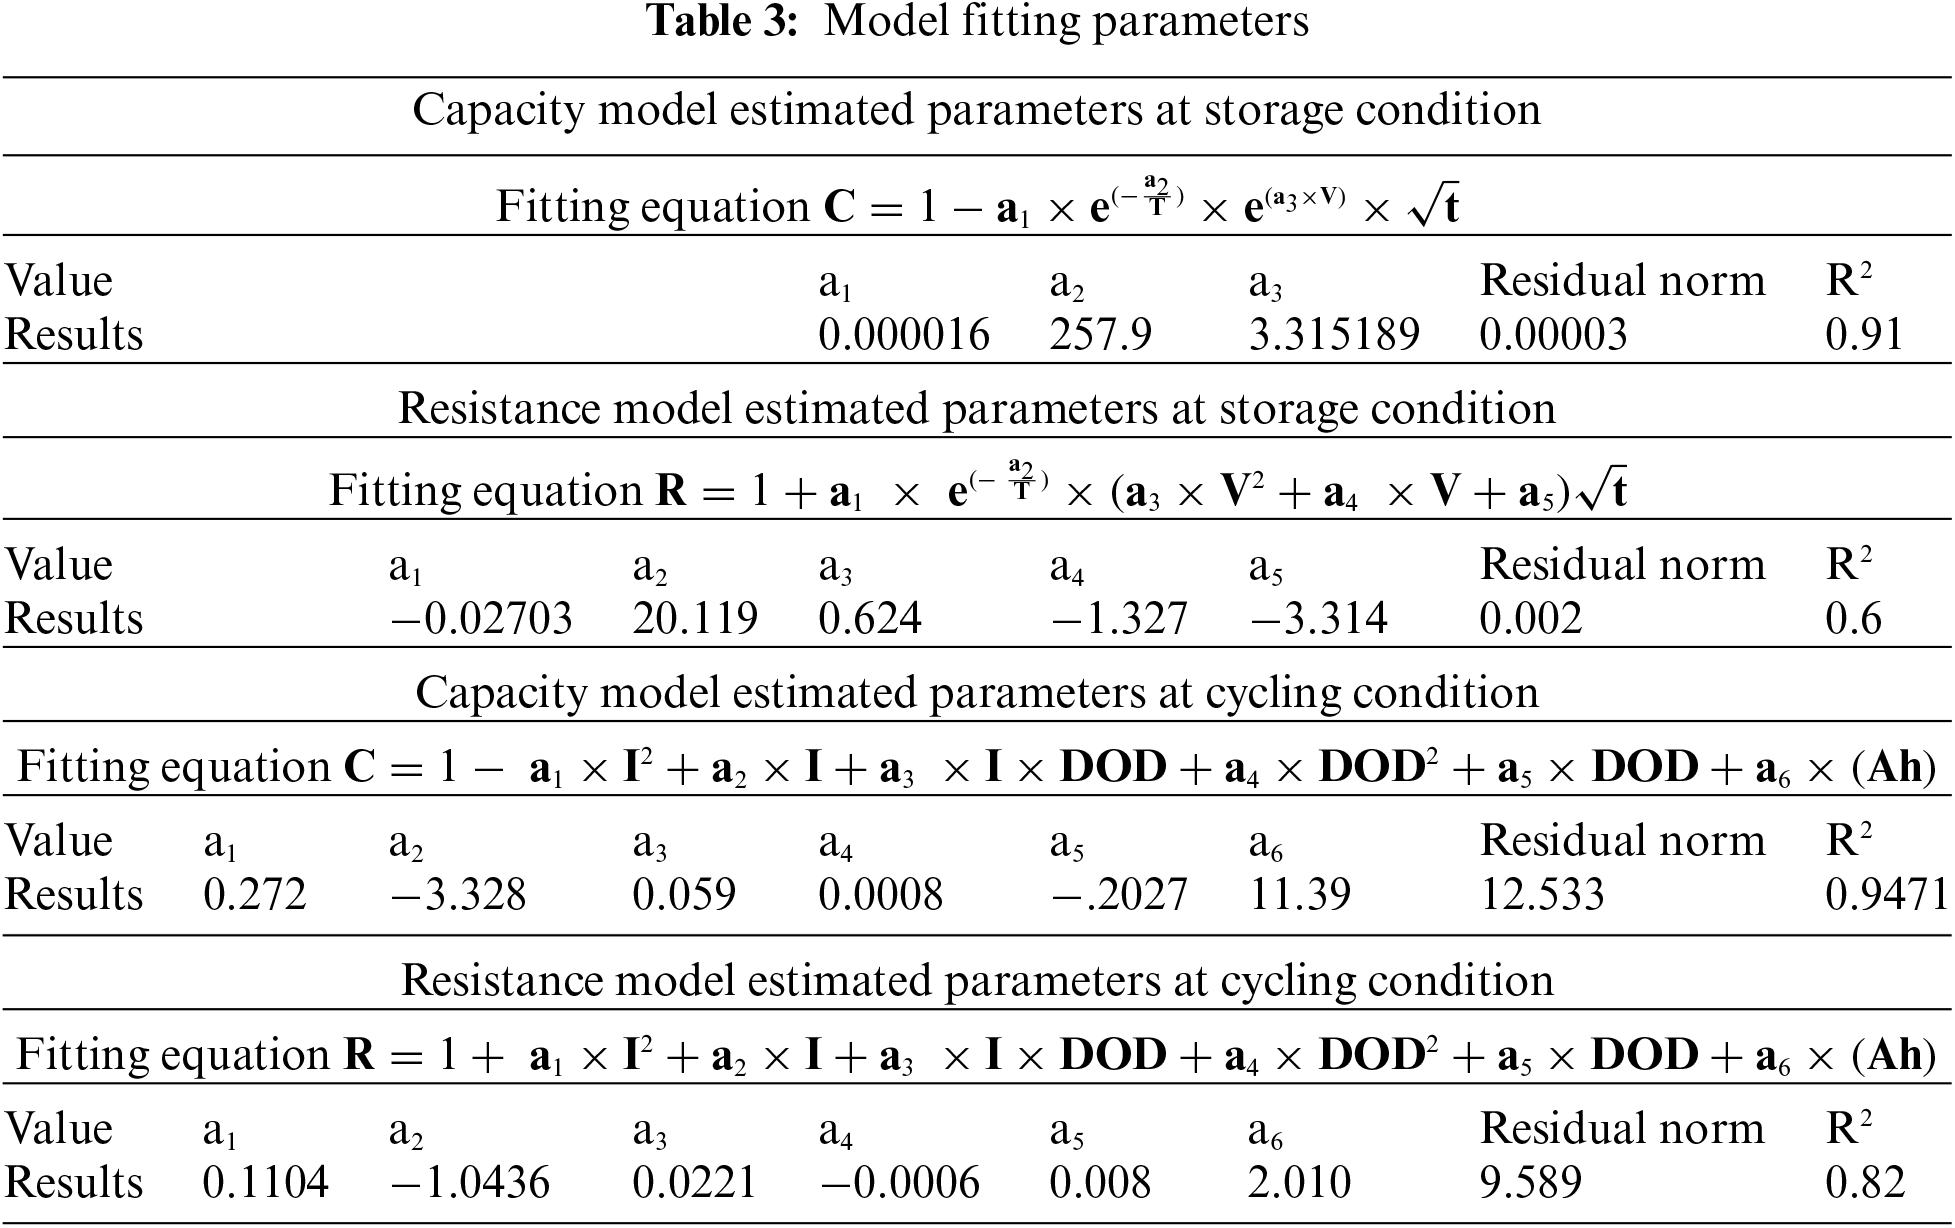
After finalization of the model equations, we have calculated the unknown parameters for best fit for both capacity and resistance in storage and cycling conditions as presented in Tab. 3. From the analysis of test data, we can clearly see that there are more variations in the resistance data specifically for the cycling and storage so the fitting is not accurate but acceptable. So, we compensated the variations at the end by recalibrating our model.
6.2 Non-Linear Model with Window-Based Approach
The idea of this approach is to divide the test data after analysis and find parameters offline for each chunk individually. After estimating the parameters for each of the chunks we have updated the parameters in the model based on the conditions. The parameters for each of the chunk are considered for update whenever a new condition is detected. By using this approach, the results of online parameter estimation methods are achieved by the use of offline parameters estimation.
The issue of adaptability can be reduced and the possibility of using online information can be utilized without complication. In the next section we have calculated parameters for each of the chunks individually.
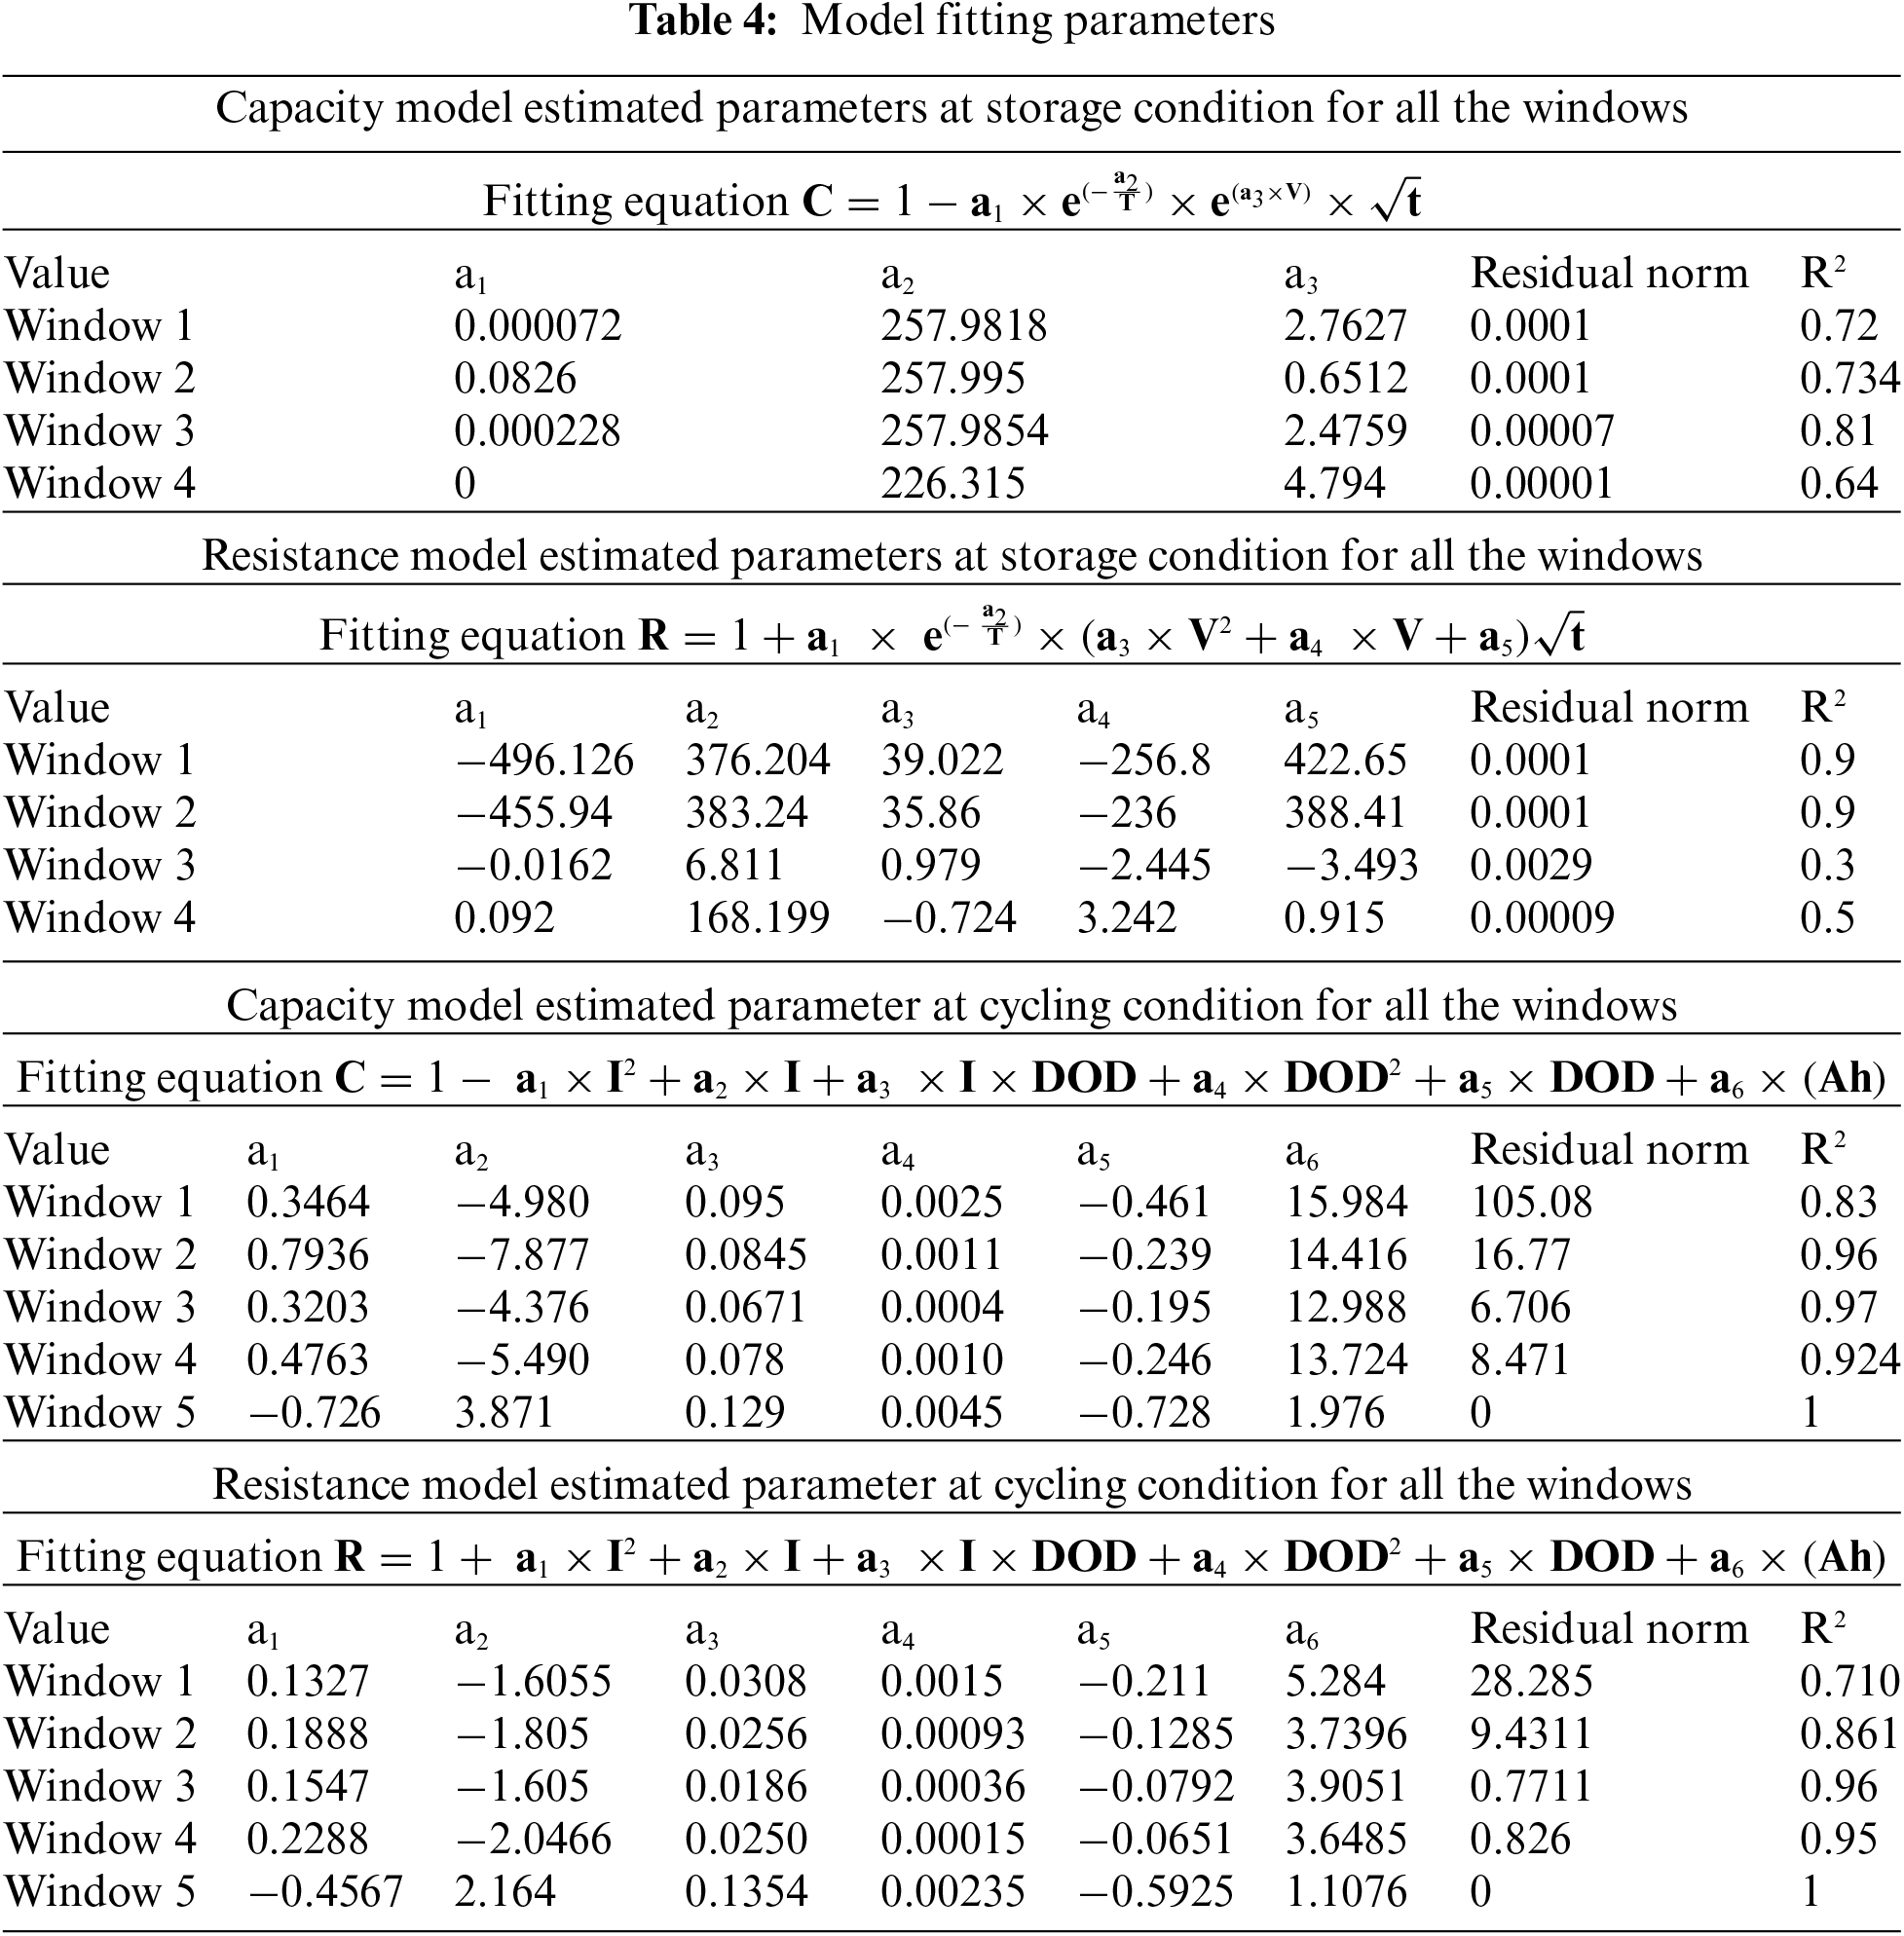
For the parameterization of the model for capacity and resistance for cycling and storage conditions, the data is divided in chunks for all conditions based on analysis of data having linear trend. For storage, the data is divided into days and the length of the first chunk is around 2 to 3 months for all other chunks.
For cycling, the chunks are divided based on equal length of 1000 Ah. Whenever new conditions are detected then the model starts to adapt for new parameters. The parameters for capacity and resistance for all chunks in shown in Tab. 4.
6.3 Self-Adaptive Characteristics-map Using Look-up Table
The models of the battery are either inaccurate or have complexity with a high number of parameters. The characteristic map is not always suitable for real-time applications. The cranking capability as a function of time is the example of a characteristic map. The drawback of this approach is that the characteristic map loose validity with time and we need to update it accordingly for the results to be accurate [12].
For the implementation of the lookup table approach, the model for capacity and resistance is the same as in the previous section. A two-dimensional lookup table is used having values corresponding to T, V at all conditions. If there is an error then the past table will be updated based on final error values updated based on past a smoothing function is used [13]. A smoothing function is also used for up-gradation. If no error is detected then update the initial characteristic based on prediction, as presented in Fig. 7.
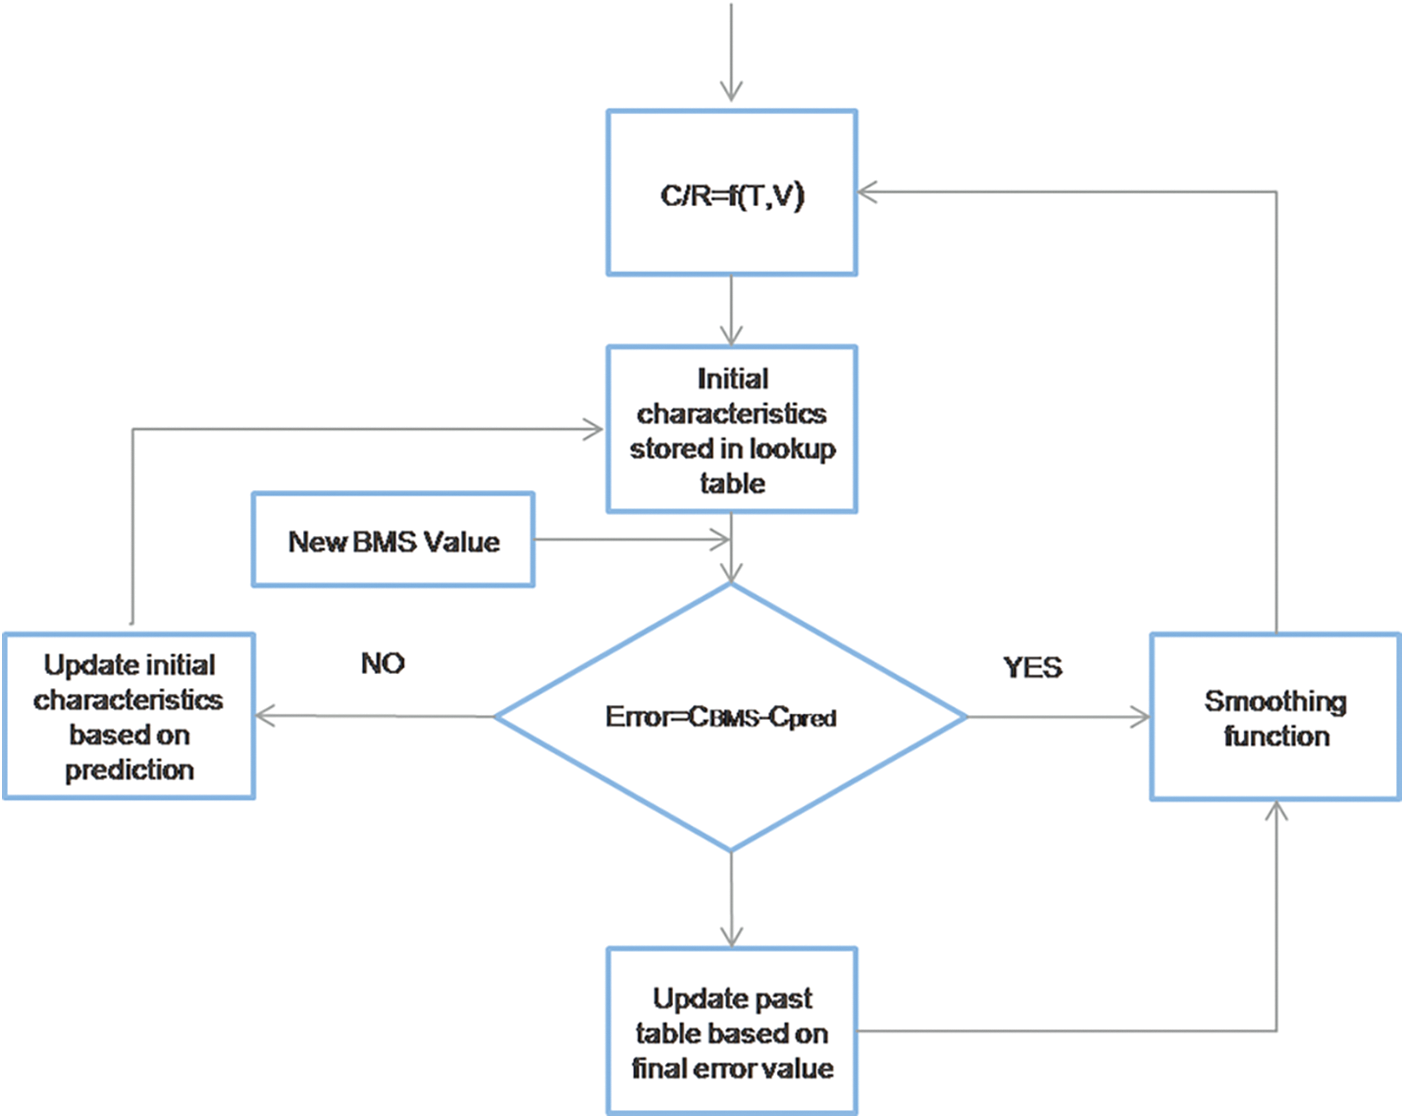
Figure 7: Hierarchy of adaptive characteristic-map
In the next section, we will discuss the recalibration of the model through a normalized least mean squares filter.
6.4 Recalibration–Normalized Least Mean Square (NLMS) Filter
The obtained aging model is accurate for relative values but not for absolute values, as the fitting process is carried out in relative terms. There could be the possibility of differences between the predicted and estimated values. So, the model needs to be recalibrated whenever differences are detected. Recalibration is not directly possible so a normalized least mean square filter is utilized. Through the NLMS filter, the weights are calculated and these weights are further used to reduce the error, as presented in Fig. 8 [13].
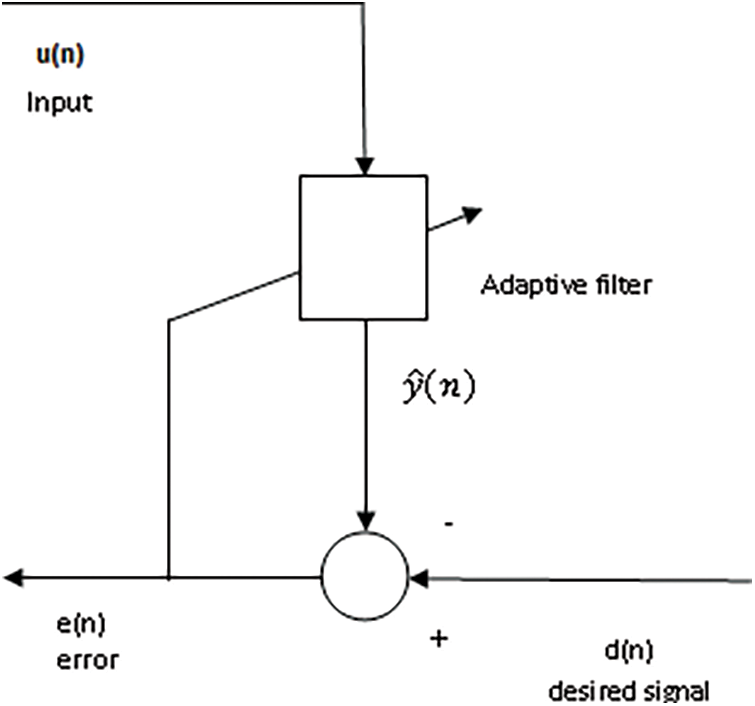
Figure 8: Normalized least mean square (LMS) filter algorithm
The filter is defined as:
The error between can be calculated by the relation:
where
The next section presents the simulation results of all the implemented approaches.
The selected models of all approaches for capacity and resistance have been implemented in MATLAB/Simulink©. All approaches are validated with real driving profiles. The data used for the parameterization and validation is different. For validation of all the models, different driving profiles have been used to compare the accuracy to select among the most optimum approach in our specific scenario.
For the non-linear model, the validation results can be seen from Fig. 9 for capacity and resistance. The results are compared with and without recalibration and we can see that the error is further reduced by using the recalibration approach. The validation data is for 80 days period and we can see that for a longer validation the error is reduced to half by using the recalibration.
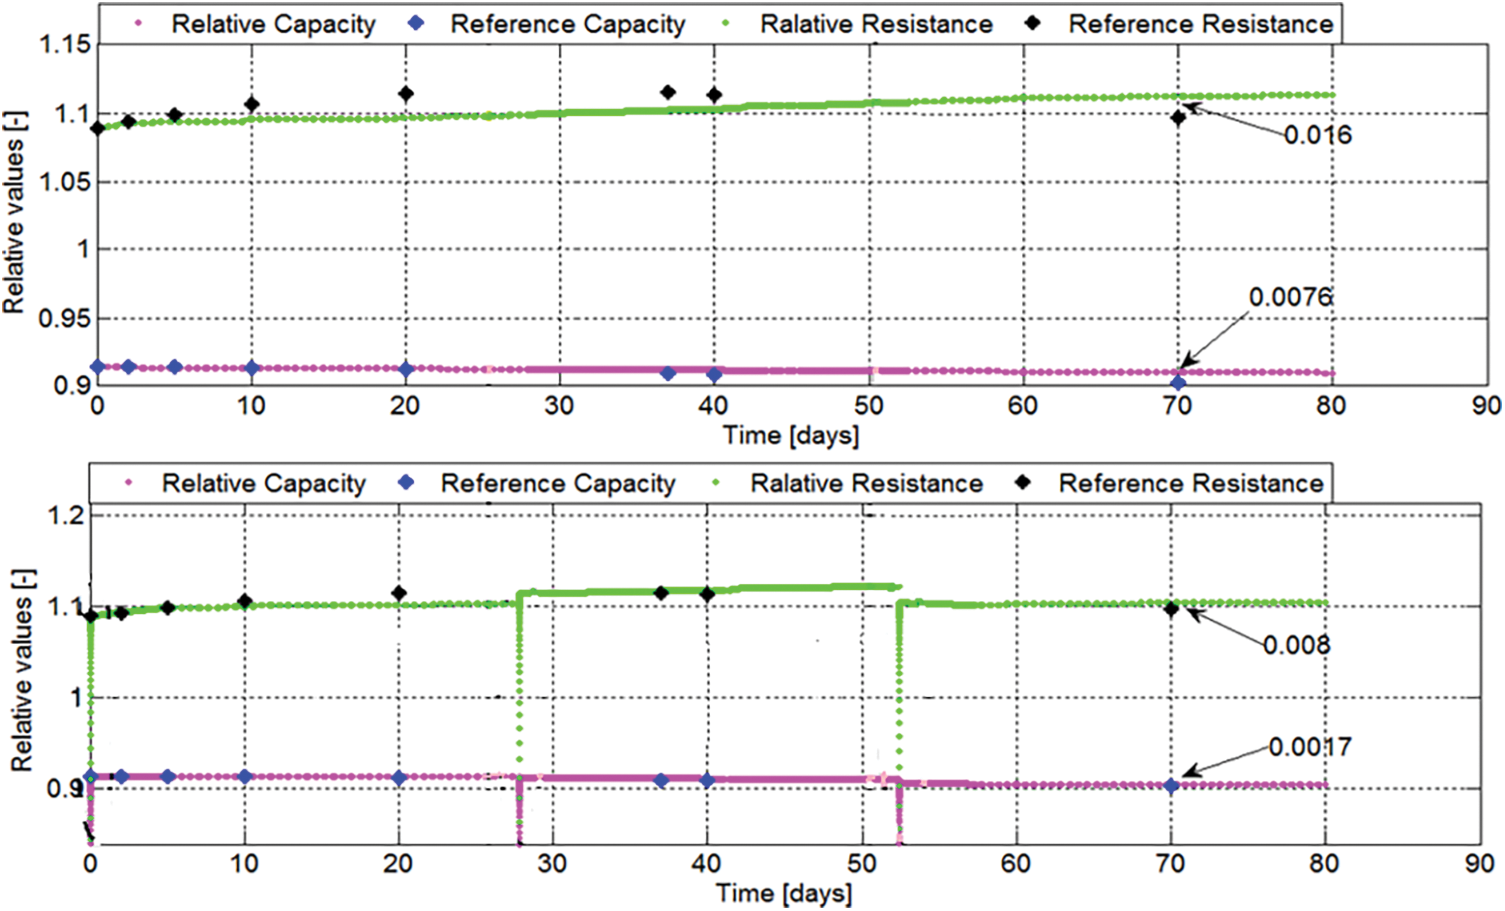
Figure 9: Non-linear model validation results
From Fig. 10 we can see the longer validation by using the window-based approach with and without recalibration. The temperature trends are also highlighted in the plot. By analyzing the longer validation of 200 days we can see that the error in the resistance is more compared with the capacity. The reason for this variation is the highly non-linear behavior of resistance specifically during cycling but not limited to cycling only. In the scenario of resistance more variations are observed and are more difficult to model resistance compared to capacity. By using the recalibration approach the results of resistance and capacity are further improved but recalibration. So, the window-based approach is better compared to the conventional approach, and recalibration of the model is necessary.
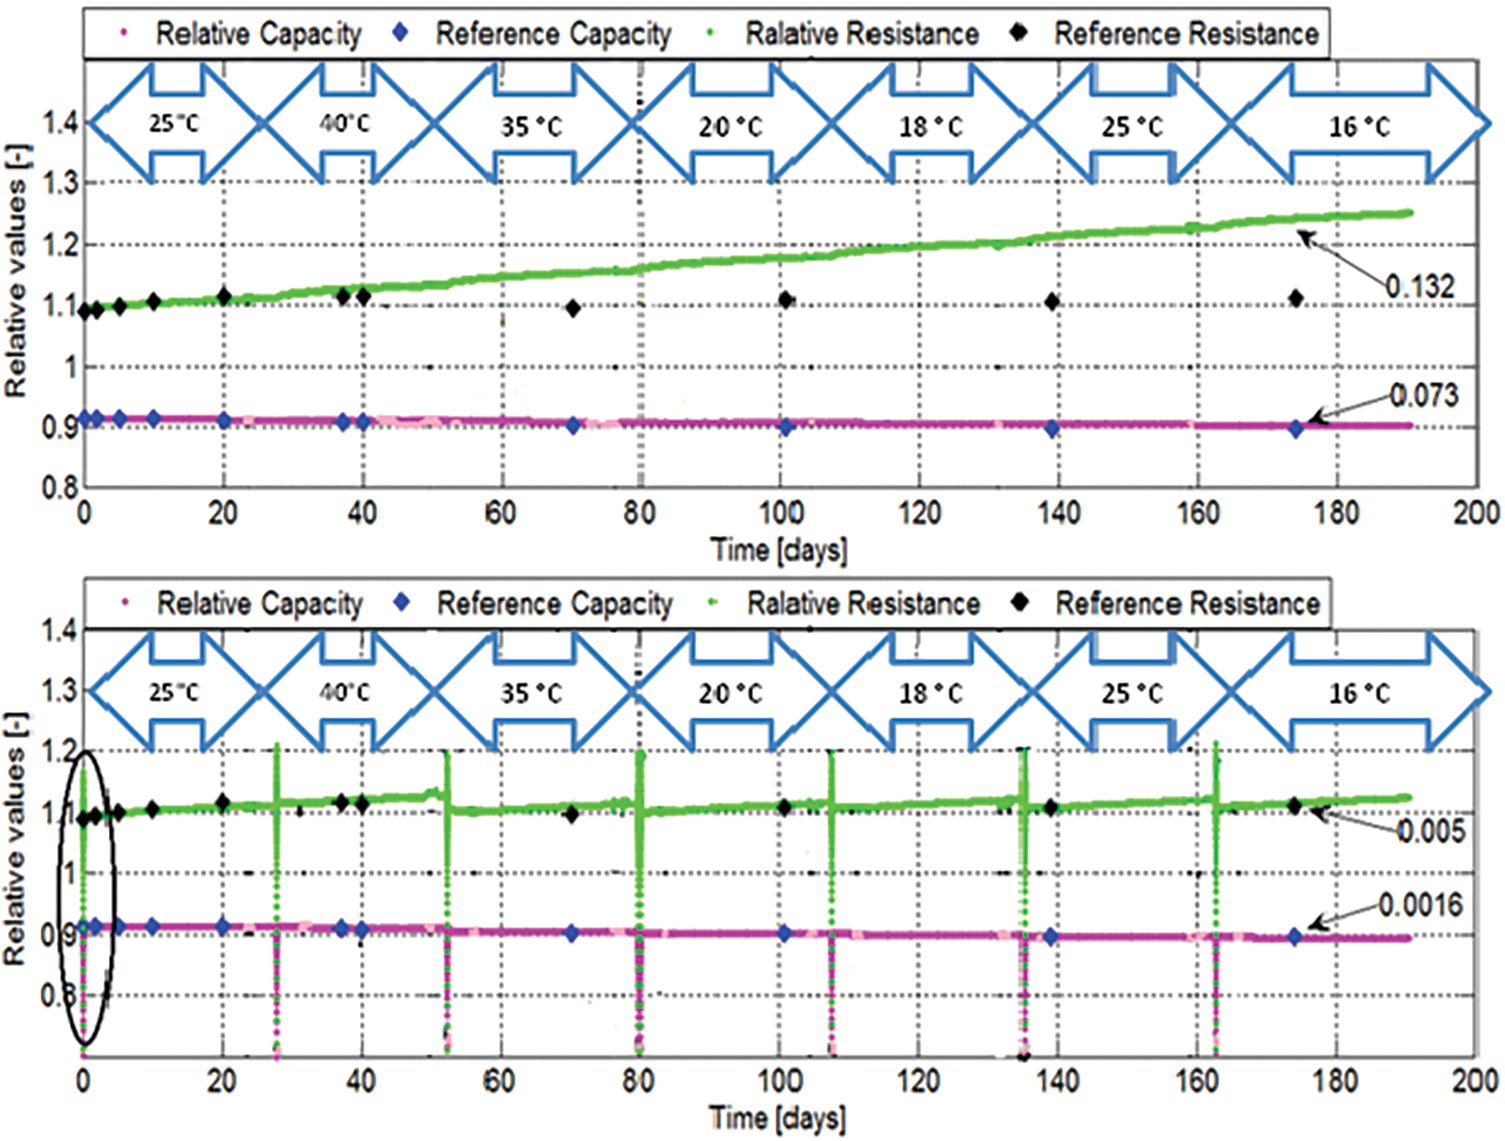
Figure 10: Non-linear model window-based validation results
The results of the characteristic map are shown in Fig. 11. The validation is for 50 days period and the results are acceptable but this approach has its limitation of up-gradation of lookup table gradually. So, the lookup table approach is not implementable in all scenarios. The same pattern can be observed as in previous approaches that more error is observed for the resistance model compared to the capacity model and results will be better by recalibration.
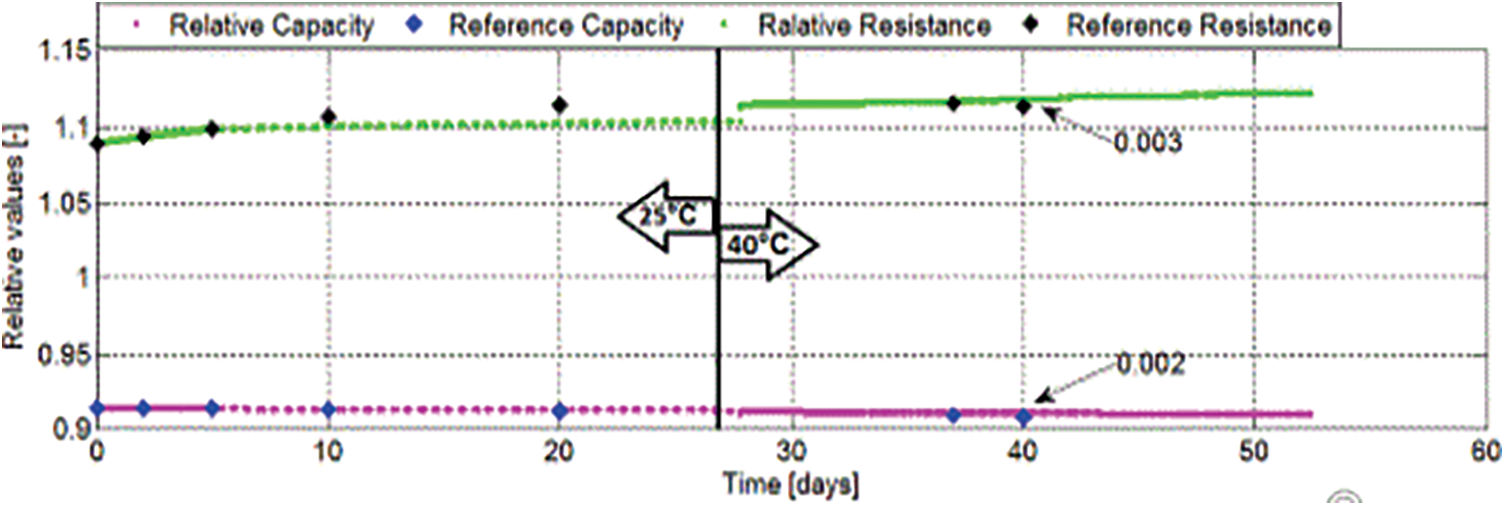
Figure 11: Characteristic map validation results
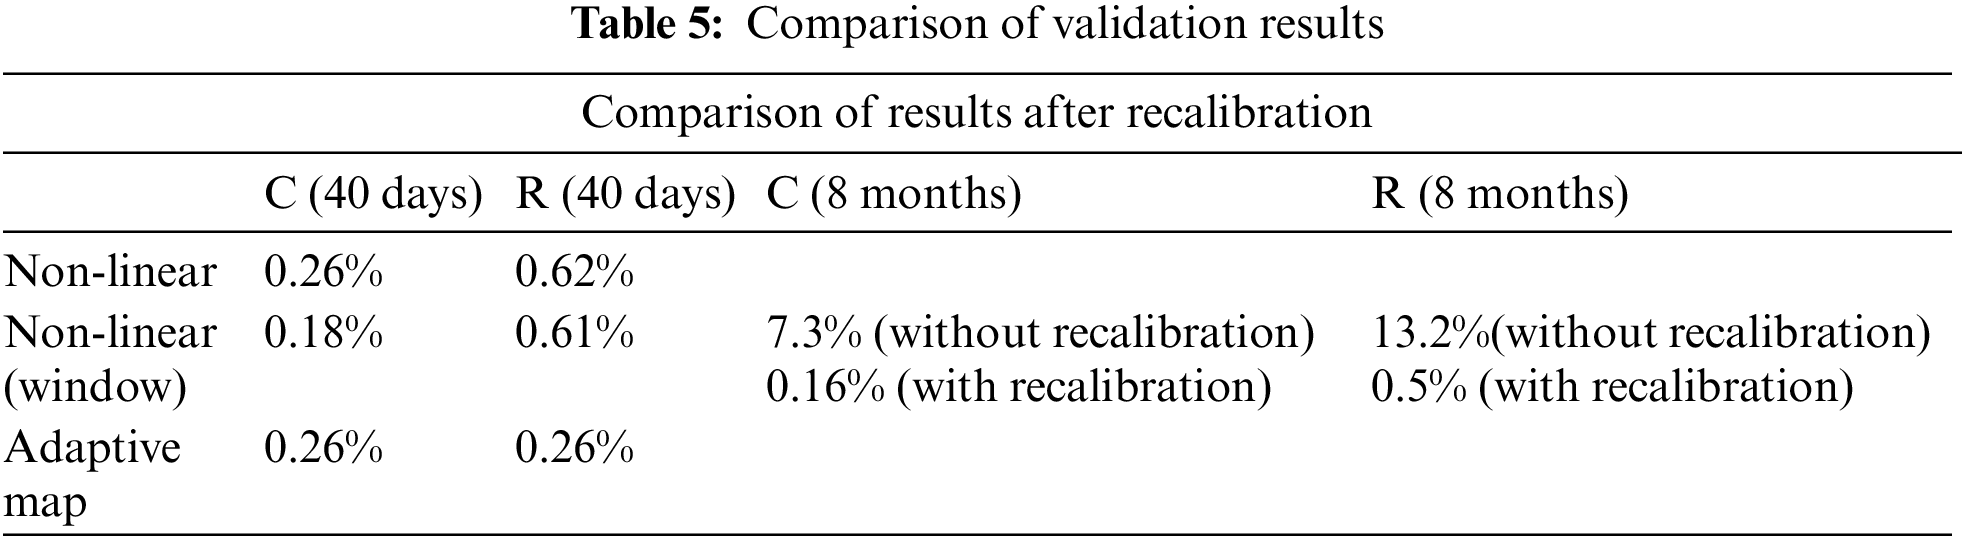
Tab. 5 summarizes the validation for all approaches by using longer data sets. For a non-linear model with a data of 40 days for capacity and resistance, the error for capacity is 0.26% and for resistance, it is 0.62%. For the non-linear approach with the window-based method, the validation data of 8 months has been used. The error for the capacity model is 0.16% and for resistance 0.5% with recalibration. For a longer validation, the results are assumed to be ideal. For an adaptive map with validation data of 40 days for resistance and capacity, the error will be 0.26% for capacity and 0.26% for resistance. So, the non-linear with window-based approach and by using recalibration is the optimized model for this specific case. Normally for a longer validation, there are few scenarios where the model diverges e.g., cycling after a rest period. In our longer validation, all uncertain behavior and temperature trends are utilized for analysis.
In-vehicle to grid scenario, the aging model is used for optimal use of batteries in storage and cycling conditions. The battery ages differently at storage and cyclic conditions. The storage aging can be reduced by supplying power to the grid if the SOC of the batteries is at higher SOC. Cyclic aging can be reduced by selecting the optimum operating conditions. An aging prediction model based on accelerated aging test data is used to select the best and optimum model having the least aging on the battery pack. In this way, the aging could be reduced and the user can earn money by supplying power back to the grid.
The aging model must be simple having fewer parameters so that it can be easily implementable in real-time systems but at the same time the model must be precise enough to accurately predict the battery parameters. Different modeling approaches have been used to compare the best optimum approach. Online approaches are complicated enough to have many parameters but the offline estimated parameters mostly lose their validity with time so they need to be adapted with the new conditions. For the validity, actual driving profile have been used and based on these profiles the non-linear model with a window-based approach was found to be the best among other approaches.
Acknowledgement: I would like to thank Dr. Dirk Uwe Sauer Professor of ISEA, RWTH University Aachen Germany and Mr. Andrea Marongiu of “Electrochemical Energy Conversion and Storage Systems” (ISEA) RWTH University Aachen Germany for allowing me to use their research lab facilities and providing data sets for further analysis.
Funding Statement: The authors received no specific funding for this study.
Conflicts of Interest: The authors declare that they have no conflicts of interest to report regarding the present study.
1. G. Bridgewater, M. J. Capener, J. Brandon, M. J. Lain, M. Copley et al., “A comparison of lithium-ion cell performance across three different cell formats,” Batteries, vol. 7, no. 2, pp. 38, 2021. [Google Scholar]
2. S. Atalay, M. Sheikh, A. Mariani, Y. Merla, E. Bower et al., “Theory of battery ageing in a lithium-ion battery: Capacity fade, nonlinear ageing and lifetime prediction,” Journal of Power Sources, vol. 478, pp. 229026, 2020. [Google Scholar]
3. T. Gewald, A. Candussio, L. Wildfeuer, D. Lehmkuhl, A. Hahn et al., “Accelerated aging characterization of lithium-ion cells: Using sensitivity analysis to identify the stress factors relevant to cyclic aging,” Batteries, vol. 6, no. 1, pp. 6, 2020. [Google Scholar]
4. X. Hu, L. Xu, X. Lin and M. Pecht, “Battery lifetime prognostics,” Joule, vol. 4, no. 2, pp. 310–346, 2020. [Google Scholar]
5. D. Werner, S. Paarmann, A. Wiebelt and T. Wetzel, “Inhomogeneous temperature distribution affecting the cyclic aging of li-ion cells. Part II: Analysis and correlation,” Batteries, vol. 6, no. 1, pp. 12, 2020. [Google Scholar]
6. B. Sovacool, L. Noel, J. Axsen and W. Kempton, “The neglected social dimensions to a vehicle-to-grid (V2G) transition: A critical and systematic review,” Environmental Research Letters, vol. 13, no. 1, pp. 013001, 2018. [Google Scholar]
7. R. -E. Tudoroiu, M. Zaheeruddin, N. Tudoroiu and S. -M. Radu, “SOC estimation of a rechargeable li-ion battery used in fuel cell hybrid electric vehicles—Comparative study of accuracy and robustness performance based on statistical criteria. Part II: SOC estimators,” Batteries, vol. 6, no. 3, pp. 41, 2020. [Google Scholar]
8. D. Geringer, P. Hofmann, J. Girard, E. Trunner and W. Knefel, “Aging investigations and consideration for automotive high power lithium-ion batteries in a 48 V mild hybrid operating strategy,” Automotive and Engine Technology, vol. 6, pp. 219–234, 2021. [Google Scholar]
9. A. Allam and S. Onori, “Online capacity estimation for lithium-ion battery cells via an electrochemical model-based adaptive interconnected observer,” IEEE Transactions on Control Systems Technology, vol. 29, no. 4, pp. 1636–1651, 2021. [Google Scholar]
10. Y. Ye, H. Ma and J. Yang, “Research on accurate model of lithium battery,” in Chinese Control and Decision Conf. (CCDC), Hefei, China, pp. 1966–1970, 2020. [Google Scholar]
11. X. Lu, A. Bertei, D. Finegan, C. Tan, S. Daemi et al., “3D microstructure design of lithium-ion battery electrodes assisted by X-ray nano-computed tomography and modelling,” Nature Communications, vol. 11, no. 1, pp. 1–13, 2020. [Google Scholar]
12. T. Stubler, A. Lahyani and A. Zayoud, “Lithium-ion battery modeling using CC–CV and impedance spectroscopy characterizations,” Applied Sciences, vol. 2, no. 5, pp. 817, 2020. [Google Scholar]
13. A. Unagar, Y. Tian, M. A. Chao and O. Fink, “Learning to calibrate battery models in real time with deep reinforcement learning,” Energies, vol. 14, no. 5, pp. 1361, 2021. [Google Scholar]
 | This work is licensed under a Creative Commons Attribution 4.0 International License, which permits unrestricted use, distribution, and reproduction in any medium, provided the original work is properly cited. |