DOI:10.32604/cmc.2022.029727
| Computers, Materials & Continua DOI:10.32604/cmc.2022.029727 | |
| Article |
Aortic Dissection Diagnosis Based on Sequence Information and Deep Learning
1Central South University of Forestry and Technology, Changsha, 410004, China
2The Second Xiangya Hospital of Central South University, Changsha, 410011, China
3Department of Mathematics and Computer Science, Northeastern State University, Tahlequah, 74464, USA
*Corresponding Author: Yun Tan. Email: tantanyun@hotmail.com
Received: 10 March 2022; Accepted: 26 April 2022
Abstract: Aortic dissection (AD) is one of the most serious diseases with high mortality, and its diagnosis mainly depends on computed tomography (CT) results. Most existing automatic diagnosis methods of AD are only suitable for AD recognition, which usually require preselection of CT images and cannot be further classified to different types. In this work, we constructed a dataset of 105 cases with a total of 49021 slices, including 31043 slices expert-level annotation and proposed a two-stage AD diagnosis structure based on sequence information and deep learning. The proposed region of interest (RoI) extraction algorithm based on sequence information (RESI) can realize high-precision for RoI identification in the first stage. Then DenseNet-121 is applied for further diagnosis. Specially, the proposed method can judge the type of AD without preselection of CT images. The experimental results show that the accuracy of Stanford typing classification of AD is 89.19%, and the accuracy at the slice-level reaches 97.41%, which outperform the state-of-art methods. It can provide important decision-making information for the determination of further surgical treatment plan for patients.
Keywords: Aortic dissection; deep learning; sequence information; RoI
Aortic dissection (AD) is a critical cardiovascular disease. The clinical manifestations of its patients are complex and changeable [1]. Doctors often diagnose patients’ conditions through sequential computed tomography (CT) images, which have the advantage of being as high as 96% to 100% sensitivity and specificity [2]. However, hundreds of image slices require doctors to spend a lot of time for careful preselection, which makes the doctor’s diagnosis inefficient, and even causes diagnostic errors due to the doctor’s visual fatigue [3].
At present, deep learning algorithms have achieved good performance in image classification [4], object recognition [5] and segmentation [6] tasks. In addition, a number of backbone networks such as ResNet [7] and DenseNet-121 [8] have emerged. The development trend of deep learning networks is moving towards lightweight networks such as EfficientNetV2 [9]. Many researchers have used deep learning algorithms to detect lesions such as brain tumors [10], chest abnormalities [11], breast cancer abnormalities [12] and hand bone abnormalities [13], and developed corresponding automatic detection systems [14] to achieve efficient auxiliary detection performance of medical diseases. Although these studies processed images from different medical image categories, all included the extraction process of regions of interest (RoI). The extraction of RoI can eliminate the interference of irrelevant organs in medical images and improve the detection accuracy [15]. For instance, Bal et al. [16] believed that the key to image classification lies in the extraction of RoI, and used YOLOv3 as region propose network to obtain target regions from slice images for breast biopsy cytology.
Relevant studies have shown the extraction of RoI in the diagnosis of aortic dissection disease. Xu et al. [17] proposed a detection scheme for AD, which used Mask R-CNN [18] to segment the aorta from the original CT images, and used the spatial continuity between images to screen high-quality RoI for detection. The Canny operator extracted the aortic edges to remove interference from other information such as color, shape, and size. To avoid training model bias, the number of images of AD and normal aorta was kept almost equal during model training. Due to the difference in the size of the processed images of the aortic arch (AA) and the ascending aorta (AAO) and descending aorta (DAO), the author used two ResNet-18s to detect the ascending and descending aorta and the AA respectively, and did not concentrate the detection of different aortic parts into the same model, which is inefficient. Tan et al. [19] used binarization and morphological operations to extract the RoI in order to exclude the interference of other parts on the detection of AD. The experimental results showed that DenseNet-121 had excellent performance in the detection of the ascending and descending aorta and AA. Harris et al. [20] used a convolutional neural network to train a model for slice-level classification of AD and aortic rupture. The detection method directly detected CT slices without extracting RoI, which affected its accuracy to a certain extent. Hata et al. [21] used the Xception backbone network to detect slices containing aorta, which required prior preselection of CT image slices, and pointed out its failure to classify AD disease. Yu et al. [22] used 3D U-net to segment the entire aorta, true lumen and false lumen, reshaped the 3D shape of the entire aorta, and measured the diameter of the blood vessel to help doctors better choose the size of the stent.
Due to the strong spatial correlation between a set of CT images, Zhou et al. [23] proposed a MOLS-net network for multi-label segmentation of aortic dissection, which mainly exploited the correlation between slices to guide the segmentation of slices. This work only focused on segmentation and did not make further diagnosis. On natural images, most of the work on this sequential image processing focuses on target tracking. Voigtlaender et al. [24] designed a new trajectory-based dynamic programming algorithm to model the full trajectory of a tracked object using the first frame template and re-detection of previous frame predictions. Hayashida et al. [25] proposed a motion and position map during cell tracking, matching detected cells at each frame to the motion flow. Inspired by this, we believe that the physiological characteristics of the human body determine that the aorta also presents a sequence tracking process on the image. Therefore, extracting sequence information for dissection diagnosis becomes a focus of this work.
Simultaneously, medical treatment of AD requires prior knowledge of the patient’s aortic branch involvement in order to minimize the impact of postoperative complications [26]. For example, for the treatment plan of Stanford type B aortic dissection involving left subclavian artery (LSA), Jing et al. [27] studied the effectiveness of single-branch stent-graft surgery. Zhou et al. [28] and Ge et al. [29] both investigated the risk of distal aortic enlargement in patients with aortic dissection after thoracic endovascular aortic repair and showed that patients with DeBakey II and III had a higher risk of distal thoracic aortic enlargement. Existing studies have shown that genotyping of patients with aortic dissection leads to better management of them. Therefore, this paper proposes a method for automatically diagnosing aortic dissection from continuous CT images, which can determine the type of aortic dissection and output the involved dissection site, which can efficiently assist in the formulation of aortic dissection treatment plan.
However, due to the extremely difficult construction of a large dataset and the requirement of complex medical knowledge background, there are only few deep learning-based AD detection methods [30]. The existing studies mainly have following deficiencies:
1. Most existing methods require prior preselection of CT image slices based on medical knowledge, which may result in inefficiency [31].
2. Most existing methods can only detect whether there is a dissection, and cannot recognize the aortic branch involvement and Stanford classification.
In this thesis, we proposed a two-stage AD diagnosis structure based on sequence information and deep learning. The main contributions are as follows:
1. An algorithm of sequence information extraction is proposed, which uses sequence space information to accurately identify the aorta at different locations, and further improve the detection performance.
2. A two-stage automated structure for AD detection is proposed, which can accurately diagnose the extent of dissection without preselection of CT images and can recognize the Stanford classification of AD with high accuracy. It can provide important decision-making information for the determination of further surgical treatment plan for patients.
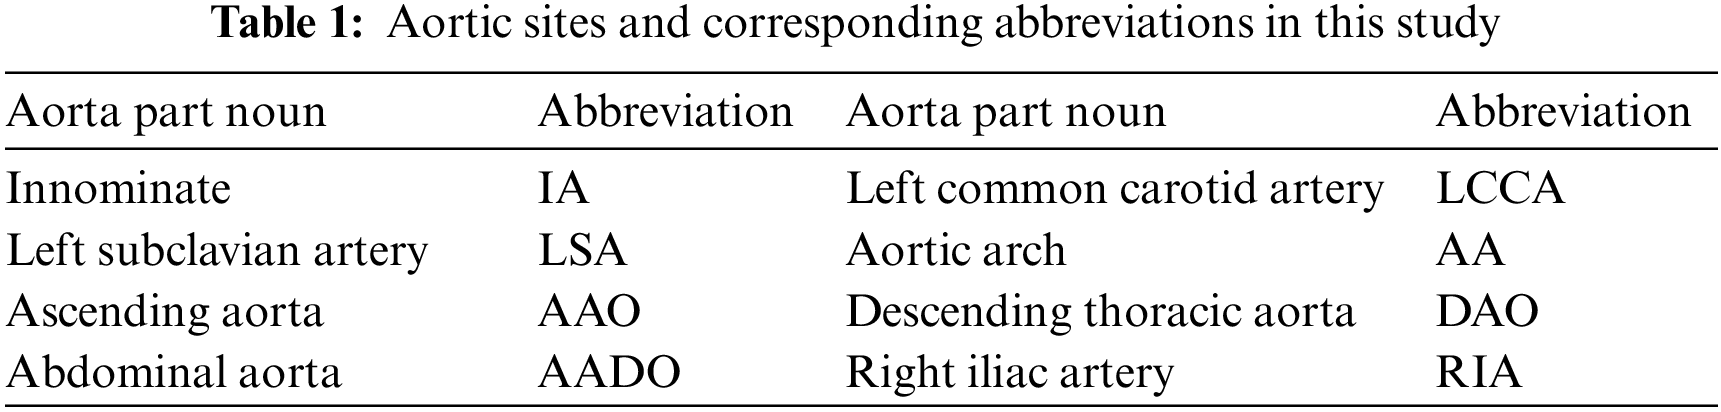
The aorta is the main artery in the human body, which transports blood to other parts of the body. AD disease is caused by the separation of the aortic wall, which allows blood to flow into a new lumen, called a “false lumen”, to distinguish the “true lumen” from the normal transfusion of the aorta [32]. In this work, we mainly study the dissection involvement of the aorta and its branches. Details of the aortic sites are shown in Tab. 1.
According to Stanford dissection classification [33], AD can be divided into type A aortic dissection (TAAD) and type B aortic dissection (TBAD), as shown in Fig. 1. TAAD involves the ascending aorta, and thoracotomy is usually considered for vascular replacement [34]. TBAD involves the descending thoracic aorta or abdominal aorta without the ascending aorta [35]. The treatment plan is indeed related to the type of aortic dissection. Therefore, the automatic recognition of Stanford classification is meaningful for AD diagnosis.
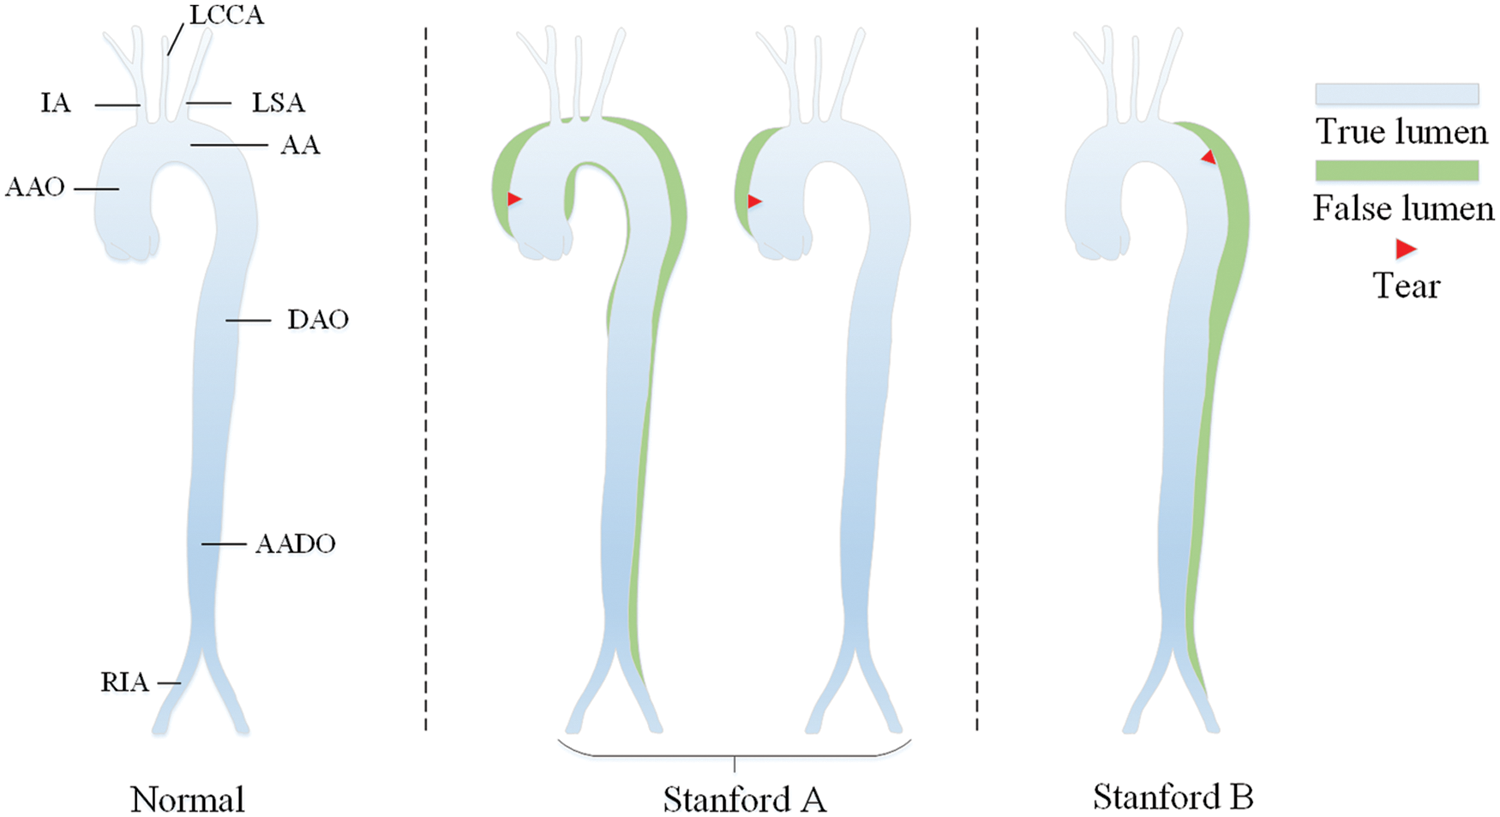
Figure 1: Stanford classification of aortic dissection
In order to achieve the purpose of diagnosing the type of AD on serial CT images of patients, we need to detect the aorta and its branches accurately. An efficient target detection algorithm is required to complete the location of the aorta.
The one-stage object detection network abandons the candidate region extraction, treats the detection problem as a regression problem, and uses a network to output the location and category. With the continuous development of the You Only Look Once (YOLO)-series, YOLOv5 [36] has achieved extremely high performance in terms of speed and accuracy, accelerating the application of object detection in downstream tasks. The YOLOv5 network structure can be roughly composed of four parts: Input, Backbone, Neck and Prediction, as shown in Fig. 2.
The Mosaic enhancement operation used by YOLOv5 at the input improves the training speed of the model and the accuracy of the network. At the same time, it proposes methods for adaptive anchor box calculation and adaptive image scaling, which enhances the model's ability to recognize targets of different scales. The structure of Backbone is shown in Fig. 2a. Compared with the backbone of YOLOv4 [37], the main improvements are the Focus module and the cross stage partial (CSP) module. The Focus module slices the input image, performs channel splicing, and then performs convolution operations. This keeps the image information intact, increases the receptive field, and speeds up model training. The design idea of the CSP module comes from cross stage partial network [38], mainly to alleviate the consumption of a large number of calculations in the inference process and improve the inference speed and accuracy. As shown in Fig. 3, the CSP module divides the input feature map into two parts, which are concatenated after convolution operations respectively. The size of the feature map is the same as the size of the input feature map, where the X under the residual units (Res) and the combined module of convolution (conv) + batch normalization (BN) + Leaky_relu (CBL) boxes represents the number of current cells.
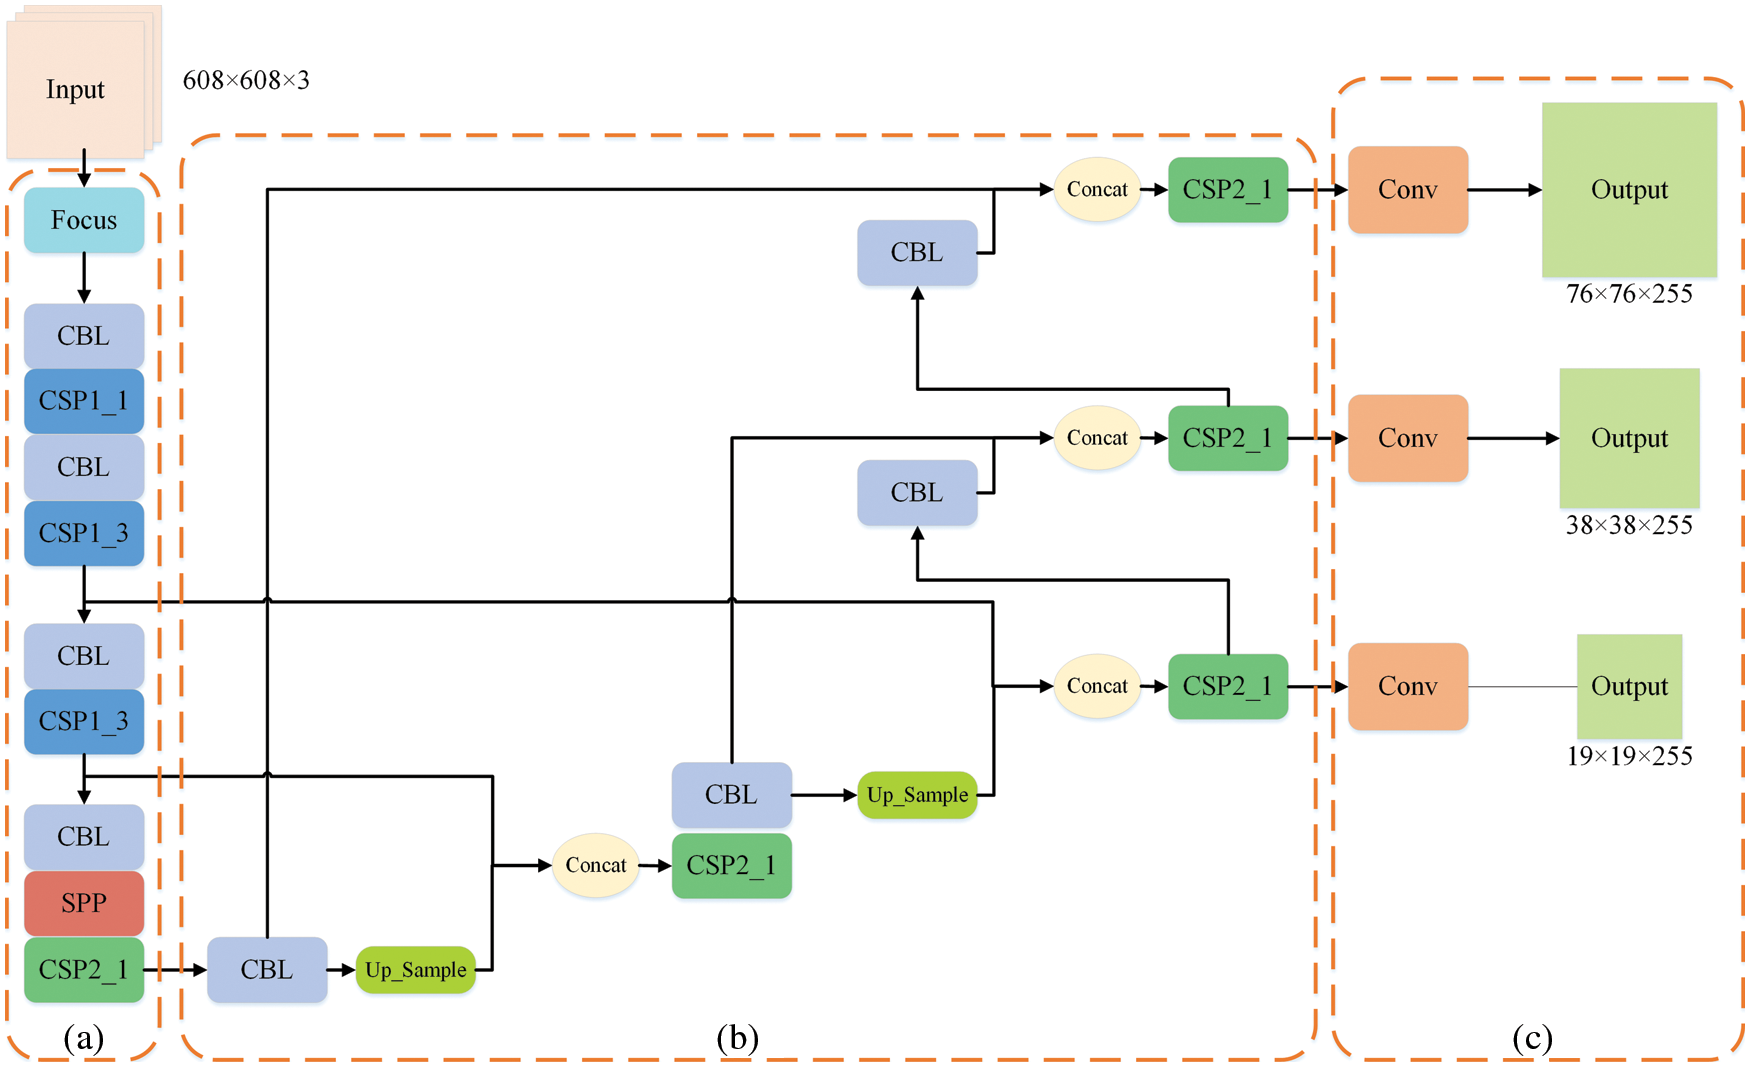
Figure 2: Structure of YOLOv5
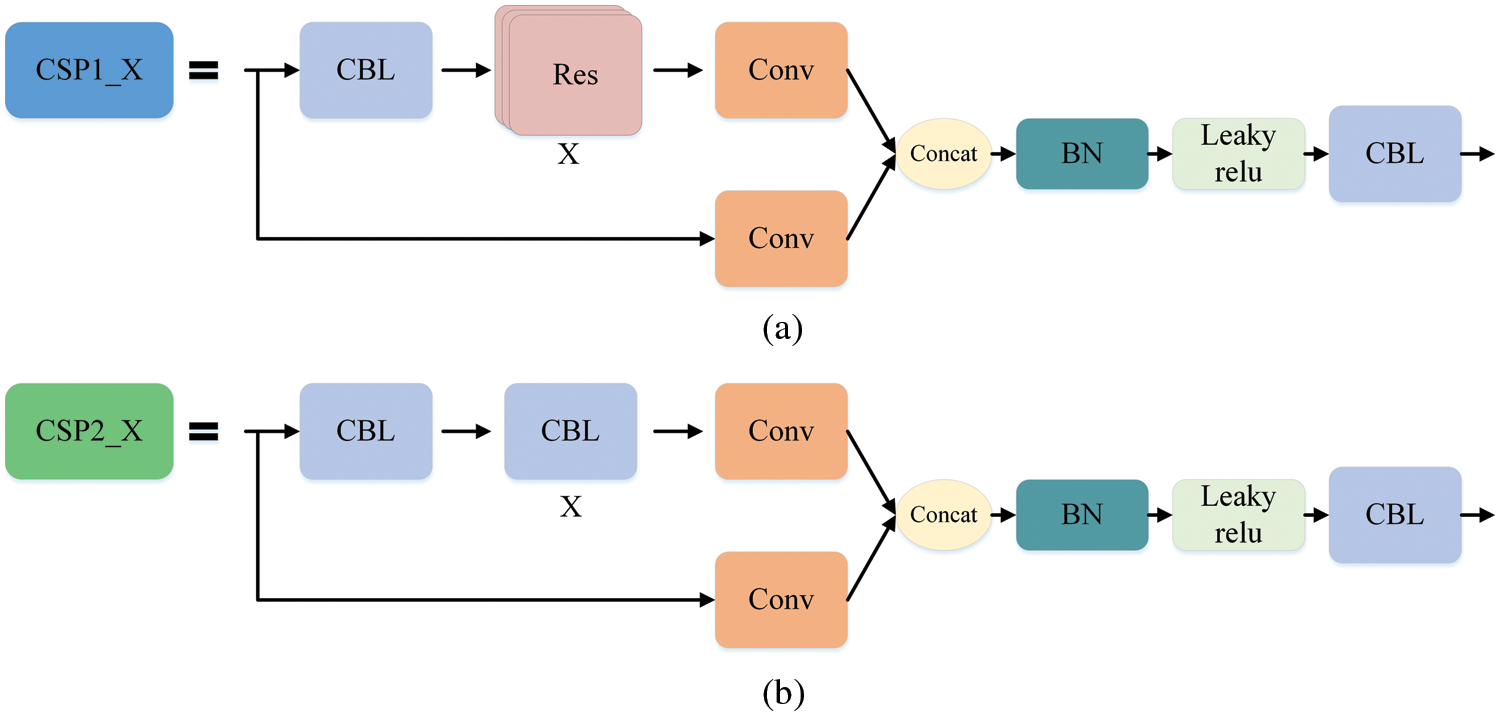
Figure 3: CSP module. Part (a) is the CSP1_X structure, which is composed of CBL and X residual units, which can better extract the deep features of the image. Part (b) is the CSP2_X structure, the only difference from CSP1_X is that it replaces the residual unit with X CBLs
The Neck structure is shown in Fig. 2b, which adopts the feature pyramid networks FPN [39] + path aggregation network PAN [40] structure to integrate features of different dimensions fully, and can output three feature maps of different sizes to detect targets of different scales. The Prediction module shown in Fig. 2c convolves the generated three-scale features to generate the final three-scale feature maps.
3 The Proposed Two-stage AD Diagnosis Structure
The proposed aortic dissection diagnosis method consists of a RoI extraction based on sequence information (RESI) module and a diagnosis network. The RESI module of the first stage uses the YOLOv5 and sequence information extraction algorithm (SIE) to track the target in the slice. It updates the detection results in real time to extract the final RoI. In the second stage, we use DenseNet-121 to diagnose the RoI to locate the dissection site in the slice and infer the diagnosis of the slice at the same time. After obtaining the diagnostic results of slices from the patient’s unscreened sequential CT images, we analyze the involved parts of AD and output the type of AD and the involvement of AD branches. The overall structure is shown as Fig. 4.
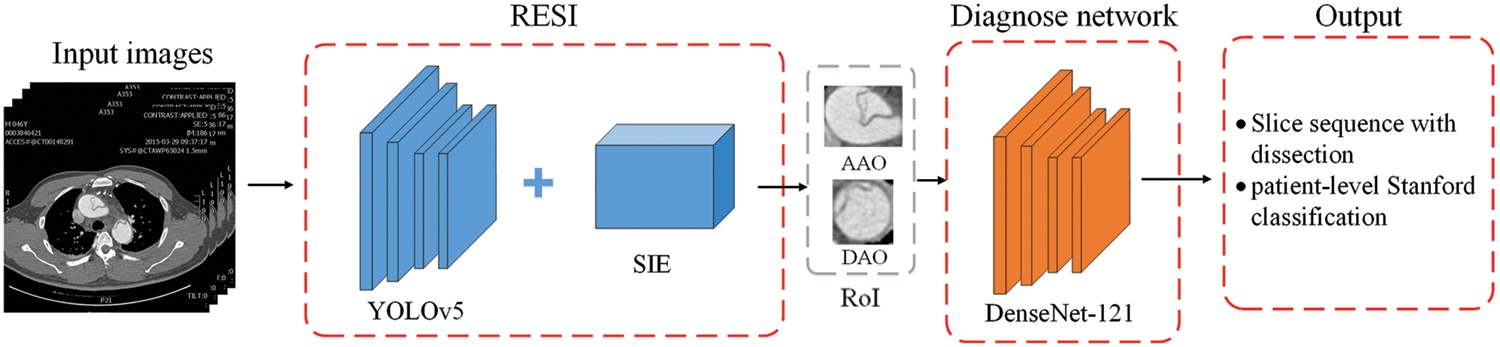
Figure 4: The overall structure of the proposed two-stage AD diagnosis method
3.1 RoI Extraction Based on Sequence Information (RESI)
The region of interest (RoI) is the key area of interest in image analysis, which is often, extracted by various operators, segmentation and detection methods. In the AD detection task, the dataset is derived from the human cross-sectional CT image as shown in Fig. 5, where the head and buttock slices are images without research targets. The presence or absence of aortic dissection disease is mainly judged by the location of the aorta in the image. These images without research targets and other irrelevant parts can easily affect the diagnosis of dissection. Therefore, we need to extract the RoI of the image. In order to exclude the influence of other irrelevant parts on the diagnosis of dissection, and take into account the detection of the involvement of dissection branches, we use YOLOv5 and a sequence information extraction algorithm (SIE) to extract the RoI in the CT sequences.
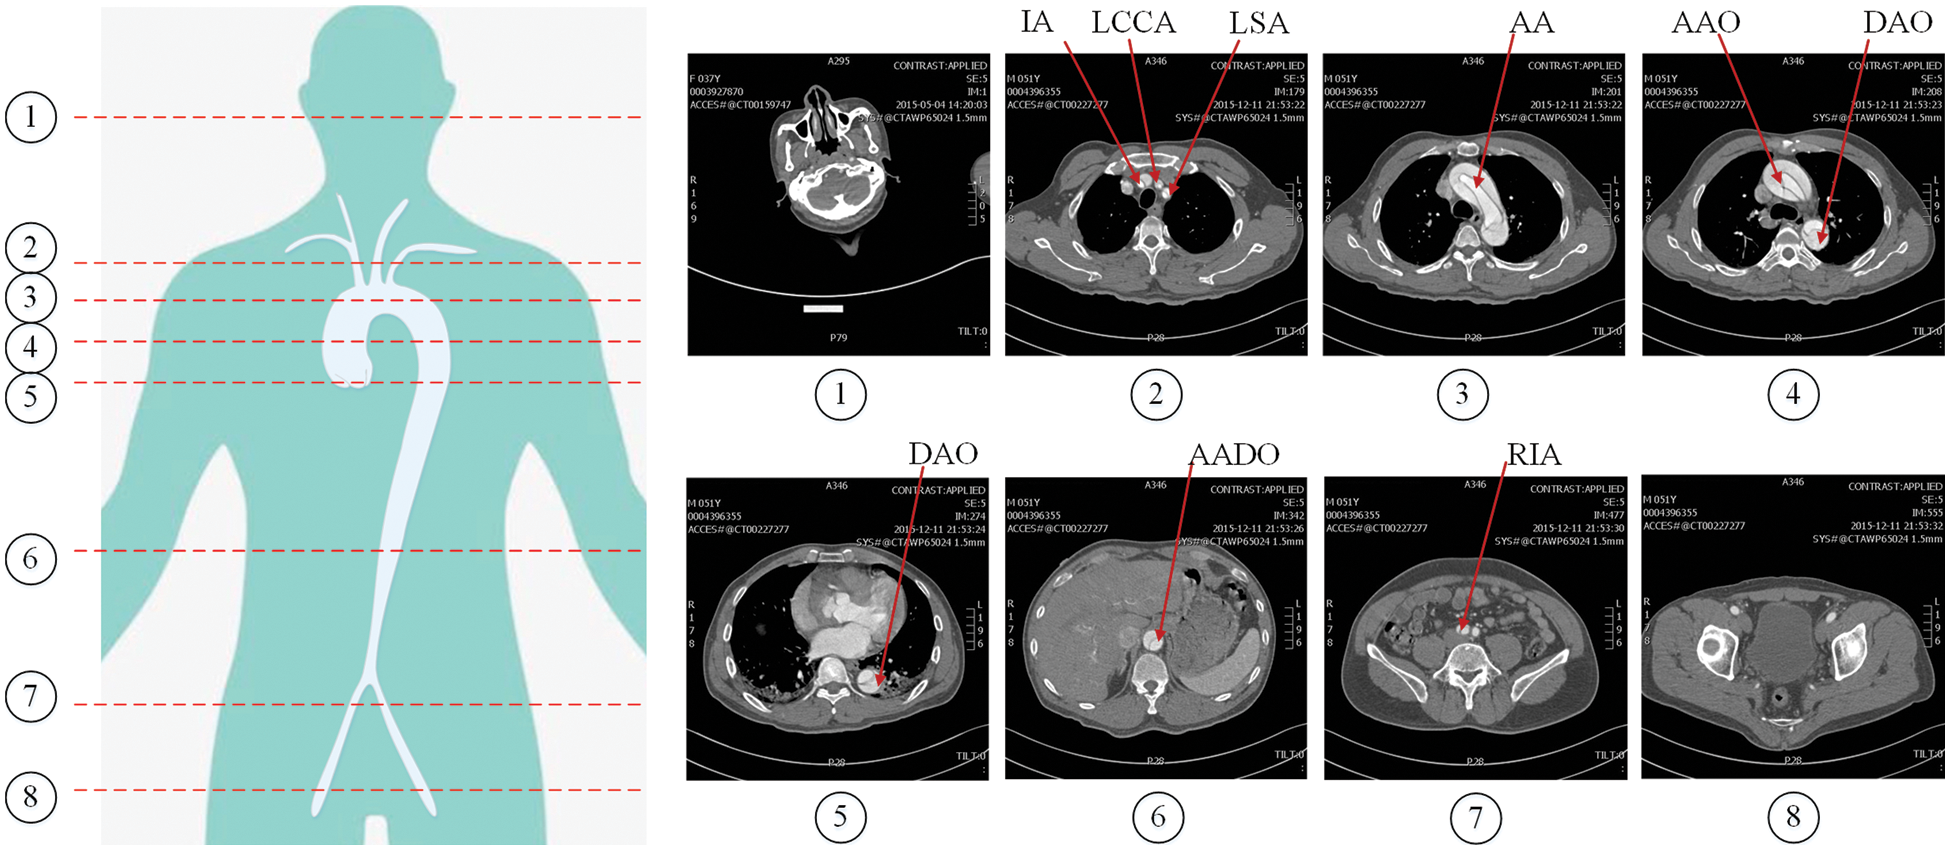
Figure 5: Cross-sectional CT image of human body. The red lines numbered 1–8 in the left figure represent different cross-sectional positions, and the corresponding images are on the right
As introduced in Section 2.2, YOLOv5 integrates computer vision components with excellent current performance in various parts, and achieves efficient detection performance. We train the model by loading the yolov5s pre-training model on the constructed dataset. However, false detections occur when the model extracts RoIs for small objects. Due to the spatial and temporal correlation of the order of aortic parts appearance in the cross-sectional CT slice, inspired by the target-tracking algorithm, SIE is proposed. We process the spatial continuity of the sequence images and the physiological characteristics of aorta in the images to improve the accuracy of RoI extraction, thereby improving the quality of AD diagnosis.
The tracking sequence is updating in real time by adding targets in adjacent slices whose IoU is greater than the threshold. As shown in Fig. 6, three cases are considered:
1. If the current slice t detects that there is an empty slice between the matching sequence targets, use the current target information and the target information in the sequence to infer the missing target, and the category of the missing target is determined according to the matching target category in the current slice, as shown in Fig. 6a.
2. If there is a target unmatched sequence in the current slice, it is removed from the detection result of the current slice, as shown by the red dotted circle in Fig. 6b.
3. If the target is not tracked in multiple consecutive slices of a sequence, we judge its legality and decide to stop tracking or delete the target in the corresponding slice to remove the target in the sequence, as shown in sequence S2 in Fig. 6c.
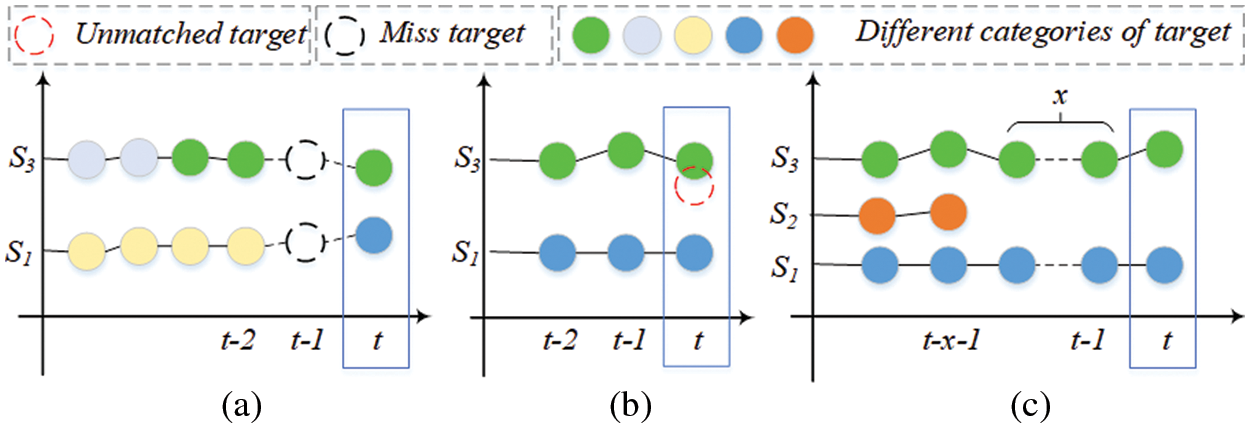
Figure 6: The principle of tracking sequence update. Different colored circles represent targets of different categories, red dotted circles are targets that do not match the sequence, and black dotted circles represent missing targets in the sequence. x represents the number of targets
For the above situations, the algorithm initializes the template
SIE Algorithm is described in Algorithm 1. The algorithm input consists of a patient’s CT image
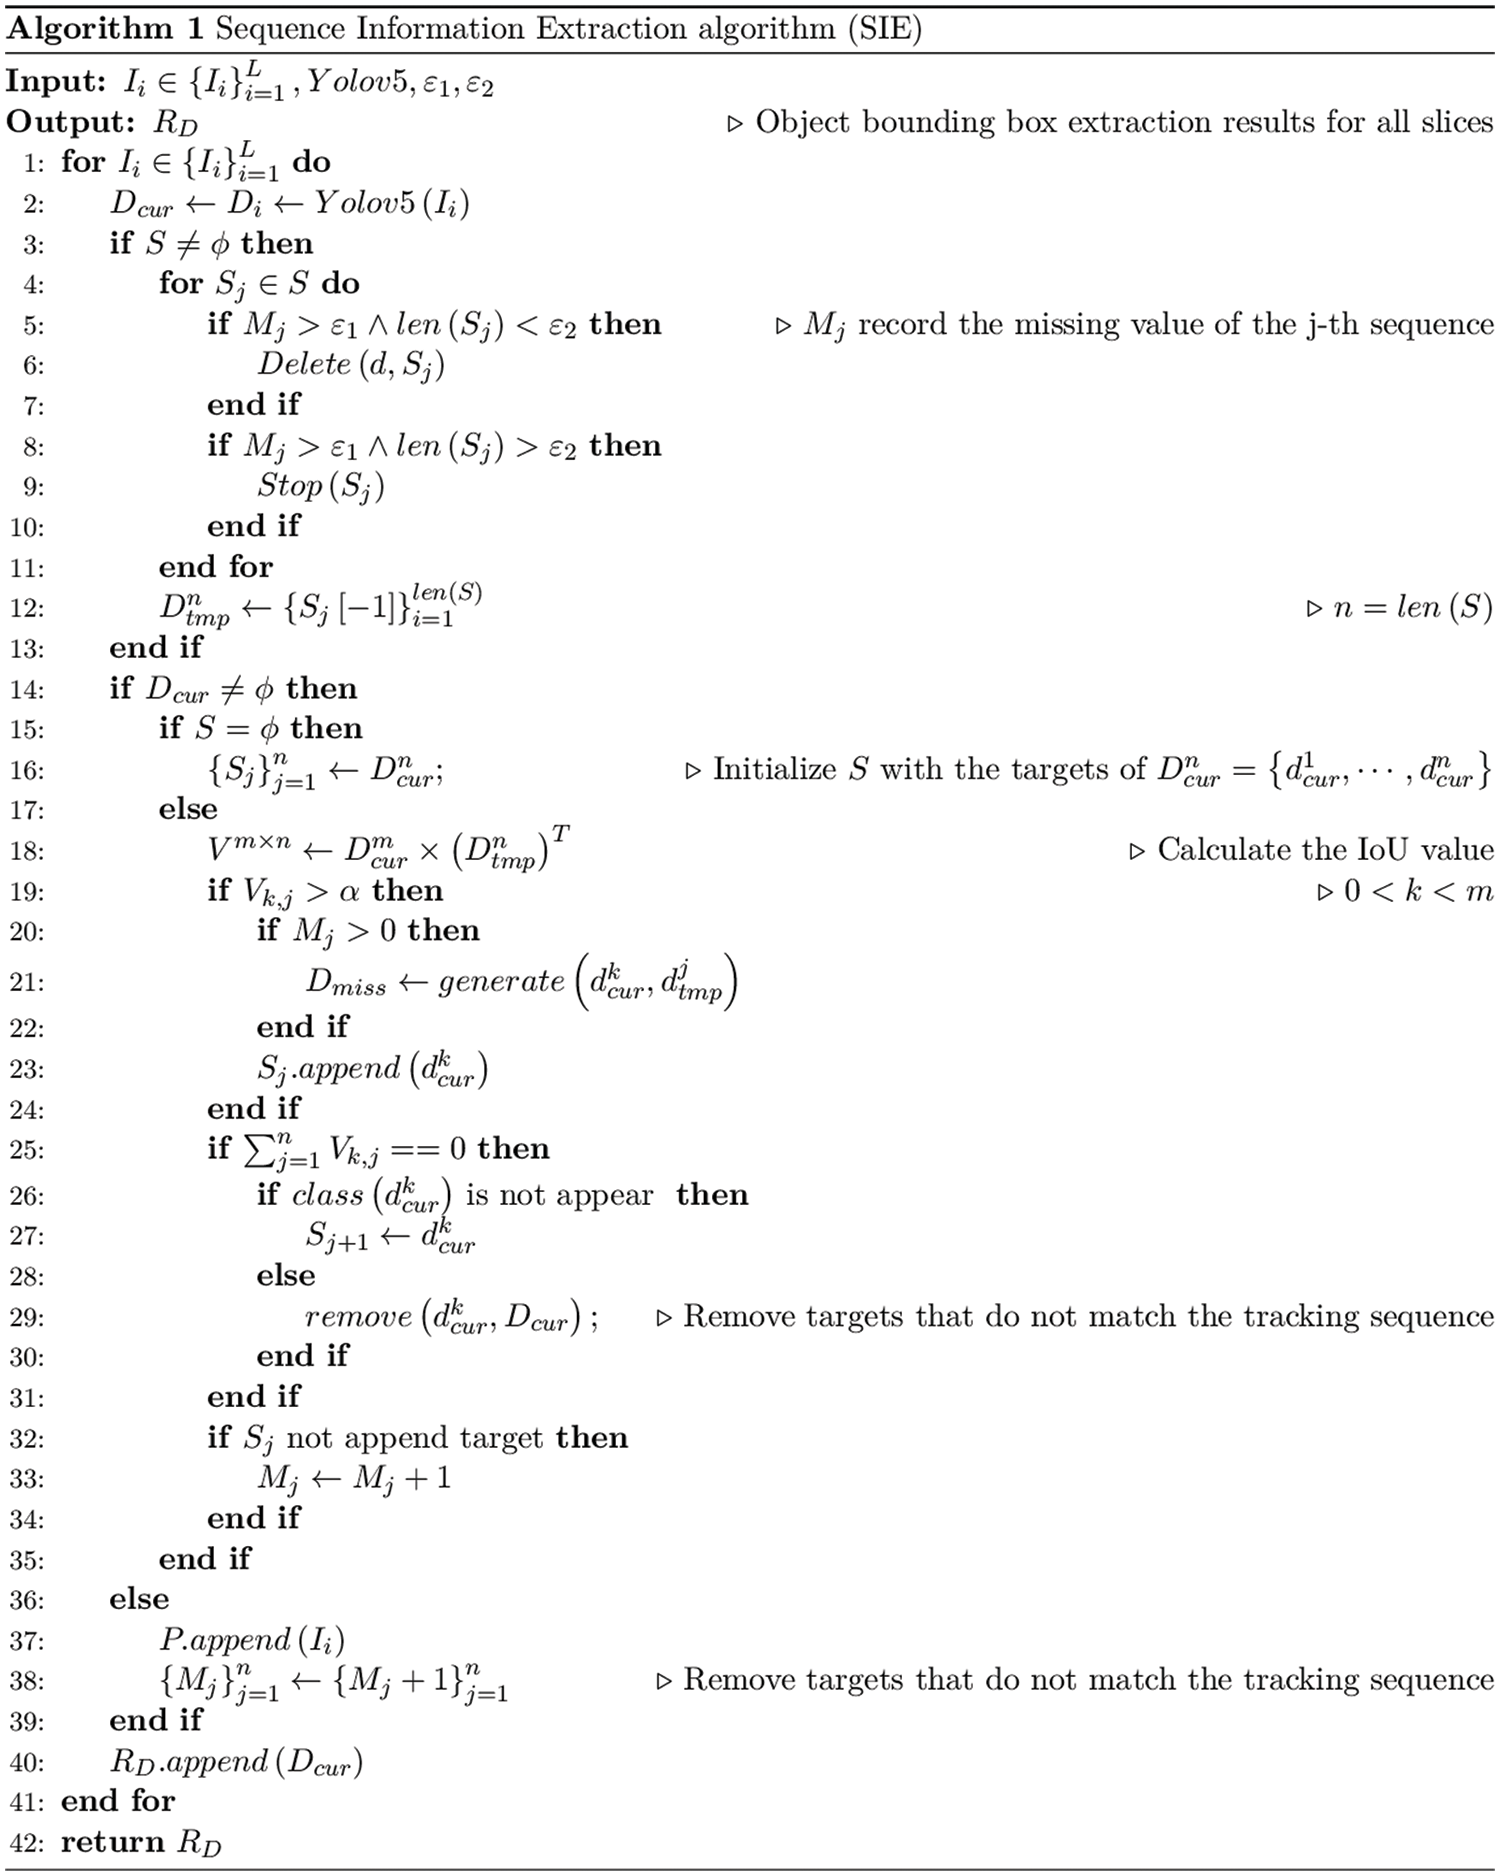
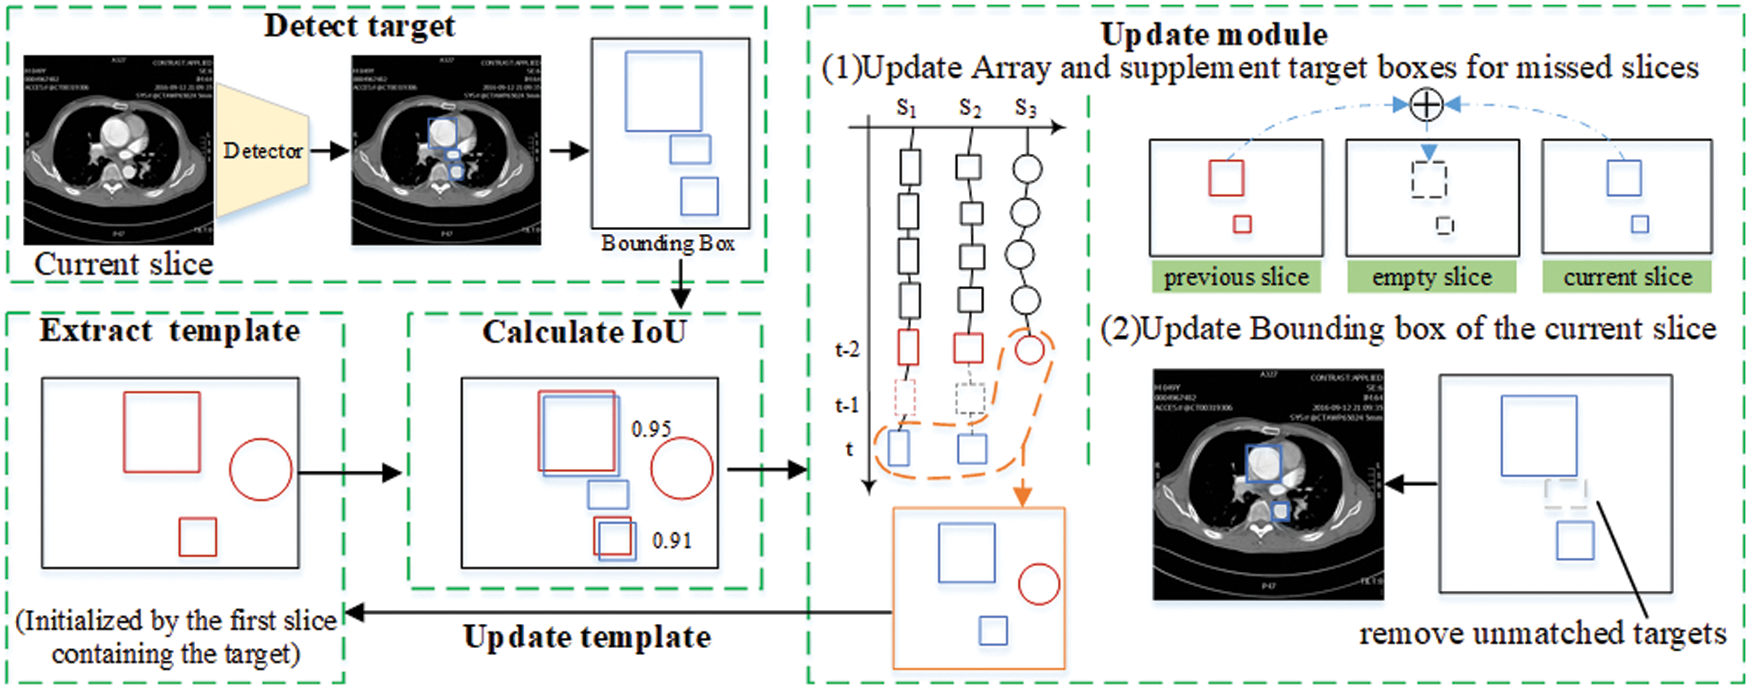
Figure 7: Sequence information extraction algorithm module
3.2 Diagnosis and Classification of Aortic Dissection
In order to diagnose AD in CT images of case series accurately, this work diagnoses the extracted RoI, and then selects the slice sequence of the lesion according to the diagnostic results of the RoI extracted from the slice. Combined with YOLOv5’s accurate identification of the target area of the aorta in the slice, we can effectively diagnose the lesion site and extent of aortic dissection.
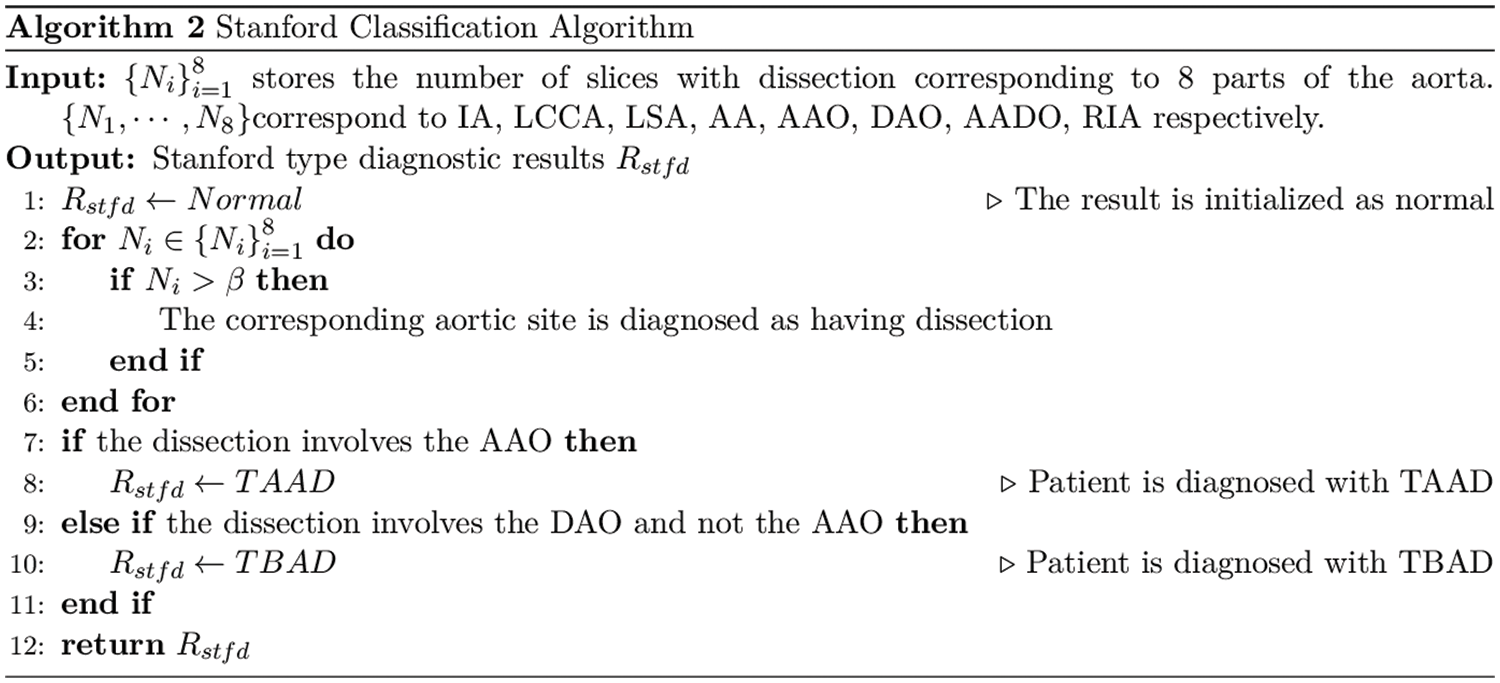
We analyze the performance of ResNet, DenseNet-121 and EfficientNetV2 on the aortic dissection dataset and finds that DenseNet-121 achieves better detection performance under the same training conditions. Therefore, this work applies DenseNet-121 to perform the final detection of RoI. We calculated the number of dissections per patient at a single aortic site based on the RoI detection and designed an algorithm for Stanford classification of the aorta, as shown in Algorithm 2.
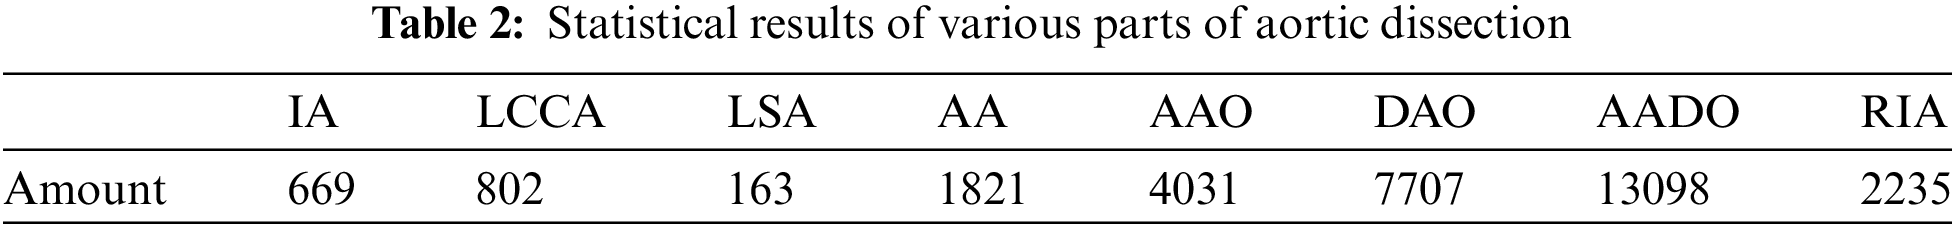
We collect the CT images of 105 patients, which including 17 normal cases, 70 TAAD cases, and 18 TBAD cases. Our dataset is unscreened CT images. The CT images of various parts of the patient are shown in Fig. 5. We provide high-quality annotations for images in the dataset. The data set adopts YOLO format and contains 8 aortic sites as described in Section 2.1. The specific statistics are shown in Tab. 2.
To balance the data samples, the training dataset has 68 patient images, consisting of 50 TAAD cases, 9 TBAD cases, and 9 normal cases. The remaining 37 cases are used as the test dataset, including 20 TAAD cases, 9 TBAD cases and 8 normal cases.
Precision (P), recall (R), F1-score (F1), accuracy (Acc) and specificity (S) are used as indicators to evaluate the performance of the method. The calculation formula is as follows, where the tp, fp, tn, fn represent true positive, false positive, true negative and false negative respectively.
4.3 Results of Aortic Target Detection
In the target detection evaluation, the Intersection-over-Union (IoU) >0.5 of the target bounding box and ground truth is regarded as correct. This work calculates the P, R and average precision (AP) values for each category separately. mAP@.5 represents the average AP value of each category when the IoU threshold is 0.5, mAP@.5: .95 represents the average accuracy calculated when multiple thresholds (0.5–0.95, step size is 0.05) are set. We compare the performance of RESI and YOLOv5 on ROI extraction, as shown in Tab. 3.
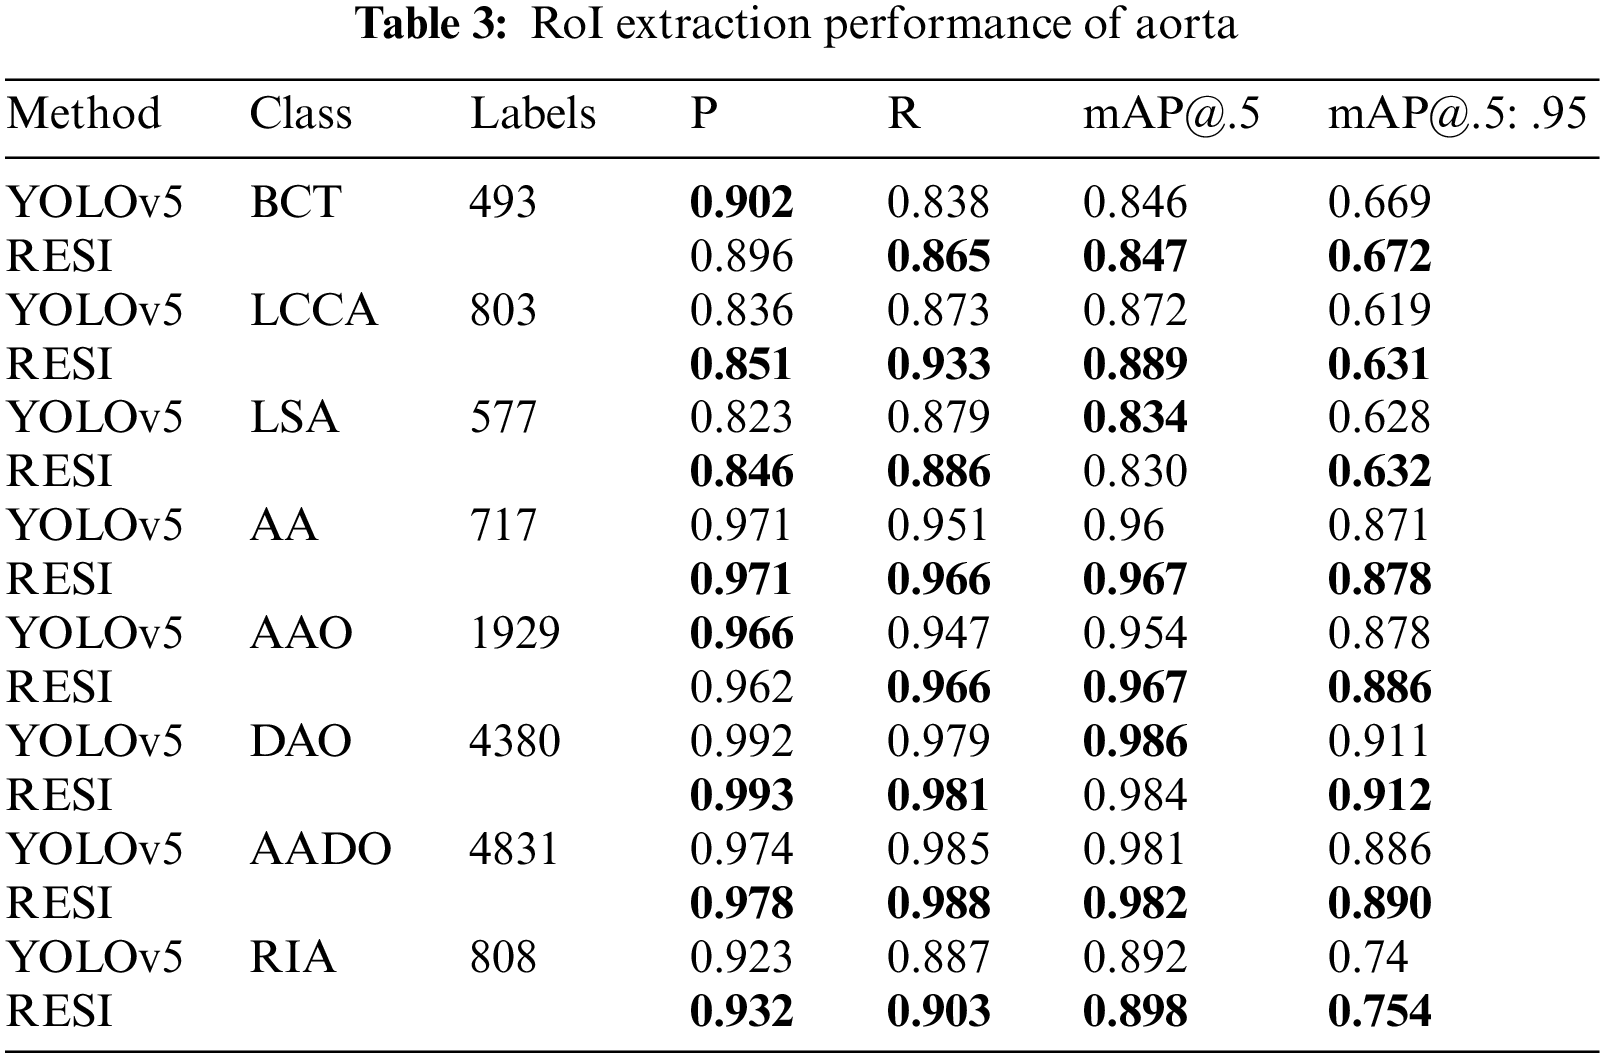
As shown in Tab. 3, the proposed RESI achieves an average improvement of 1.8 percentage points in recall and 1.1 percentage points in mAP@.5:.95. In particular, the recall on small objects such as IA, LCCA, LSA and RIA is improved by an average of 2.7 percentage points. The reason is RESI pays more attention to small objects in the sequence, which also provides a strong support for more detailed AD diagnosis.
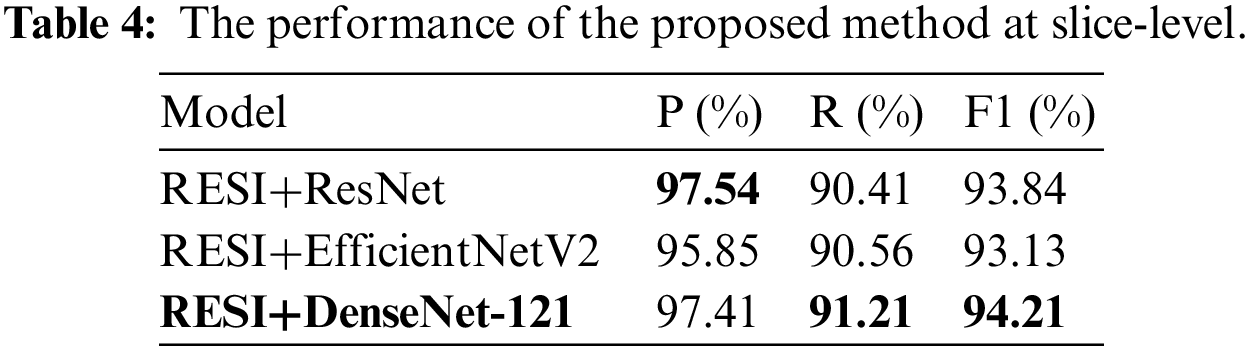
The test dataset has 37 patient cases, including 20 TAAD cases, 9 TBAD cases and 8 normal cases. We regard the slices with lesion as positive cases and non-lesion sections as negative cases. All slices belong to unscreened patient complete imaging data. The performance of the proposed method at slice-level on the test dataset is shown in Tab. 4. DenseNet-121 has the highest F1 score of 94.21%.
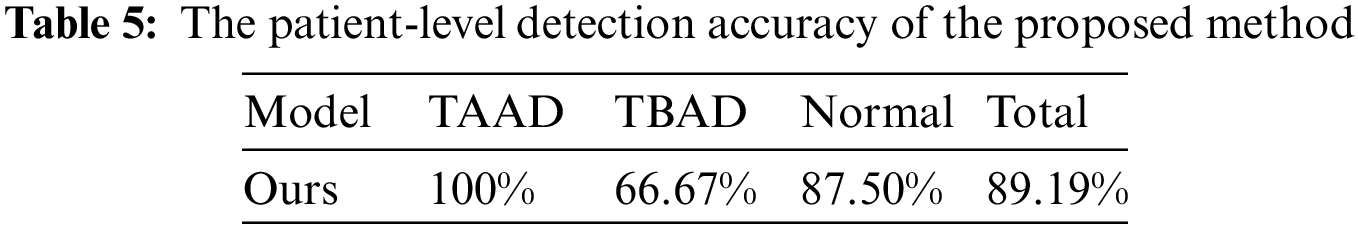
In patient-level detection, we use a threshold to determine the prevalence of aortic sites, and set the threshold to 5 for each part. We tested the Stanford classification ability of the proposed method for aortic dissection on the test dataset. The accuracy of the proposed method on the test dataset of 37 cases is shown in Tab. 5, reaching 89.19%. In the test results, two cases of TBAD and 1 normal case were diagnosed as TAAD, mainly based on the AAO site of these three cases was considered to be dissection. Due to the small number of test samples and the imbalance of TAAD, TBAD and Normal categories in training samples, the accuracy of TBAD and Normal categories is low. In addition, we inspected the falsely detected images and found that there are more artifacts in the AAO part, which is the biggest cause of false detections.
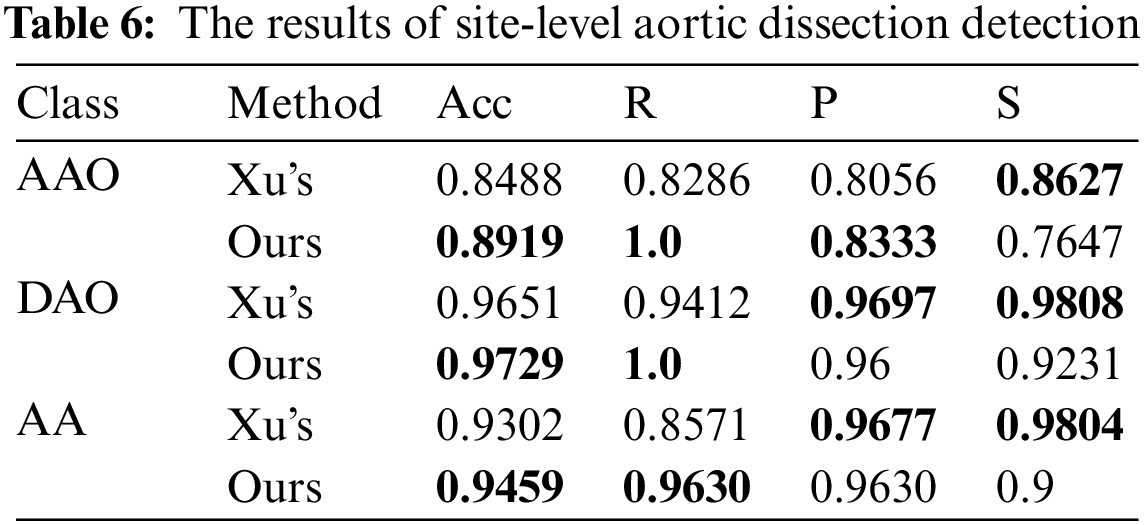
We also detect the site-level performance of the site AA, AAO and DAO without preselection. The decision thresholds are set as 5 for AAO, 5 for DAO and 3 for AA. The comparison of the detection performance of these three parts is shown in Tab. 6, and the slice of each part in Xu’s work [17] was preselect by algorithm. Without considering the differences in the test data, our method achieves better performance in part of AAO, DAO and AA. Our method significantly improves the recall rate, with an average increase of 11.20 percentage points for each part, and the score on the specificity is low, which shows that the method is easy to identify the disease-free parts as diseased. However, its diagnostic accuracy in all parts is 2.22 percentage points higher than Xu’s model [17] on average, indicating that the proposed method is generally better than the method proposed by Xu [17].
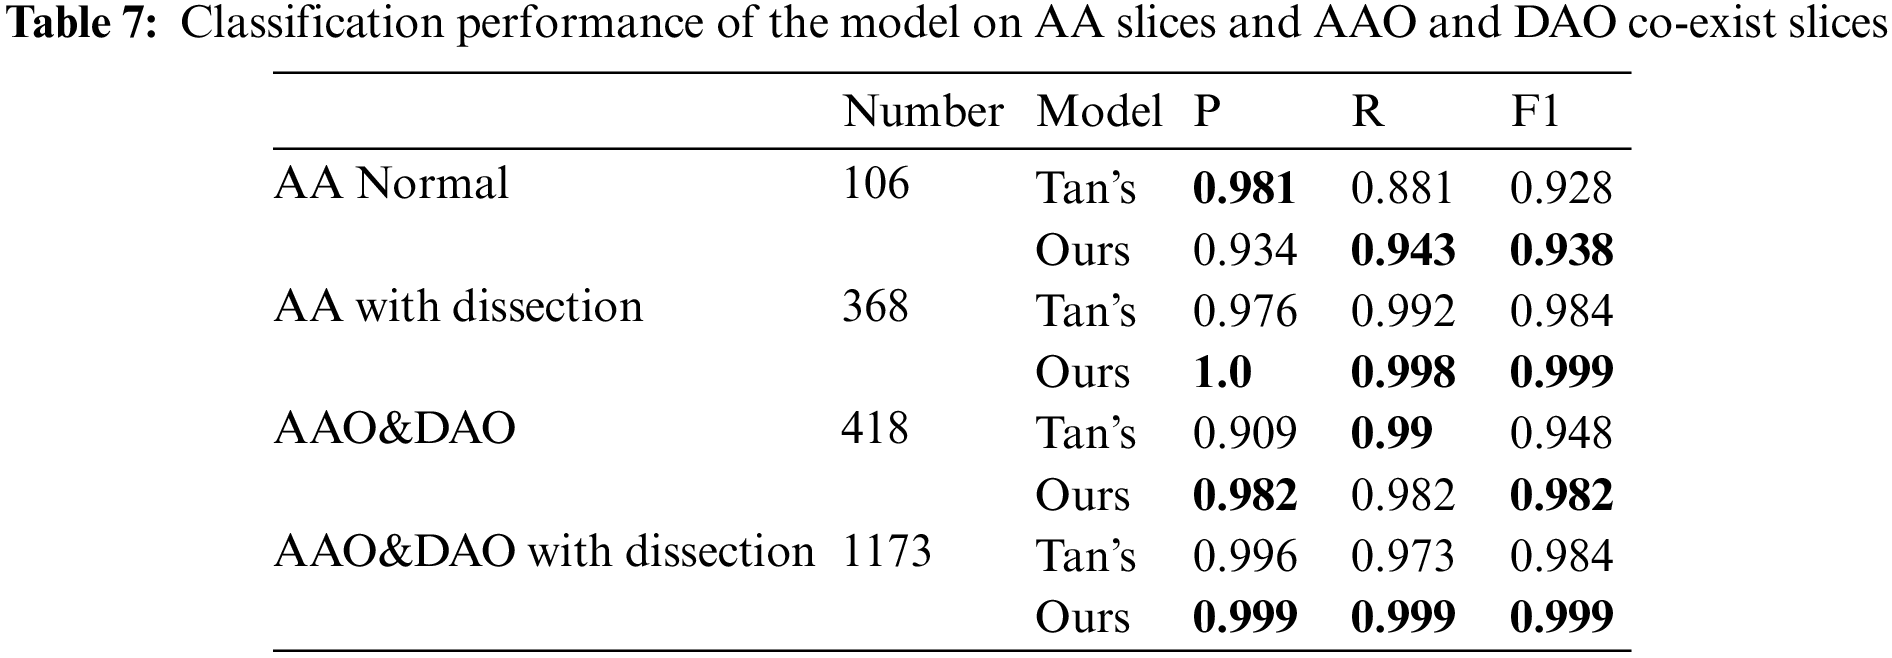
Following the experimental setup of Tan et al. [19], we perform detection on consecutive images starting from the clear outline of AA to the end of the slice where the AAO and the DAO co-exist, and the result is shown in Tab. 7. We achieve 1, 1.5, 3.4 and 1.5 percentage point improvement on AA normal slices, AA with dissection, AAO and DAO co-exist normal slices and AAO and DAO co-exist with dissection slices.
In this work, we propose a two-stage accurate diagnosis algorithm for aortic dissection. The RoI is extracted by YOLOV5 combined with the proposed sequence information extraction algorithm, and then Densenet121 is combined with the diagnosis algorithm to complete the final diagnosis. Without preselection, the accuracy of proposed method reached 97.41% at the slice-level, 89.19% at the patient-level. In particular, this method can automatically diagnose the Stanford classification of aortic dissection in a set of serial CT.
Our proposed method achieves good performance on various levels of evaluation. However, since the dataset is unscreened continuous CT images, its imaging quality has a certain impact on the experimental results. Therefore, in future work, we will further investigate the removal of artifacts from aortic diagnosis to improve data quality.
Acknowledgement: The author would like to thank the support of Central South University of Forestry & Technology, the support of The Second Xiangya Hospital of Central South University and the support of National Natural Science Fund of China.
Funding Statement: This work was supported in part by the National Natural Science Foundation of China (No. 62002392); in part by the Key Research and Development Plan of Hunan Province (No. 2019SK2022); in part by the Natural Science Foundation of Hunan Province (No. 2020JJ4140 and 2020JJ4141); in part by the Science Research Projects of Hunan Provincial Education Department (No. 19B584); in part by the Postgraduate Excellent teaching team Project of Hunan Province [Grant [2019] 370-133].
Conflicts of Interest: The authors declare that they have no conflicts of interest to report regarding the present study.
1. F. F. Mussa, J. D. Horton, R. Moridzadeh, J. Nicholson, S. Trimarchi et al., “Acute aortic dissection and intramural hematoma: A systematic review,” JAMA, vol. 316, no. 7, pp. 754–763, 2016. [Google Scholar]
2. Y. Tan, J. H. Qin, L. X. Huang, L. Tan, X. Y. Xiang et al., “Recent progress of medical CT image processing based on deep learning,” in Proc. Int. Conf. on Artificial Intelligence & Security, Cham, Springer, pp. 418–428, 2021. [Google Scholar]
3. S. Lovatt, C. W. Wong, K. Schwarz, J. A. Borovac, T. Lo et al., “Misdiagnosis of aortic dissection: A systematic review of the literature,” The American Journal of Emergency Medicine, vol. 53, no. Suppl. 3, pp. 16–22, 2022. [Google Scholar]
4. N. Baghel, U. Verma and K. K. Nagwanshi, “WBCs-Net: Type identification of white blood cells using convolutional neural network,” Multimedia Tools and Applications, vol. 162, no. 4, pp. 1–17, 2021. [Google Scholar]
5. Q. Y. Zhou, Q. J. Qin, X. X. Xiang, Y. Tan and N. N. Xiong, “Algorithm of helmet wearing detection based on at-YOLO deep mode,” Computers, Materials & Continua, vol. 69, no. 1, pp. 159–174, 2021. [Google Scholar]
6. G. M. Hou, Q. J. Qin, X. X. Xiang, Y. Tan and N. N. Xiong, “Af-net: A medical image segmentation network based on attention mechanism and feature fusion,” Computers, Materials & Continua, vol. 69, no. 2, pp. 1877–1891, 2021. [Google Scholar]
7. K. M. He, X. Y. Zhang, S. Q. Ren and J. Sun, “Deep residual learning for image recognition,” in Proc. of the IEEE Conf. on Computer Vision & Pattern Recognition, Las Vegas, NV, USA, pp. 770–778, 2016. [Google Scholar]
8. G. Huang, Z. Liu, L. V. D. Maaten and K. Q. Weinberger, “Densely connected convolutional networks,” in Proc. of the IEEE Conf. on Computer Vision & Pattern Recognition, Honolulu, Hawaii, USA, pp. 4700–4708, 2017. [Google Scholar]
9. M. X. Tan and Q. V. Le, “Efficientnetv2: Smaller models and faster training,” in Proc. Int. Conf. on Machine Learning, London, UK, pp. 10096–10106, 2021. [Google Scholar]
10. M. O. Khairandish, R. Gupta and A. M. Sharma, “Hybrid model of faster R-CNN and SVM for tumor detection and classification of MRI brain images,” International Journal of Mechanical and Production Engineering Research and Development, vol. 10, no. 3, pp. 6863–6876, 2020. [Google Scholar]
11. Y. Luo, Y. F. Zhang, X. Z. Sun, H. W. Dai and X. H. Cheng, “Intelligent solutions in chest abnormality detection based on YOLOv5 and ResNet50,” Journal of Healthcare Engineering, vol. 2021, pp. 2267635, 2021. [Google Scholar]
12. M. H. M. Khan, N. Boodoo-Jahangeer, W. Dullull, S. Nathire, X. H. Gao et al., “Multi- class classification of breast cancer abnormalities using deep convolutional neural network (CNN),” PLoS ONE, vol. 16, no. 8, pp. e256500, 2021. [Google Scholar]
13. Y. Shi, J. Qiao, J. Song, W. Huang, K. Sun et al., “ROI detection of hand bone based on YOLO V3,” in Proc. Int. Conf. on Artificial Intelligence & Computer Applications, Dalian, China, pp. 234–238, 2021. [Google Scholar]
14. M. H. A. Nizar, C. K. Chan, A. Khalil, A. K. M. Yusof and K. W. Lai, “Real-time detection of aortic valve in echocardiography using convolutional neural networks,” Current Medical Imaging, vol. 16, no. 5, pp. 584–591, 2020. [Google Scholar]
15. H. Shaaban and H. S. Mahdi, “Enhanced region of interest extraction method for finger vein images,” Artificial Intelligence & Robotics Development Journal, vol. 1, pp. 13–25, 2021. [Google Scholar]
16. A. Bal, M. Das and S. M. Satapathy, “YOLO as a region proposal network for diagnosing breast cancer,” in Proc. Grace Hopper Celebration India, India, pp. 1–6, 2021. [Google Scholar]
17. X. Xu, Z. He, K. Niu, Y. J. Zhang, T. Hao et al., “An automatic detection scheme of acute Stanford type A aortic dissection based on DCNNs in CTA images,” in Proc. Int. Conf. on Multimedia Systems & Signal Processing, New York, NY, USA, pp. 16–20, 2019. [Google Scholar]
18. K. M. He, G. Gkioxari, P. Dollár and R. Girshick, “Mask R-CNN,” in Proc. of the IEEE Int. Conf. on Computer Vision, Venice, Italy, pp. 2961–2969, 2017. [Google Scholar]
19. Y. Tan, L. Tan, X. Y. Xiang, H. Tang, J. H. Qin et al., “Automatic detection of aortic dissection based on morphology and deep learning,” Computers, Materials & Continua, vol. 62, no. 3, pp. 1201–1215, 2020. [Google Scholar]
20. R. J. Harris, S. Kim, J. Lohr, S. Towey, Z. Velichkovich et al., “Classification of aortic dissection and rupture on post-contrast CT images using a convolutional neural network,” Journal of Digital Imaging, vol. 32, no. 6, pp. 939–946, 2019. [Google Scholar]
21. A. Hata, M. Yanagawa, K. Yamagata, Y. Suzuki, S. Kido et al., “Deep learning algorithm for detection of aortic dissection on non-contrast-enhanced CT,” European Radiology, vol. 31, no. 2, pp. 1151–1159, 2021. [Google Scholar]
22. Y. Yu, Y. Gao, J. Wei, F. Z. Liao, Q. J. Xiao et al., “A three-dimensional deep convolutional neural network for automatic segmentation and diameter measurement of type B aortic dissection,” Korean Journal of Radiology, vol. 22, no. 2, pp. 168–178, 2021. [Google Scholar]
23. Q. Y. Zhou, J. H. Qin, X. Y. Xiang, Y. Tan and Y. Ren, “MOLS-Net: Multi-organ and lesion segmentation network based on sequence feature pyramid and attention mechanism for aortic dissection diagnosis,” Knowledge-Based Systems, vol. 239, no. 17, pp. 107853–107864, 2022. [Google Scholar]
24. P. Voigtlaender, J. Luiten, P. H. S. Torr and B. Leibe, “Siam R-CNN: Visual tracking by re-detection,” in Proc. of the IEEE/CVF Conf. on Computer Vision & Pattern Recognition, Seattle, WA, USA, pp. 6578–6588, 2020. [Google Scholar]
25. J. Hayashida, K. Nishimura and R. Bise, “MPM: Joint representation of motion and position map for cell tracking,” in Proc. Computer Vision & Pattern Recognition, Seattle, WA, USA, pp. 3823–3832, 2020. [Google Scholar]
26. Y. J. El-Abd and K. D. Hagspiel, “Review of imaging with focus on new techniques in aortic dissection,” Techniques in Vascular & Interventional Radiology, vol. 53, no. 2, p. 100748, 2021. [Google Scholar]
27. Z. P. Jing, Q. S. Lu, J. X. Feng, J. Zhou, R. Feng et al., “Endovascular repair of aortic dissection involving the left subclavian artery by castor stent graft: A multicentre respective trial,” European Journal of Vascular and Endovascular Surgery, vol. 60, no. 6, pp. 854–861, 2020. [Google Scholar]
28. M. Zhou, Z. Y. Shi, X. Li, L. Cai, Y. Ding et al., “Prediction of distal aortic enlargement after proximal repair of aortic dissection using machine learning,” Annals of Vascular Surgery, vol. 75, pp. 332–340, 2021. [Google Scholar]
29. Y. Y. Ge, Y. Xue, W. Guo, H. P. Zhang, X. P. Liu et al., “Novel morphological features for prediction of distal thoracic aortic enlargement after thoracic endovascular aortic repair of DeBakey IIIb aortic dissection,” Annals of Vascular Surgery, vol. 47, pp. 212–222, 2018. [Google Scholar]
30. A. Pepe, J. Li, M. Rolf-Pissarczyk, C. Gsaxner, X. J. Chen et al., “Detection, segmentation, simulation and visualization of aortic dissections: A review,” Medical Image Analysis, vol. 65, no. 1, p. 101773, 2020. [Google Scholar]
31. M. S. Yellapragada, Y. T. Xie, B. Graf, D. Richmond, A. Krishnan et al., “Deep learning based detection of acute aortic syndrome in contrast CT images,” in Proc. Int. Symp. on Biomedical Imaging (ISBI) IEEE, Iowa City, Iowa, USA, pp. 1474–1477, 2020. [Google Scholar]
32. S. A. LeMaire and L. Russell, “Epidemiology of thoracic aortic dissection,” Nature Reviews Cardiology, vol. 8, no. 2, pp. 103–113, 2011. [Google Scholar]
33. E. S. Crawford, L. G. Svensson, J. S. Coselli, H. J. Safi and K. R. Hess, “Surgical treatment of aneurysm and/or dissection of the ascending aorta, transverse aortic arch, and ascending aorta and transverse aortic arch: Factors influencing survival in 717 patients,” The Journal of Thoracic and Cardiovascular Surgery, vol. 98, no. 5, pp. 659–674, 1989. [Google Scholar]
34. Y. J. Zhu, B. Lingala, M. Baiocchi, J. J. Tao, V. T. Arana et al., “Type A aortic dissection—Experience over 5 decades: JACC historical breakthroughs in perspective,” Journal of the American College of Cardiology, vol. 76, no. 14, pp. 1703–1713, 2020. [Google Scholar]
35. A. Harky, J. S. K. Chan, C. H. M. Wong, N. Francis, C. Grafton-Clarke et al., “Systematic review and meta-analysis of acute type B thoracic aortic dissection, open, or endovascular repair,” Journal of Vascular Surgery, vol. 69, no. 5, pp. 1599–1609, 2019. [Google Scholar]
36. G. Jocher, K. Nishimura, T. Mineeva and R. Vilariño, “YOLOv5,” 2020. [Online]. Available: https://github.com/ultralytics/yolov5. [Google Scholar]
37. A. Bochkovskiy, C. Y. Wang and H. Y. M. Liao, “YOLOv4: Optimal speed and accuracy of object detection,” arXiv preprint, 2020. [Online]. Available: https://arxiv.org/abs/2004.10934. [Google Scholar]
38. C. Wang, H. Liao, Y. Wu, P. Chen, J. Hsieh et al., “CSPNet: A new backbone that can enhance learning capability of CNN,” in Proc. Computer Vision & Pattern Recognition Workshops, Seattle, WA, USA, pp. 390–391, 2020. [Google Scholar]
39. T. Y. Lin, P. Dollár, R. Girshick, K. M. He, B. Hariharan et al., “Feature pyramid networks for object detection,” in Proc. Computer Vision & Pattern Recognition, Honolulu, Hawaii, USA, pp. 2117–2125, 2017. [Google Scholar]
40. S. Liu, L. Qi, H. F. Qin, J. P. Shi and J. Y. Jia, “Path aggregation network for instance segmentation,” in Proc. Computer Vision & Pattern Recognition, Salt Lake City, UT, USA, pp. 8759–8768, 2018. [Google Scholar]
 | This work is licensed under a Creative Commons Attribution 4.0 International License, which permits unrestricted use, distribution, and reproduction in any medium, provided the original work is properly cited. |