DOI:10.32604/cmc.2022.029823
| Computers, Materials & Continua DOI:10.32604/cmc.2022.029823 | |
| Article |
Manta Ray Foraging Optimization with Machine Learning Based Biomedical Data Classification
1Department of Information Systems, College of Computer and Information Sciences, Princess Nourah bint Abdulrahman University, Riyadh, 11671, Saudi Arabia
2Department of Industrial Engineering, College of Engineering at Alqunfudah, Umm Al-Qura University, Mecca, 24382, Saudi Arabia
3Department of Information Systems, College of Science & Art at Mahayil, King Khalid University, Abha, 62529, Saudi Arabia
4Research Centre, Future University in Egypt, New Cairo, 11845, Egypt
5Department of Computer and Self Development, Preparatory Year Deanship, Prince Sattam bin Abdulaziz University, AlKharj, Saudi Arabia
6Department of Information System, College of Computer Engineering and Sciences, Prince Sattam bin Abdulaziz University, AlKharj, Saudi Arabia
*Corresponding Author: Anwer Mustafa Hilal. Email: a.hilal@psau.edu.sa
Received: 12 March 2022; Accepted: 19 April 2022
Abstract: The biomedical data classification process has received significant attention in recent times due to a massive increase in the generation of healthcare data from various sources. The developments of artificial intelligence (AI) and machine learning (ML) models assist in the effectual design of medical data classification models. Therefore, this article concentrates on the development of optimal Stacked Long Short Term Memory Sequence-to-Sequence Autoencoder (OSAE-LSTM) model for biomedical data classification. The presented OSAE-LSTM model intends to classify the biomedical data for the existence of diseases. Primarily, the OSAE-LSTM model involves min-max normalization based pre-processing to scale the data into uniform format. Followed by, the SAE-LSTM model is utilized for the detection and classification of diseases in biomedical data. At last, manta ray foraging optimization (MRFO) algorithm has been employed for hyperparameter optimization process. The utilization of MRFO algorithm assists in optimal selection of hypermeters involved in the SAE-LSTM model. The simulation analysis of the OSAE-LSTM model has been tested using a set of benchmark medical datasets and the results reported the improvements of the OSAE-LSTM model over the other approaches under several dimensions.
Keywords: Biomedical data classification; deep learning; manta ray foraging optimization; healthcare; machine learning; artificial intelligence
Recently, research in computer aided intelligent systems for healthcare domains becomes an interesting and essential process [1]. Generally, the physicians utilize their knowledge depending upon patient indications and the long-established diagnoses. As such, prognostic importance of indications towards specific illnesses and symptomatic exactness of a patient are exceptionally subject to a doctor's insight. Since medical information and therapy treatment progressed quickly, for example, the event of new sicknesses and the accessibility of new medications, it is tedious for a doctor to stay updated with all new information and improvement in clinical practices [2]. Due to the developments of computing techniques, it becomes easier to attain and save massive quantities of digital data. Thusly, the organization of modernized medical decision support system turns into a suitable way to deal with helping doctors to quickly and precisely analyze patients [3,4]. In any case, various issues must be defeated before designing a decision support system within the sight of vulnerability and imprecision.
While medical specialists’ information and experience are significant, going from evaluating a patient's condition to making a determination, progresses in artificial intelligence (AI) strategies have opened up the way for medical experts to take advantage of electronic shrewd frameworks for decision making in their working environment [5]. Computerized intelligent systems find meaningful in helping the doctor to show up at an educated choice rapidly, for example by gaining from comparable previous cases in an enormous database of electronic patient records and gathering the conclusion for the current patient with appropriate avocations [6]. The benefits of utilizing such smart frameworks incorporate expanding determination precision and, simultaneously, decreasing time and expenses related to patient treatment.
AI models have been created to help different medical dynamic errands. There is an expanding interest in intelligent design of AI and data mining procedures for helping in biomedical examinations as well as in clinical decision making [7]. Conventionally, statistical learning approaches are designed to be performed on the data of previous cases in the diagnosis models which can be utilized for forthcoming cases [8]. They may be utilized to help doctors in directing their choices, and are now and then displayed to beat the specialists’ forecast exactness. Besides, such models can find already unnoticed relations between the factors and result in further developing information and comprehension of the condition. Such revelations might bring about better medicines or preventive techniques. Considering that prescient models figure forecasts in view of data of a specific patient, they are additionally encouraging instruments for accomplishing the objective of customized medication [9,10].
This article concentrates on the development of optimal Stacked Long Short Term Memory Sequence-to-Sequence Autoencoder (OSAE-LSTM) model for biomedical data classification. The presented OSAE-LSTM model majorly focuses on the classification of biomedical data for the existence of diseases. Primarily, the OSAE-LSTM model involves min-max normalization based pre-processing to scale the data into uniform format. Followed by, the SAE-LSTM model is utilized for the detection and classification of diseases in biomedical data. At last, the manta ray foraging optimization (MRFO) algorithm has been employed for hyperparameter optimization process. The simulation analysis of the OSAE-LSTM model has been tested using a set of benchmark medical datasets.
In [11], a hybridization model has been developed by the use of simulated annealing (SA) and Rao algorithm (RA) to select optimum subset of genes and cancer classification. The SA operates like a local searching mechanism and RA functions as a globalized model. An optimum gene subset and categorizing cancer. The SA works as a local searching approach and RA work as a global optimized structure. The reason to integrate SA from RA is to enhance the exploitation ability of RA. The presented approach has 2 phases. During the primary phase, minimum redundancy maximum relevance (mRMR) was utilized for choosing the relevant gene subsets in the microarray data set. Afterward, the SA is hybridized with RA for improving the quality of solutions then all iterations of RA.
The authors in [12] examine a novel adaptive technique named Feature Selection(FS)-Seven Spot Ladybird Optimization Algorithm (FS-SLOA) that is a metaheuristic FS technique dependent upon the foraging behavior of 7 spot ladybird. A novel effectual approach was executed for determining an optimum subset feature that attains the maximal accuracy classifier utilizing 3 classifications. In [13], a novel hybrid classification termed fruit-fly optimization (FFO) based extreme learning machine (ELM) was presented for classifying the biomedical data. The projected classification efficiency is also related to different classifications namely support vector machine (SVM) and ELM. These classifications were validated utilizing different performance indices.
In [14], a novel wrapper FS method was presented dependent upon the chimp optimization algorithm (ChOA) for bio-medical data classifier. The ChOA is a recently presented meta-heuristic approach whose ability to resolve FS problems is not examined yet. In 2 binary variations of ChoA are presented to FS problem. During the initial technique, 2 transfer functions (S-shaped and V-shaped) were employed for converting the continuous version of ChoA to binary.
The authors in [15] propose a novel random vector functional link with ε-insensitive Huber loss function (ε-HRVFL) for biomedical data classifier problem. The optimized issue of ε-HRVFL was reworked as strongly convex minimized problems with an easy function iterative method for determining solution. For having an optimum deal of scope of the biomedical data classifier problem and potential solution, it is shown experimentally with 3 distinct kinds of label noise from biomedical dataset and some non-biomedical data sets.
In this article, a novel OSAE-LSTM model has been developed for the effectual classification of biomedical data for the existence of diseases. The proposed OSAE-LSTM model encompasses a series of operations such as min-max normalization, SAE-LSTM classification, and MRFO based hyperparameter tuning. The utilization of MRFO algorithm assists in optimal selection of hypermeters involved in the SAE-LSTM model. Fig. 1 illustrates the block diagram of OSAE-LSTM technique.
At the preliminary stage, the OSAE-LSTM model undergoes min-max normalization based pre-processing to scale the data into uniform format. The min-max normalization process undergoes mathematical formulation by the use of Eq. (1):
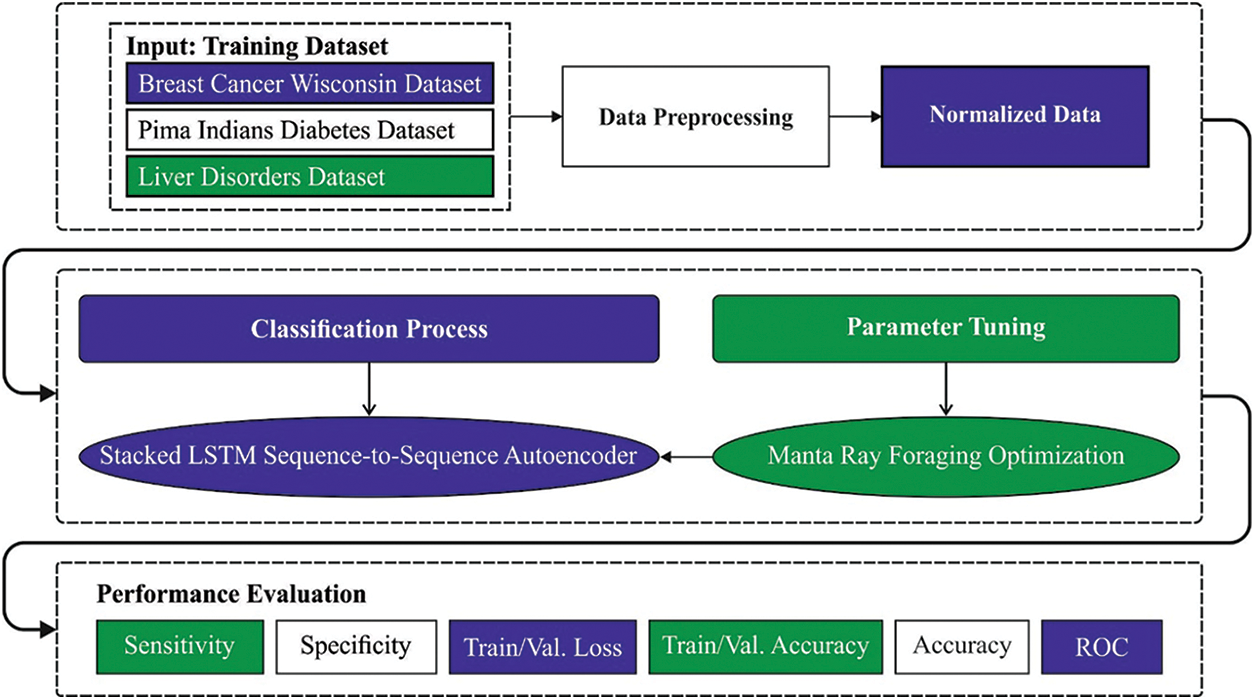
Figure 1: Block diagram of OSAE-LSTM technique
3.2 Process Involved in SAE-LSTM Based Classification
In this study, the SAE-LSTM model is utilized for the detection and classification of diseases in biomedical data. The SAE-LSTM model works as a prototype of a sequence-to-sequence
The mathematical an encoded
whereas
The encoded and decoded networks of LSTM
All the encoded LSTM layer computes the CV
3.3 Process Involved in MRFO Based Hyperparameter Optimization
At the final stage, the MRFO algorithm has been employed for hyperparameter optimization process which assists in optimal selection of hypermeters involved in the SAE-LSTM model. The MRFO is a bio-inspired new technique which simulates the intelligent foraging performance of manta rays (MRs) and features of its foraging performance. The model was appropriate to our current solar radiation forecast problem provided that MRs on that the MRFO is created, have 3 various foraging approaches which are utilized for searching for food that procedure the vital search methods of MRFO for optimizing the solution of our presented solar radiation forecast problem [18]. The mathematical process of chain foraging was signifying as:
In which
It can be apparent in Eq. (8) that the preceding MR from the chain and spatial place of strongest plankton obviously determine the position upgrade method from the chain foraging. Cyclone foraging was separated as to 2 parts. The 1st half concentrations on improving the exploration and is upgraded as:
whereas
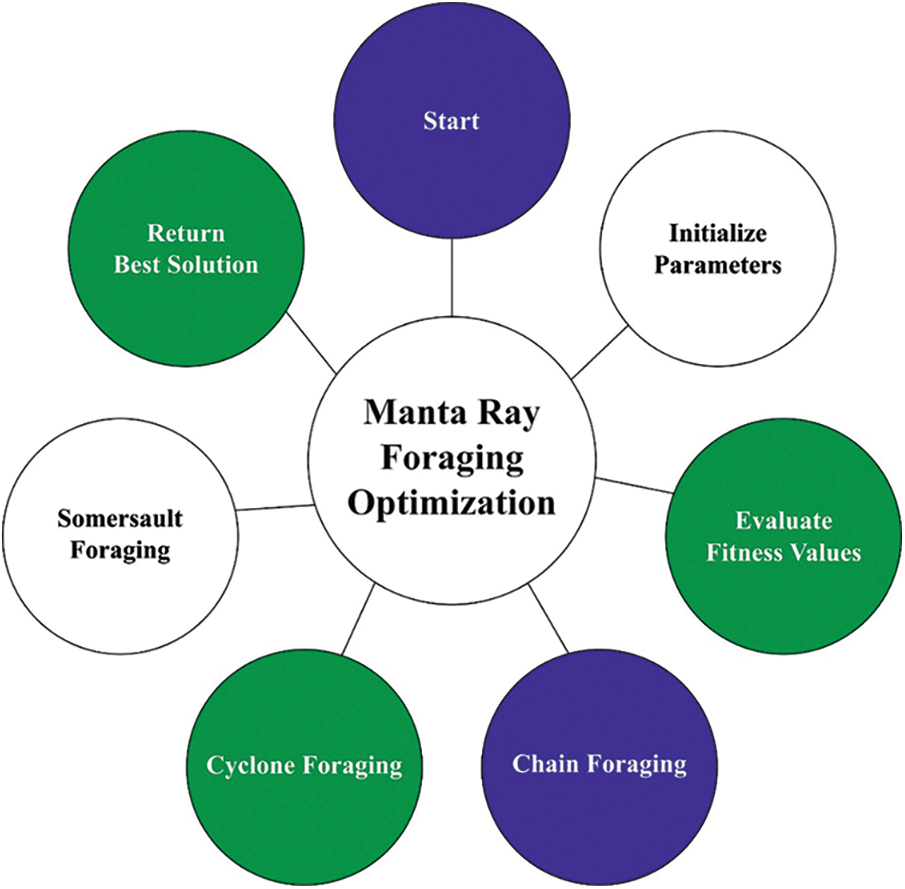
Figure 2: Flowchart of MRFO technique
The adaptive weighted co-efficient
In which
Somersault foraging: The ending foraging approach with MRs determining the food supply and exploiting backward somersaults for circling the plankton for attracting. Somersaulting is local, spontaneous, cyclical, and periodic act which MRs utilize for maximizing their food intake. The 3rd approach is where an upgrade of all individuals takes place around an optimum position:
In Eq. (13), S represents the somersault co-efficient
The MRFO method made a FF for reaching higher classifier performance. It defines a positive integer for demonstrating the best result of candidate solutions. Under this work, the minimized classification error rate is regarded as FF is given in Eq. (14). The best result is a less error rate and worst outcome reaches a higher error rate.
The performance validation of the OSAE-LSTM model is performed using three benchmark datasets [19]. Firstly, the Breast Cancer Wisconsin (BCW) dataset with 569 samples with 32 features is used. Next, the PIMA Indians dataset (PID) includes 768 instances with 8 features. Finally, the Liver Disorders dataset comprises 345 samples with 7 attributes.
Tab. 1 offers a detailed classifier outcome of the OSAE-LSTM model on the test BCW dataset. The experimental values highlighted that the OSAE-LSTM model has accomplished maximum classifier results. For instance, with run-1, the OSAE-LSTM model has offered

Fig. 3 illustrates the training and validation accuracy inspection of the OSAE-LSTM technique on BCW dataset. The figure conveyed that the OSAE-LSTM model has offered maximum training/validation accuracy on classification process.
Next, Fig. 4 exemplifies the training and validation loss inspection of the OSAE-LSTM approach on BCW dataset. The figure exposed that the OSAE-LSTM model has offered decreased training/accuracy loss on the classification process of test data.
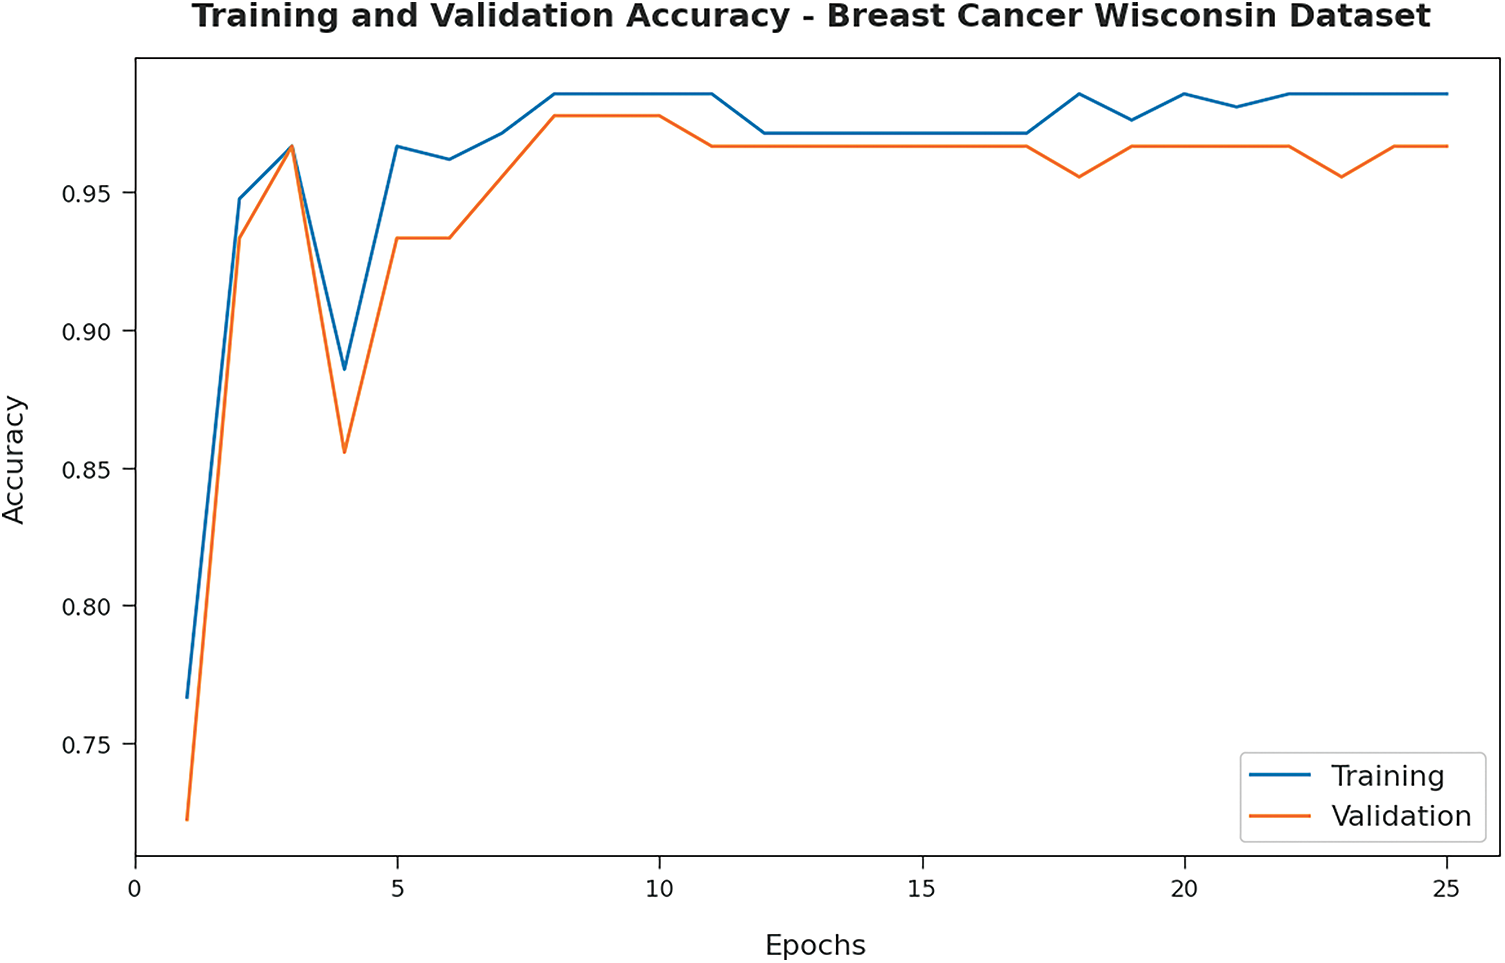
Figure 3: Accuracy analysis of OSAE-LSTM technique on BCW dataset

Figure 4: Loss analysis of OSAE-LSTM technique on BCW dataset
Tab. 2 and Fig. 5 demonstrate the comparison study of the OSAE-LSTM model with recent models such as fuzzy min-max (FMM), FMM with Classification And Regression Tree (CART), FMM-CART-random forest (RF) on BCW dataset. The table values indicated that the FMM-CART model has resulted to


Figure 5: Comparative analysis of OSAE-LSTM technique on BCW dataset
Tab. 3 provides a detailed classifier outcome of the OSAE-LSTM technique on the test PID dataset. The experimental values highlighted that the OSAE-LSTM algorithm has accomplished maximum classifier results. For instance, with run-1, the OSAE-LSTM methodology has accessible

Fig. 6 showcases the training and validation accuracy inspection of the OSAE-LSTM technique on PID dataset. The figure conveyed that the OSAE-LSTM system has offered maximum training/validation accuracy on classification process.

Figure 6: Accuracy analysis of OSAE-LSTM technique on PID dataset
Afterward, Fig. 7 represents the training and validation loss inspection of the OSAE-LSTM approach on PID dataset. The figure showing that the OSAE-LSTM technique has offered decreased training/accuracy loss on the classification process of test data.

Figure 7: Loss analysis of OSAE-LSTM technique on PID dataset
Tab. 4 and Fig. 8 showcase the comparison study of the OSAE-LSTM technique with recent techniques on PID dataset. The table values referred that the FMM-CART model has resulted to
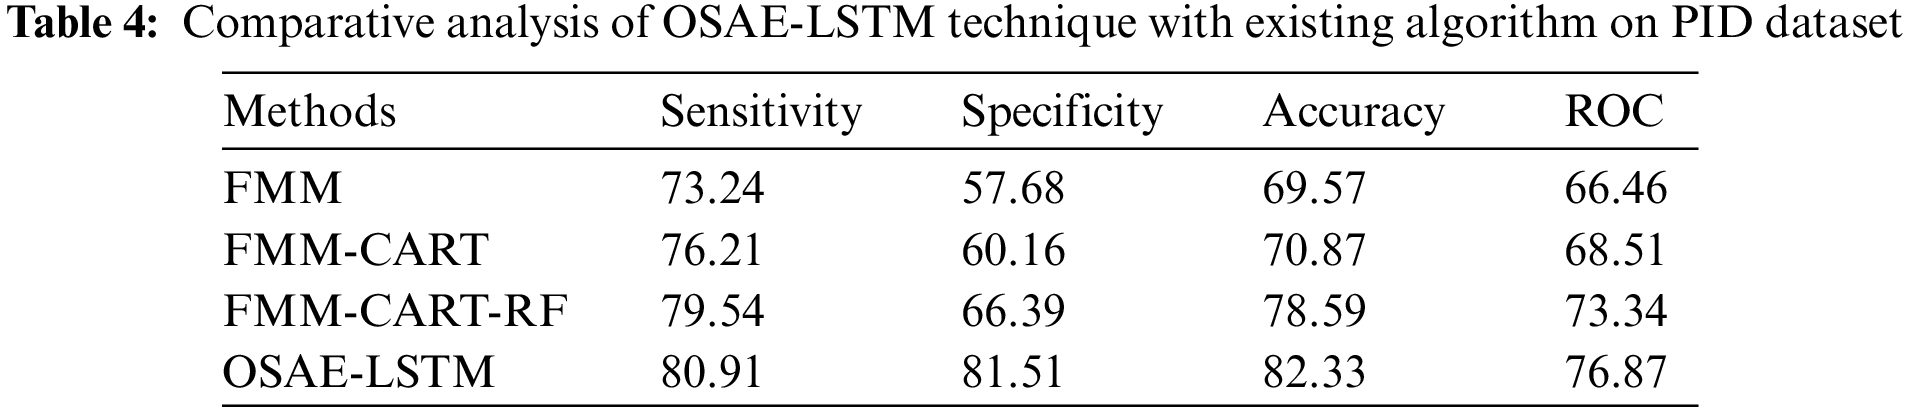

Figure 8: Comparative analysis of OSAE-LSTM technique on PID dataset
Tab. 5 provides a detailed classifier outcome of the OSAE-LSTM model on the test liver disorders dataset. The experimental values highlighted that the OSAE-LSTM system has accomplished maximal classifier results. For instance, with run-1, the OSAE-LSTM approach has accessible

Fig. 9 illustrates the training and validation accuracy inspection of the OSAE-LSTM technique on liver disorders dataset. The figure conveyed that the OSAE-LSTM method has offered maximum training/validation accuracy on classification process.

Figure 9: Accuracy analysis of OSAE-LSTM technique on liver disorders dataset
Then, Fig. 10 demonstrates the training and validation loss inspection of the OSAE-LSTM approach on liver disorders dataset. The figure revealed that the OSAE-LSTM model has offered decreased training/accuracy loss on the classification process of test data.

Figure 10: Loss analysis of OSAE-LSTM technique on liver disorders dataset
Tab. 6 and Fig. 11 illustrate the comparison study of the OSAE-LSTM method with recent models on liver disorders dataset [20]. The table values indicated that the FMM-CART model has resulted to


Figure 11: Comparative analysis of OSAE-LSTM technique on liver disorders dataset
In this article, a novel OSAE-LSTM model has been developed for the effectual classification of biomedical data for the existence of diseases. The proposed OSAE-LSTM model encompasses a series of operations such as min-max normalization, SAE-LSTM classification, and MRFO based hyperparameter tuning. The utilization of MRFO algorithm assists in optimal selection of hypermeters involved in the SAE-LSTM model. The simulation analysis of the OSAE-LSTM model has been tested using a set of benchmark medical datasets and the results reported the improvements of the OSAE-LSTM model over the other approaches under several dimensions. Thus, the presented OSAE-LSTM model has been employed for effectual detection and classification of biomedical data. In future, feature selection models can be introduced to reduce the high dimensionality problem that exist in the heterogeneous biomedical data.
Funding Statement: The authors extend their appreciation to the Deanship of Scientific Research at King Khalid University for funding this work under grant number (RGP 2/158/43). Princess Nourah bint Abdulrahman University Researchers Supporting Project number (PNURSP2022R235), Princess Nourah bint Abdulrahman University, Riyadh, Saudi Arabia. The authors would like to thank the Deanship of Scientific Research at Umm Al-Qura University for supporting this work by Grant Code: (22UQU4340237DSR06).
Conflicts of Interest: The authors declare that they have no conflicts of interest to report regarding the present study.
1. R. S. Bressan, G. Camargo, P. H. Bugatti and P. T. M. Saito, “Exploring active learning based on representativeness and uncertainty for biomedical data classification,” IEEE Journal of Biomedical and Health Informatics, vol. 23, no. 6, pp. 2238–2244, 2019. [Google Scholar]
2. L. Jena, S. Nayak and R. Swain, Chronic disease risk (CDR) prediction in biomedical data using machine learning approach. In: Advances in Intelligent Computing and Communication, Lecture Notes in Networks and Systems Book Series. Vol. 109. Singapore: Springer, pp. 232–239, 2020. [Google Scholar]
3. W. Sun, X. Chen, X. R. Zhang, G. Z. Dai, P. S. Chang et al., “A multi-feature learning model with enhanced local attention for vehicle re-identification,” Computers, Materials & Continua, vol. 69, no. 3, pp. 3549–3561, 2021. [Google Scholar]
4. W. Sun, L. Dai, X. R. Zhang, P. S. Chang and X. Z. He, “RSOD: Real-time small object detection algorithm in UAV-based traffic monitoring,” Applied Intelligence, vol. 92, no. 6, pp. 1–16, 2021. [Google Scholar]
5. C. Su, J. Tong, Y. Zhu, P. Cui and F. Wang, “Network embedding in biomedical data science,” Briefings in Bioinformatics, vol. 21, no. 1, pp. 182–197, 2018. [Google Scholar]
6. E. Momanyi and D. Segera, “A master-slave binary grey wolf optimizer for optimal feature selection in biomedical data classification,” BioMed Research International, vol. 2021, no. 3, pp. 1–12, 2021. [Google Scholar]
7. F. Deng, J. Huang, X. Yuan, C. Cheng and L. Zhang, “Performance and efficiency of machine learning algorithms for analyzing rectangular biomedical data,” Laboratory Investigation, vol. 101, no. 4, pp. 430–441, 2021. [Google Scholar]
8. P. Agarwalla and S. Mukhopadhyay, “Comparative analysis of multi-objective algorithms for imbalanced biomedical data classification with tuned classifier,” in 2021 5th Int. Conf. on Information Systems and Computer Networks (ISCON), Mathura, India, pp. 1–6, 2021. [Google Scholar]
9. H. Luo, M. Li, M. Yang, F. Wu, Y. Li et al., “Biomedical data and computational models for drug repositioning: A comprehensive review,” Briefings in Bioinformatics, vol. 22, no. 2, pp. 1604–1619, 2020. [Google Scholar]
10. M. T. Islam and L. Xing, “A data-driven dimensionality-reduction algorithm for the exploration of patterns in biomedical data,” Nature Biomedical Engineering, vol. 5, no. 6, pp. 624–635, 2021. [Google Scholar]
11. S. K. Baliarsingh, K. Muhammad and S. Bakshi, “SARA: A memetic algorithm for high-dimensional biomedical data,” Applied Soft Computing, vol. 101, no. 4, pp. 107009, 2021. [Google Scholar]
12. N. Bidi and Z. Elberrichi, “Best features selection for biomedical data classification using seven spot ladybird optimization algorithm,” International Journal of Applied Metaheuristic Computing, vol. 9, no. 3, pp. 75–87, 2018. [Google Scholar]
13. P. Parhi, J. Naik, S. P. Mishra and R. Bisoi, “A hybridized levy flight fruit fly optimization based kernel extreme learning machine for biomedical data classification,” in 2020 Int. Conf. on Artificial Intelligence and Signal Processing (AISP), Amaravati, India, pp. 1–5, 2020. [Google Scholar]
14. E. Pashaei and E. Pashaei, “An efficient binary chimp optimization algorithm for feature selection in biomedical data classification,” Neural Computing and Applications, vol. 34, no. 8, pp. 6427–6451, 2022. [Google Scholar]
15. B. B. Hazarika and D. Gupta, “Random vector functional link with ε-insensitive Huber loss function for biomedical data classification,” Computer Methods and Programs in Biomedicine, vol. 215, no. 8, pp. 106622, 2022. [Google Scholar]
16. S. Ghimire, R. C. Deo, H. Wang, M. S. A. Musaylh, D. C. Pérez et al., “Stacked LSTM sequence-to-sequence autoencoder with feature selection for daily solar radiation prediction: a review and new modeling results,” Energies, vol. 15, no. 3, pp. 1061, 2022. [Google Scholar]
17. K. Cho, D. Bahdanau, D. Bahdanau, F. Bougares, H. Schwenk et al., “Learning phrase representations using rnn encoder-decoder for statistical machine translation,” in Proc. of the 2014 Conf. on Empirical Methods in Natural Language Processing (EMNLP), Doha, Qatar, pp. 1724–1734, 2014. [Google Scholar]
18. W. Zhao, Z. Zhang and L. Wang, “Manta ray foraging optimization: An effective bio-inspired optimizer for engineering applications,” Engineering Applications of Artificial Intelligence, vol. 87, no. 5, pp. 103300, 2020. [Google Scholar]
19. https://archive.ics.uci.edu/ml/datasets.php. [Google Scholar]
20. M. Seera and C. P. Lim, “A hybrid intelligent system for medical data classification,” Expert Systems with Applications, vol. 41, no. 5, pp. 2239–2249, 2014. [Google Scholar]
 | This work is licensed under a Creative Commons Attribution 4.0 International License, which permits unrestricted use, distribution, and reproduction in any medium, provided the original work is properly cited. |