DOI:10.32604/cmc.2022.030476
| Computers, Materials & Continua DOI:10.32604/cmc.2022.030476 | |
| Article |
Performance Evaluation of Food and Beverage Listed Companies in Vietnam
1Department of Business Management, National Taipei University of Technology, Taipei, 10608, Taiwan
2Department of Urban Industrial Management and Marketing, University of Taipei, Taipei, 11153, Taiwan
*Corresponding Author: Ming-Hua Lin. Email: mhlin@utaipei.edu.tw
Received: 26 March 2022; Accepted: 27 April 2022
Abstract: During the last decade, the food and beverage industry has been one of the most significant and prioritized industries that contributed to the economic growth in Vietnam. Therefore, how to enhance the performance of food and beverage firms has become a critical factor for Vietnam’s economic development. This research aims to use the data envelopment analysis (DEA) and the Malmquist productivity index (MPI) to assess changes in operational performance and productivity of listed lead food and beverage firms in Vietnam during the period between 2015 and 2020. The obtained results reveal that Vietnamese food and beverage firms were generally inefficient between 2015 and 2020 because the number of relatively inefficient companies was higher than the relatively efficient ones in each year between 2015 and 2020. The MPI findings indicate the growth in productivity during the study period as a result of technological progress. By integrating the findings of the relative efficiency and productivity change, this study creates five decision-making matrixes for five periods, respectively, from 2015 to 2020 to position the food and beverage firms in each sector. The analytical results provide instructions to senior managers on developing strategy for increasing efficiency of food and beverage listed companies in Vietnam.
Keywords: Food and beverage industry; data envelopment analysis; Malmquist productivity index; super-SBM model; efficiency; productivity
The food and beverage (F&B) industry can be broadly defined as a group of companies preparing food and beverage items ready for sale and consumption [1]. The F&B industry involves all businesses engaged in the transformation of raw agriculture materials into consumer food and beverage products. The overall industrial supply chain covers food and beverage processing, packaging, and distribution. It excludes raw food production, which is included in the closely associated agriculture industry [2]. With the advent of technology and the change of the business environment, the F&B companies must face the challenges of growing consumer demand. At first, the farmers decided which products to sell in the market. After industrialization, the power was shifted to the manufacturers. However, in recent years, the trend of urbanization and globalization helped consumers to gain power. Thus, customers currently affect manufacturers and farmers to supply suitable products [3].
Vietnam has many favorable conditions for being one of the most promising food and beverage consumption markets in the Association of South-East Asian Nations (ASEAN). For the past several years, the F&B industry has always been one of the most significant and prioritized industries that contributed to the economic growth in Vietnam. According to VNR500 Ranking in 2019 published by Vietnam Report JSC, the revenue of this industry in Vietnam in 2018 reached nearly 600 trillion Vietnamese Dong (VND), making it the third-largest total revenue [4]. Over the next few years, the F&B industry in Vietnam will also integrate into the international development mechanism of the whole economy through free trade agreements. The F&B firms in Vietnam will scale efficiently and reach customers in new markets both domestically and abroad. Currently, Vietnamese F&B firms focus on developing investment in producing many products to meet the new trend since the consumers are willing to pay higher prices for products with health benefits, natural and environmentally friendly. To support the growing food and beverage businesses, the government has issued policies to improve the investment and business environment and to create favorable operating conditions for businesses.
Despite the Vietnamese F&B industry has many favorable conditions for development, this industry still faces some difficulties. The F&B industry in Vietnam is highly competitive, with fierce competition not only from domestic firms but from international companies joining the Vietnamese market. Major competitors in the F&B sector come from countries such as China and Korea. These countries have thriving food and beverage processing industries due to the technological capabilities, low-cost labor, diversified products and guaranteed quality [5]. The Vietnamese F&B companies do not have the large capital to apply modern technology and machinery, especially small and medium enterprises (SMEs). Product quality has not been carefully and professionally censored, so many items are not eligible for export to major markets around the world. Moreover, nowadays customers pay more attention to food and drink and have more requirements because living standards are improved. People not only consider food hygiene and safety but prefer healthy and purified natural products. Consequently, the F&B producers have to provide products with good quality and reasonable prices for customers. According to the consumer survey of Vietnam Report [6], more than half of customers spend more money on natural origin, organic and clean food for improving tolerance and immune system. Meanwhile, 63.7% of customers have reduced their spending on beer and alcohol. As a result, companies must adjust their operational capability accordingly.
The Vietnamese food and beverage industry is growing and expanding rapidly, thus, enhancing the performance of F&B companies has become an important factor for Vietnam’s economic development. However, rare studies in the literature were found to assess the performance of Vietnamese F&B corporations in detail. This study aims to fill some of the gaps in the existing literature. The findings of the study can provide a more comprehensive picture of the F&B industry in Vietnam, assisting firms in determining their market position and developing appropriate strategies and plans to achieve long-term growth in the sector. The purpose of this research firstly provides an overview of the growth of the Vietnamese F&B industry. Secondly, this research examines the performance of some of the leading Vietnamese F&B companies from 2015 to 2020 based on their technical efficiency by data envelopment analysis (DEA) method. The Malmquist productivity index (MPI) is used to measure the total factor productivity change in each decision-making unit (DMU) during 2015–2020. Finally, the matrix based on the relative efficiency and productivity change assessments is developed for managerial decision-making to improve the operational efficiency of the Vietnamese F&B companies.
The rest of this research is structured as follows. Section 2 contains a review of related literature. The research method is presented in Section 3. Section 4 provides the data analysis and results. Finally, the conclusions are included in Section 5.
The frontier-based method is one of the approaches available for evaluating performance assessment. This method requires creating a production frontier using data on inputs and outputs that have been observed. The frontier method [7] depends on the maximization of outputs for a given level of inputs, which is a term from production theory. For building a production frontier, there are two major methodologies: parametric methods and non-parametric methods, each with its own range of benefits and disadvantages [8]. The non-parametric analysis does not require the definition of any special functional structure to characterize the effective frontier or envelopment surface. Non-parametric methods are flexible enough to allow for a variety of different formulations. The most commonly used approaches in these two categories are data envelopment analysis (DEA) and stochastic frontier analysis (SFA).
The DEA is a non-parametric approach [9] that has gained popularity in calculating and analyzing performance in various sectors of the economy. The ability to manage multiple inputs and outputs without defining a functional structure for the relationship between inputs and outputs is one advantage of this approach. Besides, the units of inputs and outputs can be significantly different. The SFA is a parametric approach [9] capable of dealing with statistical noise. This approach, however, has the drawback of requiring clear presumption about the functional structure of the production frontier. Besides, SFA does not forecast the technical efficiencies of DMUs that multiple outputs and a large number of DMUs are required. Any of the above options has its own set of benefits and drawbacks. For the analysis in this study, the DEA was considered to be the most appropriate method.
In 1957, Farrell [10] had the first notion of using the single input to single output ratio to calculate a unit’s efficiency. In 1978, Charnes et al. [11] founded the DEA method, which can address multiple inputs and multiple outputs. Among the methods for measuring performance, DEA is one of the most prominent non-parametric evaluation methods. The MPI is an extension of the conventional DEA model for measuring the DMUs’ productivity. Some research [12,13] combined the MPI with other methods, such as the window analysis and epsilon-based measure, to assess the performance of the DMUs. The DEA model has been widely used to assess the operations of various entities, including nations, cities, industrial regions, and businesses. Especially, this method is widely used in many countries to assess the efficiency and competitiveness of the F&B sector. For example, Kotey et al. [14] used DEA to assess the relative efficiency of SMEs in the food, beverage, and tobacco processing industries in Australia. Dimara et al. [15] investigated the impact of productive efficiency on the existence of Greek food manufacturers. Within a DEA model, technical and scale efficiency scores are calculated and used as explanatory variables in a parametric (Weibull) survival model. Ali et al. [16] examined improvements in efficiency and productivity in 12 diverse segments of the food processing sectors from 1980–1981 to 2001–2002. The Malmquist total factor productivity change is calculated using the DEA method. Tektas et al. [17] used the DEA and associated sensitivity tests to evaluate the performance of 23 F&B corporations in Turkey. Shamsudin [18] evaluated the technical efficiency and productivity of businesses in the Malaysian food processing industry. The author used the output-oriented DEA method and Tobit regression. Rodmanee et al. [19] used the two-stage DEA relationship approach to decompose and calculate the productivity of 23 Thai F&B firms which are the prominent participants in the food industry in 2011. Giokas et al. [20] used DEA to evaluate the liquidity and revenue efficiency of 21 F&B selected corporations in Greece during the pre-recession and recessionary periods from 2006 to 2012. Gardijan et al. [21] examined F&B firms in the chosen European nations. The survey included over 6000 corporations in the food sector and over 1000 firms in the beverage sector from 2011 to 2015. The results show which countries have the most successful businesses. Hu et al. [22] assessed the managerial performance of Taiwanese F&B firms by using the output-oriented DEA method. Besides, the Mann-Whitney U test is used to determine the difference in the performance of a restaurant and a beverage store. Wang et al. [23] assess and estimate the overall performance of Thai and Vietnamese F&B industries. They applied the DEA method to measure the companies’ efficiency per year. The MPI is used to measure efficiency improvement over time. Kedzo et al. [24] investigated small F&B manufacturers in several European Union nations, estimating their financial efficiency using raw financial variables rather than financial ratios from 2011 to 2015. Previous studies have shown that the DEA is a valuable method for assessing and measuring the efficiency and productivity of firms in the F&B industry.
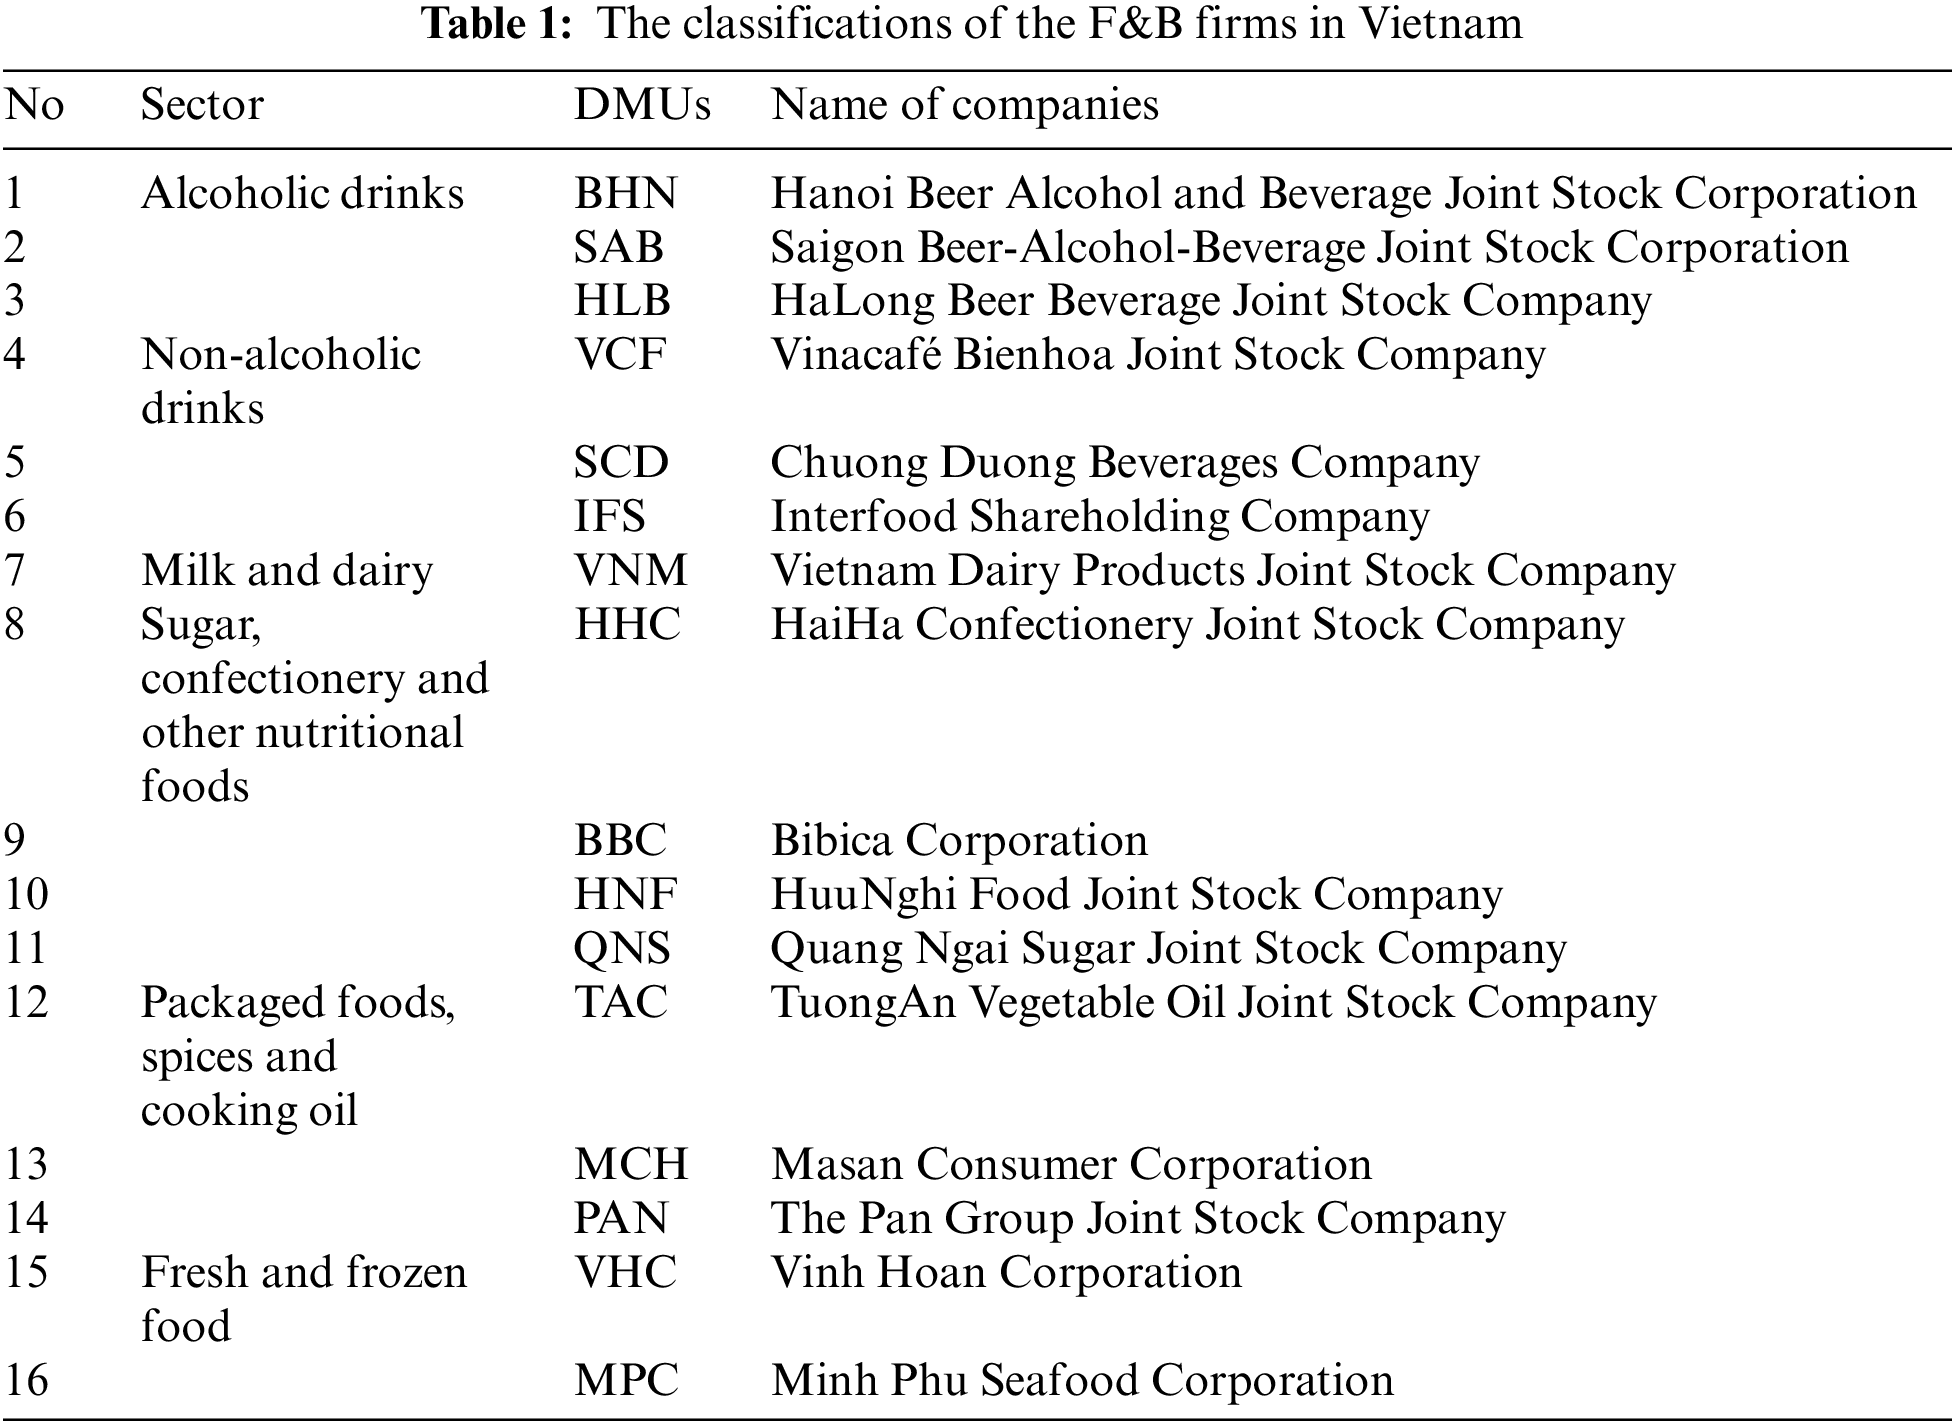
According to the list of top 10 prestigious Vietnamese F&B firms in 2018 [25], 2019 [26], and 2020 [27] announced by Vietnam Report, this research selects 16 F&B corporations. These firms released their financial statements on the stock exchange. Three criteria are considered to assess and classify the firms in the Vietnam Report list. The first criterion is the financial capacity that relies on the most recent financial report, including total assets, total revenue, net profit, efficiency in capital utilization. The second criterion is the media’s credibility that is based on the articles published on reputable media channels. The third criterion is the online surveys on brand awareness, consumer product feedback, and the quality of a company’s services, as well as surveys on the company’s position in each sector, market size, workforce, capital and sales growth rate, revenue, and implementation strategy per year [27]. The 16 selected F&B firms can be classified into six groups as listed in Tab. 1 below.
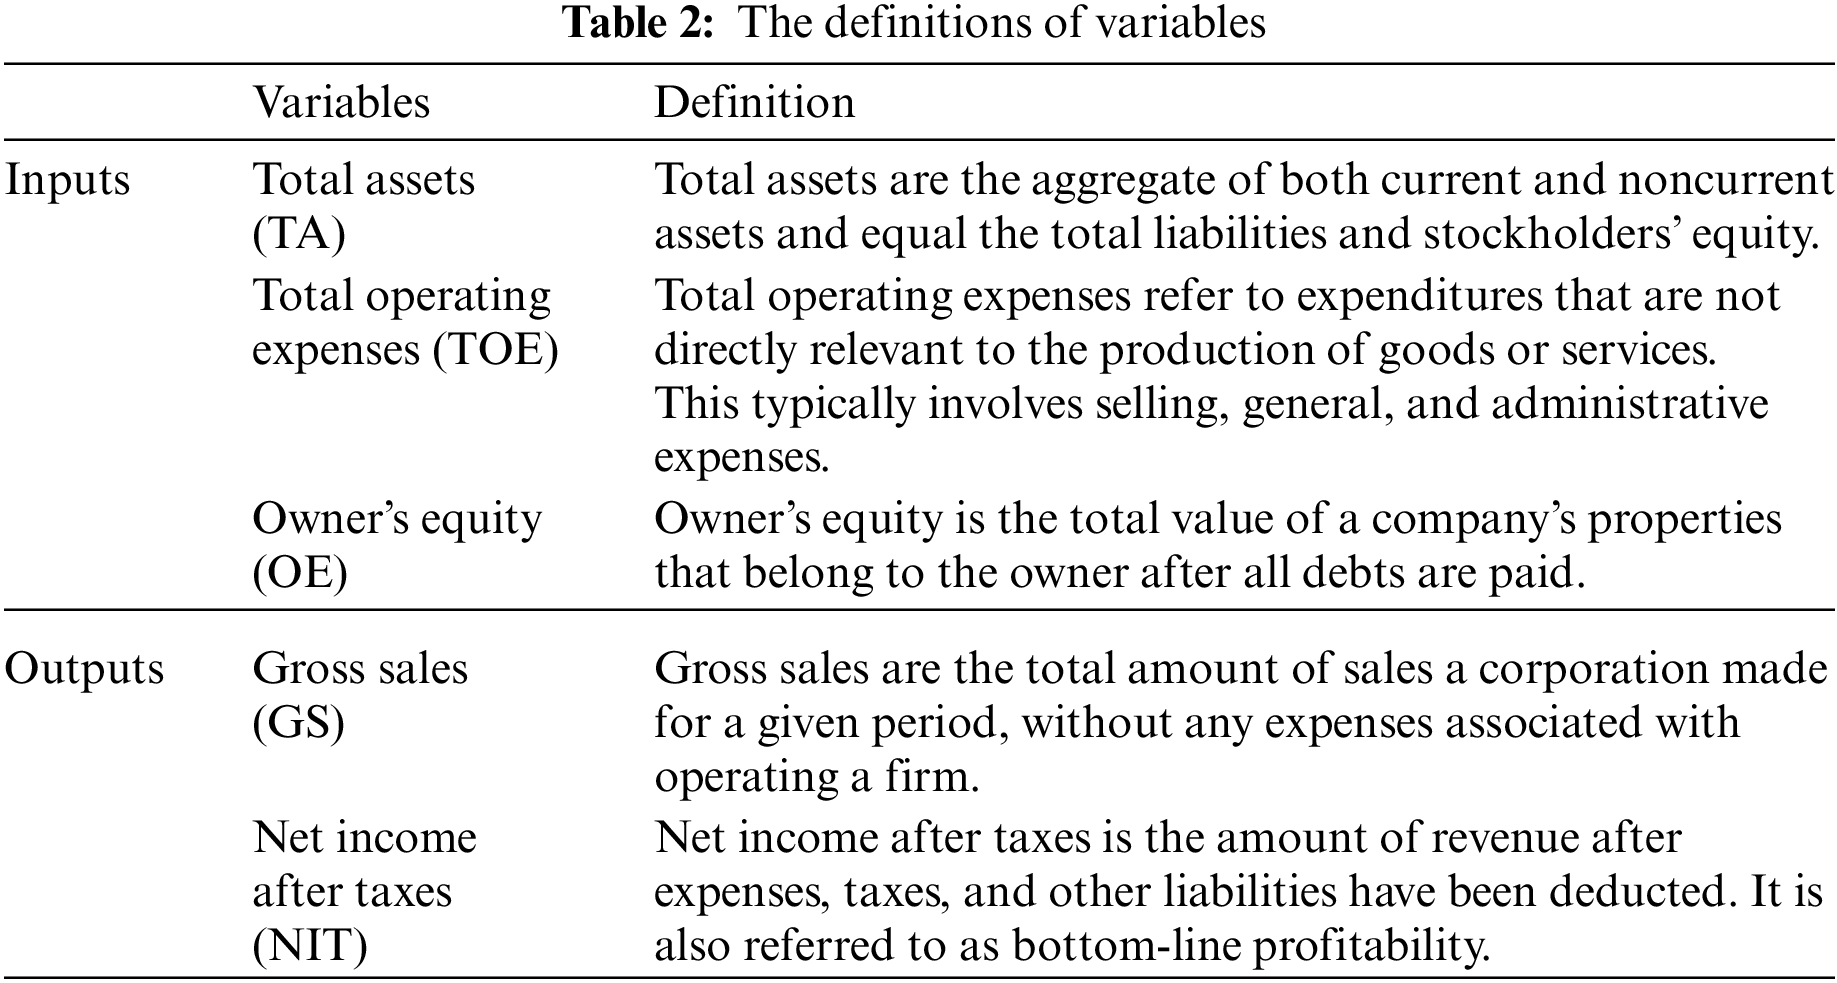
According to the Literature Review, there are many different inputs and outputs used to assess F&B firms. However, this research adopts the following three inputs and two outputs as listed in Tab. 2.
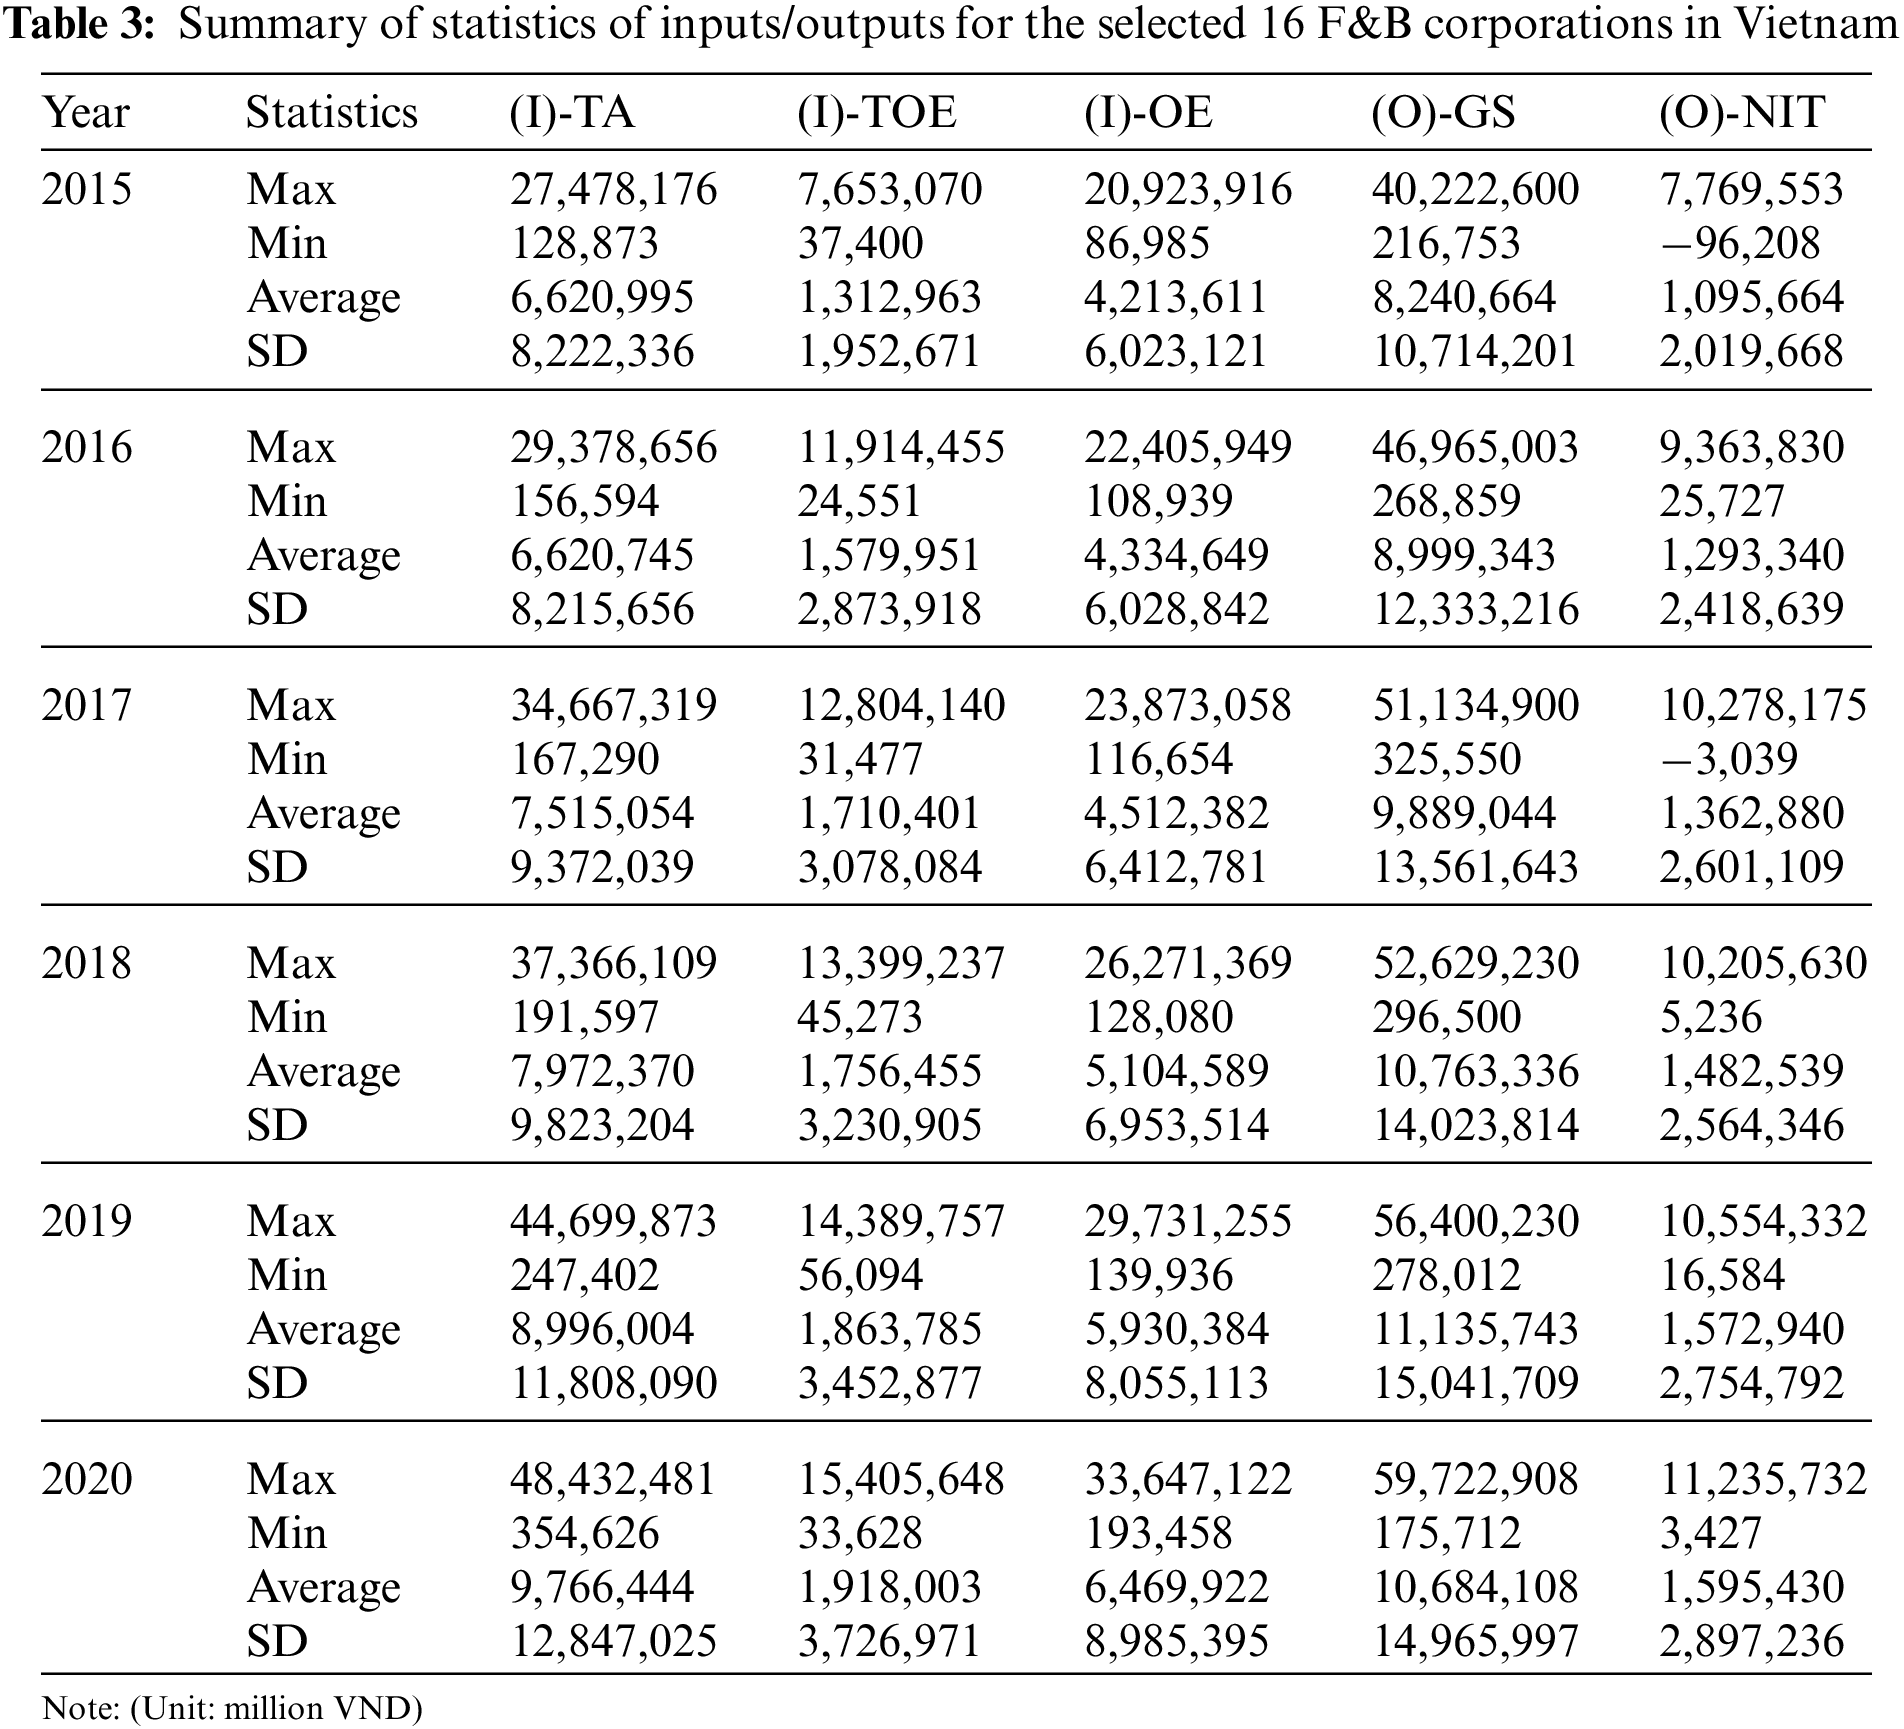
The summary of statistics of input and output factors for the selected 16 Vietnamese F&B companies over the period 2015–2020 are shown in Tab. 3.
3.2 DEA Super Efficiency Slacks-Based Measure Model
Tone [28] introduced the slacks-based measure of efficiency in DEA (SBM model), which effectively distinguishes between the efficient and the inefficient DMUs. This model, however, is unable to differentiate between high-performing DMUs (i.e., fully efficient). To discriminate between fully efficient DMUs, Tone [29] developed super efficiency slacks-based measure model in DEA (Super-SBM model) by excluding the efficient DMUs from its efficient frontier of the SBM model. The model calculates the non-radial distance between omitted efficient DMUs and the efficient frontier created by the remaining efficient DMUs, addressing both input and output slacks at the same time. This function of the Tone [29] model made it more suited for dealing with real-world applications.
The model is used to analyze n DMUs with the input and output matrices X = (
Tone [26] considers the following expression to describe a specific DMU (
With
A DMU (
Many observational studies on efficiency assessment analysis concluded that multiple decision units have an “effective status” of 100 percent. Thus, logically distinguishing between these effective DMUs is crucial for rating performance and evaluating influencing factors. To compensate for the shortcoming of the SBM model, the super-SBM model should be used. The super-SBM model can be expressed as follows:
3.3 DEA Malmquist Productivity Index (MPI)
In addition to calculating technical efficiency at a particular time, it is necessary to calculate efficiency over time. Fare [30] created the MPI, which is a DEA model extension for measuring the total factor productivity change of a DMU between years. MPI can be used to assess the total factor productivity change of a DMU between two periods. The comparison of efficiency patterns over time enables researchers to obtain a greater understanding of how efficiency changes between different periods. According to Fare [30], the total factor productivity obtained by DEA is known as MPI. This index is recognized as one of the most useful methods for assessing the productivity change of a group of DMUs over time, in which each DMU is analyzed at two different periods
The Malmquist Index evaluated the changes in total factor productivity of each DMU by calculating the efficiency score. MPI is defined as the product of the “catch-up” and “frontier-shift” terms. The word “catch-up” refers to shifts in technical efficiency (given a fixed technology), while “frontier-shift” refers to shifts in the technology available to an organization. Total factor efficiency can be improved by using its current technologies and making better use of economic inputs, a process known as “catch-up”. Total factor productivity can also be improved if the companies implement innovations or advancements in technology, such as the introduction of new products, processes, and technologies into their activities that result in better manufacturing methods, known as “frontier shift”. MPI can be obtained as follows:
Eq. (9) can then be further transformed into:
where
Thus, MPI >1 signifies an increase in productivity from the period
4.1 Efficiency Analysis Using Super-SBM Model
4.1.1 Overall Efficiency Analysis
The non-oriented super-SBM model is used to assess the efficiency of 16 Vietnamese F&B firms from 2015 to 2020. Tab. 4 shows the super-SBM scores and ranking.
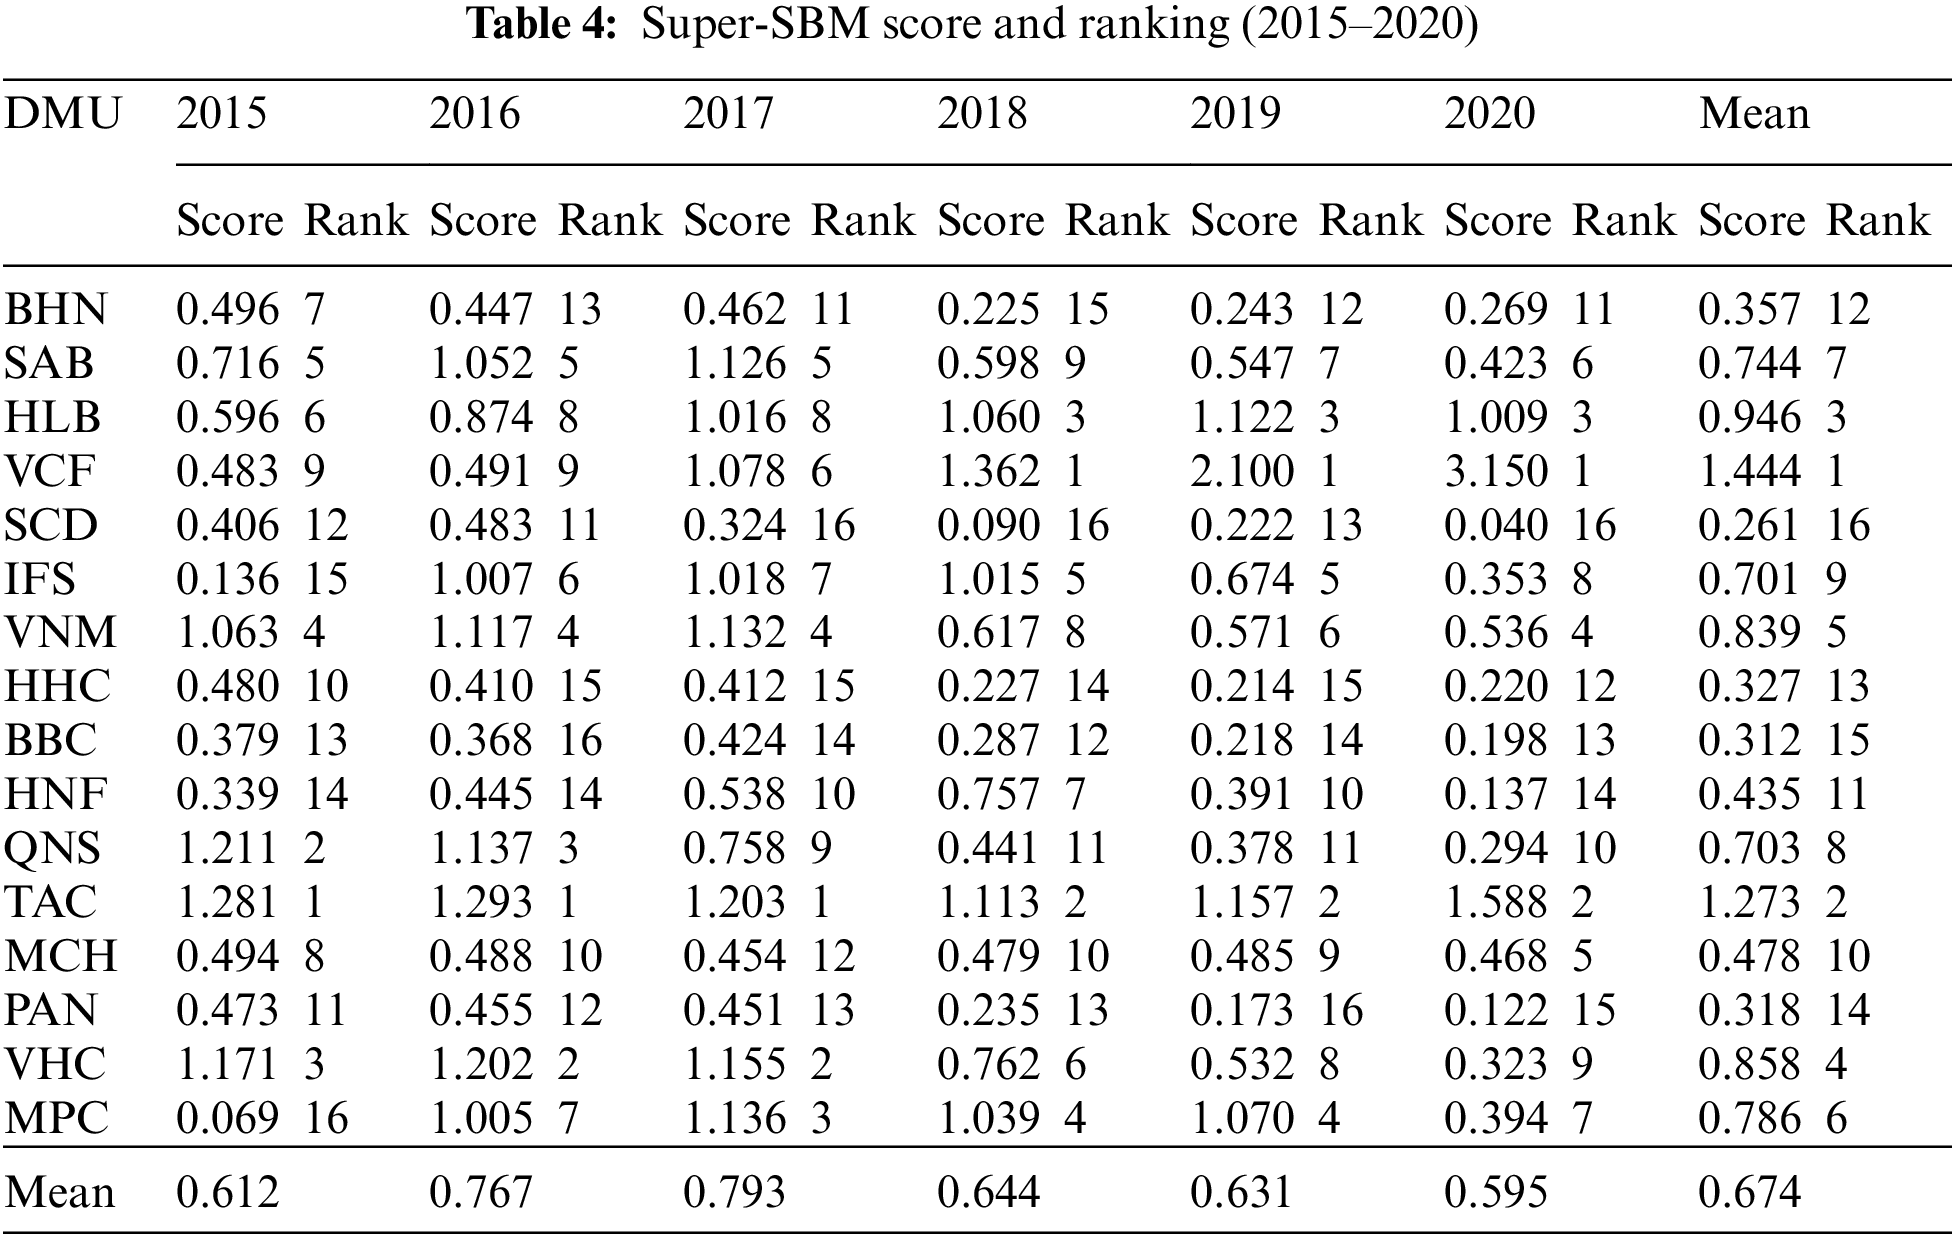
The average score for each year ranged from 0.595 to 0.793 in Tab. 4 shows that Vietnamese F&B companies are generally inefficient from 2015 to 2020. The number of efficient companies in 2015, 2016, and 2017 are four, seven, and eight, respectively. Then the number of efficient companies gradually decreases from 2018 to 2020. According to the average performance score for six years, only companies TAC and VCF performed effectively with average scores of 1.273 and 1.444, respectively. The number of inefficient enterprises is higher than the number of efficient businesses per year.
From Tab. 4, it is observed that companies BHN, SCD, HHC, BBC, MCH, and PAN followed a very poor trend of efficiency, their scores are less than 0.5 from 2015 to 2020. The low score comes from an abundance of inputs, namely the excessive operating costs that is regarded as the most expensive in F&B firms. Company TAC is the only company that has been operating effectively for six years with efficiency scores in the range from 1.113 to 1.588. This indicates that this organization effectively manages and controls its operational expenses. In order to be efficient, the F&B firms must monitor the price of materials, as well as improve other factors affecting operational costs, such as machinery and labor productivity.
Fig.1 illustrates the variation between years for companies TAC and VCF. From 2015 to 2020, TAC is the only company with a super-efficiency score all higher than 1 for six years, ranging from 1.113 to 1.588. Company TAC ranked first during the first three years from 2015 to 2017 and dropped to second in the next three years from 2018 to 2020. On the other hand, company VCF was ineffective with average scores of 0.483 and 0.491 in 2015 and 2016, respectively. However, company VCF obtained the scores ranked first compared to the rest of the F&B firms 2018 to 2020. The scores obviously increase to more than 1 because the company has minimized all costs, especially the cost of goods sold.
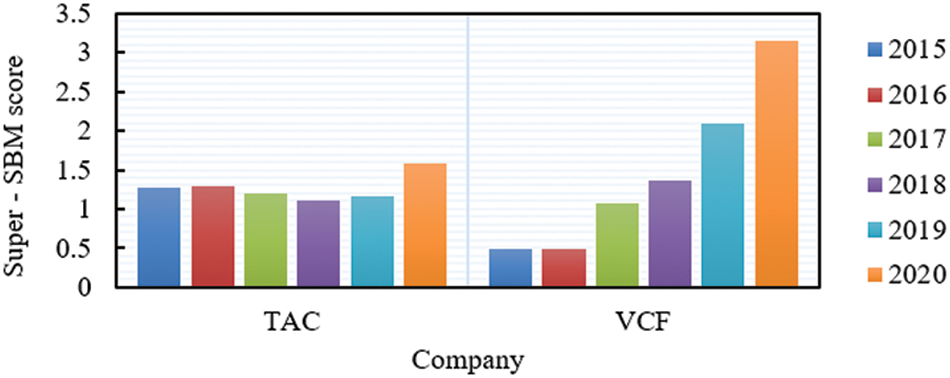
Figure 1: Super slacks-based measure score of companies TAC and VCF over the period of 2015 to 2020
4.1.2 Small Group Efficiency Analysis
The comparison of the F&B companies operating in a smaller sector provides a more detailed view. Fig. 2 indicates the comparisons of the F&B companies in each sector.
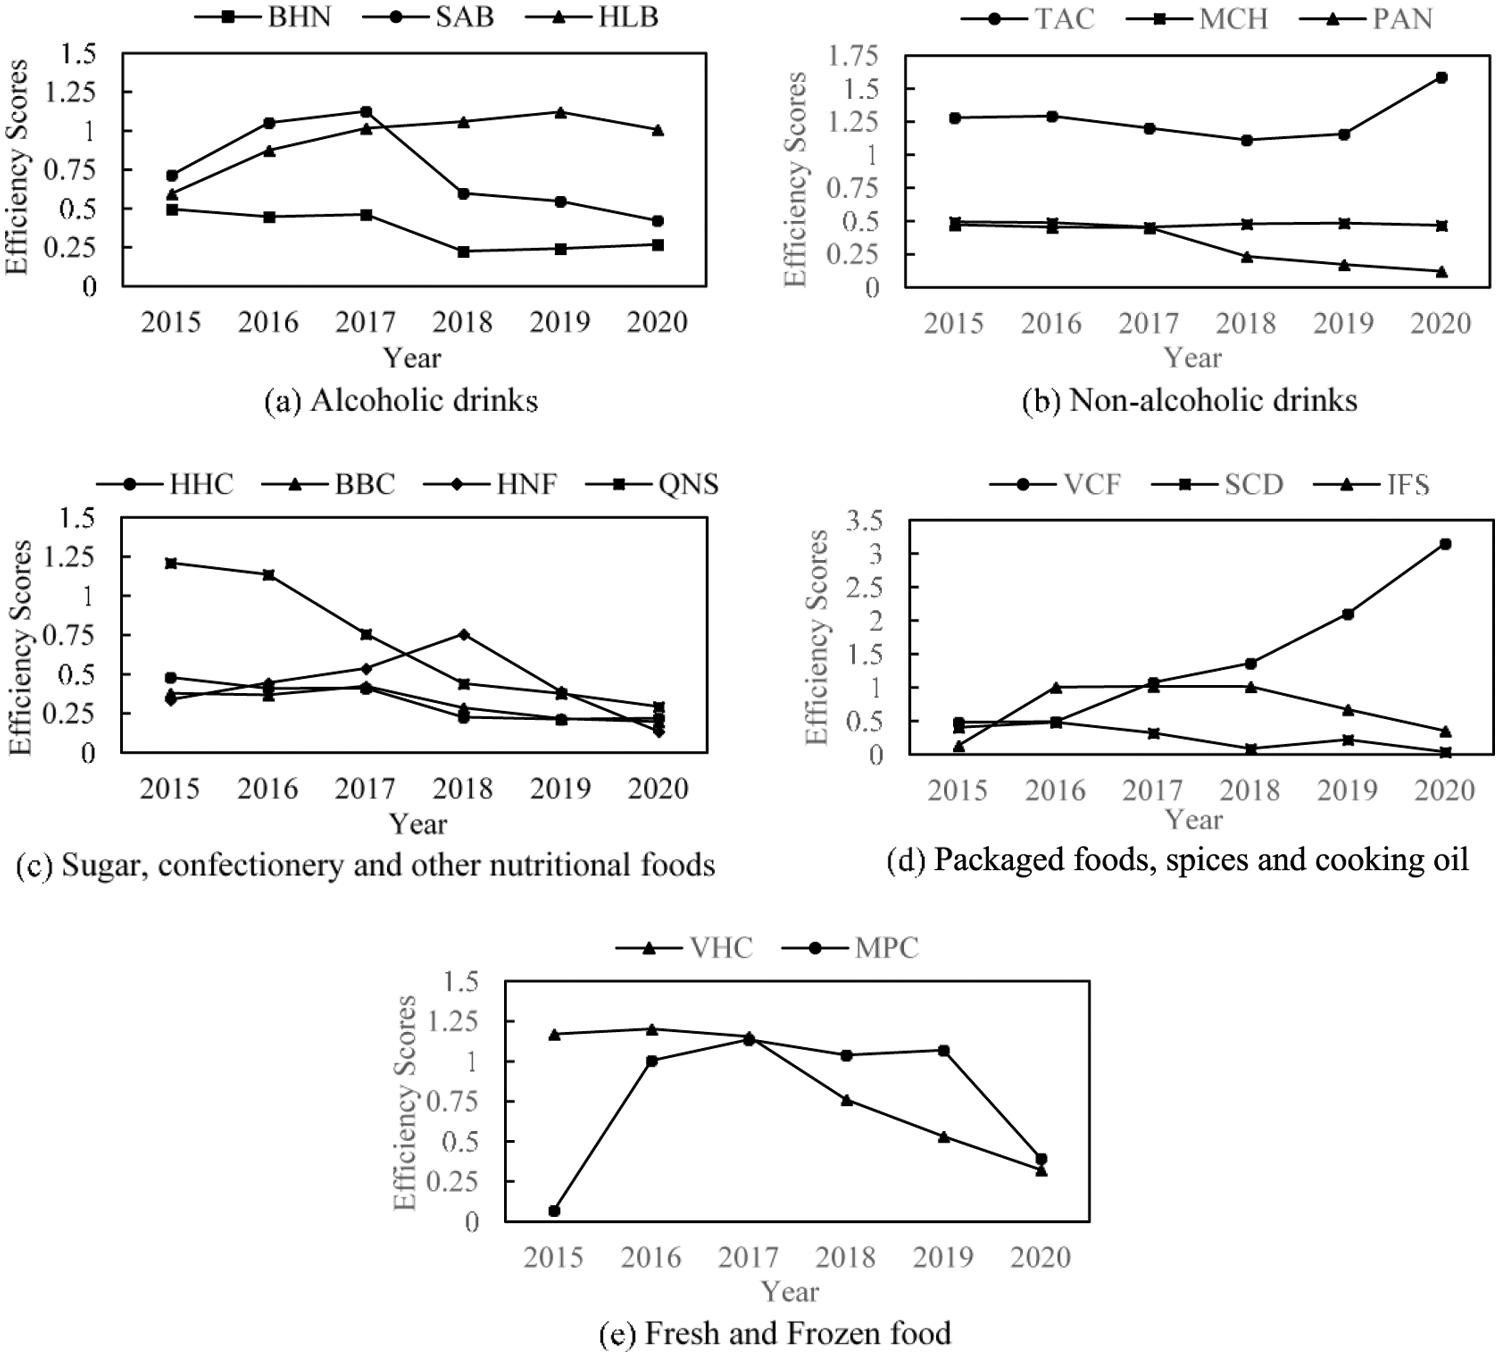
Figure 2: Comparisons of efficiency scores of the F&B companies in each small sector
Companies BHN, SAB, and HLB belong to the “Alcoholic drinks” sector. Fig. 2a indicates that company BHN continued to operate ineffectively after 2015. Company SAB tended to increase organizational performance in the period of 2015–2017, but became less competitive and underperformed in the next period of 2017–2020. On the other hand, company HLB improved its operational performance gradually and became the most efficient organization in this group eventually. Companies VCF, SCD, and IFS belong to the “Non-alcoholic drinks” sector. Fig. 2b indicates that in 2015 all three companies have not operated effectively. From 2017, company VCF had a significant increase in efficiency score that was much higher than the efficiency score of other companies. In contrast, company SCD performed ineffectively in the whole period 2015–2020 because it did not develop any innovation to improve its operation. Company IFS made efforts to achieve operationally efficient in the period of 2016–2018. However, it cannot maintain the efficient performance for the next two years from 2019 to 2020.
Companies HHC, BBC, HNF, and QNS belong to the “Sugar, confectionery and other nutritional foods” group. Fig. 2c illustrates that in the period of 2015–2016, company QNS has an outstanding high efficiency compared to the remaining three companies. However, this company showed a degradation in efficiency score and became inefficient the following years. Companies HHC, BBC, and HNF were inefficient in general for the six-year period. Companies TAC, MCH, and PAN belong to the “Packaged foods, spices and cooking oil” group. Fig. 2d illustrates that company TAC had outstanding performance and maintained its performance throughout the research period. On the other hand, companies MCH and PAN underperformed in the whole period of 2015–2020. Companies VHC and MPC belong to the “Fresh and frozen food” group. Fig. 2e indicates that in 2015 company MPC had a very bad starting point, the net income after tax was negative. It improved the efficiency score by more than 1 in the later period from 2016 to 2019. However, in 2020 this company has recorded its ineffective performance. Similarly, company VHC has operated effectively from 2015 to 2017 but became inefficient in the period of 2018–2020.
4.2 Analyzing Performance Trends Over Time Using Malmquist Productivity Index (MPI)
4.2.1 Overall Efficiency Analysis
The catch-up index shown in Tab. 5 represents the technical efficiency change of the DMUs. With scores of more than 1, less than 1, and equal 1, the catch-up index shows whether the DMUs improve, deteriorate, or remain unchanged in terms of efficiency.
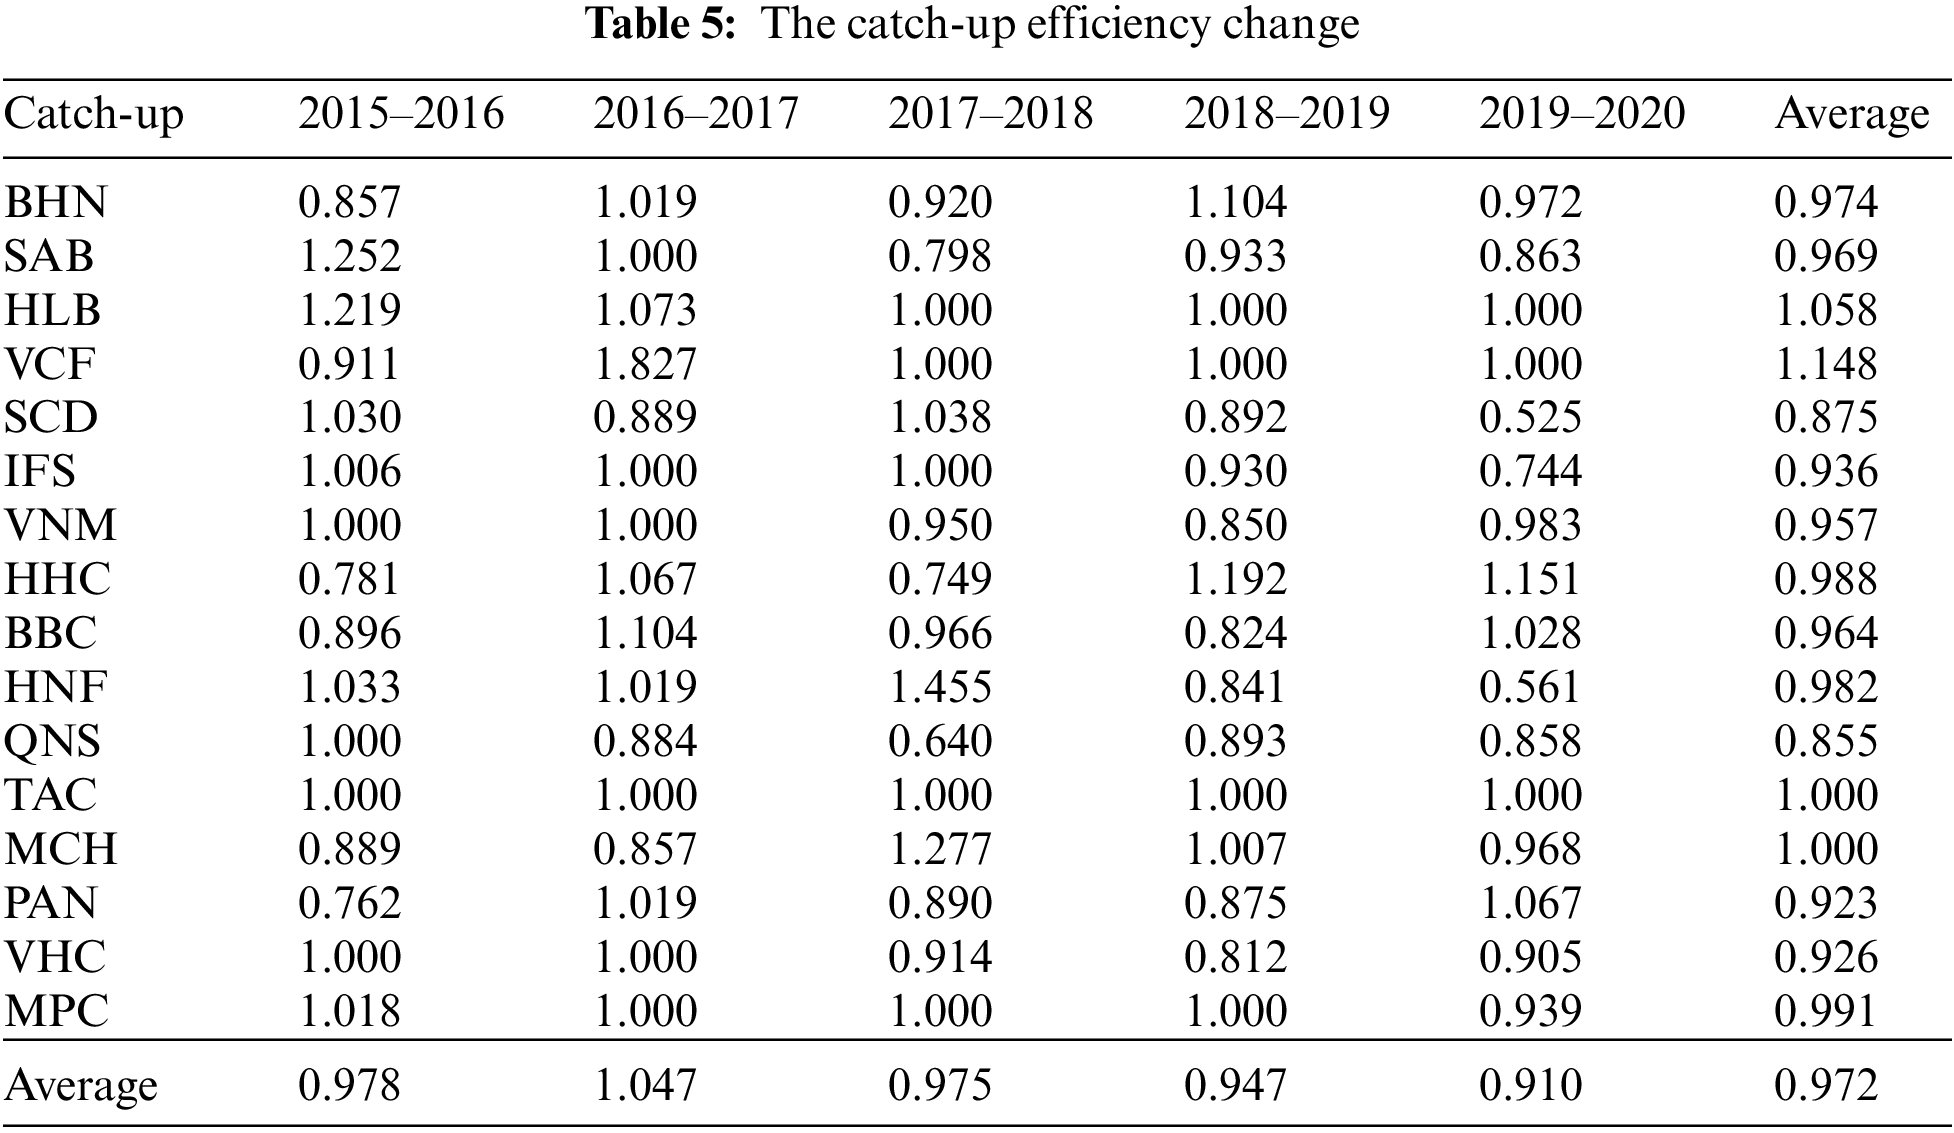
In terms of the whole industry, the “efficiency change” (catch-up effect) suffers a loss of 2.8% because the average score of 0.972 for the period 2015–2020 is lower than one. In terms of individual company performance, it is observed that out of 16 Vietnamese F&B companies, companies HLB and VCF have demonstrated better efficiency over 2015–2020, companies TAC and MCH remain stable with the catch-up index equal one, and the other 12 firms have dropped with the catch-up index below one. Companies HLB and TAC keep the efficiency change from diminishing over a six-year period from 2015 to 2020. This represents that companies HLB and TAC operated stably and effectively during the study period.
During the 2015–2016 and 2016–2017 periods, six and seven of the 16 firms, respectively, have reached technical efficiency with the catch-up index of more than 1. Company SAB had the highest technical efficiency change in the period of 2015–2016, with a value of 1.252, and company VCF had the highest technical efficiency change in the year 2016–2017, with a value of 1.827. It is noticeable that, during the next period from 2017 to 2020, only three companies in each period showed an improvement in technical efficiency.
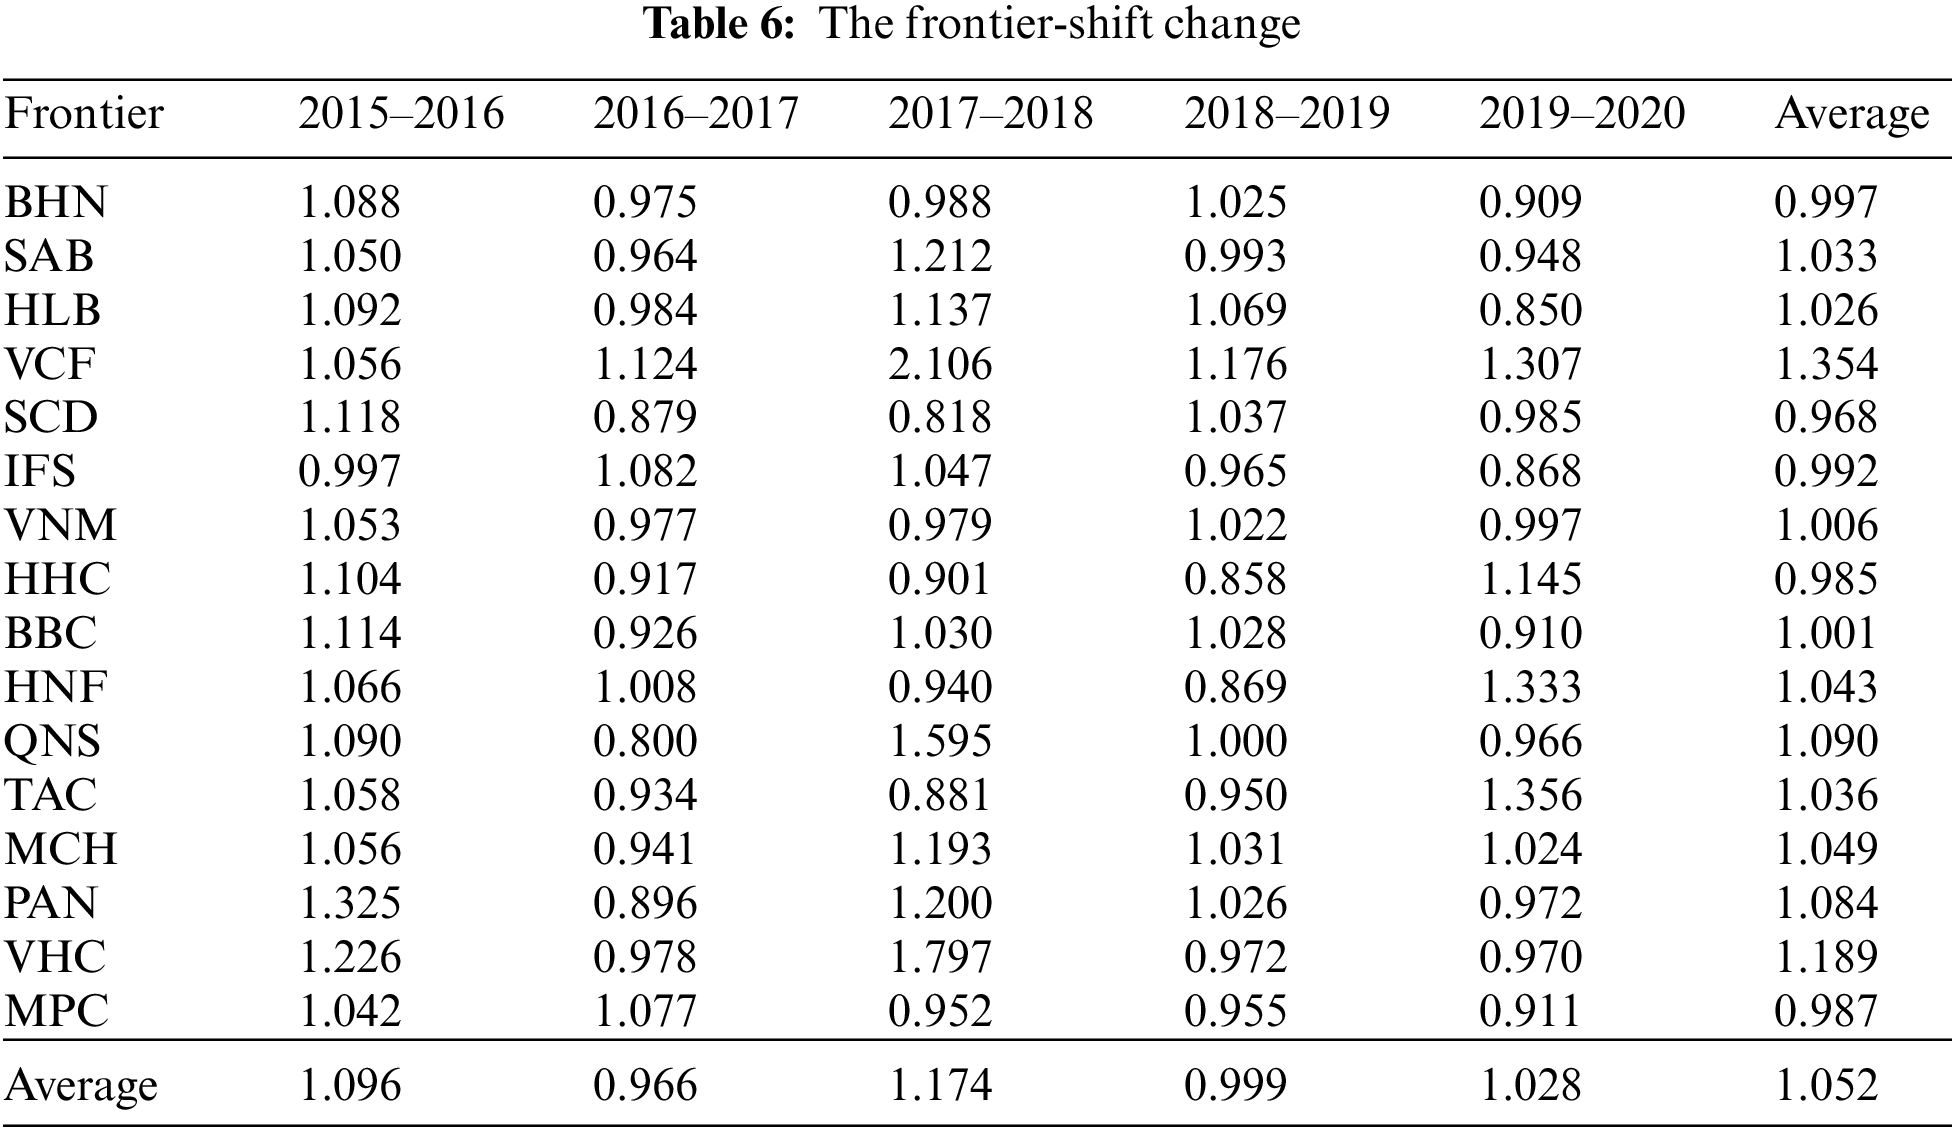
4.2.2 Frontier-Shift Index (Technological Change)
Tab. 6 shows the frontier-shift change of all DMUs from 2015 to 2020. The results indicate that except for company IFS, the remaining 15 companies have been successful to make technological progress from 2015 to 2016. However, they were unable to sustain the advancements in subsequent years. 12 businesses failed to make technological progress between 2016 and 2017. This means that the frontier-shift index of corporations dramatically decreased over this time, representing that the F&B industry’s technology and innovation progress has not improved well and have several limitations. Following a disappointing period of 2016–2017, the number of companies that failed to achieve technological progress decreased to seven from 2017 to 2019. In 2019–2020, only five companies achieved technological progress. Company VCF obtained a stable high score for 6 years, ranging from 1.056 to 2.106. It performed significantly well in the technology improvement and innovation. The technological competition is very dynamic and full of opportunity for all businesses.
4.2.3 Malmquist Productivity Index (MPI)
MPI consists of two parts: catch-up representing efficiency gains, and frontier-shift representing technological advancements. Tab. 7 shows the changes in MPI for all companies from 2015 to 2020.
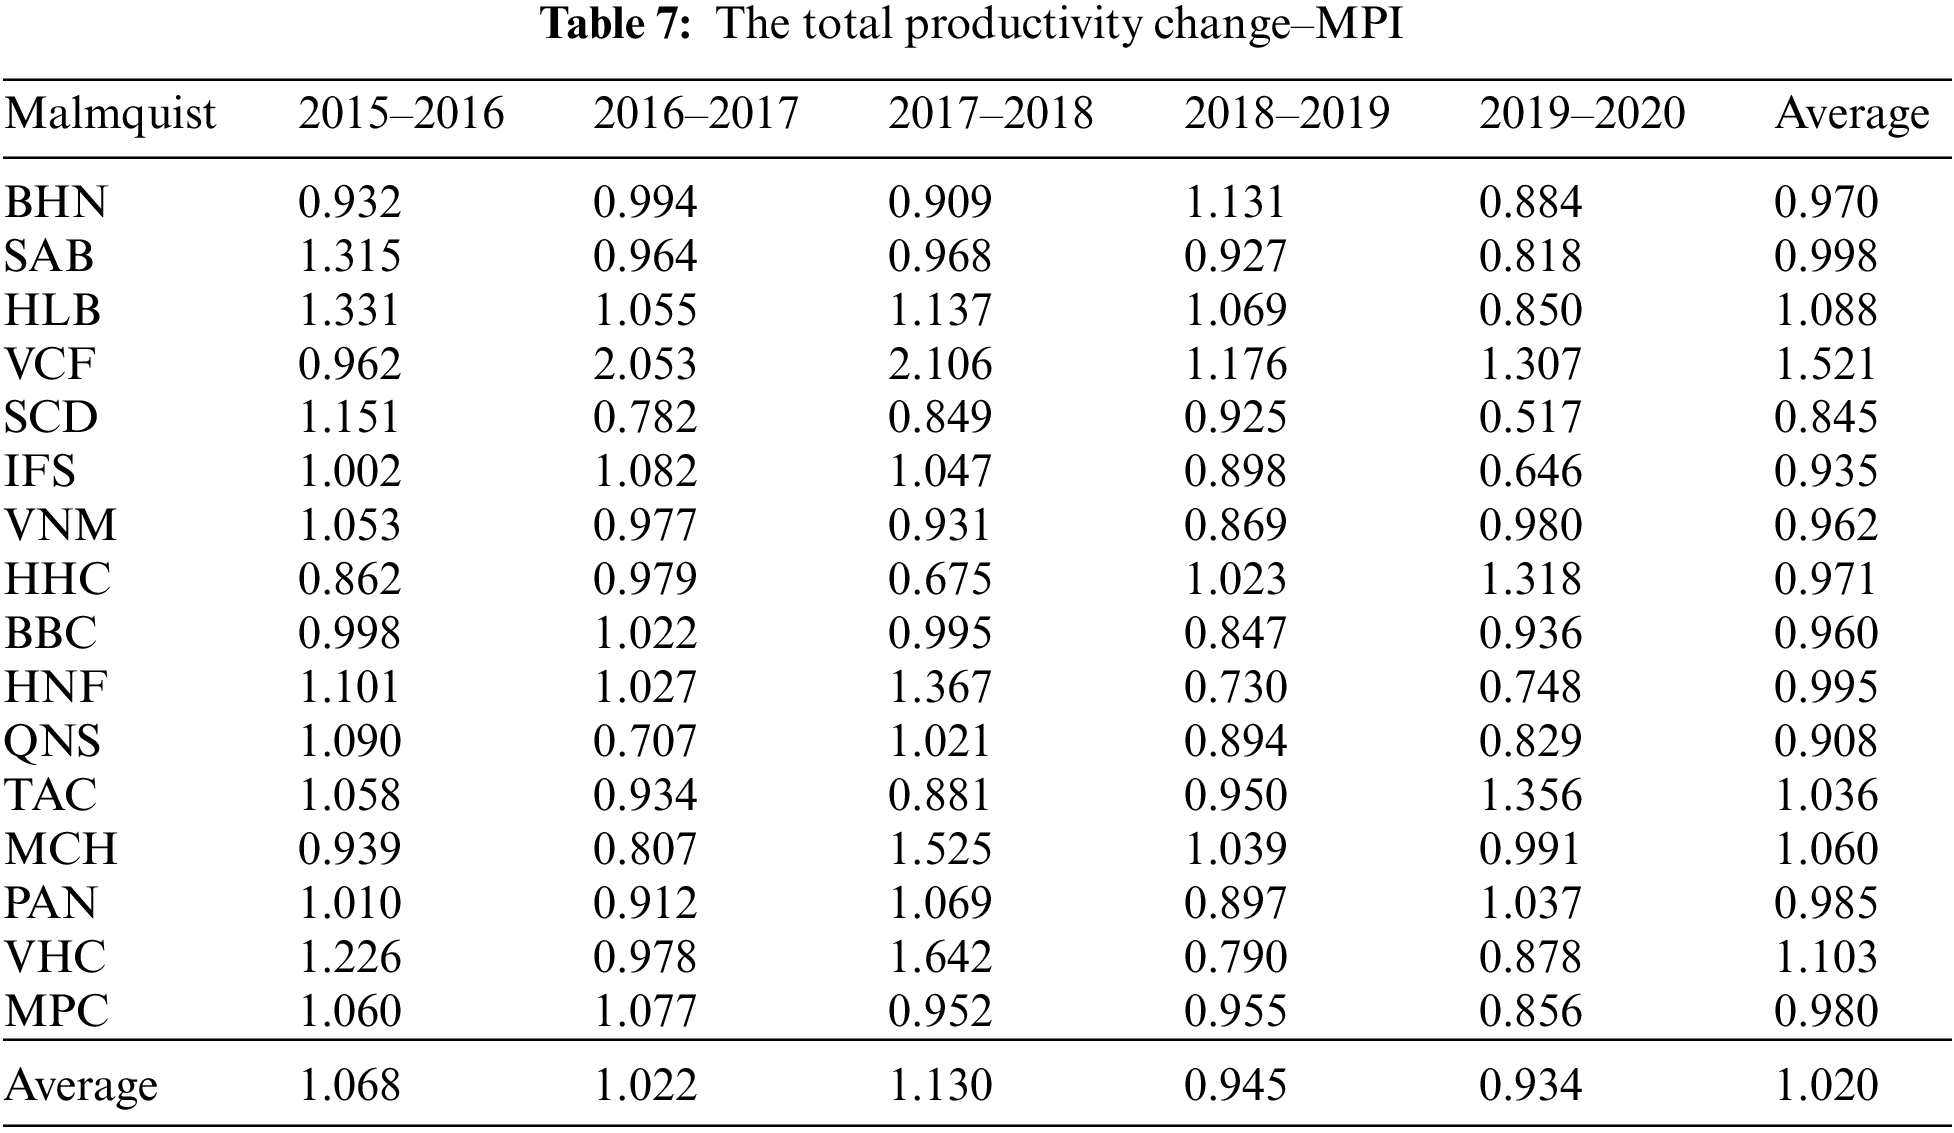
In the period of 2015–2016, the majority of DMUs increased total factor productivity with MPI greater than one, whereas only five firms operated inefficiently with MPI below 1, namely BHN, VCF, HHC, BBC, and MCH. However, they were unable to keep their upward trend from 2018 to 2020. The productive scores have an average value of 0.945 with only five firms performing well during 2018–2019 and a score of 0.934 with four companies performing well during 2019–2020. None of the 16 F&B firms has maintained the MPI value more than 1 per year from 2015 to 2020. Despite its poor performance in 2015–2016, company VCF is the best-performing F&B company over the entire research time frame, with an average MPI value of 1.521. Company VCF is followed by company VHC (1.103) and company HLB (1.088). On the other hand, company SCD was the worst-performing F&B company, with an average MPI value of 0.845.
In the period of 2019–2020, it can be observed that three firms (BHN, SAB, and HLB) in the alcoholic beverage group all experienced a decrease in their total factor productivity, with scores of 0.884, 0.818, and 0.850 (less than 1), respectively. Because the alcoholic beverage industry has suffered two major shocks. One is the Vietnamese government’s Decree 100, which imposed harsh penalties for cases of consuming alcohol, resulting in drunkenness while driving. The other is the COVID-19 pandemic has led to a decrease in the consumption of alcoholic drinks.
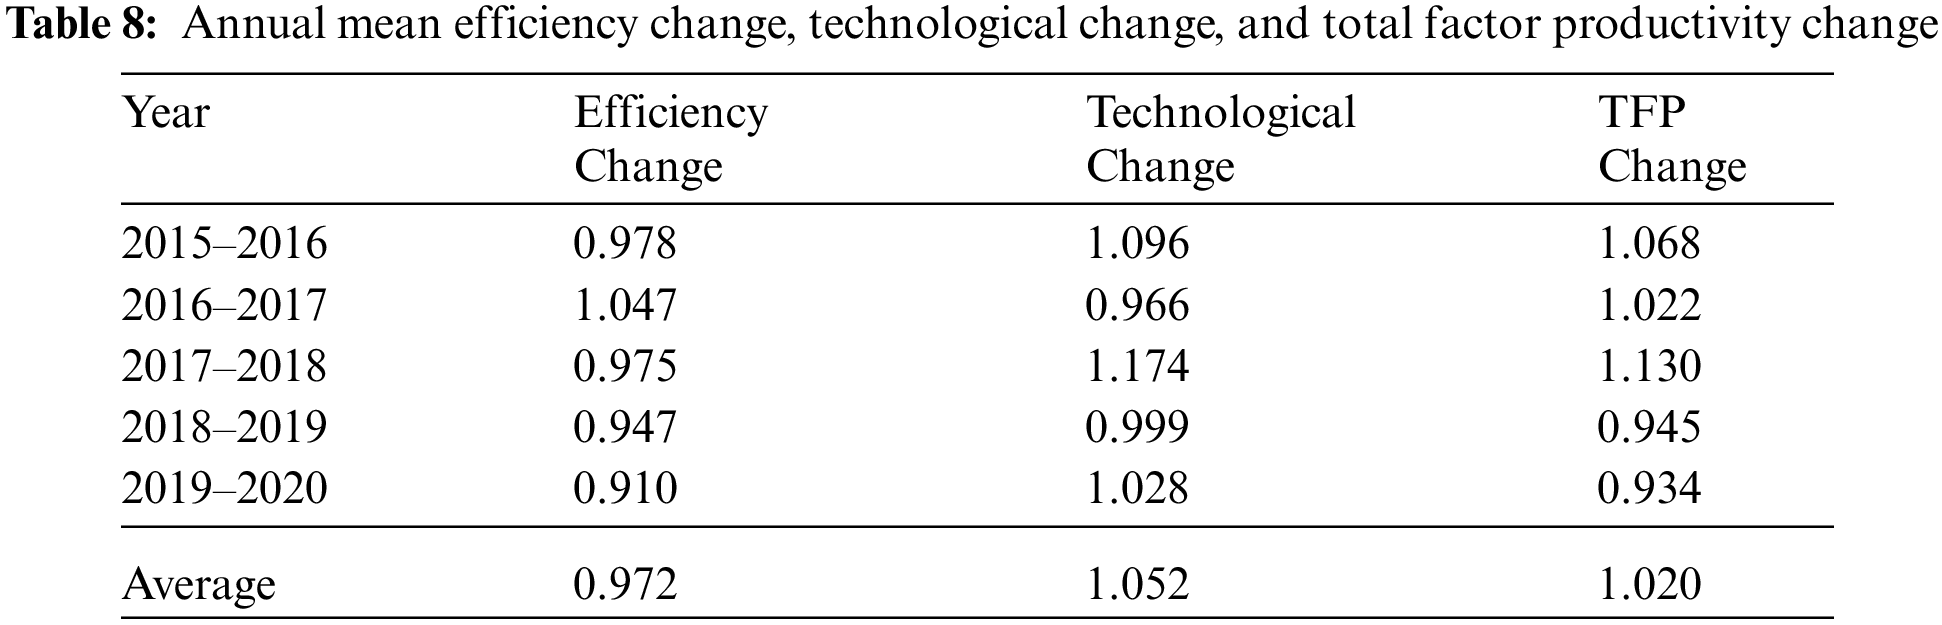
MPI is the result of efficiency and technological changes. Tab. 8 shows the overall results, which reveal that total factor productivity increased by 2% per year, with technological change contributing 5.2% per year and a 2.8% decrease in efficiency change. It implies that technological progress contributed to an increase in productivity during the study period. This technological advancement could be the result of innovation and implementation of technologies in the generation of industry 4.0. Vietnamese F&B firms may boost their technological capacity, but they face difficulties in increasing their efficiency. This demonstrates that the F&B industry should concentrate on both efficiency and technological advancement because these two components are important for supporting the industries to reach sustainable development.
4.3 Managerial Decision-Making Matrix
This research establishes five decision-making matrixes for five periods from 2015 to 2020 as indicated in Fig. 3 by integrating the findings of the relative efficiency and productivity change assessments to position the F&B firms in this industry and offer guidance for improving efficiency.
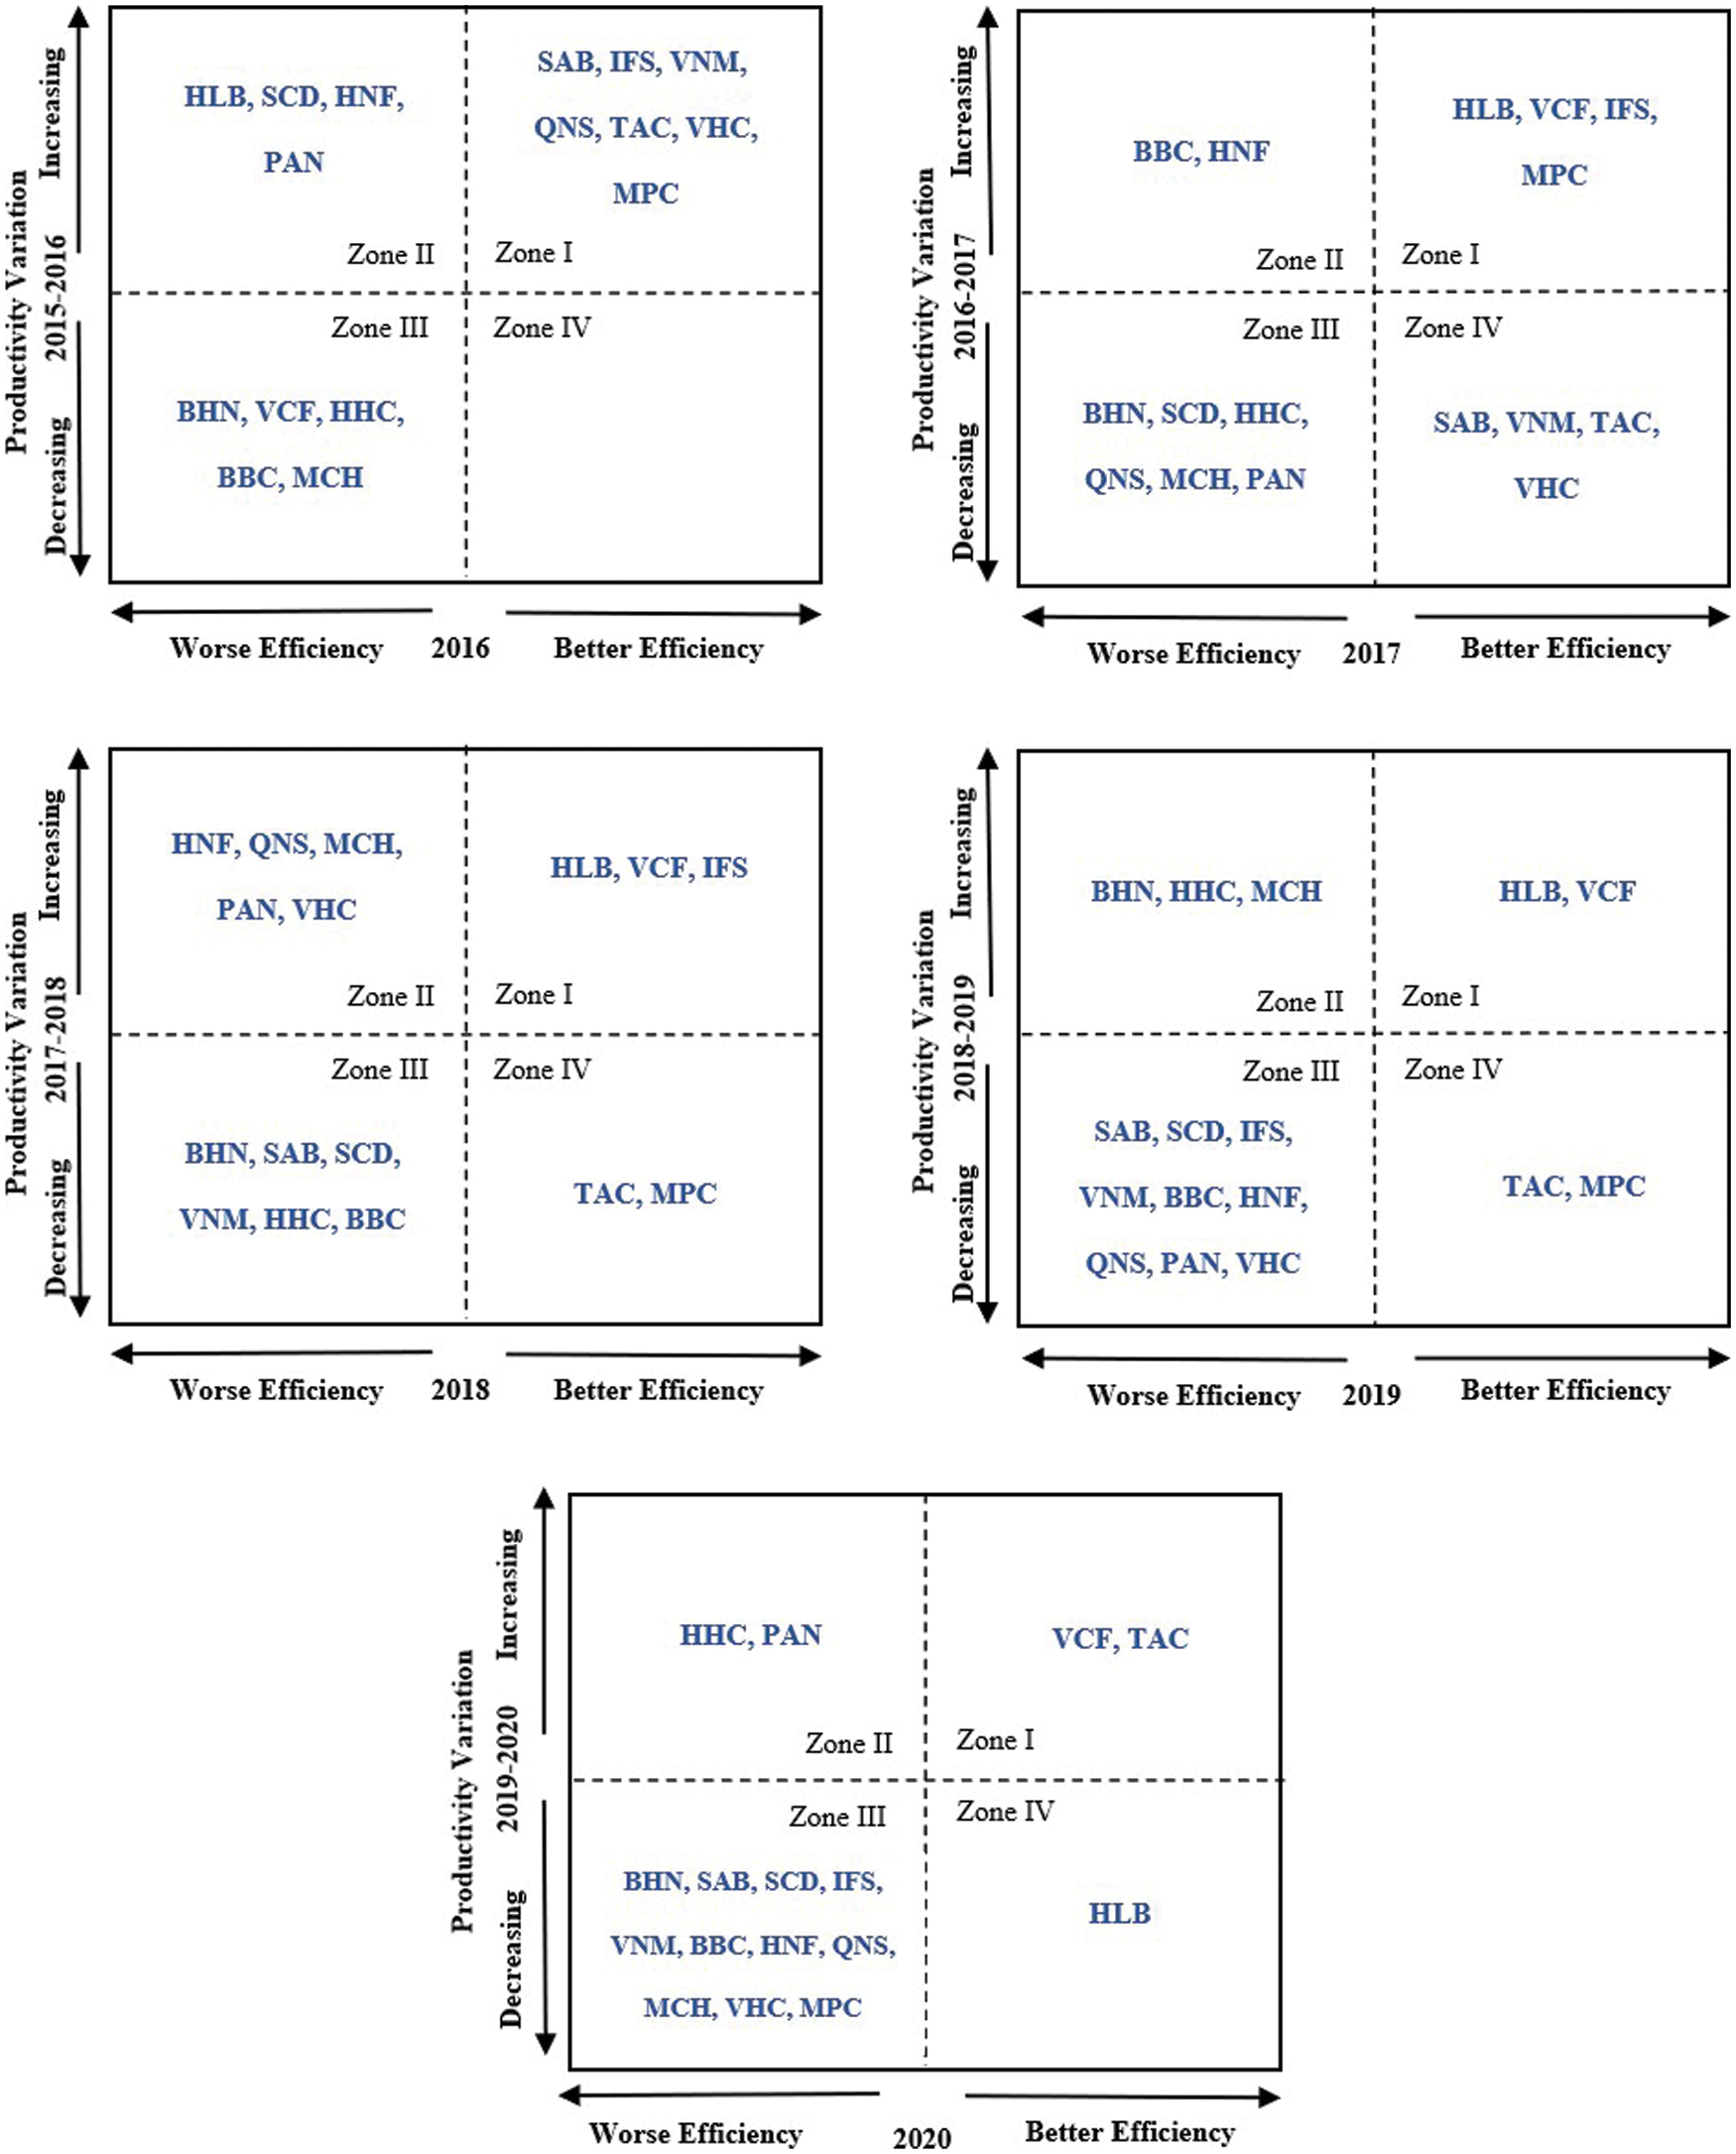
Figure 3: Managerial decision-making matrices for five periods from 2015 to 2020
Firstly, the cutting point is 1 derived from both the super-SBM scores and the Malmquist Index. Secondly, taking the results with the super-SBM score as the matrix’s horizontal axis for measuring the operational efficiency. The F&B company with a score larger than one represents that it operated more efficiently in the study year. A company with a higher operational efficiency value has an excellent operating performance in that year, which also means the company has greater competitiveness. The F&B company with a score smaller than one represents that it operated inefficiently in the study year. Finally, the vertical axis would be productivity shift (Malmquist productivity index). The MPI values higher than one indicate that the F&B corporations improved total factor productivity during the study period. A higher MPI value means that a company with a faster pace of progress over the study period, and if the company can maintain this speed, it is considered to have the potential power of sustained development. The F&B companies are divided into four groups described in the following paragraphs.
Companies in zone I: These companies have an efficiency score and MPI above 1. This group represents companies with high competitiveness and good progress in a competitive improvement. During the study period, these companies displayed strong managerial performance as well as positive growth, and they served as ideal models for other enterprises. The results signify that these companies have the right operating policy and operational efficiency. They would be able to maintain their leadership status if they have remained to control the resource effectively and prevented big managerial errors.
Companies in zone II: These companies have an efficiency score of less than 1 and MPI more than one. It means these companies experienced inefficient performance and an increase in variation in productivity. Their existing resource inputs did not generate effective outputs, but the attempts they have made resulted in positive productivity. If they improve their efficiency, they will be able to step up to the “star group” in zone I. The enterprises in this region are suggested to concentrate more on practices to strengthen organizational management.
Companies in zone III: These companies have an efficiency score and MPI less than 1. It means these companies performed worse both in terms of efficient performance and variation in productivity. This group includes the companies with low competitiveness and with backward progress. To keep up with the “stars group” in zone I, these firms must immediately improve their efficiency and then increase their productivity.
Companies in zone IV: These companies have an efficiency score above 1 and MPI less than 1. It means these companies operated more effectively but experienced a decreasing variation in productivity. If they increase total factor productivity, they may be able to climb up into the “star group” in zone I. It is recommended that they develop strategies to significantly broaden their market for improving productivity.
From the matrices in Fig. 3, we can find that company IFS is located in zone I during the period 2015–2018. This illustrates that this firm has high competitiveness and good progress in terms of competitive improvement. It operated more effectively and achieved progress in total factor productivity as a result of implementing the appropriate operational strategy. However, in the next periods from 2018 to 2020, this firm was moved to zone III. This may be due to a lack of good resource management and major managerial errors on the part of the organizations.
In the first period 2015–2016, company VCF was located in zone III. However, in the following years from 2016 to 2020, this company moved up into the “star group” in zone I and stayed there. This illustrates that company VCF makes improvements in efficiency and total factor productivity. For the period 2016–2019, company HLB belongs to zone I, which means that this company is efficient and increases productivity during this period. However, in the 2019–2020 period, this company moved to zone IV, indicating that it has been unable to maintain successful productivity. Company TAC is located in zone IV from 2016 to 2019, which means that it operated effectively during this period but has not achieved progress in total factor productivity to move to zone I. However, in the next period 2019–2020, it increased productivity and moved to zone I. The reason may be that it implemented policies to continuously grow its market for improving competitiveness.
These matrices clearly reveal a few enterprises that are underperforming, such as companies VNM, SAB, SCD, BBC, and BHN. Companies VNM and SAB are located in zone III during the period 2017–2020. Company SCD firm is situated in zone III during the period 2016–2020, company BHN corporation is located in zone III during 2015–2018 and 2019–2020. Company BBC is also located in zone III from 2015 to 2016 and 2017 to 2020. It means that this company performed worse both in terms of efficiency and variation in productivity. Company BBC has not made any modifications to increase performance in a long time, so they are uncompetitive.
This study uses MPI to determine how a company’s productivity changed over time. The results indicate that the technological progress contributed to an increase in productivity during the study period. This technological development may be a result of firms’ creativity and adoption of new technologies. According to the slack analysis, the F&B firms must monitor the price of materials, as well as improve other factors affecting operational costs, such as machinery and labor productivity, to enhance efficiency. The MPI results reveal that total factor productivity increased by 2% per year, with technological change contributing 5.2% per year and a 2.8% decrease in efficiency change. It implies that technological progress contributed to an increase in productivity during the study period. This technological advancement could be the result of innovation and implementation of technological advances in the generation of industry 4.0. Vietnamese F&B companies may boost their technological capacity, but they face difficulties in increasing their efficiency. This demonstrates that the F&B industry should concentrate on both efficiency and technological advancement because these two components will be established together to support the industry in reaching sustainable development.
This research applies the DEA method to examine the performance of 16 F&B firms in Vietnam from 2015 to 2020. Super-SBM is used to calculate the score and ranking of 16 F&B firms. The obtained findings reveal that Vietnamese F&B companies are generally inefficient over a six-year period because the number of inefficient firms exceeds efficient ones per year from 2015 to 2020. The primary reason for the low score is an excess of inputs, specifically the use of excessive operating costs. Five decision-making matrixes are constructed for five periods by integrating the findings of the relative efficiency and productivity change.
This work builds a comprehensive and practical evaluation framework to investigate the F&B industry’s development using two effective DEA models, the Super-SBM model and the MPI. The research practical contribution is the thorough knowledge gained through solving the case study of 16 leading F&B companies. The results can assist senior managers of the F&B companies to develop strategies for increasing efficiency and overcoming challenges. The F&B companies can better understand their competitiveness in the market by comparing their performances to the industry average.
Funding Statement: This research was supported in part by the Ministry of Science and Technology in Taiwan under Grants MOST 109-2410-H-027-012-MY2.
Conflicts of Interest: The authors declare that they have no conflicts of interest to report regarding the present study.
1. European Foundation for the Improvement of Living and Working Conditions, “The future of the food and drink sector,”. [Online]. Available: https://www.eurofound.europa.eu. [Google Scholar]
2. TriStar Plastics Corp., “Food and beverage industry overview: Why bearing materials matter,”. [Online]. Available: https://www.tstar.com/food-and-beverage-industry-overview. [Google Scholar]
3. European Commission, The food and beverage market entry handbook: Thailand: A practical guide to the market in Thailand for European agri-food products. European Union, 2020. [Google Scholar]
4. Vietnam Report, “The ranking of top 500 largest enterprises in Vietnam in 2019,”. [Online]. Available: https://vietnamreport.net.vn. [Google Scholar]
5. VietnamCredit, “Industry forecast: Future of Vietnam food & beverage industry,”. [Online]. Available: https://vietnamcredit.com.vn/news/industry-forecast-future-of-vietnam-food-beverage-industry_13602. [Google Scholar]
6. Vietnam Investment Review, “The food and beverage industry has had many changes after 2 shocks,”. [Online]. Available: https://tinnhanhchungkhoan.vn. [Google Scholar]
7. T. Holvad, “Efficiency analyses for the railway sector: An overview of key issues,” Research in Transportation Economics, vol. 82, no. 5, pp. 1–9, 2020. [Google Scholar]
8. L. R. Murillo-Zamorano and J. A. Vega-Cervera, “Use of parametric and non-parametric frontier methods to measure the productive efficiency in the industrial sector: A comparative study,” International Journal of Production Economics, vol. 69, no. 3, pp. 265–275, 2001. [Google Scholar]
9. B. J. Parman and A. M. Featherstone, “A comparison of parametric and nonparametric estimation methods for cost frontiers and economic measures,” Journal of Applied Economics, vol. 22, no. 1, pp. 60–85, 2019. [Google Scholar]
10. M. J. Farrell, “The measurement of productive efficiency,” Journal of the Royal Statistical Society, vol. 120, no. 3, pp. 253–290, 1957. [Google Scholar]
11. A. Charnes, W. W. Cooper and E. Rhodes, “Measuring the efficiency of decision making units,” European Journal of Operational Research, vol. 2, no. 6, pp. 429–444, 1978. [Google Scholar]
12. C. -N. Wang, N. -A. -T. Nguyen, T. -T. Dang and T. -T. -Q. Trinh, “A decision support model for measuring technological progress and productivity growth: The case of commercial banks in Vietnam,” Axioms, vol. 10, no. 3, pp. 131, 2021. [Google Scholar]
13. C. -N. Wang, N. -A. -T. Nguyen, H. -P. Fu, H. -P. Hsu and T. -T. Dang, “Efficiency assessment of seaport terminal operators using DEA malmquist and epsilon-based measure models,” Axioms, vol. 10, no. 2, pp. 48, 2021. [Google Scholar]
14. B. Kotey and C. J. O’Donnell, “Data envelopment analysis in small and medium enterprises: A study of the Australian food, beverages and tobacco manufacturing industry,” Small Enterprise Research, vol. 10, no. 2, pp. 3–22, 2002. [Google Scholar]
15. E. Dimara, D. Skuras, K. Tsekouras and D. Tzelepis, “Productive efficiency and firm exit in the food sector,” Food Policy, vol. 33, no. 2, pp. 185–196, 2008. [Google Scholar]
16. J. Ali, S. P. Singh and E. Ekanem, “Efficiency and productivity changes in the Indian food processing industry: Determinants and policy implications,” The International Food and Agribusiness Management Review, vol. 12, no. 1, pp. 43–66, 2009. [Google Scholar]
17. A. Tektas and E. O. Tosun, “Performance benchmarking in Turkish food and beverage industry,” Communications of the IBIMA, vol. 2010, pp. 1–10, 2010. [Google Scholar]
18. M. N. Shamsuddin, “Evaluation of market competitiveness of SMEs in the Malaysian processing food industry,” Journal of Agribusiness Marketing, vol. 4, pp. 1–20, 2011. [Google Scholar]
19. S. Rodmanee and W. -C. Huang, “Efficiency evaluation of food and beverage companies in Thailand: An application of relational two-stage data envelopment analysis,” International Journal of Social Science and Humanity, vol. 3, no. 3, pp. 202–205, 2013. [Google Scholar]
20. D. Giokas, N. Eriotis and I. Dokas, “Efficiency and productivity of the food and beverage listed firms in the pre-recession and recessionary periods in Greece,” Applied Economics, vol. 47, no. 19, pp. 1927–1941, 2015. [Google Scholar]
21. M. Gardijan and Z. Lukac, “Measuring the relative efficiency of the food and drink industry in the chosen EU countries using the data envelopment analysis with missing data,” Central European Journal of Operations Research, vol. 26, no. 3, pp. 695–713, 2018. [Google Scholar]
22. J. -L. Hu, C.-N. Chiu and H. -T. Chu, “Managerial efficiency in the food and beverage industry in Taiwan,” Journal of Hospitality Financial Management, vol. 27, no. 1, pp. 39–48, 2019. [Google Scholar]
23. C. -N. Wang, M. N. Nguyen, A. L. Le and H. Tibo, “A DEA resampling past-present-future comparative analysis of the food and beverage industry: The case study on Thailand vs. Vietnam,” Mathematics, vol. 8, no. 7, pp. 1–24, 2020. [Google Scholar]
24. M. G. Kedzo and Z. Lukac, “The financial efficiency of small food and drink producers across selected European Union countries using data envelopment analysis,” European Journal of Operational Research, vol. 291, no. 2, pp. 586–600, 2021. [Google Scholar]
25. “Top 10 prestigious Vietnamese companies in the food and beverage industry,” (accessed on 7 April 20212018. [Online]. Available: https://vietnamreport.net.vn. [Google Scholar]
26. “Top 10 prestigious Vietnamese companies in the food and beverage industry,” (accessed on 7 April 20212019. [Online]. Available: https://vietnamreport.net.vn. [Google Scholar]
27. “Top 10 prestigious Vietnamese companies in the food and beverage industry,” (accessed on 7 April 20212020. [Online]. Available: https://vietnamreport.net.vn. [Google Scholar]
28. K. Tone, “A slacks-based measure of efficiency in data envelopment analysis,” European Journal of Operational Research, vol. 130, no. 3, pp. 498–509, 2001. [Google Scholar]
29. K. Tone, “A slacks-based measure of super-efficiency in data envelopment analysis,” European Journal of Operational Research, vol. 143, no. 1, pp. 32–41, 2002. [Google Scholar]
30. R. Fare, S. Grosskopf, M. Norris and Z. Zhang, “Productivity growth, technical progress, and efficiency change in industrialized countries,” American Economic Review, vol. 84, no. 1, pp. 66–83, 1994. [Google Scholar]
 | This work is licensed under a Creative Commons Attribution 4.0 International License, which permits unrestricted use, distribution, and reproduction in any medium, provided the original work is properly cited. |