DOI:10.32604/cmc.2022.030806
| Computers, Materials & Continua DOI:10.32604/cmc.2022.030806 | |
| Article |
Enhanced Metaheuristics-Based Clustering Scheme for Wireless Multimedia Sensor Networks
1Department of Computer Science and Engineering, Vardhaman College of Engineering (Autonomous), Hyderabad, Telangana, 501218, India
2Department of Computer Science, College of Computer and Information Sciences, Majmaah University, Al-Majmaah, 11952, Saudi Arabia
3Department of Electrical Engineering, College of Engineering, Jouf University, Saudi Arabia
4Department of Computer Science and Engineering, Vignan’s Institute of Information Technology, Visakhapatnam, 530049, India
5Department of Computer Science and Engineering, Sejong University, Seoul, 05006, Korea
6Department of Software Convergence, Daegu Catholic University, Gyeongsan, 38430, Korea
*Corresponding Author: Woong Cho. Email: wcho@cu.ac.kr
Received: 02 April 2022; Accepted: 19 May 2022
Abstract: Traditional Wireless Sensor Networks (WSNs) comprise of cost-effective sensors that can send physical parameters of the target environment to an intended user. With the evolution of technology, multimedia sensor nodes have become the hot research topic since it can continue gathering multimedia content and scalar from the target domain. The existence of multimedia sensors, integrated with effective signal processing and multimedia source coding approaches, has led to the increased application of Wireless Multimedia Sensor Network (WMSN). This sort of network has the potential to capture, transmit, and receive multimedia content. Since energy is a major source in WMSN, novel clustering approaches are essential to deal with adaptive topologies of WMSN and prolonged network lifetime. With this motivation, the current study develops an Enhanced Spider Monkey Optimization-based Energy-Aware Clustering Scheme (ESMO-EACS) for WMSN. The proposed ESMO-EACS model derives ESMO algorithm by incorporating the concepts of SMO algorithm and quantum computing. The proposed ESMO-EACS model involves the design of fitness functions using distinct input parameters for effective construction of clusters. A comprehensive experimental analysis was conducted to validate the effectiveness of the proposed ESMO-EACS technique in terms of different performance measures. The simulation outcome established the superiority of the proposed ESMO-EACS technique to other methods under various measures.
Keywords: Wireless multimedia sensor networks; clustering; spider monkey optimization algorithm; energy efficiency; metaheuristics; quantum computing
Recently, Wireless Multimedia Sensor Network (WMSN) has become the most preferred technological advancement to be incorporated in monitoring, surveillance and control applications under several scenarios that include public security, industrial automation, visual surveillance, health assistance, traffic control, etc. [1]. With cost-effective sensing and wireless techniques, WMSN has been developed to function in distinct network architectures with the incorporation of internet service in application-specific networks [2–4]. Internet of Things (IoT) concept has been conceived in the context of convergent communication in which the conventional internet values are fused into Wireless Sensor Network (WSN). WMSN is composed of source nodes that continuously stream or define the period of time. In this case, huge volumes of data may flow via the network towards sink node.
In Ad Hoc networks that are comprised of lower-rate wireless personal range network technique, namely IEEE 802.15.4 Medium Access Control (MAC) protocol [5], massive quantities of packets cannot be transmitted owing to low bandwidth. Furthermore, several packets might get communicated via Ad Hoc paths which quickly drains the energy in Sensor Nodes (SNs) [6]. In largescale networks, when each and every node has to transmit the information to their corresponding terminus, it expends the energy quickly due to long distance, huge quantity of information, and multiple-hop nature of the transmission [7]. In addition to these, this sort of data dissemination may also result in network disagreement. Clustering is a typical method used to accomplish scalable and efficient control in networks [8] while it has various advantages to its credit; it enables the distribution of control through network; stores energy; and minimizes network contention by allowing the locality of transmission. The nodes communicate the information through a short distance to the corresponding Cluster Head (CH). The CH aggregates this information into a small group of useful data [9,10]. Fig. 1 displays the infrastructure of WMSN.
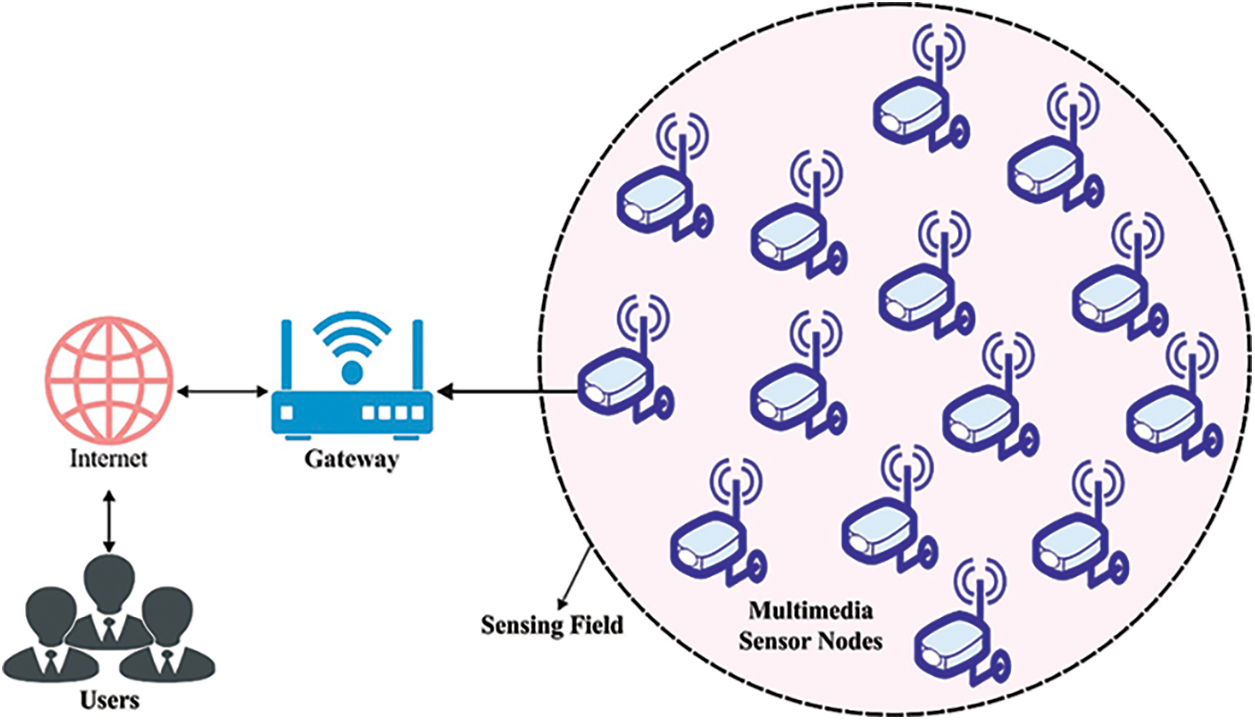
Figure 1: Structure of WMSN
Kadiravan et al. [11] aimed at achieving minimal count of energy deployment in their study. The existing investigation work presented a novel Density-Based Clustering (DBC) approach to achieve energy efficiency in WMSN. DBC method was mostly utilized for data collection in healthcare environment and is mostly dependent upon three input parameters such as node centrality, Residual Energy (RE) level, and distance. Besides, two static data collector points named ‘Super Cluster Head (SCH)’ were also located. Yazici et al. [12] presented a fusion-based WMSN structure which decreases the count of data broadcasted on network through intra-node processing. This infrastructure explored three important problems: (1) the proposal of WMSN node in the detection of objects using Machine Learning (ML) approaches; (2) this technique helps in enhancing the accuracy while reducing the count of data transmitted by WMS node to Base Station (BS), and; (3) a novel cluster-based routing technique to WMSN which utilizes less power than the existing techniques. In literature [13], Randomized Boltzmann ML Clustering Algorithm (RBMLCA) was projected with randomized technique. It contains optimized Quality of Service (QoS) parameters, clustering of nodes, and CH development. In this altered clustering method to broadcast the data on multimedia sensor network, RBMLCA approach achieved the optimum quality of evolution.
In the study conducted earlier [14], the researchers proposed to increase the lifespan of WMSN network by reducing energy utilization of multimedia data broadcast. In order to accomplish this, an optimum broadcast radius to transfer the sensor node and suitable election of optimum CH at all the rounds were combined with energy utilization method so as to determine the best cost model. Afterward, a novel hybrid optimized method named NC-GSO was developed by hybriding Glowworm Swarm Optimization (GSO) and Dragonfly Algorithm (DA). In literature [15], the researchers proposed a method to minimize four distinct objectives such as delay, packet loss, memory, and the expected broadcast cost. An essential purpose of multi-objective function is to create different optimum solution sets that are employed for evaluating the trade-off amongst distinct objectives.
The current study develops an Enhanced Spider Monkey Optimization-based Energy-Aware Clustering Scheme (ESMO-EACS) for WMSN. The proposed ESMO-EACS model derives ESMO algorithm by incorporating the concepts of SMO algorithm and quantum computing. The proposed ESMO-EACS model involves the design of fitness function using distinct input parameters for effective construction of clusters. A comprehensive experimental analysis was conducted to validate the effectiveness of the presented ESMO-EACS technique in terms of performance under different measures. The simulation outcome established the superiority of the proposed ESMO-EACS technique over other techniques.
In this study, an effective ESMO-EACS technique is projected for WMSN. The proposed ESMO-EACS model derives ESMO algorithm by incorporating the concepts of SMO algorithm and quantum computing. The proposed ESMO-EACS model involves the design of fitness function using distinct input parameters for effective construction of clusters.
In SMO approach [16], Food Seeking Procedure (FSP) characteristics of spider monkeys are employed with Fission-Fusion Social Structure (FFSS). The four stages of the process are given below.
• Once the spider monkeys initiate food scrounging, group measures are performed for food division.
• The position of Local Leader (LL) is upgraded
• Group Leader (GL) upgrades the optimal location to other locals to search food
• The optimum location is upgraded by GL
Large groups are separated into many small groups while GL Limit (GLL) and LL Limit (LLL) are taken into account to determine the optimum location.
whereas,
According to the local members and LL, the novel place of spider monkey is defined. The novel location of the spider monkey is determined as follows.
In Eq. (2), ‘
Here, the position of each object is upgraded on the basis of GL and local members. Now, the novel location is evaluated as given herewith.
In which,
Here, ‘
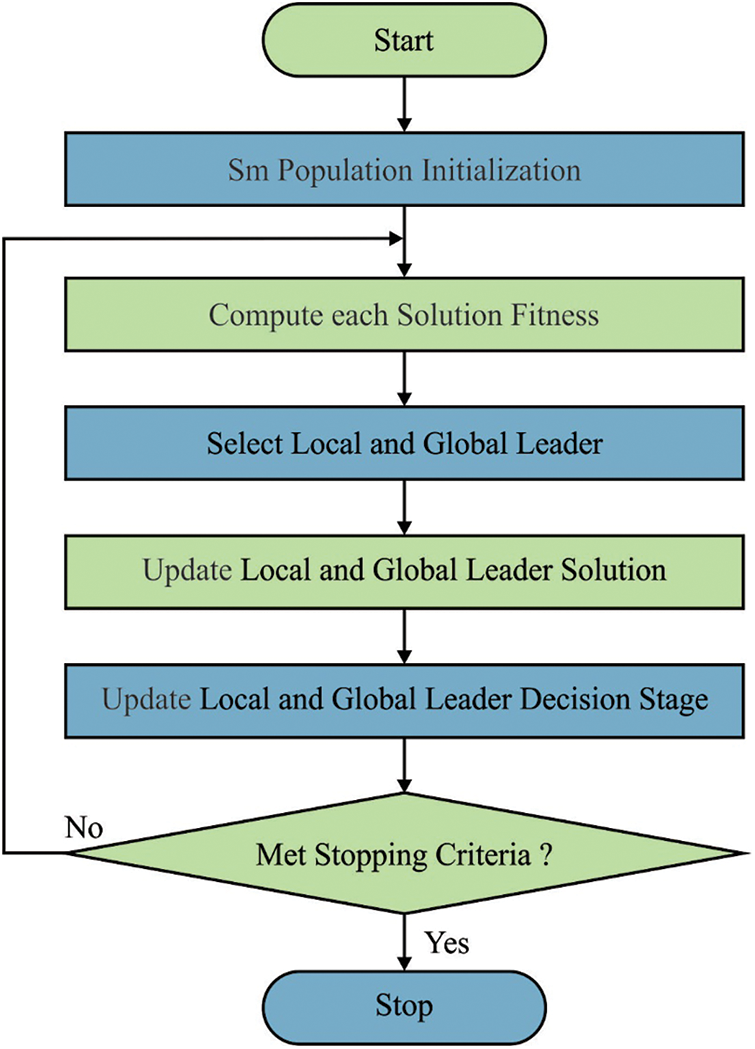
Figure 2: Flowchart of SMO algorithm
Here, the location of GL is upgraded and the object with ‘Best Fitness Value’ (BFV) amongst the population is chosen as GL. When the location of GL is not upgraded, then the optimal solution can be increased to 1.
The member with BFV is chosen as LL and upgraded. If the LL location is not upgraded, then the global optimal solution can be increased to 1.
When the number of LL is higher than LL, the position of each object is upgraded and the novel location of spider monkey can bedetermined as follows.
In this phase, the overall population is separated into small groups, once the amount of global members is higher than GLL. Once the location of GL is not upgraded, then GL connects and frames a single group.
In order to improve the efficiency of SMO, ESMO method is acquired by quantum computing model. It could be a process of computing component that alters the method based on quantum theory as quantum entanglement, quantum measurement, and state superposition. The two fundamental states
The rotation gate is illustrated by mutation operation in order to create a quanta technique-amended solution and it finally determines the global optimum solution [17]. The rotation gate can be described below.
2.2 Application of ESMO Algorithm for Clustering Process
Degree, RE, and distance are assumed to be ineffectual CH Selection (CHS). The sensor node (SN) with maximal RE and degree with minimal distance is deemed to be CHS [18].
The RE of SNs (x), whereas communicating k bits to destination SN (y) on distance
whereas E represents the current energy of SNs and
Here,
The most important parameter for CHS is Average distance (AvgD) to neighboring SN. AvgD signifies the average of distance values to SNs to its single hop adjacent SN that is defined as follows.
whereas
For time sample
In which
The current section discusses about the experimental validation of ESMO-EACS approach under distinct aspects. Tab. 1 and Fig. 3 demonstrate the comparative Network Stability (NSB) analysis results accomplished by ESMO-EACS model under several nodes. The results indicate that the proposed ESMO-EACS model produced the maximum performance with improved NSB over other methods. For instance, on 250 nodes, ESMO-EACS model offered a high NSB of 544 rounds, whereas LEACH, GA, BFSA, and BSFA-TF models obtained the least NSB values such as 408, 492, 531, and 544 rounds respectively. Moreover, on 1000 nodes, the proposed ESMO-EACS model achieved a high NSB of 763 rounds, whereas LEACH, GA, BFSA, and BSFA-TF models gained the least NSB values such as 370, 589, 659, and 694 rounds respectively.
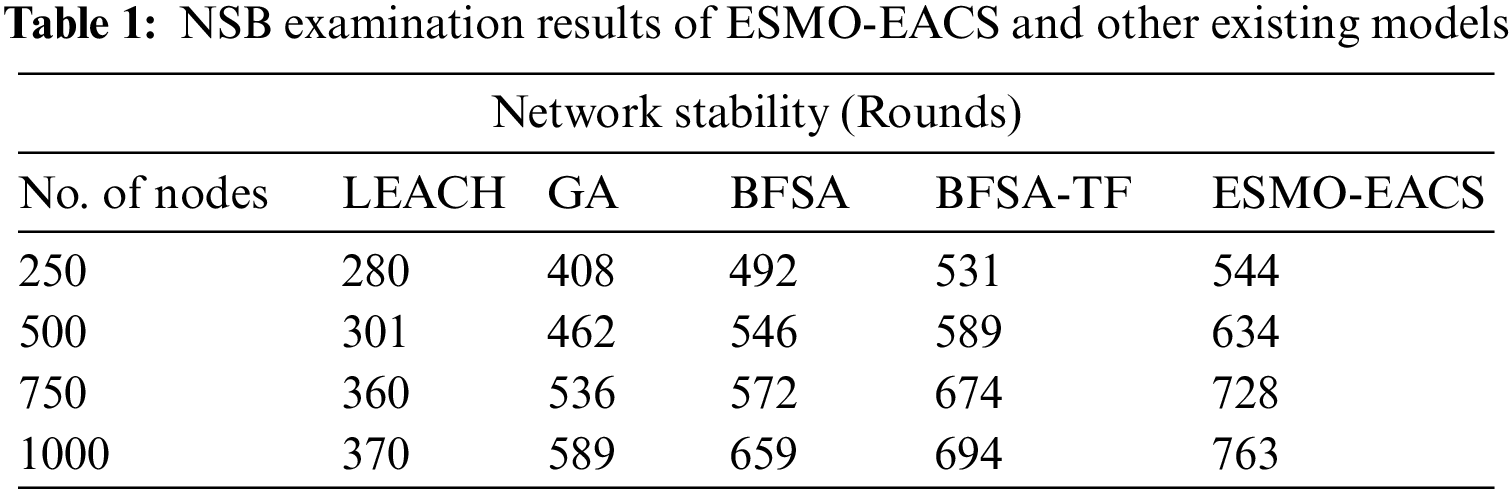
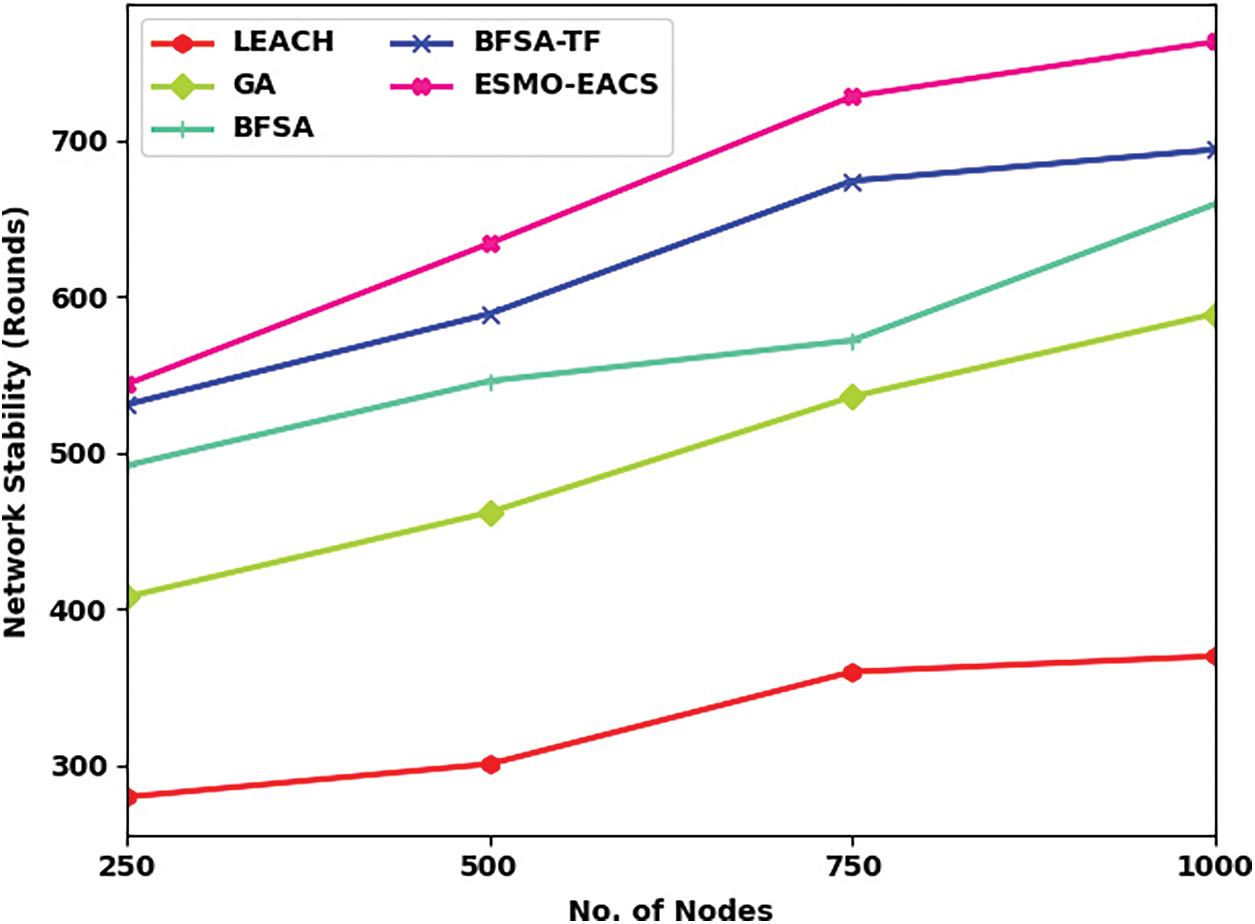
Figure 3: Comparative NSB analysis results of ESMO-EACS and recent models
Tab. 2 and Fig. 4 exhibit the comparative analysis results in terms of Network Lifetime (NLT) accomplished by ESMO-EACS model under numerous nodes. The results infer that the proposed ESMO-EACS model produced the maximum performance with improved NLT over other methods. For instance, on 250 nodes, ESMO-EACS model offered a high NLT of 894 rounds, whereas LEACH, GA, BFSA, and BSFA-TF models achieved lesser NLT values such as 742, 813, 830, and 865 rounds respectively. Furthermore, on 1000 nodes, the proposed ESMO-EACS model delivered a better NLT of 982 rounds, whereas other methods such as LEACH, GA, BFSA, and BSFA-TF models gained the least NLT values such as 892, 913, 956, and 960 rounds respectively.
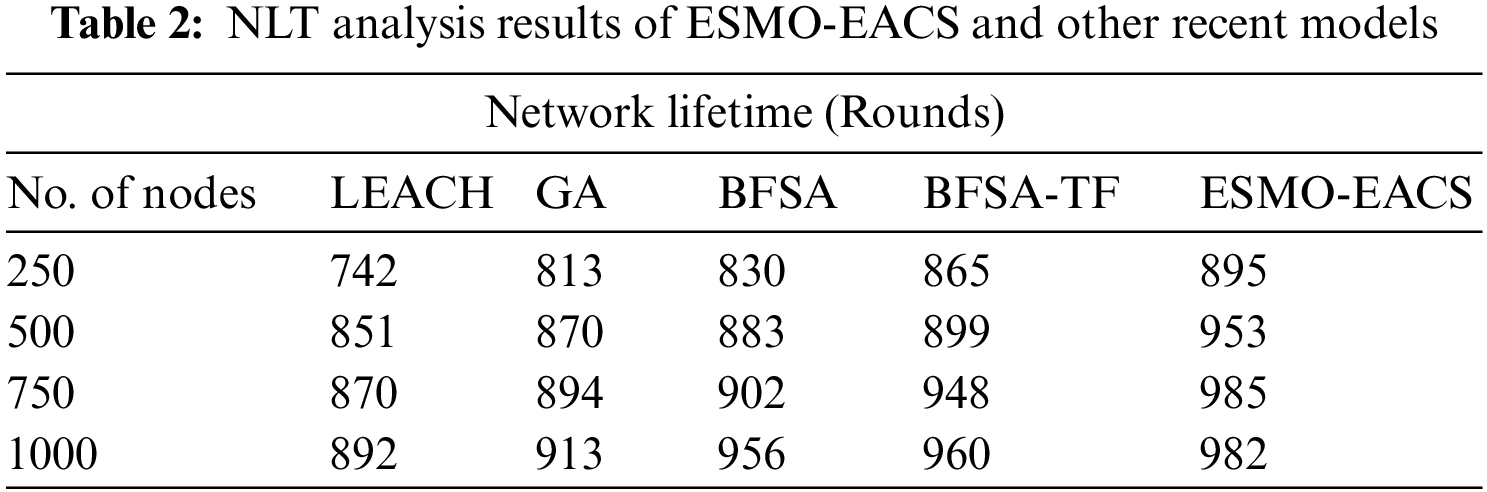
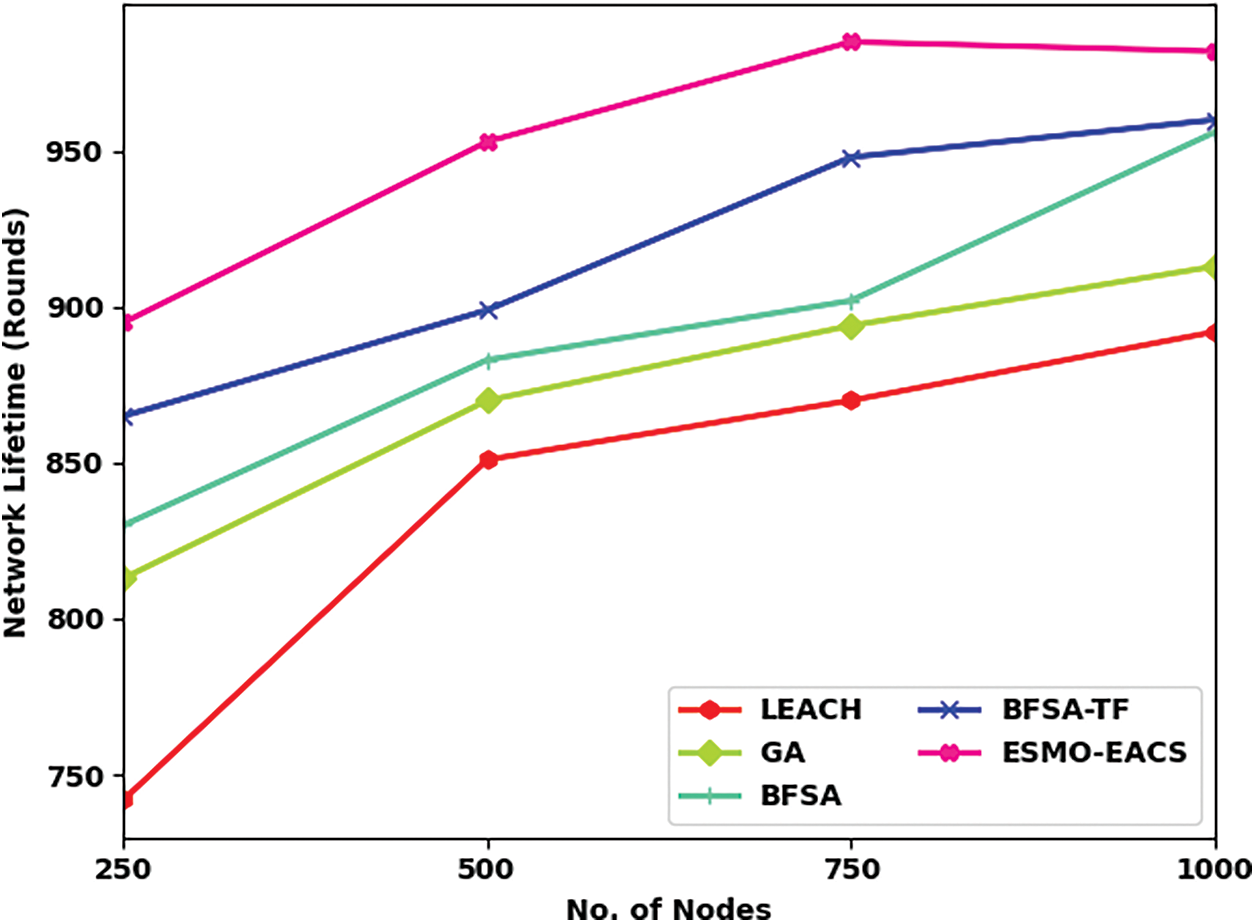
Figure 4: Comparative NLT analysis results of ESMO-EACS and recent models
Average Energy Consumption (AEC) analysis was conducted between ESMO-EACS model and other recent models and the results are shown in brief in Tab. 3 and Fig. 5. The experimental outcomes infer the enhanced performance of ESMO-EACS model under distinct count of nodes. For instance, with 250 nodes, the proposed ESMO-EACS model demanded the least AEC of 0.022 J, whereas LEACH, GA, BFSA, and BFSA-TF models achieved high AEC values such as 0.130, 0.119, 0.078, and 0.028 J respectively. Furthermore, with 1000 nodes, ESMO-EACS model provided the least AEC of 0.009 J, whereas LEACH, GA, BFSA, and BFSA-TF models demanded high AEC values such as 0.157, 0.103, 0.067, and 0.060 J respectively.
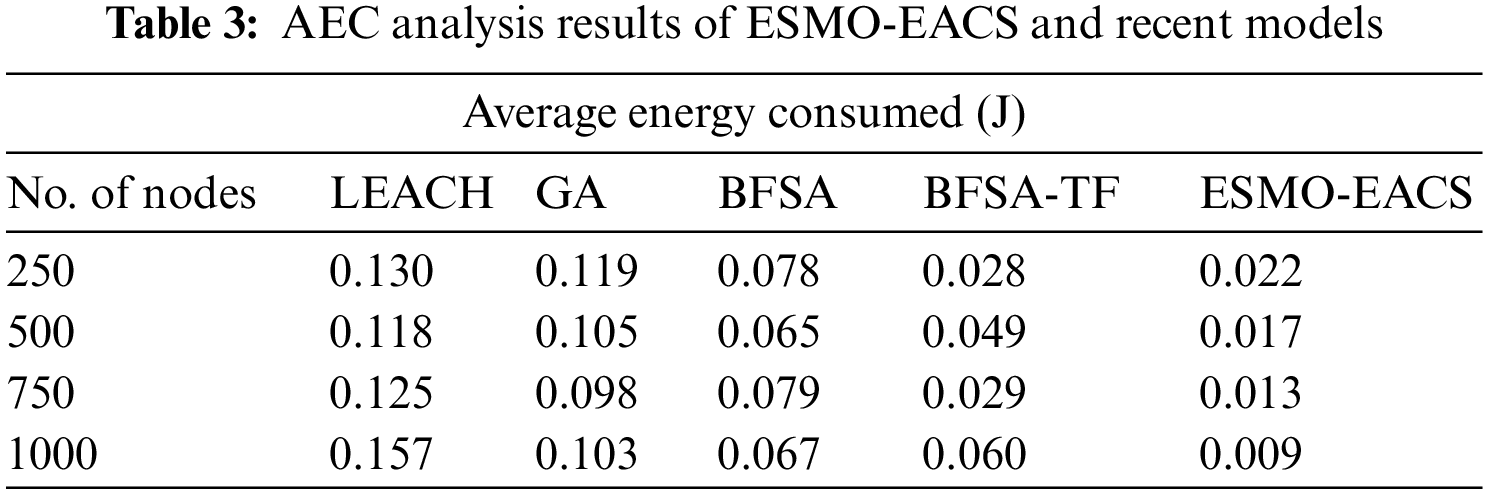
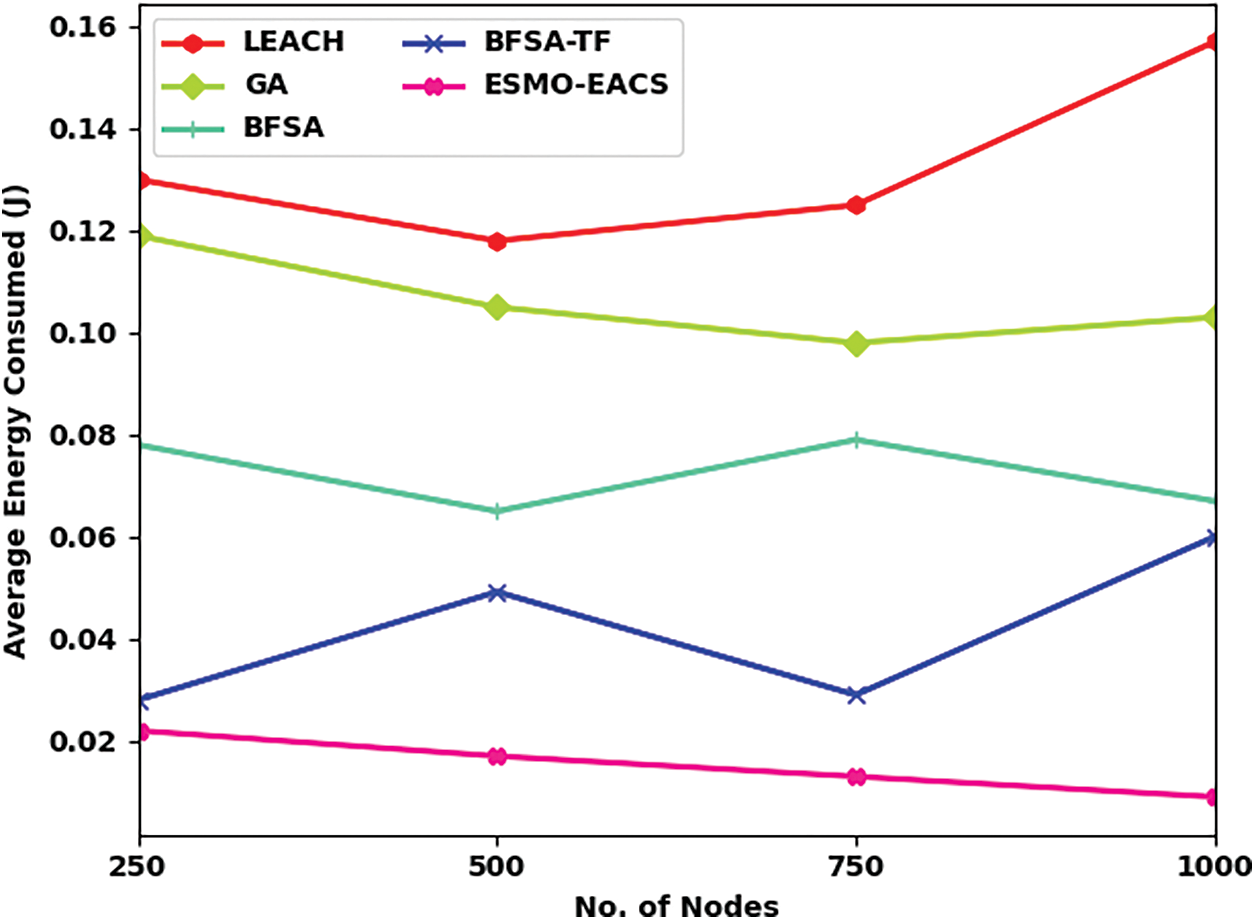
Figure 5: Comparative AEC analysis results of ESMO-EACS and other recent models
Tab. 4 and Fig. 6 display the comparative analysis results between the proposed ESMO-EACS model and other models under different number of nodes in terms of throughput (THRP). The results showcase that the proposed ESMO-EACS model achieved the maximum performance with improved THRP over other methods. For instance, on 250 nodes, ESMO-EACS model offered a high THRP of 27563 Kbps, whereas LEACH, GA, BFSA, and BSFA-TF models achieved lesser THRP values namely, 12487, 15876, 21658, and 23856 Kbps. Furthermore, on 1000 nodes, the proposed ESMO-EACS model delivered a better THRP of 54716 Kbps, whereas LEACH, GA, BFSA, and BSFA-TF models achieved less THRP values such as 35170, 48310, 50652, and 52990 Kbps respectively.
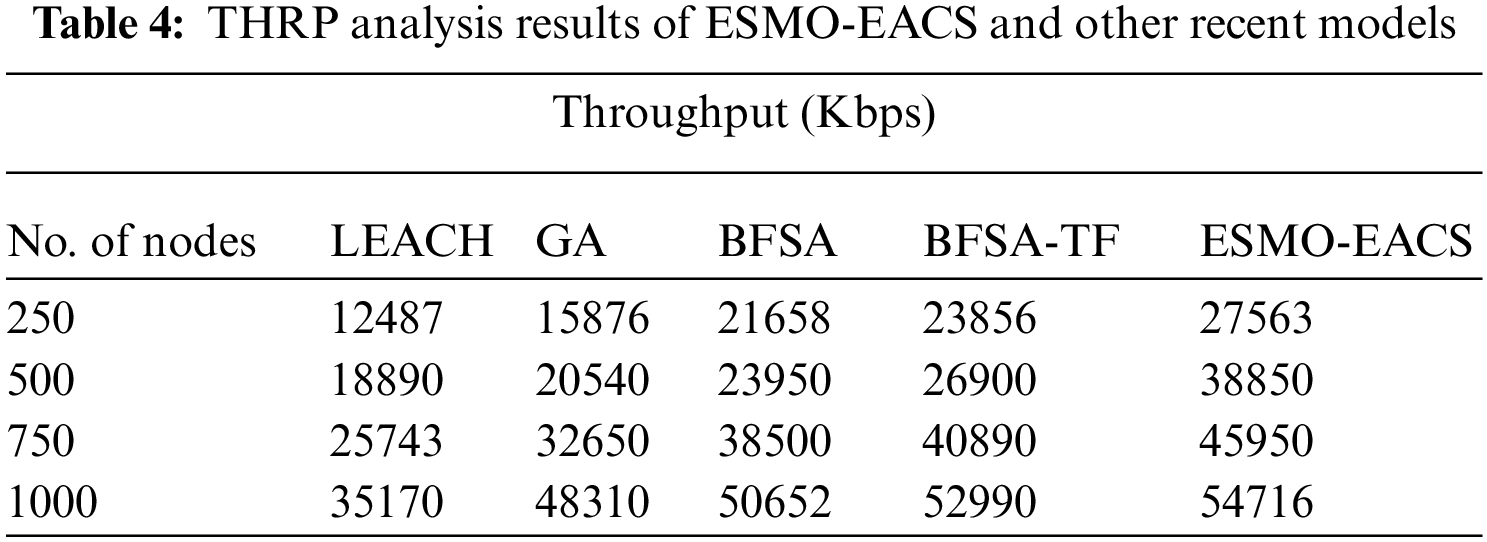
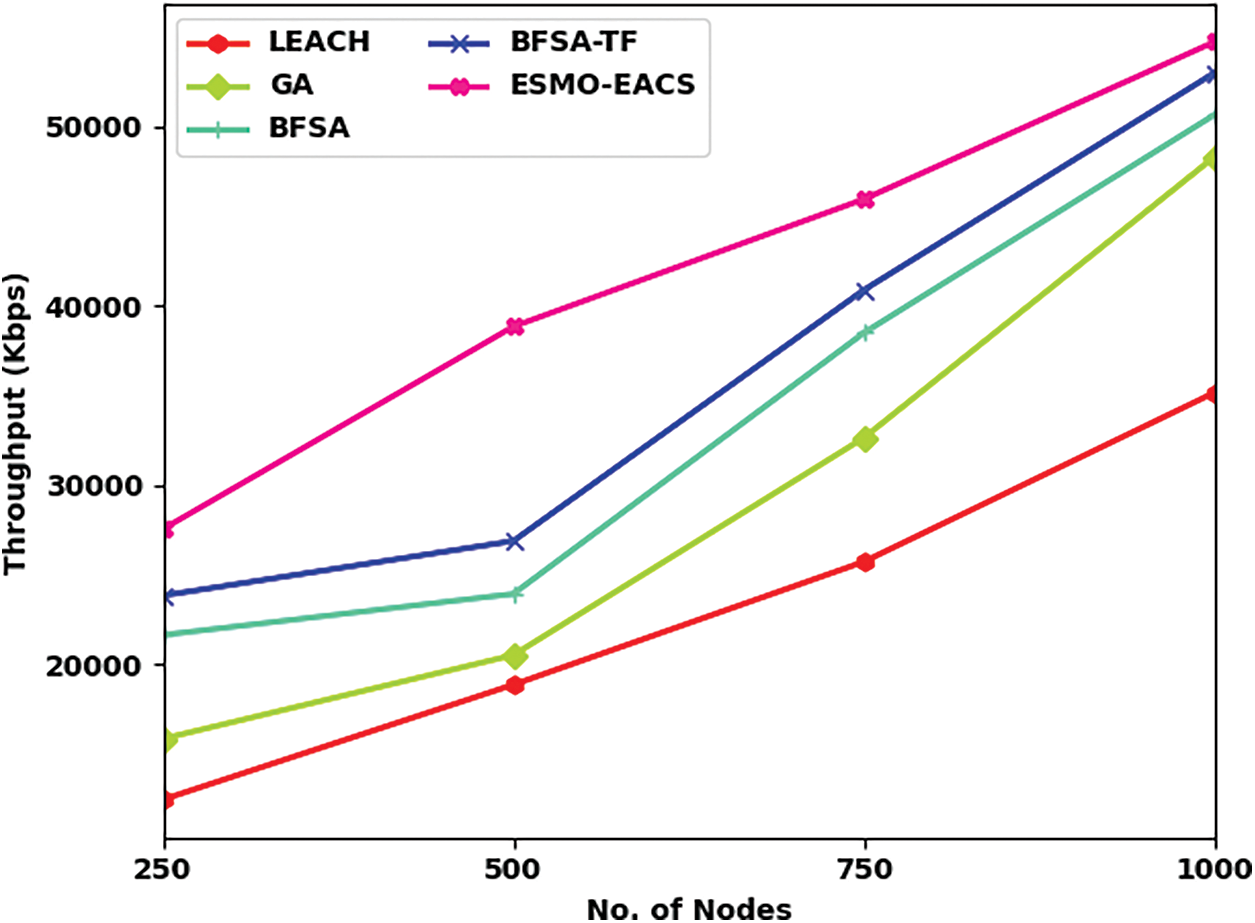
Figure 6: Comparative THRP analysis results of ESMO-EACS and other recent models
Tab. 5 and Fig. 7 illustrate the comparative Packet Delivery Ratio (PDR) analysis results accomplished by ESMO-EACS and other models under several nodes. The results convey that the proposed ESMO-EACS model attained the maximum performance with improved PDR than other approaches. For sample, on 250 nodes, ESMO-EACS model obtained a superior PDR of 0.96 rounds, while LEACH, GA, BFSA, and BSFA-TF models obtained the least PDR values such as 0.90, 0.91, 0.92, and 0.94 correspondingly. Moreover, on 1000 nodes, the proposed ESMO-EACS model accomplished an increased PDR of 0.94 rounds, whereas LEACH, GA, BFSA, and BSFA-TF techniques achieved the least PDR values such as 0.87, 0.89, 0.90, and 0.91 rounds respectively.
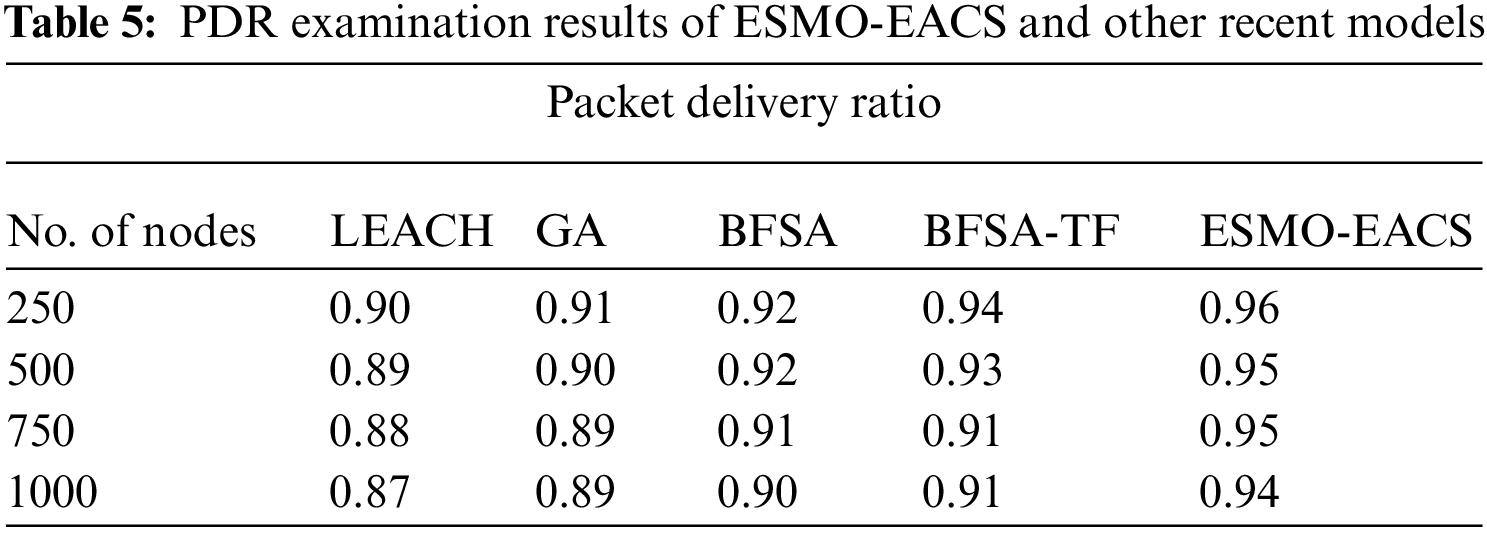
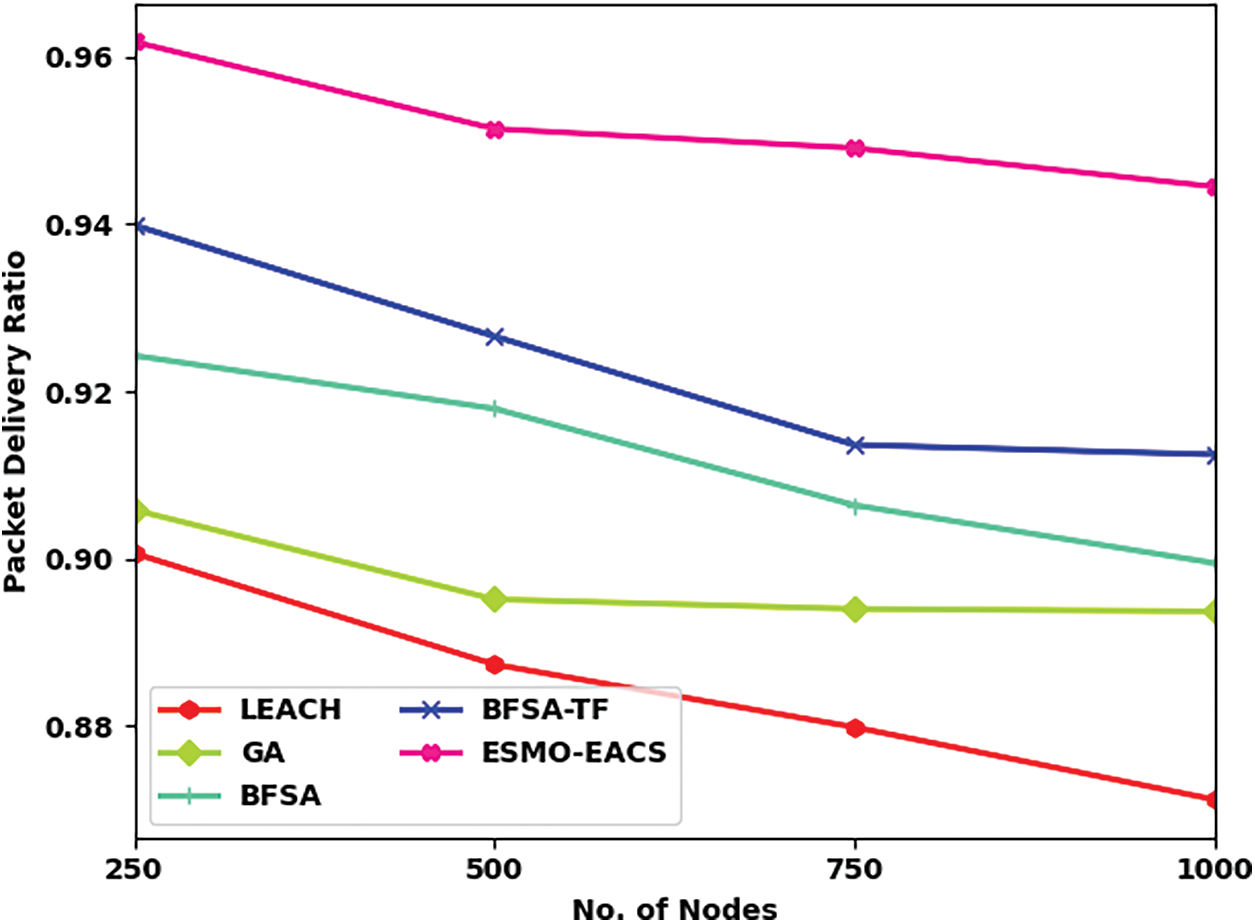
Figure 7: Comparative PDR analysis results of ESMO-EACS and other recent models
A detailed Packet Loss Rate (PLR) analysis was conducted between ESMO-EACS model and other recent models under distinct nodes and the results are shown in Tab. 6 and Fig. 8. The obtained values infer the improved performance of ESMO-EACS model under distinct count of nodes. For sample, with 250 nodes, the proposed ESMO-EACS model achieved a low PLR of 0.04, whereas LEACH, GA, BFSA, and BFSA-TF models obtained improved PLR values such as 0.10, 0.09, 0.08, and 0.06 respectively. Furthermore, with 1000 nodes, the proposed ESMO-EACS model yielded the least PLR of 0.06, whereas LEACH, GA, BFSA, and BFSA-TF models achieved high PLR values such as 0.13, 0.11, 0.10, and 0.09 respectively.
Based on the results achieved from comprehensive comparative analyses, it is evident that the proposed ESMO-EACS model gained effectual outcomes over other methods.
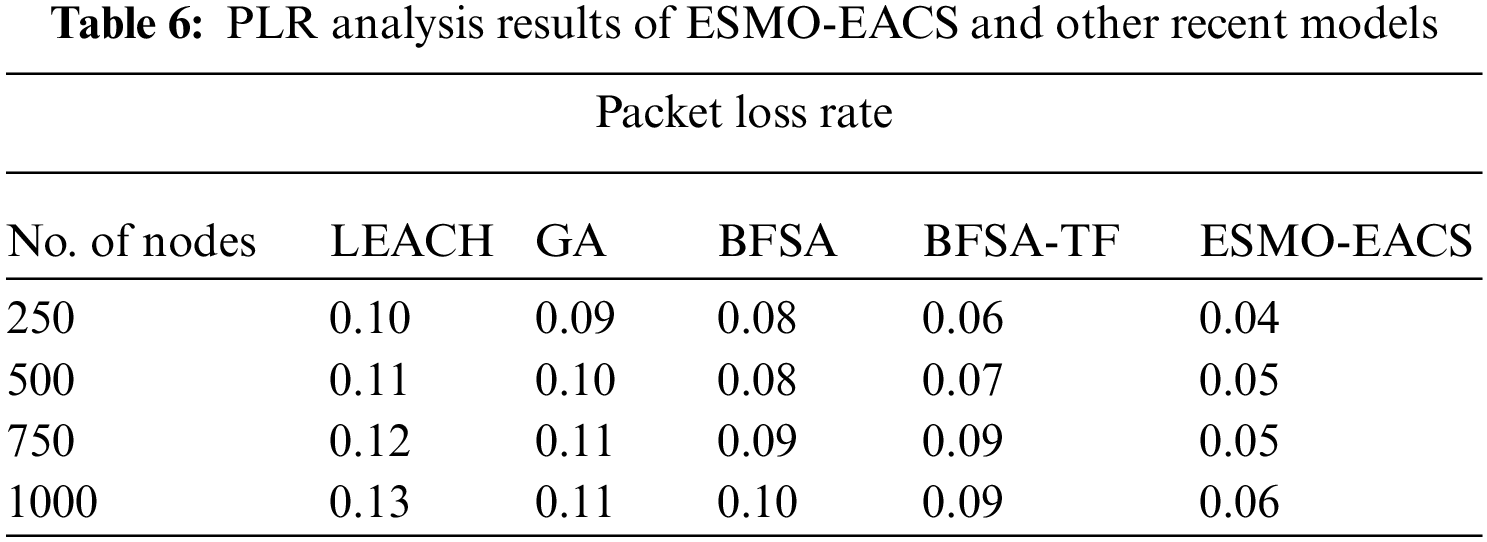
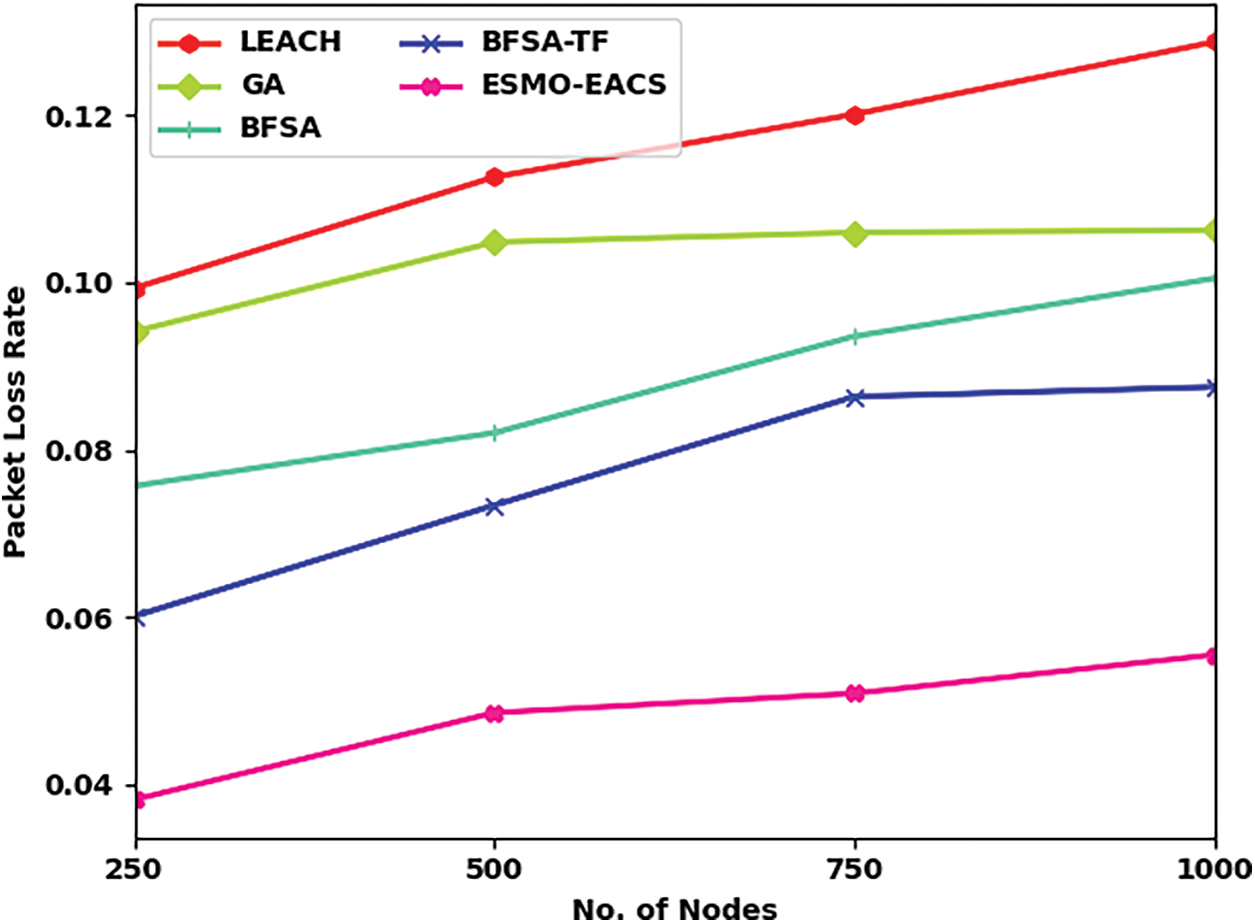
Figure 8: Comparative PLR examination results of ESMO-EACS and other recent models
The current study has developed an effectual ESMO-EACS technique for WMSN. The proposed ESMO-EACS model derives ESMO algorithm by incorporating the concepts of SMO algorithm and quantum computing. The proposed ESMO-EACS model involves the design of fitness function using distinct input parameters for effective construction of clusters. A comprehensive experimental analysis was conducted to validate the effectiveness of the presented ESMO-EACS technique in terms of performance under distinct measures. The simulation outcome infer that ESMO-EACS technique attained the maximum results under different measures compared to other methods. Thus, ESMO-EACS technique can be utilized to accomplish energy efficiency in WMSN. In future, multihop route selection approaches can be designed to further improve the lifetime of network.
Funding Statement: This work was supported by the Ulsan City & Electronics and Telecommunications Research Institute (ETRI) grant funded by the Ulsan City [22AS1600, the development of intelligentization technology for the main industry for manufacturing innovation and Human-mobile-space autonomous collaboration intelligence technology development in industrial sites].
Conflicts of Interest: The authors declare that they have no conflicts of interest to report regarding the present study.
1. S. Arjunan and P. Sujatha, “Lifetime maximization of wireless sensor network using fuzzy based unequal clustering and ACO based routing hybrid protocol,” Applied Intelligence, vol. 48, no. 8, pp. 2229–2246, 2018. [Google Scholar]
2. W. Sun, X. Chen, X. R. Zhang, G. Z. Dai, P. S. Chang et al., “A multi-feature learning model with enhanced local attention for vehicle re-identification,” Computers, Materials & Continua, vol. 69, no. 3, pp. 3549–3560, 2021. [Google Scholar]
3. W. Sun, G. C. Zhang, X. R. Zhang, X. Zhang and N. N. Ge, “Fine-grained vehicle type classification using lightweight convolutional neural network with feature optimization and joint learning strategy,” Multimedia Tools and Applications, vol. 80, no. 20, pp. 30803–30816, 2021. [Google Scholar]
4. S. Arjunan, S. Pothula and D. Ponnurangam, “F5N-based unequal clustering protocol (F5NUCP) for wireless sensor networks,” International Journal of Communication Systems, vol. 31, no. 17, pp. e3811, 2018. [Google Scholar]
5. W. Wang, X. Huang, J. Li, P. Zhang and X. Wang, “Detecting COVID-19 patients in X-ray images based on MAI-nets,” International Journal of Computational Intelligence Systems, vol. 14, no. 1, pp. 1607–1616, 2021. [Google Scholar]
6. Y. Gui and G. Zeng, “Joint learning of visual and spatial features for edit propagation from a single image,” The Visual Computer, vol. 36, no. 3, pp. 469–482, 2020. [Google Scholar]
7. W. Wang, Y. T. Li, T. Zou, X. Wang, J. Y. You et al., “A novel image classification approach via dense-mobile net models,” in Mobile Information Systems, vol. 2020, pp. 1–8, 2020. https://doi.org/10.1155/2020/7602384. [Google Scholar]
8. S. R. Zhou, J. P. Yin and J. M. Zhang, “Local binary pattern (LBP) and local phase quantization (LBQ) based on gabor filter for face representation,” Neurocomputing, vol. 116, pp. 260–264, 2013. [Google Scholar]
9. Y. Song, D. Zhang, Q. Tang, S. Tang and K. Yang, “Local and nonlocal constraints for compressed sensing video and multi-view image recovery,” Neurocomputing, vol. 406, pp. 34–48, 2020. [Google Scholar]
10. S. Arjunan and P. Sujatha, “Corrigendum to ‘A survey on unequal clustering protocols in wireless sensor networks,” Journal of King Saud University-Computer and Information Sciences, vol. 33, no. 1, pp. 118, 2021. [Google Scholar]
11. G. Kadiravan, P. Sujatha, T. Asvany, R. Punithavathi, M. Elhoseny et al., “Metaheuristic clustering protocol for healthcare data collection in mobile wireless multimedia sensor networks,” Computers, Materials & Continua, vol. 66, no. 3, pp. 3215–3231, 2021. [Google Scholar]
12. A. Yazici, M. Koyuncu, S. A. Sert and T. Yilmaz, “A fusion-based framework for wireless multimedia sensor networks in surveillance applications,” IEEE Access, vol. 7, pp. 88418–88434, 2019. [Google Scholar]
13. P. Sathyaprakash and P. Prakasam, “Boltzmann randomized clustering algorithm for providing quality of evolution in wireless multimedia sensor networks,” Wireless Personal Communications, vol. 112, no. 4, pp. 2335–2349, 2020. [Google Scholar]
14. M. P. Wankhade and K. C. Jondhale, “Hybrid model-based image transmission for maximizing network lifetime in wireless multimedia sensor networks,” International Journal of Wavelets, Multiresolution and Information Processing, vol. 19, no. 2, pp. 2050070, 2021. [Google Scholar]
15. S. Ambareesh and A. N. Madheswari, “HRDSS-WMSN: A multi-objective function for optimal routing protocol in wireless multimedia sensor networks using hybrid red deer salp swarm algorithm,” Wireless Personal Communications, vol. 119, no. 1, pp. 117–146, 2021. [Google Scholar]
16. J. Bansal, H. Sharma, S. Jadon and M. Clerc, “Spider monkey optimization algorithm for numerical optimization,” Memetic Computing, vol. 6, no. 1, pp. 31–47, 2014. [Google Scholar]
17. P. Singh and Y. P. Huang, “A new hybrid time series forecasting model based on the neutrosophic set and quantum optimization algorithm,” Computers in Industry, vol. 111, pp. 121–139, 2019. [Google Scholar]
18. N. Krishnaraj, T. Jayasankar, N. V. Kousik and A. Daniel, “2 Artificial fish swarm optimization algorithm with hill climbing based clustering technique for throughput maximization in wireless multimedia sensor network,” in Applications of Machine Learning in Big-Data Analytics and Cloud Computing, River Publishers, Denmark, pp. 23–42, 2021. [Google Scholar]
 | This work is licensed under a Creative Commons Attribution 4.0 International License, which permits unrestricted use, distribution, and reproduction in any medium, provided the original work is properly cited. |