| Computer Modeling in Engineering & Sciences |
DOI: 10.32604/cmes.2021.012349
ARTICLE
Kriging Surrogate-Based Genetic Algorithm Optimization for Blade Design of a Horizontal Axis Wind Turbine
1Sustainable Infrastructure Research and Department of Mechanical Engineering, Khon Kaen University, Khon Kaen, 40002, Thailand
2Department of Mechatronics Engineering, Rajamangala University of Technology Isan Khon Kaen Campus, Khon Kaen, 40000, Thailand
*Corresponding Author: Weerapon Nuantong. Email: weerapon.nu@rmuti.ac.th
Received: 03 July 2020; Accepted: 19 October 2020
Abstract: Horizontal axis wind turbines are some of the most widely used clean energy generators in the world. Horizontal axis wind turbine blades need to be designed for optimization in order to maximize efficiency and simultaneously minimize the cost of energy. This work presents the optimization of new MEXICO blades for a horizontal axis wind turbine at the wind speed of 10 m/s. The optimization problem is posed to maximize the power coefficient while the design variables are twist angles on the blade radius and rotating axis positions on a chord length of the airfoils. Computational fluid dynamics was used for the aerodynamic simulation. Surrogate-assisted optimization was applied to reduce computational time. A surrogate model called a Kriging model, using a Gaussian correlation function along with various regression models, was applied while a genetic algorithm was used as an optimizer. The results obtained in this study are discussed and compared with those obtained from the original model. It was found that the Kriging model with linear regression gives better results than the Kriging model with second-order polynomial regression. The optimum blade obtained in this study showed better performance than the original blade at a low wind speed of 10 m/s.
Keywords: Wind turbine; optimization; kriging; genetic algorithms; Gaussian
Nomenclature
| C | Chord length |
| Cm | Torque coefficient |
| Cp | Power coefficient |
 | Axial force |
| R | Rotor radius |
 | Wind velocity |
| f | Objective function (Obj. func.) |
| r | Radius position on blade |
| x | Rotating axis point on a chord length |
 | Torque |
 | Rotation speed |
 | Twist angle |
 | Tip speed ratio |
Wind power is a clean and renewable energy resource which affects the environment less than fossil fuels, biomass, gas, etc. Wind power is obtained from the air flow by driving wind turbine blades connected to an electric generator. In wind turbine operation, complex loads on the blade sections vary the magnitude and direction of the aerodynamic forces. The structural blade design is cumbersome and intricate, which affects cost and experimental time. In recent years, for the wind turbine blade or other propeller sections, the design process, cost and time were reduced due to technological advancement. A computational fluid dynamics (CFD) code was rapidly developed to study the blade extensively. In addition, an optimization method with surrogate models was applied to improve the increase for design efficiency of runner blades. Surrogate models, the Kriging (KG), polynomial response surface (PR) and artificial neural network (ANN) are popularly used to evaluate the objective function of given design variables such as blade performance, etc.
Thus, this work applies CFD simulation by coupling an optimization method with a KG model. A genetic algorithm (GA) was employed to search the optimal design of a wind turbine blade. New design parameters that have never been studied in previous work are the main focus of this work. A MEXICO blade is modified to have twist angles along the propeller radius and rotating axis positions on a chord length of the airfoils to maximize the power coefficient.
CFD is a popular computational technique applied for studying the fluid flow on blade structures of a wind turbine due to the results obtained from the CFD being comparable with real experiment in the wind tunnel. The blade performance of wind turbines has been investigated by means of CFD simulations to find torque, power, aerodynamic load, thrust coefficient, power coefficient, and efficiencies. Castelli et al. presented a 2-D CFD analysis of a three-bladed Darrieus rotor that used the DU91-W2-250 airfoil. CFD simulations with Realizable k- model using a finite volume method was applied to calculate rotor torque and power curves of the blade [1]. Aerodynamic load on a two-bladed rotor using 2-D CFD simulation has been investigated. Turbulence models, the standard k-
 , the RNG k-
 , the Realizable k-
 and the Shear Stress Transport (SST) k-
 were used to solve while the results obtained from the experiment and CFD are compared. It is shown that good agreement of both [2] computational and experimental results is obtained. Kutty et al. [3] studied a small-scale propeller to find the thrust coefficient, power coefficient, and efficiencies using 3-D CFD with a standard k-
 turbulence model. A three-bladed pivoted vertical axis Savonius wind turbine has been simulate using the SST k-
 turbulence model to study the effects of adding end plates and the rotor aspect ratio on the turbine torque and power coefficients. The result led to a rotor with an aspect ratio of 2.0 while adding end plates results in a 31% increase in the maximum power coefficient of the turbine [4]. In studying the impact of thickness to chord ratio on the aerodynamic performance of a three bladed asymmetrical blade vertical axis wind turbine, 2-D unsteady CFD simulation was used. The results show that the aerodynamic performance dropped at a high thickness to chord ratio [5]. The UO-17-LDA airfoil was simulated at different angles of attack to increase the performance of a vertical-axis wind turbine using CFD analysis [6]. The work of Tabatabaei et al. studied CFD simulation using standard k-
 , Shear Stress Transport (SST) model and a sophisticated model Scale-Adaptive Simulation (SAS)-SST to investigate the capability of turbulence models at design and off-design conditions. The wind turbine was simulated to analyze the loads coefficients and the wake behind the rotor. The result was illustrated which gave both design and off-design speeds [7]. Investigation of the optimal wind utilization efficiencies of eight-blade for Savonius vertical axis wind turbine show that it is a function of blade width, blade installation, and rotor speed under various inlet wind speeds. CFD simulation with k-
 SST turbulence model was employed in the processing. Simulation results presented the optimal wind energy utilization efficiency and rotor speed, which increase almost linearly with the inlet wind speed. Moreover, the eight-blade Savonius rotor was modified with the diameter of 4 m in the range of wind speed from 6 to 10 m/s [8]. In addition, CFD simulation was applied to study the effects of wind direction, solidity, airfoil, and building configurations to assessment of an aerodynamic performance of building augmented straight-bladed vertical axis wind turbine [9].
Optimum design of the wind turbine blade based on CFD analysis and surrogate models has also been carried out. For example, Zahle et al. [10] proposed an optimization design of a wind turbine using CFD analysis and a response surface model. The optimization problem is posed to minimize the annual energy production ratio whereas the design variables include tip region with respect to chord, twist, and blade length extension. Acar [11] also presents optimization of Risoe wind turbine blades using CFD analysis and a second-order response surface model. The optimization problem in this work attempts to minimize the mass of the wind turbine blade while the design variables are the chord and twist distributions. Other wind turbine design based on CFD and surrogate models are demonstrated in [12,13], while some of the other surrogate models used for wind turbine blade optimization in the literature include the KG model [12] and artificial neural networks (ANN) [13].
In the literature, optimization of wind turbine blades using CFD and surrogate models has been reported by researchers worldwide. Several surrogate models have been applied to several optimization design problems related to wind turbines, such as those found in [10–13]. However, for a particular wind turbine that has never been studied by means of optimization, it is interesting to apply such an engineering tool to redesign it. Therefore, in this work, optimization of a MEXICO horizontal axis wind turbine (HAWT) blade for low speed wind is carried out based on using CFD and a surrogate model. The optimization problem is posed to maximize the power coefficient while the design variables are the twist angles on the propeller radius and rotating axis positions on a chord length of airfoil. CFD is used for aerodynamic calculation. Surrogate-assisted optimization is applied to reduce computational time. The surrogate model called the Kriging model along with its various Gaussian correlation models, is applied while a genetic algorithm is used as an optimizer. The performance of various Gaussian correlations of the Kriging model is investigated and optimum results are obtained in this study.
3 Formulation of the Optimization Problem
An optimum design problem related to a HAWT blade is posed. Twist angles on the propeller radius and the rotating axis point on a chord length of airfoil sections were determined in order to maximize the power coefficient of the turbine blade. The optimization problem can be expressed as follows:

Subjected to
where  is a set of design variables while f is the objective function of the power coefficient Cp. The variables
  and
and  are the twist angles on the r/R ratios at 0.12, 0.4, and 0.56, respectively. x is the rotating axis position of all airfoil sections. The power coefficient is solved from the following equation:

where  is the torque coefficient which can be obtained from aerodynamic analysis using CFD.
  is the tip speed ratio (TSR), as shown in the relationship

where  is the rotation speed of the wind turbine, R is the rotor radius, and
  is the wind velocity.
3.2 Computational Fluid Dynamics Analysis of HAWT Blade
The HAWT of the MEXICO project consisted of three blades with 4.5 m diameter, a pitch angle of  , and a rotation speed of 424.5 rpm. The MEXICO blade included three airfoil sections, i.e., DU91-W2-250, RISØ-A1-21, and NACA 64-418. The blade profile is presented on the experiment database of the HAWT [14–17]. Thus, this work studies the optimal twist angles and rotating axis positions of the MEXICO HAWT blades by increasing the power coefficient. The twist blade angles are a new design with the DU91-W2-250 airfoil at r1 and r2 positions. At the r3 position, the RISØ-A1-21 airfoil is used. The positions, namely r1, r2 and r3, are defined on the r/R ratios at 0.12, 0.4, and 0.56 respectively. For the NACA 64-418 airfoil, the twist blade angle is still in its original form. The rotating axis position is designed for all airfoil sections. The design variables are presented as shown in Fig. 1.
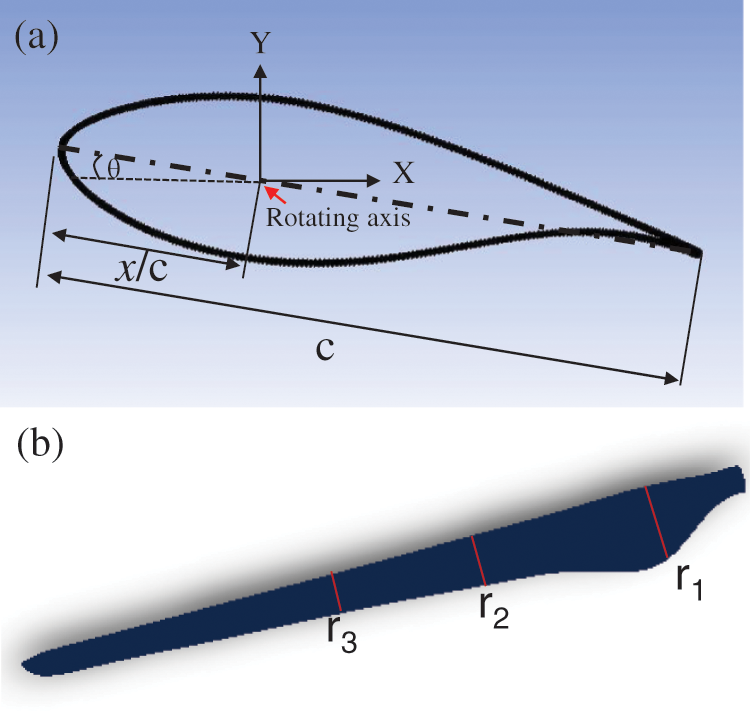
Figure 1: Design variable positions
The selected turbulence model is the k- (RNG) model to predict the air flow on and around the HAWT rotor. According to Bouhelal et al. [18], this was revealed to be the best model for simulation of the HAWT at low wind speeds and high wind speeds. Based on this assumption, in order to solve the air flow on and around the HAWT rotor in this work, simulation using steady-state incompressible flow was used, considering the conservation rules of mass and momentum rather than the rules of energy conservation. The fluid properties of the air used are a density of 1.225 kg/m3 and a viscosity of
  kg/m-s.
The boundary conditions are defined on the inlet wall as a velocity of 10 m/s and static pressure at the outlet wall. The runner blade is assigned to the moving wall and the others to the stationary wall. Air flow domains are consistent in the two domains. The first domain is defined as stationary while the second domain is defined as the moving reference frame with a domain radius of 3 m at a rotating speed of 424.5 rpm. The interface function is applied both between the first and second domains. Thus, the CFD simulation wind tunnel is sufficiently extended to decrease the effect of fluid flow in the region of the runner blade by calculating the actual force. The wind tunnel is defined as 15 D from upwind to downwind with a width and height of 10 D, as shown in Fig. 2, in which D is the diameter of the runner blade. The solution uses the SIMPLE algorithm to analyze velocity–pressure coupling. Momentum, turbulent kinetic energy, and turbulent dissipation rates are computed using the second-order upwind scheme. The residual values are defined as 10−5.
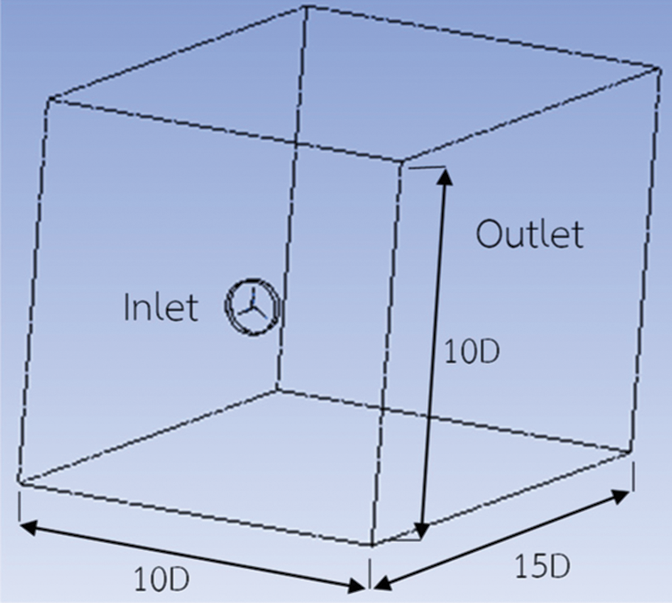
Figure 2: Wind tunnel of CFD simulation
Fig. 3 shows that the mesh used is an unconstructed tetrahedron in a fluid domain around a HAWT blade. This is due to the model unconstructed tetrahedrons being simple for meshing the blade surface that is complex and twisted. The first layer of thickness of meshing on the runner blade surface was a height of 10−5 m for five of the maximum layers. The mesh varies the density in the range of 6.7–12.2 million elements to validate the accuracy of the numerical results with the torque, as shown in Fig. 4. The torque values had an uncertainty of  0.3% with a mesh density in the range of between 9.7 and 12.2 million elements. Thus, in order to reduce the uncertainty of the numerical results and to reduce CFD running time, the mesh quality was selected to be optimal at 9.7 million elements.
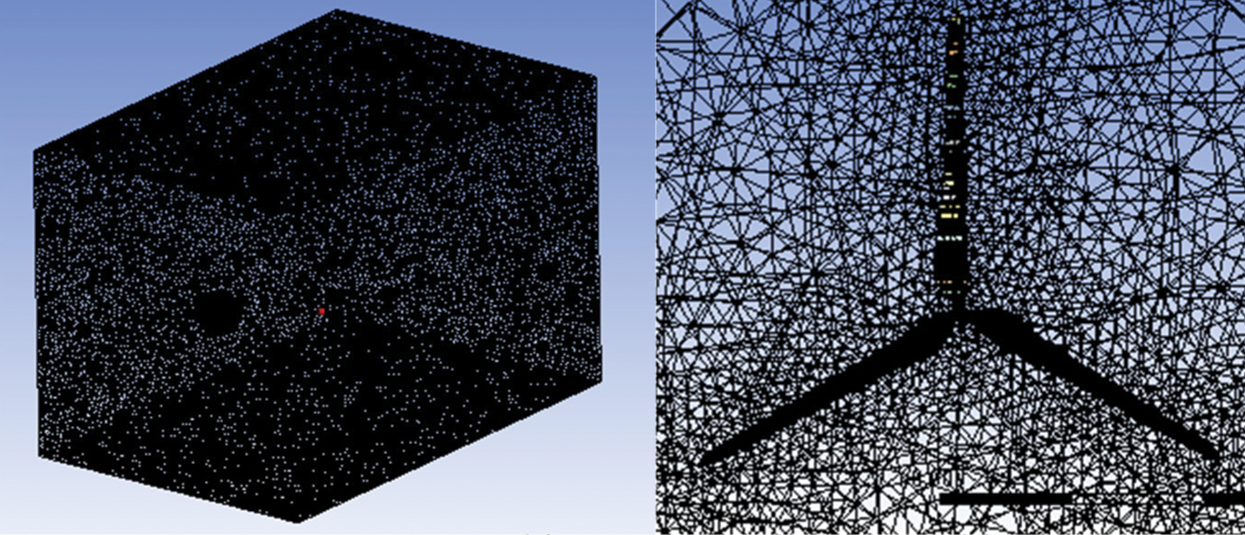
Figure 3: Meshing 3D around a HAWT blade

Figure 4: Mesh validation on torque results
Moreover, the numerical results of the CFD simulation were compared with experimental results of the MEXICO project, as shown in Fig. 5. The MEXICO project experimented on a three-blade rotor wind turbine of 4.5 m diameter which was tested in a  m2 open section of the German Dutch wind tunnels. The experiment results presented a great variety of operating conditions in the pattern of blade pressure distributions, loads, and flow fields. Works on the axial force and torque of wind turbines and relevant databases [14–17] on operating at wind speeds of 10, 15, and 24 m/s were used to investigate the CFD results. The overall results of our CFD simulation were shown to be consistent and in the same direction as the experiment. The CFD results were compared with the experiment and both had an error value revealed by averaging the torques of 0.8% and 0.58% to obtain the axial force. Thus, the CFD simulation using k-
 (RNG) turbulence model was applied to simulate a wind turbine for this work operating at a wind speed of 10 m/s which gives the result with low error compared to the experiment.

Figure 5: CFD validation results
4 Surrogate-Assisted Optimization
In this work, surrogate-assisted optimization was used for optimization of a HAWT blade because aerodynamic analysis based on CFD is time-consuming and the optimization required numerous objective function calculations. Surrogate-assisted optimization can be done such that sampling points are initially generated throughout a design domain by using a design of experiment method. Then, the objective and constraint function values of all sampling points were calculated based on the numerical simulation or actual function evaluations. In this work, the actual function evaluations were calculated based on the CFD. Thereafter, the models for estimating objective and constraint functions were constructed and the optimization was performed based on the constructed surrogate model. Finally, the actual objective function of the optimal result obtained from optimizing a surrogate model was calculated.

In this work, an optimum Latin hypercube sampling (OLHS) developed by [19] was used. The number of sampling points was set to be 16. The Kriging model was used as a surrogate model. Two Kriging models were constructed using a Gaussian correlation function with a linear and second-order polynomial regression models, denoted as, Kriging-linear and Kriging-Second order [20]. In addition, a genetic algorithm (GA) was used as an optimizer. The GA is used to solve the problem based on the two constructed Kriging models for 10 optimization runs while the population size (Np) and number of iterations (G) are set to be 50 and 400, respectively. The overall surrogate assisted optimization procedure used in this study is given in Algorithm 1.
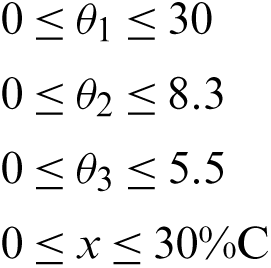
Tab. 1 shows the 16 sampling points generated by OLHS. The design variables include the twist angles and rotating axis positions on a MEXICO HAWT blade, as explained in Section 3.1. The lower and upper bounds of twist angle ( ,
,  ,
,  ) are defined based on studies by Plaza et al. [14], and Boorsma et al. [17] which were set to be about
  30% of
  ,
,  14% of
  , and
, and  10% for
  from the original form while the lower and upper bounds of the rotating axis position were defined in the range of 0–30% of chord length (C).
Table 1: Sampling of four design variables
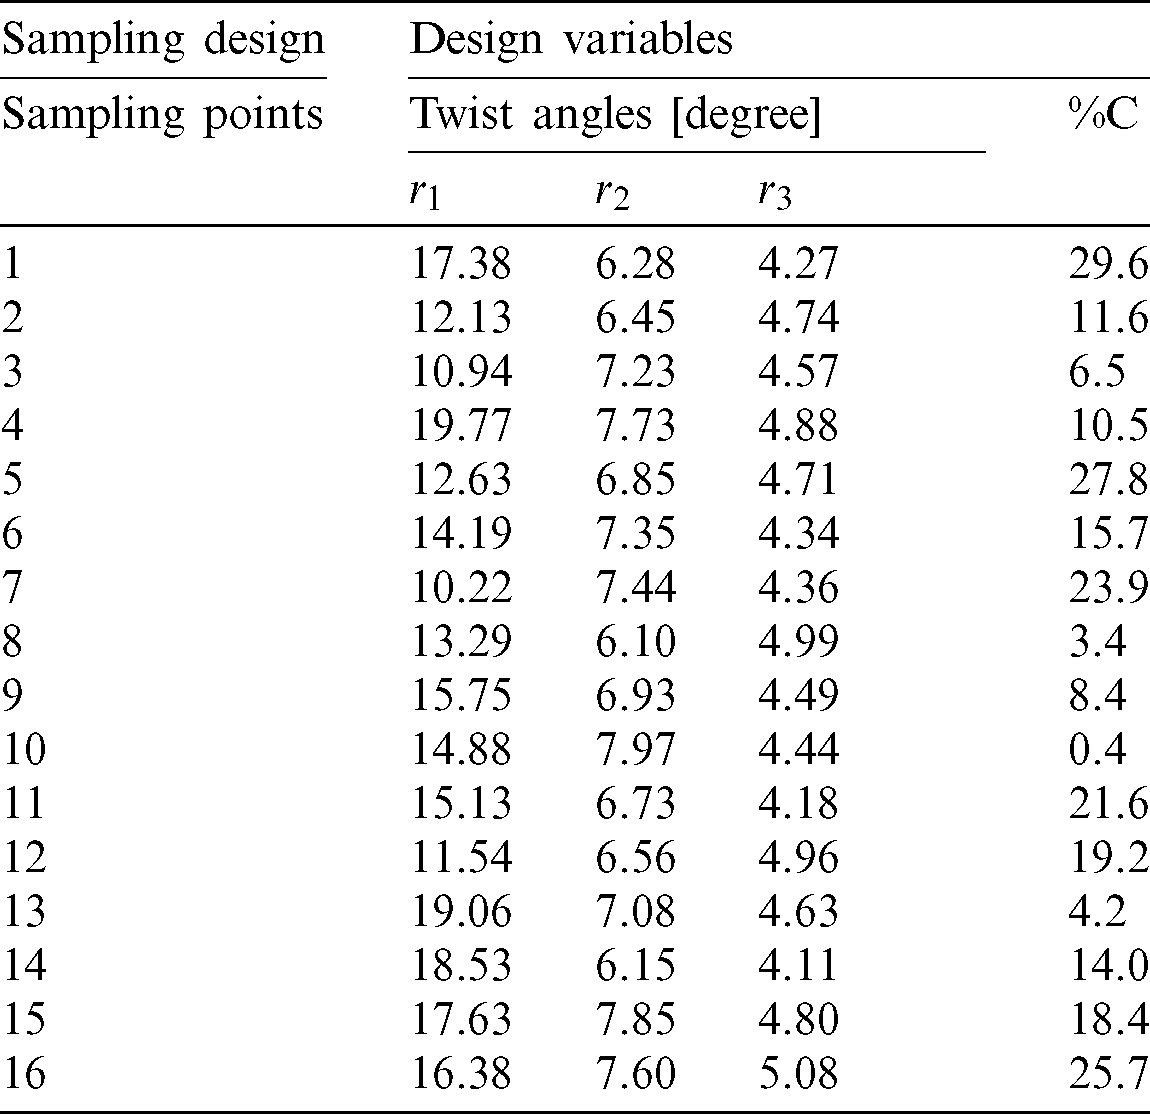
After performing CFD analyses of all the sampling points, as shown in Tab. 1, the torque  and torque coefficient (Cm) obtained are shown in Fig. 6. The figure shows variations of the torques and torque coefficients obtained from the sampling points which mean that the sampling points are well distributed. After that, the power and power coefficients were calculated as shown in Fig. 7. After constructing two Kriging models (with a linear and second-order polynomial regression models) based on the power coefficients obtained from all the sampling solutions, optimization is performed using GA for 10 optimization runs while the results are shown in Tabs. 2 and 3. Tabs. 2 and 3 show optimum results obtained from GA based on using Kriging-linear model and Kriging-second order model respectively. From the tables, the optimum results from both Kriging-linear and Kriging-second order models are consistent meaning that GA can reach the same or close to the same optimum solution for all runs. The approximated power coefficients at the optimum points obtained from using the Kriging model with a linear and second-order polynomial regression models are 0.00590 and 0.0123, respectively.

Figure 6: (a) Torque. (b) Torque coefficient

Figure 7: (a) Power. (b) Power coefficient
Table 2: Optimum results obtained from 10 optimization run from using  linear
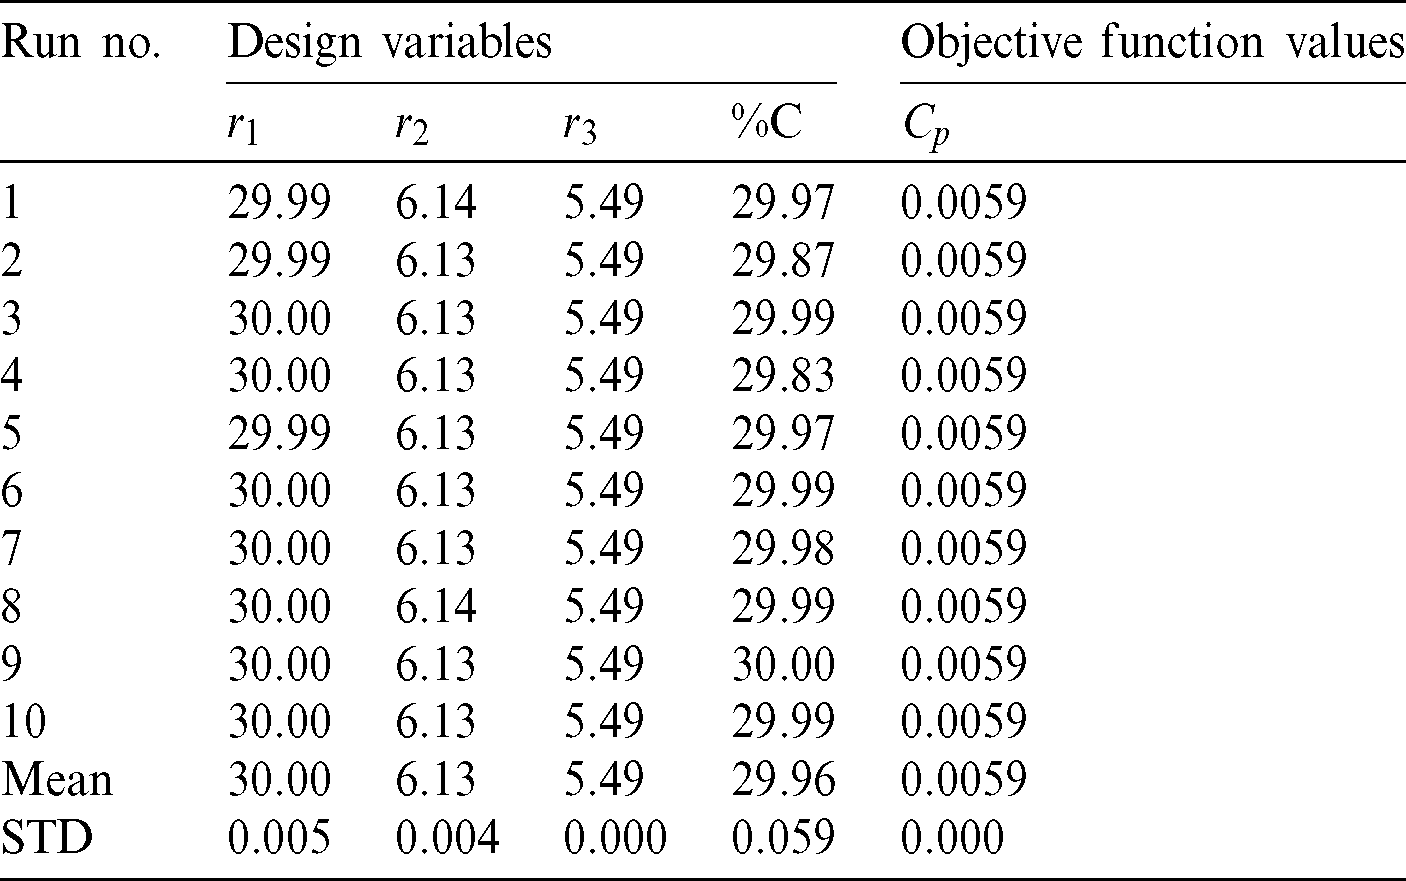
Table 3: Optimum results obtained from 10 optimization run from using  second order
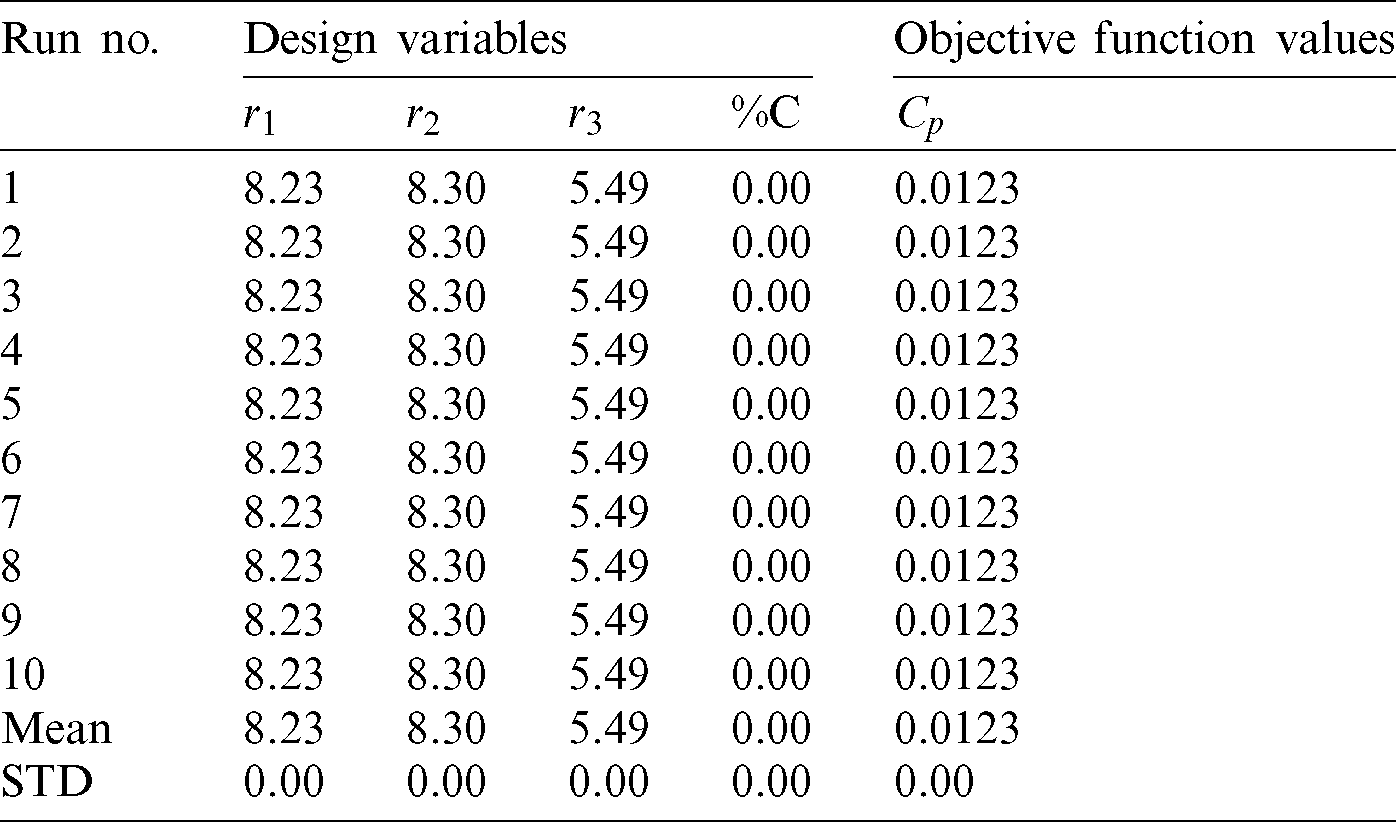
Since there is no variation between the optimum results obtained from 10 runs, an optimum set of design variables from both the Kriging-linear model and the Kriging-second order model are used for real objective function evaluations (CFD simulations) and compared with the original design as reported in the Tab. 4. After performing real objective function calculation based on CFD, the real values of the power coefficient at the optimum points obtained using the Kriging models with a linear regression and second-order polynomial regression are found to be 0.00594 and 0.00559 while the errors between the approximate values and real values are 0.67 and 54.55, respectively. This implied that the Kriging model using the linear regression gives a better estimation error than the Kriging model which uses the second-order polynomial regression.
Table 4: Comparison of optimum results and original design based on CFD
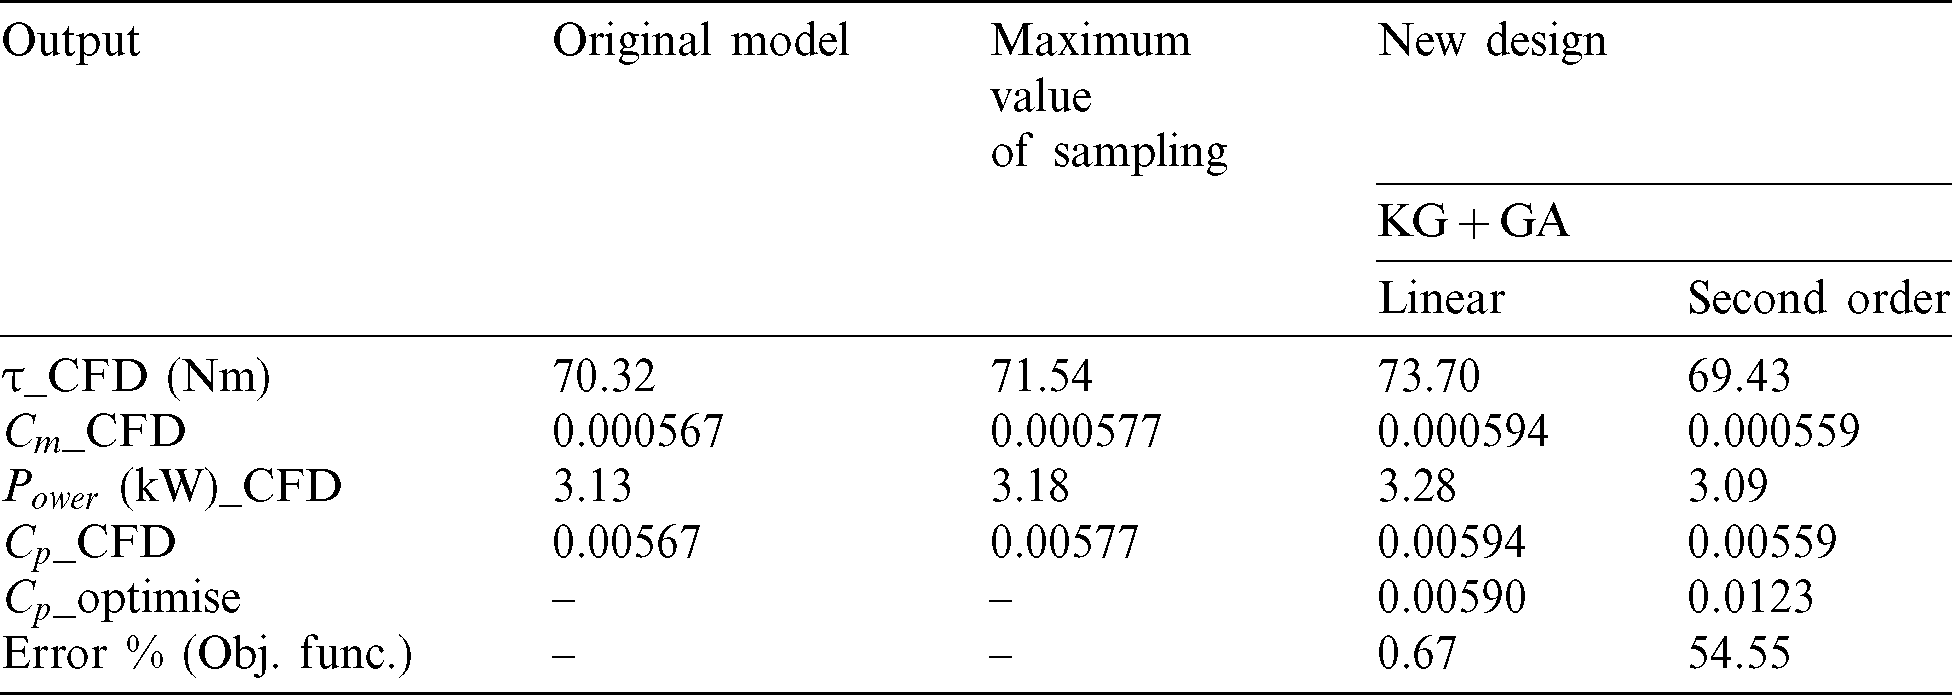
In addition, when comparing the results with the original model and the best model obtained from the sampling points, it was found that the optimum result obtained from the Kriging model with linear regression is the best. The optimum result obtained from the Kriging model with linear regression gave the best result for everything, including torque, torque coefficient, power, and power coefficient.
Overall, it can be concluded that using surrogate-assisted optimization based on OLHS, the Kriging model, and GA for optimization of a MEXICO blade is successful. The Kriging model with linear regression gave the best results based on this study.
Fig. 8b shows the geometry of the optimum MEXICO blade obtained from this study. The new blade shape was improved to increase the power coefficient of a wind turbine to 0.00594 with the torque of 73.70 Nm. Fig. 8a shows the original blade before improving with the power coefficient of 0.00567 and the torque of 70.32 Nm. For both models by comparing between the new and original blades, the power coefficient of the new blade was increased about 4.76%. In addition, the aerodynamic pressure load on the blade was presented, which affects to the change of torque of the blade structure. It is shown that the pressure profiles for both sides of the new and original blades look similar. This somewhat implies that the structural safety requirements are still met for the new optimum blade. The pressure and suction sides of the new blade presented a pressure characteristic which changed from the original blade. Specifically, the suction side of new blade at the leading edge and trailing edge position showed a pressure distribution and decreased fluctuation which were clearly better than the original blade.
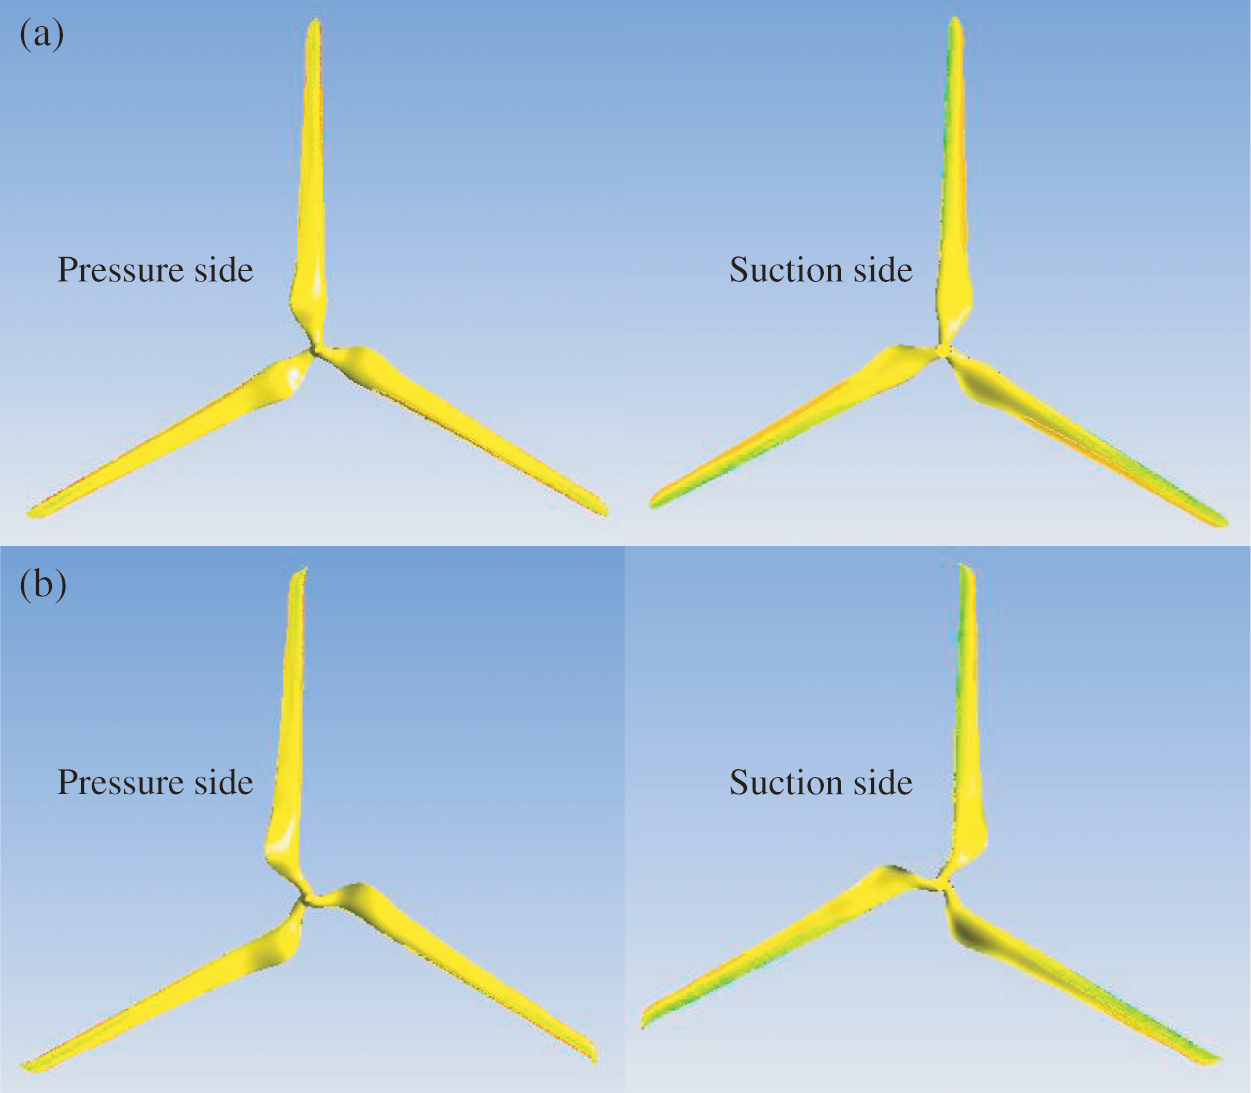
Figure 8: (a) Original blade. (b) Optimization blade
In this work, an optimization study of a MEXICO blade to increase the HAWT power for electrical generation at a low wind speed of 10 m/s was successfully conducted based on using surrogate-assisted optimization. OLHS and GA were used to design and optimize the experiment, while a Kriging model with linear regression and second-order polynomial regression were used. After performing optimization based on the two Kriging models, it was found that the optimum results obtained from the Kriging model with the linear regression were the best. The optimum blade obtained in this study showed a better performance than the original design.
Funding Statement: This work was funded by the Thailand Research Fund (RTA6180010).
Conflicts of Interest: The authors declare that they have no conflicts of interest to report regarding the present study.
1. Castelli, M. R., Grandi, G., Benini, E. (2012). Numerical analysis of the performance of the DU91-W2-250 airfoil for straight-bladed vertical-axis wind turbine application. International Journal of Aerospace and Mechanical Engineering, 6(3), 706–711. [Google Scholar]
2. Rogowski, K., Hansen, M. O. L., Lichota, P. (2018). 2-D CFD computations of the two-bladed darrieus-type wind turbine. Journal of Applied Fluid Mechanics, 11(4), 835–845. [Google Scholar]
3. Kutty, H., Rajendran, P. (2017). 3D CFD simulation and experimental validation of small APC slow flyer propeller blade. Aerospace, 4(10), 10. DOI 10.3390/aerospace4010010. [Google Scholar] [CrossRef]
4. Amiri, M., Kahrom, M., Teymourtash, A. R. (2019). Aerodynamic analysis of a three-bladed pivoted savonius wind turbine: wind tunnel testing and numerical simulation. Journal of Applied Fluid Mechanics, 12(3), 819–829. DOI 10.29252/jafm.12.03.29324. [Google Scholar] [CrossRef]
5. Mazarbhuiya, H. M. S. M., Biswas, A., Sharma, K. K. (2020). Blade thickness effect on the aerodynamic performance of an asymmetric NACA six series blade vertical axis wind turbine in low wind speed. International Journal of Green Energy, 17(2), 171–179. DOI 10.1080/15435075.2020.1712214. [Google Scholar] [CrossRef]
6. Meana-Fernández, A., Díaz-Artos, L., Oro, J. M. F., Velarde-Suárez, S. (2020). An optimized airfoil geometry for vertical-axis wind turbine applications. International Journal of Green Energy, 17(3), 181–195. DOI 10.1080/15435075.2020.1712211. [Google Scholar] [CrossRef]
7. Tabatabaei, N., Cervantes, M. J., Trivedi, C. (2018). Investigation of the numerical methodology of a model wind turbine simulation. Journal of Applied Fluid Mechanics, 11(3), 527–544. DOI 10.29252/jafm.11.03.28028. [Google Scholar] [CrossRef]
8. Zhao, T., Zhang, X., Zheng, M., Teng, H., Wei, L. (2019). Variation of energy utilization efficiency with respect to inlet wind speed for eight-blade modified Savonius rotor by CFD approach. International Journal of Green Energy, 16(14), 1287–1294. DOI 10.1080/15435075.2019.1671404. [Google Scholar] [CrossRef]
9. Zhu, H., Hao, W., Li, C., Ding, Q. (2019). Numerical investigation on the effects of different wind directions, solidity, airfoils, and building configurations on the aerodynamic performance of building augmented vertical axis wind turbines. International Journal of Green Energy, 16(15), 1624–1636. DOI 10.1080/15435075.2019.1681427. [Google Scholar] [CrossRef]
10. Zahle, F., Sørensen, N. N., McWilliam, M. K., Barlas, A. (2018). Computational fluid dynamics-based surrogate optimization of a wind turbine blade tip extension for maximising energy production. Journal of Physics: Conference Series, 1037, 042013. DOI 10.1088/1742-6596/1037/4/042013. [Google Scholar] [CrossRef]
11. Acar, E. (2017). Response surface based optimization of aerodynamic performance of a horizontal axis wind turbine. International Journal of Computational and Experimental Science and Engineering, 3(1), 7–10. DOI 10.22399/ijcesen.323859. [Google Scholar] [CrossRef]
12. Yamazaki, W. (2017). Experiment/simulation integrated shape optimization using variable fidelity Kriging model approach. Journal of Advanced Mechanical Design, Systems, and Manufacturing, 11(5), 1–9. DOI 10.1299/jamdsm.2017jamdsm0053. [Google Scholar] [CrossRef]
13. Díaz-Casás, V., Becerra, J. A., Lopez-Peña, F., Duro, R. J. (2013). Wind turbine design through evolutionary algorithms based on surrogate CFD methods. Optimization and Engineering, 14(2), 305–329. DOI 10.1007/s11081-012-9187-1. [Google Scholar] [CrossRef]
14. Plaza, B., Bardera, R., Visiedo, S. (2015). Comparison of BEM and CFD results for MEXICO rotor aerodynamics. Journal of Wind Engineering and Industrial Aerodynamics, 145, 115–122. DOI 10.1016/j.jweia.2015.05.005. [Google Scholar] [CrossRef]
15. Schepers, J. G., Boorsma, K., Cho, T., Gomez-Iradi, S., Schaffarczyk, P. et al. (2012). Analysis of Mexico wind tunnel measurements. Proceedings of Energy Research Centre of the Netherlands, Netherlands, Paper No. ECN-E12-004.
16. Schepers, J. G., Snel, H. (2007). Model experiments in controlled conditions. Proceedings of Energy Research Centre of the Netherlands, Netherlands.
17. Boorsma, K., Schepers, J. G. (2009). Description of experimental setup MEXICO measurements. Proceedings of Energy Research Centre of the Netherlands, Netherlands. [Google Scholar]
18. Bouhelal, A., Smaili, A., Guerri, O., Masson, C. (2018). Numerical investigation of turbulent flow around a recent horizontal axis wind turbine using low and high Reynolds models. Journal of Applied Fluid Mechanics, 11(1), 151–164. DOI 10.29252/jafm.11.01.28074. [Google Scholar] [CrossRef]
19. Pholdee, N., Bureerat, S. (2013). An efficient optimum Latin hypercube sampling technique based on sequencing optimization using simulated annealing. International Journal of Systems Science, 46(10), 1780–1789. DOI 10.1080/00207721.2013.835003. [Google Scholar] [CrossRef]
20. Madhan, K., Nam, G. W., Oh, S. J., Seo, J., Samad, A. et al. (2017). Design optimization of a horizontal axis tidal stream turbine blade using CFD. Proceedings of the 5th International Symposium on Marine Propulsors, Finland. [Google Scholar]
 | This work is licensed under a Creative Commons Attribution 4.0 International License, which permits unrestricted use, distribution, and reproduction in any medium, provided the original work is properly cited. |