| Computer Modeling in Engineering & Sciences |
DOI: 10.32604/cmes.2021.012734
ARTICLE
Topological Design of Microstructures of Materials Containing Multiple Phases of Distinct Poisson’s Ratios
1State Key Laboratory for Alternate Electrical Power System with Renewable Energy Sources, North China Electric Power University, Beijing, 102206, China
2Centre for Innovative Structures and Materials, School of Engineering, RMIT University, Melbourne, 3001, Australia
*Corresponding Author: Kai Long. Email: longkai1978@163.com
Received: 12 July 2020; Accepted: 21 September 2020
Abstract: A methodology for achieving the maximum bulk or shear modulus in an elastic composite composed of two isotropic phases with distinct Poisson’s ratios is proposed. A topology optimization algorithm is developed which is capable of finding microstructures with extreme properties very close to theoretical upper bounds. The effective mechanical properties of the designed composite are determined by a numerical homogenization technique. The sensitivities with respect to design variables are derived by simultaneously interpolating Young’s modulus and Poisson’s ratio using different parameters. The so-called solid isotropic material with penalization method is developed to establish the optimization formulation. Maximum bulk or shear modulus is considered as the objective function, and the volume fraction of constituent phases is taken as constraints. The method of moving asymptotes is applied to update the design variables. Several 3D numerical examples are presented to demonstrate the effectiveness of the proposed structural optimization method. The effects of key parameters such as Poisson’s ratios and volume fractions of constituent phase on the final designs are investigated. A series of novel microstructures are obtained from the proposed approach. It is found that the optimized bulk and shear moduli of all the studied composites are very close to the Hashin-Shtrikman-Walpole bounds.
Keywords: Poisson’s ratio; topology optimization; homogenization; bulk modulus; shear modulus
Methods to achieve optimal engineering designs have been intensively investigated for decades. Various topology optimization approaches have been proposed and developed in the field of structural designs [1–5], such as homogenization method [5], solid isotropic material with penalization (SIMP) [6–8], evolutionary structural optimization (ESO) [9,10] and bi-directional evolutionary structural optimization (BESO) [11,12], and level set method [13,14]. The application of topology optimization has also been extended to the design of cellular and composite materials. Sigmund [15] initially incorporated an inverse homogenization concept to the topology optimization of materials with exceptional mechanical properties. Inspired by this approach, many attempts have been made to develop materials with different functionalities, including elastic [16], thermos elastic [17,18], piezoelectric [19,20] and auxetic materials [15,21,22].
The bulk modulus and shear modulus are generally devoted to describe the stiffness of an isotropic elastic material. And earlier work in topology optimization of materials normally involves maximizing the bulk modulus or shear modulus of a 2D or 3D material. Except for the existing composites such as composite sphere, finite rank laminates and Vigdergauz microstructures, Sigmund [23] developed a series of two-phase microstructures and their bulk moduli coincided with the well-established Hashin–Shtrikman (HS) bounds. Gibiansky et al. [24] extended this work to three-phase material design, generating a range of novel microstructures which exhibited achievability of the Hashin–Shtrikman–Walpole (HSW) upper bounds. Guest et al. [25] presented an optimal design for maximum elastic stiffness and fluid permeability. Challis et al. [26] employed the level-set method to maximize stiffness and conductivity of two-phase materials. Microstructures contained the so-called Schwartz interface and diamond minimal surface have been observed, which had maximum bulk modulus and conductivity. Andreassen et al. [27] proposed a method for designing manufacturable materials with negative Poisson’s ratio and revisited the problem of maximizing the bulk modulus. Huang et al. [28] utilized BESO approach to design 2D and 3D microstructures with extremal bulk and shear moduli, which demonstrated certain advantages over SIMP approach in 0–1 representation and convergence speed. The BESO methods have been extended to similar issues to obtain isotropic composite microstructures [29], multi-phase materials with maximum stiffness and conductivity [30], functionally graded materials [31], and phonoic band gap crystals [32]. Unlike regular elastic materials, viscoelastic materials exhibit both viscous and elastic characteristics when deforming, which are widely adopted in reducing vibrations. Andreasen et al. [33] further studied the homogenization concept of viscoelastic composites. Several new microstructures were found to have viscoelastic bulk modulus close to the theoretical upper bound. In recent years, much works have focused on the topological design of metamaterial [34–36].
In comparison to traditional cellular materials composed of a solid phase and a void phase, composites made of two or more materials are more preferable to practical applications due to their synthetic mechanical properties. Conventional topological design of composite microstructure with maximized stiffness always involves constituent phases with different Young’s moduli and the same Poisson’s ratios. However, Liu et al. [37,38] revealed that the effective Young’s modulus of composites could exceed the Voigt estimation if one constituent phase approached the incompressibility limit. Kocer et al. [39] further investigated this phenomenon in materials containing inclusions with negative Poisson’s ratio (NPR). They found significantly enhanced stiffness when alternating different layers of auxetic or non-auxetic materials. Other research also observed evident increase in stiffness beyond any individual constituent phase with positive or negative Poisson’s ratio [40,41]. The stiffening effect could be governed by multiple factors simultaneously, such as the values of Poisson’s ratio of constituent phases, topologies of the NPR inclusions, and so on. More recently, Pasternak et al. [42] evaluated the coefficient of thermal expansion and thermal stresses by adding NPR inclusions into positive Poisson’s ratio (PPR) material. They also found reduction in the thermal stress due to Poisson effect. Zuo et al. [43] proposed an optimization method to maximize the stiffness in both longitudinal and transverse directions of laminate composites based on the explicit effective stiffness function. An in-depth investigation was conducted to find the influence of effective Young’s moduli when Poisson effect was considered. Long et al. [44] established a topology optimization framework for maximizing the effective Young’s modulus of composite containing multiple constituent phases with distinct Poisson’s ratios. However, no reports can be found in literature regarding the design of composites with extremal bulk or shear modulus made of constituent phases with significantly different Poisson’s ratios.
The rest of the paper is organized as follows. The homogenized effective elasticity matrix is calculated within periodic base cell (PBC) in Section 2. Also, the sensitivity of the elastic matrix is derived from the interpolation of both Young’s modulus and Poisson’s ratio. Section 3 establishes the topological optimization formulation the microstructure. Section 4 provides several typical numerical examples to validate the effectiveness of the proposed approach. Finally, the main conclusion of this paper is drawn in Section 5.
2 Elasticity by Homogenization and Sensitivity Analysis
For a two-phase periodic heterogeneous material, the macroscopic elasticity tensor  of a periodic composite material can be obtained by

where  denotes the volume of PBC. The locally varying stiffness tensor, Epqrs, depends on the distribution of material in PBC.
  are the prescribed macroscopic strain fields while
  are defined as
 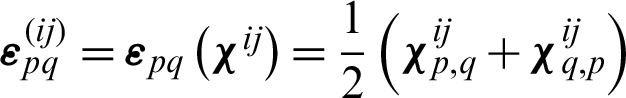 . The V-periodic displacement fields
  can be found by solving the elasticity equations with a prescribed macroscopic strain

Here  is the
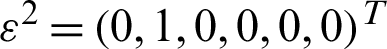
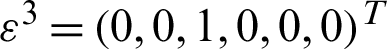
  -periodic admissible displacement field corresponding to six strain fields, which are derived from six linearly independent unit tests. These unit strains are
 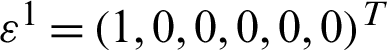 ,
,  ,
,  ,
,  ,
,  ,
,  .
.
Based on Eq. (2), the effective elasticity matrix can be obtained by using the numerical homogenization approach as described in the work [45,46].
2.2 Sensitivity Analysis of Elasticity
The constituent phases are assumed to be isotropic in this study. To derive the sensitivities, a SIMP function for both the Young’s modulus and Possion’s ratio is adopted to interpolate between two phases in each element [6]. The SIMP method is developed in the current study and the mathematical formulation reads

where Ej and  are the Young’s modulus and Poisson’s ratio for phase j (j = 1, 2), respectively, and xe denotes the relative density of the eth element, which can be purely phase 1 when xe = 1 or phase 2 when xe = 0.
  and
and  represent the penalization exponents. Typically, when
  and
and  varies from 1 to 3, reasonable results for all the examples in this paper can be obtained. From Eq. (3), we have

We assume the materials used to build the composite are isotropic, the elastic matrix for the element e can be expressed as
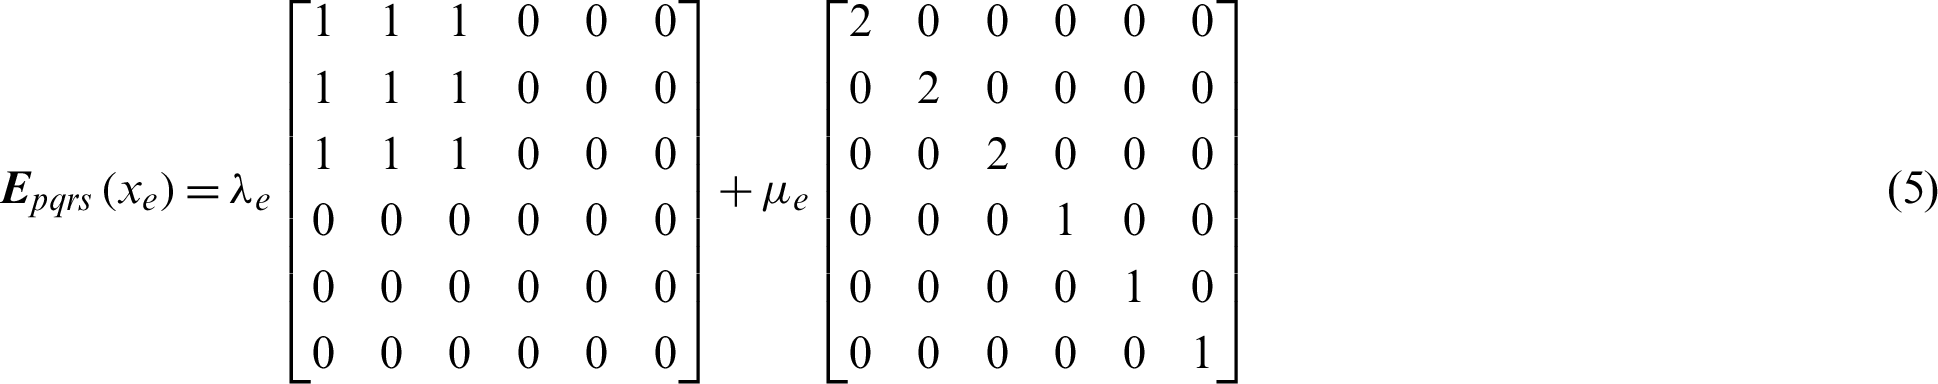
where  and
and  are Lamé’s first and second parameter for the material in element e, respectively. Lamé’s parameters can be computed from Young’s modulus E and
  using the relations:

Here for simplicity, the subscript e is omitted in Eq. (6).
From Eq. (6), we have


Using the chain rule, the sensitivity of the elastic matrix for the element e with respect to xe can be calculated as
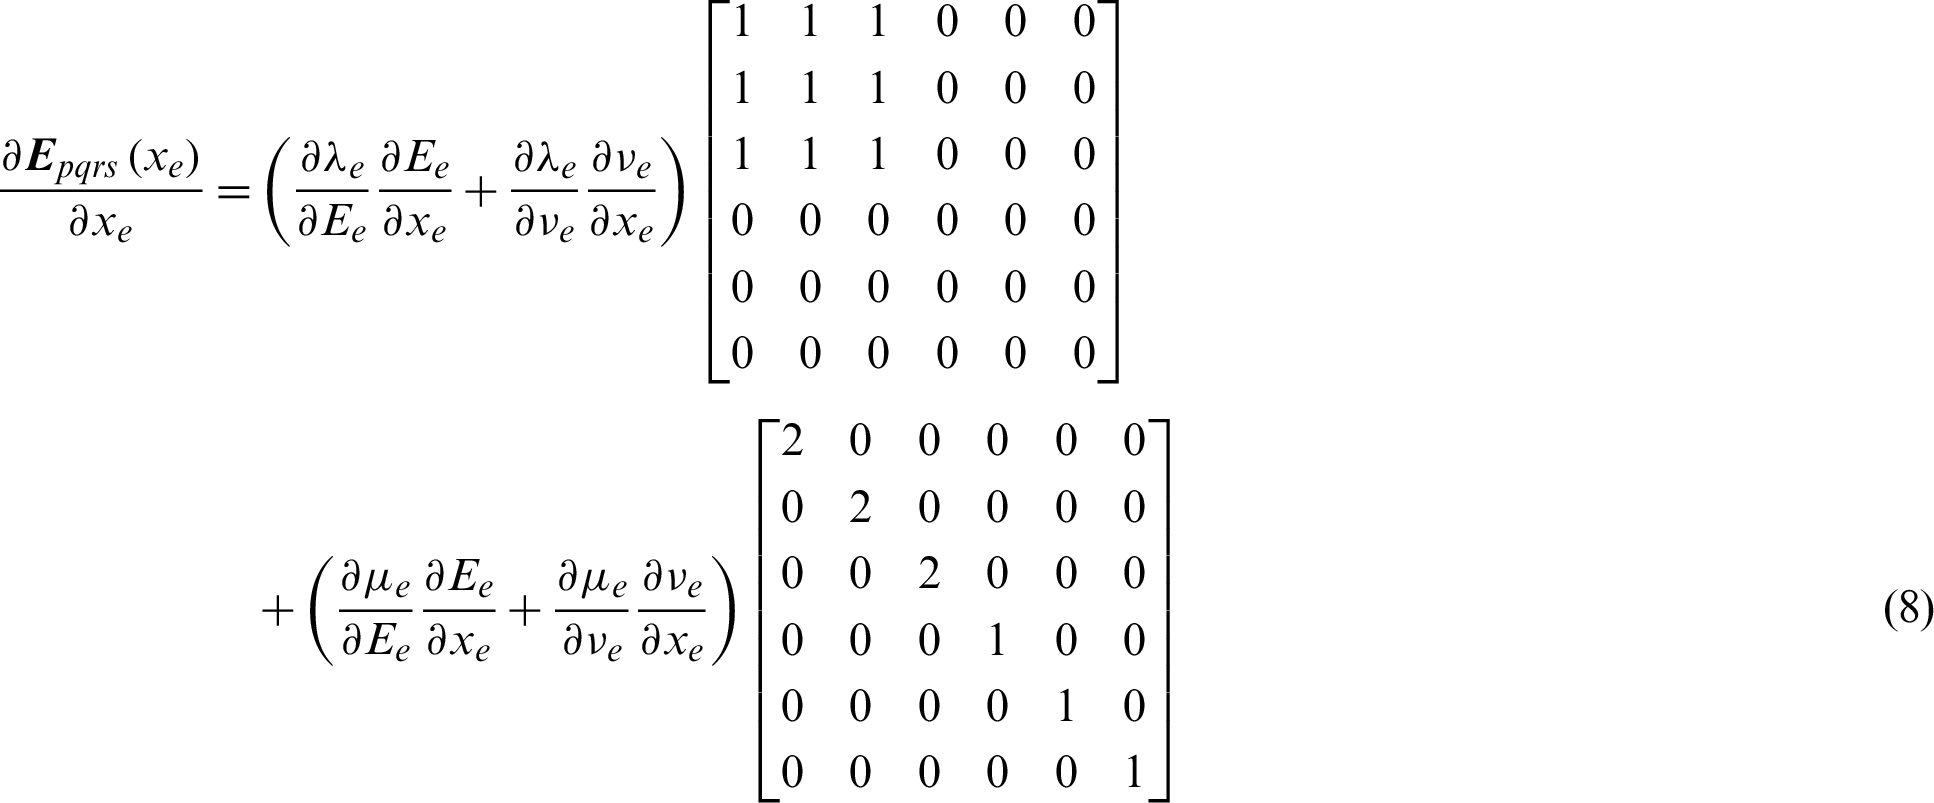
Thus, the macroscopic elasticity tensor with respect to density variable can be derived by using the adjoint method, which is

where  can be obtained from Eq. (8).
3 Inverse Homogenization Formulation and Solution
The bulk modulus  and shear modulus
  can be treated as one of the stiffness measures, which can be optimized by using the method provided in literature [28]. When the microstructure of composite is cubic or isotropic symmetry, the bulk modulus and shear modulus can be expressed in regard to the 3D effective elasticity tensor, i.e.,


To obtain optimal design of composites with homogenized properties, the optimization problem is defined through maximizing bulk modulus or shear modulus subjected to volume fraction constraints of phase 1.

where V1 ( ) and V0 are the volume of phase 1 material and the volume of design domain, f is the target volume fraction.
4 Analytical Bounds for Materials
The bounds of physical properties are of significant importance in composite design. HS bound is one of the most popular estimations, which defines tight theoretical limits of bulk and shear moduli for isotropic materials, in terms of volume fraction of two-phase composites based on variational principles. Such bounds are achievable when the microstructures and volume fraction of individual phase are determined [47]. If the phase exhibits larger (smaller) bulk modulus (K) and larger (smaller) shear modulus (G) simultaneously, the materials can be recognized to be ‘well-ordered’, i.e., (K2 − K1) (G2 − G1) > 0. Walpole [48,49] extended the HS bounds to the cases in which the bulk modulus and shear modulus are not well ordered (i.e., (K2 − K1) (G2 − G1) < 0).
The bulk and shear moduli of each phase are defined as

For two-phase composites with 3D microstructure, the HSW upper limits on effective bulk modulus KU and shear modulus GU can be found by


where  and
and  are the maximal values of bulk and shear moduli for constituent phases, respectively.
  is the given volume fraction of phase 1.
The HSW upper bound is attainable if the following conditions are satisfied.

Here in it is assumed that  . The HSW upper bounds of shear moduli are attainable under the following condition:

5 Illustrative Examples and Discussion
In this section, several numerical examples are presented to demonstrate the effectiveness and capabilities of the proposed optimization method. It is assumed that in all cases the PBC, which represents the microstructure of a composite, is discretized to  brick elements with 8nodes. To eliminate the checkerboard patterns and mesh-dependency phenomena which is popular in topology optimization, filtering technique is applied [3]. Based on the first-order derivatives, the Eq. (12) can be usually solved by a magnitude of optimizers, such as optimality criteria, convex linearization or the method of moving asymptotes and so on [3,49].
In this study, we simply define two different initial designs. In initial design 1, the element density increases proportionally to the distance from the element center to the base cell center, as shown in Fig. 1a. Inversely, in initial design 2, the element density decreases proportionally to the same distance as illustrated in Fig. 1b. The color bar shows the range of density (xe) with the value varying from 0 (blue) to 1 (red).

Figure 1: Density distribution for different initial designs: (a) Initial design 1; (b) initial design 2
For easier identification, the phase 1 in the microstructure is displayed in red, while phase 2 in blue.
The objective of topology optimization of this example is to obtain microstructure with maximum bulk modulus. In this example, the material properties are defined as: Young’s modulus, E1 = 2.5 for phase 1 and E2 = 1.0 for phase 2; Poisson’s ratio,  for phase 1 and
  for phase 2. The bulk moduli are K1 = 0.8333 and K2 = 0.1190 for the two phases, respectively. The prescribed volume fraction of phase 1 is 60%. The obtained optimal microstructures and their effective matrices are given in Fig. 2.

Figure 2: Base cell and effective elasticity matrix of composite material, starting from different initial designs: (a) From initial design 1; (b) From initial design 2
It can be seen that the obtained microstructures are cubic symmetry, thus the two-phase composites are orthotropic. The bulk moduli can be calculated from the obtained microstructures as 0.5148 and 0.5128, starting from initial designs 1 and 2, respectively. These results are slightly below the HSW upper bound KU = 0.5159 according to Eq. (15). As revealed in literature [17], completely different topologies of microstructures could be achieved, depending on initial guesses. Nevertheless, they may have similar values of maximum bulk modulus due to the non-uniqueness of the solution. The interface between the two phases in Fig. 2b can be seen as an approximation to a Schwartz P minimal surface which was reported to be structures with maximum permeability or conductivity [25,26]. Interestingly, the shear moduli for the two optimized composites are 1.1410 and 1.1407, respectively, also slightly below HSW upper bound of shear modulus in this case GU = 1.1432 according to Eq. (15).
The stiffness of resulting composites in one or more directions could be enhanced, as the benefits of using phase with significantly different Poisson’s ratios. For the purpose of comparison, the upper bound of effective Young’s modulus estimated by Voigt theory can be calculated as  . The resulting effective Young’s modulus from elasticity matrix of composite material in three directions is 1.9716 and 1.9679 in Fig. 2, which exceeds the Voigt limit 1.9000. These results clearly demonstrate the additional advantage of composites containing multiple phases of distinct Poisson’s ratios.
To better understand the influence of constituent phase on the topology of optimal composites, optimization process on design domain of merely phase 1 is performed. The two optimal microstructures and the corresponding elasticity matrices of the composite are presented in Fig. 3. The void elements starting from initial design 1 are displayed in blue color. To provide a clear angle of view, one half of PBC is shown in Fig. 3a.

Figure 3: Base cell and effective elasticity matrix of cellar material, starting from different initial designs: (a) Cross-section from initial design 1; (b) From initial design 2
The microstructure obtained from initial design 1 in Fig. 3a is a hollowed cube with rounding interior corners. The microstructure obtained from initial design 2 in Fig. 3b is actually composed by walls in three directions. The unit cell is partitioned into eight individual spaces. These two microstructures are similar to the designs with maximum bulk modulus in literature [23,25]. Comparing Figs. 2 and 3 in the process of finding microstructures with achievable HSW upper bound, significant difference in the distribution of phase 1 between two-phase composites and cellular materials can be witnessed.
To investigate the effect of the Poisson’s ratio on the maximum bulk modulus and the HSW bounds, the change in Poisson’s ratios of phase 2 are manually defined, ranging from −0.95 to 0.45 with two ends, i.e., −0.99 and 0.49, while phase 1 has a fixed Poisson’s ratio. Meanwhile, the prescribed volume fraction of phase 1 is set to be 50%. Other parameters are the same as those in Example I. Tab. 1 lists the resulting bulk modulus, HSW upper bound for bulk modulus and their relative percentage differences with typical topologies plotted in Fig. 4. It should be noted that when  changes from −0.55 to 0.25 as listed in Tab. 1,
  . In all the other cases, the composites are not well-ordered. Also, the effective Young’s moduli of resulting composite are drawn in Fig. 5.
Table 1: The resulting bulk modulus, the HSW upper bound for bulk modulus, and relative difference


Figure 4: Maximizing the bulk modulus for various Poisson’s ratios of phase 2

Figure 5: The effective Young’s moduli for various Poisson’s ratios of phase 2
Fig. 4 shows that the obtained bulk modulus well agrees with the HSW upper bounds predicted by Eq. (16). It demonstrates that the proposed optimization method is capable of finding a microstructure with the largest bulk modulus close to the HSW upper bound in both the well-ordered or non-well-ordered cases. The curve does not monotonically increase with the increase of  . When
  , the resulting bulk modulus and HSW upper bound have their minimum values. When
  approaches 0.45, the resulting bulk modulus experiences a sharp rise and phase 2 becomes totally embedded into the surrounding phase 1 of PBC. The topology of phase 2 changes from Schwartz P structure to spherical shape. When
  approaches 0.49, the topology of phase 2 is totally different.
Fig. 5 shows a parabola curve of the resulting effective Young’s modulus for various Poisson’s ratios of phase 2. Parts of the results exceed the Voigt estimation of 1.75. It can be observed that the enhancement effects of the effective Young’s modulus are dependent on the difference between the Poisson’s ratio of two constituent materials, which agrees well with the phenomena in literature [43,44]. The optimized topologies in Fig. 4 are different with those seeking for maximizing the effective Young’s modulus [44]. It can be inferred that the optimized topologies highly influence the mechanical properties of the resulting composites.
In this example, the effect of various volume fractions of constitute phase on resulting bulk modulus is investigated. The Young’s moduli of two constituent materials are E1 = 2.5 and E2 = 1, respectively, and the Poisson’s ratio are  and
and  , respectively. Different volume fractions of phase 1 are referred to as the constraints, aiming to find maximized bulk modulus. According to Eq. (15), the HSW upper bound KU is calculated based on various volume fractions. Tab. 2 lists the resulting bulk modulus, HSW upper bound and their relative percentage difference. The corresponding PBC topologies are shown in Fig. 6.
Table 2: The resulting bulk modulus, the HSW upper bound for bulk modulus, and the relative difference


Figure 6: Maximizing the bulk modulus for various volume fractions of phase 1
Fig. 6 shows that at the beginning, with a low  , phase 1 occupies the corners of the base unit cell. With the increase of
  , the topology of phase 2 changes from Schwartz P minimal surface to sphere surface. When
  increases to 65%, phase 2 is totally embedded in phase 1 with a spherical shape. In all cases, the resulting bulk modulus is slightly less than the HSW upper bound. The relative percentage differences are within 1.5%, which also proved HSW upper bound of bulk modulus can be attainable by the proposed method.
The objective of this example is to obtain the optimal microstructure with maximum shear modulus via the proposed optimization method. The Young’s moduli of constituent phases are selected as E1 = 5.5 and E2 = 1. The Poisson’s ratios are assumed to be  and
and  . The shear moduli for the two materials are G1 = 2.75 and G2 = 1.00, respectively. The prescribed volume fraction of phase 1 is 60%. According to Eq. (15), the HSW upper bound is calculated as 1.8710. The final optimized microstructures of orthotropic composites obtained from different initial designs and their effective matrices are presented in Fig. 7.

Figure 7: Base cell and effective elasticity matrix of composite material, starting from different initial designs: (a) From initial design 1; (b) From initial design 2
From the effective matrices, the shear moduli of the two designs are 1.8668 and 1.8677, respectively. As discussed previously, the two types of topologies differ significantly due to the distinct initial designs. However, the shear moduli are almost identical and slightly below the respective HSW bounds for shear modulus.
The objective of this example is to find the optimal microstructure with a maximum shear modulus. The Young’s modulus of constituent phase 1 is investigated and set to be ranging from 3.0 to 11.0. Other mechanical properties are the same as those in example IV. The prescribed volume fraction of phase 1 is defined as 50%. Tab. 3 lists the resulting shear modulus, HSW upper bound for shear modulus and their relative percentage differences. The evolution of the corresponding topologies is plotted in Fig. 8.
Table 3: The resulting shear modulus, the HSW upper bound for shear modulus, and the relative difference


Figure 8: Maximizing the shear modulus for various Young’s moduli of phase1
Fig. 8 shows that, with the increase of E2, the maximizing shear modulus and HSW upper bound rises. The microstructure of phase 2 is a Schwartz P structure when E2 = 3.0. The Schwartz P structure and sphere inclusions for each phase coexist in the base cell when the Young’s modulus of phase 2 increases. The configurations of the microstructure are affected by the Young’s modulus of constitute phases. In all cases, the resulting shear moduli well agree with HSW upper bound calculated by Eq. (15). Their relative percentage differences are less than 0.958%.
In this example, various volume fractions of the constituent phase on the final design are investigated. The mechanical properties and objective function are the same with those in example IV. The prescribed volume fraction of phase 1 ranges from15% to 85%. Tab. 4 lists the resulting shear modulus, HSW upper bound for shear modulus and their relative percentage differences. The corresponding microstructural topologies are depicted in Fig. 9.
Table 4: The resulting shear modulus, the HSW upper bound for shear modulus, and the relative difference


Figure 9: Maximizing the shear modulus for various volume fractions of phase 1
From Tab. 4, all the relative percentage differences between the resulting shear modulus and HSW upper bound for shear modulus are within 3.095%. The results indicated that the theoretical upper bound could be attained under different given volume fraction. From Fig. 9, the topology of each phase changes with the increase of  and exhibits different shapes.
In this paper, a topology optimization methodology is presented to design microstructures of materials that are composed of two isotropic phases with distinct Poisson’s ratios. The objective is to maximize the bulk or shear modulus of the composites. The effective elasticity matrix is determined by means of homogenization. Several 3D examples are presented to demonstrate the effectiveness of the proposed method. The examples show that the proposed approach is capable of generating composite microstructures with properties very close to the Hashin–Shtrikan–Walpole upper bounds. In the future research, several important directions furthered the proposed method includes the concurrent design of macrostructure and microstructure containing multiple phases [50]. Moreover, it will be of great interest to obtain the smooth boundary directly by variable density method [51].
Funding Statement: This research work was financially supported by the National Natural Science Foundation of Beijing (No. 2182067), the Fundamental Research Funds for the Central Universities (2018ZD09). We would like to thank Professor Krister Svanberg for providing the program code of MMA. These supports are gratefully acknowledged.
Conflicts of Interest: The authors declare that they have no conflicts of interest to report regarding the present study.
1. Eschenauer, H. A., Olhoff, N. (2001). Topology optimization of continuum structures: A review. Applied Mechanics Review, 54(4), 1453–1457. DOI 10.1115/1.1388075. [Google Scholar] [CrossRef]
2. Rozvany, G. I. N. (2009). A critical review of established methods of structural topology optimization. Structural and Multidisciplinary Optimization, 37(3), 217–237. DOI 10.1007/s00158-007-0217-0.
3. Sigmund, O., Maute, K. (2013). Topology optimization approaches. Structural and Multidisciplinary Optimization, 48(6), 1031–1055. DOI 10.1007/s00158-013-0978-6. [Google Scholar] [CrossRef]
4. Deaton, J. D., Grandhi, R. V. (2013). A survey of structural and multidisciplinary continuum topology optimization: Post 2000. Structural and Multidisciplinary Optimization, 49, 1–38. DOI 10.1007/s00158-013-0956-z.
5. Bendsoe, M. P., Kikuchi, N. (1988). Generating optimal topologies in structural design using a homogenization method. Computer Methods in Applied Mechanics and Engineering, 71(2), 197–224. DOI 10.1016/0045-7825(88)90086-2. [Google Scholar] [CrossRef]
6. Bendsoe, M. P. (1989). Optimal shape design as a material distribution problem. Structural Optimization 1(4), 193–202. DOI 10.1007/BF01650949. [Google Scholar] [CrossRef]
7. Zhou, M., Rozvany, G. I. N. (1991). The COC algorithm, part II: Topological, geometrical and generalized shape optimization. Computer Methods in Applied Mechanics and Engineering, 89(1–3), 309–336. DOI 10.1016/0045-7825(91)90046-9.
8. Bendsoe, M. P., Sigmund, O. (2003). Topology optimization: Theory, methods and applications. Berlin: Springer. DOI 10.1007/978-3-662-05086-6. [Google Scholar] [CrossRef]
9. Xie, Y. M., Steven, G. P. (1993). A simple evolutionary procedure for structural optimization. Computers & Structures, 49(5), 885–896. DOI 10.1016/0045-7949(93)90035-C. [Google Scholar] [CrossRef]
10. Xie, Y. M., Steven, G. P. (1997). Evolutionary structural optimization. London: Springer-Verlag. DOI 10.1007/978-1-4471-0985-3. [Google Scholar] [CrossRef]
11. Querin, O. M., Yong, V., Steven, G. P., Xie, Y. M. (2000). Computational efficiency and validation of bi-directional evolutionary structural optimization. Computer Methods in Applied Mechanics and Engineering, 189(2), 559–573. DOI 10.1016/S0045-7825(99)00309-6. [Google Scholar] [CrossRef]
12. Huang, X., Xie, Y. M. (2010). Evolutionary topology optimization of continuum structures: Methods and applications. Wiley, London. DOI 10.1002/9780470689486. [Google Scholar] [CrossRef]
13. Sethian, J. A., Wiegmann, A. (2000). Structural boundary design via level set and immersed interface methods. Journal of Computational Physics, 163(2), 489–528. DOI 10.1006/jcph.2000.6581. [Google Scholar] [CrossRef]
14. Wang, M. Y., Wang, X., Guo, D. (2003). A level set method for structural topology optimization. Computer Methods in Applied Mechanics and Engineering, 192(1–2), 227–246. DOI 10.1016/S0045-7825(02)00559-5. [Google Scholar] [CrossRef]
15. Sigmund, O. (1994). Materials with prescribed constitutive parameters: An inverse homogenization problem. International Journal of Solids & Structures, 31(17), 2313–2329. DOI 10.1016/0020-7683(94)90154-6. [Google Scholar] [CrossRef]
16. Sigmund, O. (1995). Tailoring materials with prescribed elastic properties. Mechanics of Materials, 20(4), 351–368. DOI 10.1016/0167-6636(94)00069-7. [Google Scholar] [CrossRef]
17. Sigmund, O., Torquato, S. (1996). Composites with extremal thermal expansion coefficients. Applied Physics Letters, 69(21), 3203–3205. DOI 10.1063/1.117961. [Google Scholar] [CrossRef]
18. Sigmund, O., Torquato, S. (1997). Design of materials with extreme thermal expansion using a three-phase topology optimization. Journals of Mechanics & Physics of Solids, 45(6), 1037–1067. DOI 10.1016/S0022-5096(96)00114-7. [Google Scholar] [CrossRef]
19. Silva, E. C. N., Fonseca, J. S. O., Kikuchi, N. (1997). Optimal design of piezoelectric microstructures. Computational Mechanics, 19(5), 397–410. DOI 10.1007/s004660050188. [Google Scholar] [CrossRef]
20. Silva, E. C. N., Fonseca, J. S. O., Kikuchi, N. (1998). Optimal design of periodic piezocomposites. Computer Methods in Applied Mechanics and Engineering, 159(1–2), 49–77. DOI 10.1016/S0045-7825(98)80103-5. [Google Scholar] [CrossRef]
21. Wang, Z. P., Poh, L. H. (2018). Optimal form and size characterization of planar isotropic petal-shaped auxetics with tunable effective properties using IGA. Composite Structures, 201(10), 486–502. DOI 10.1016/j.compstruct.2018.06.042. [Google Scholar] [CrossRef]
22. Wang, Z. P., Poh, L. H., Dirrenberger, J., Zhu, Y., Forest, S. (2017). Isogeometric shape optimization of smoothed petal auxetic structures via computational periodic homogenization. Computer Methods in Applied Mechanics and Engineering, 323, 250–271. DOI 10.1016/j.cma.2017.05.013. [Google Scholar] [CrossRef]
23. Sigmund, O. (2000). A new class of extremal composites. Journal of Mechanics & Physics Solids, 48(2), 397–428. DOI 10.1016/S0022-5096(99)00034-4. [Google Scholar] [CrossRef]
24. Gibiansky, L. V., Sigmund, O. (2000). Multiphase composites with extremal bulk modulus. Journal of Mechanics & Physics Solids, 48(3), 461–498. DOI 10.1016/S0022-5096(99)00043-5. [Google Scholar] [CrossRef]
25. Guest, J. K., Prevost, J. H. (2006). Optimizing multifunctional materials: Design of microstructures for maximized stiffness and fluid permeability. International Journal of Solids & Structures, 43(22–23), 7028–7047. DOI 10.1016/j.ijsolstr.2006.03.001. [Google Scholar] [CrossRef]
26. Challis, V. J., Roberts, A. P., Wilkins, A. H. (2008). Design of three dimensional isotropic microstructures for maximized stiffness and conductivity. International Journal of Solids & Structures, 45(14–15), 4130–4146. DOI 10.1016/j.ijsolstr.2008.02.025. [Google Scholar] [CrossRef]
27. Andreassen, E., Lazarov, B. S., Sigmund, O. (2014). Design of manufacturable 3D extremal elastic microstructure. Mechanics of Materials, 69(1), 1–10. DOI 10.1016/j.mechmat.2013.09.018. [Google Scholar] [CrossRef]
28. Huang, X., Radman, A., Xie, Y. M. (2011). Topological design of microstructures of cellular materials for maximum bulk or shear modulus. Computational Materials Science, 50(6), 1861–1870. DOI 10.1016/j.commatsci.2011.01.030. [Google Scholar] [CrossRef]
29. Radman, A., Huang, X., Xie, Y. M. (2013). Topological optimization for the design of microstructures of isotropic cellular materials. Engineering Optimization, 45(11), 1331–1348. DOI 10.1080/0305215X.2012.737781. [Google Scholar] [CrossRef]
30. Radman, A., Huang, X., Xie, Y. M. (2014). Topological design of microstructures of multi-phase materials for maximum stiffness or thermal conductivity. Computational Materials Science, 91, 266–273. DOI 10.1016/j.commatsci.2014.04.064. [Google Scholar] [CrossRef]
31. Radman, A., Huang, X., Xie, Y. M. (2014). Maximizing stiffness of functionally graded material with prescribed variation of thermal conductivity. Computational Materials Science, 82, 457–463. DOI 10.1016/j.commatsci.2013.10.024. [Google Scholar] [CrossRef]
32. Li, Y. F., Huang, X., Zhou, S. (2016). Topological design of cellular phononic band gap crystals. Materials, 9, 186. DOI 10.3390/ma9030186. [Google Scholar] [CrossRef]
33. Andreasen, C. S., Andreassen, E., Jensen, J. S., Sigmund, O. (2014). On the realization of the bulk modulus bounds for two-phase viscoelastic composites. Journal of the Mechanics and Physics of Solids, 63(1), 228–241. DOI 10.1016/j.jmps.2013.09.007. [Google Scholar] [CrossRef]
34. Wang, Y., Sigmund, O. (2020). Quasiperiodic mechanical metamaterials with extreme isotropic stiffness. Extreme Mechanics Letters, 34, 100596. DOI 10.1016/j.eml.2019.100596. [Google Scholar] [CrossRef]
35. Meng, L., Shi, J., Yang, C., Gao, T. Hou, Y. et al. (2020). An emerging class of hyperbolic lattice exhibiting tunable elastic properties and impact absorption through chiral twisting. Extreme Mechanics Letters, 40, 100869. DOI 10.1016/j.eml.2020.100869.
36. Chen, W., Huang, X. (2019). Topological design of 3D chiral metamaterials based on couple-stress homogenization. Journal of the Mechanics and Physics of Solids, 131, 372–386. DOI 10.1016/j.jmps.2019.07.014. [Google Scholar] [CrossRef]
37. Liu, B., Zhang, L. X., Gao, H. J. (2006). Poisson ratio can play a crucial role in mechanical properties of biocomposites. Mechanics of Materials, 38(12), 1128–1142. DOI 10.1016/j.mechmat.2006.02.002. [Google Scholar] [CrossRef]
38. Liu, B., Feng, X., Zhang, S. M. (2009). The effective Young’s modulus of composites beyond the Voigt estimation due to the Poisson’s effect. Composites Science & Technology, 69(13), 2198–2204. DOI 10.1016/j.compscitech.2009.06.004. [Google Scholar] [CrossRef]
39. Kocer, C., Mckenzie, D. R., Bilek, M. M. (2009). Elastic properties of a material composed of alternating layers of negative and positive Poisson’s ration. Materials Science and Engineering: A, 505(1–2), 111–115. DOI 10.1016/j.msea.2008.11.002. [Google Scholar] [CrossRef]
40. Strek, T., Jopek, H., Maruszewski, B. T., Nienartowicz, M. (2014). Computational analysis of sandwich-structured composites with an auxetic phase. Physica Status Solidi, 251(2), 354–366. DOI 10.1002/pssb.201384250. [Google Scholar] [CrossRef]
41. Shufrin, I., Pasternak, E., Dyskin, A. V. (2015). Hybrid materials with negative Poisson’s ratio inclusions. International Journal of Engineering Science, 89(4), 100–120. DOI 10.1016/j.ijengsci.2014.12.006. [Google Scholar] [CrossRef]
42. Pasternak, E., Shufrin, I., Dyskin, A. V. (2016). Thermal stresses in hybrid materials with auxetic inclusions. Composite Structures, 138(3), 313–321. DOI 10.1016/j.compstruct.2015.11.032. [Google Scholar] [CrossRef]
43. Zuo, Z. H., Xie, Y. M. (2014). Maximizing the effective stiffness of laminate composite materials. Computational Materials Science, 83(15), 57–63. DOI 10.1016/j.commatsci.2013.11.010. [Google Scholar] [CrossRef]
44. Long, K., Du, X., Xu, S., Xie, Y. M. (2016). Maximizing the effective Young’s modulus of a composite material by exploiting the Poisson effect. Composite Structures, 154(10), 593–600. DOI 10.1016/j.compstruct.2016.06.061. [Google Scholar] [CrossRef]
45. Andreassen, E., Andreasen, C. S. (2014). How to determine composite material properties using numerical homogenization. Computational Materials Science, 83(15), 488–495. DOI 10.1016/j.commatsci.2013.09.006. [Google Scholar] [CrossRef]
46. Xia, L., Breitkopf, P. (2015). Design of materials using topology optimization and energy-based homogenization approach in Matlab. Structural and Multidisplinary Optimization, 52(6), 1229–1241. DOI 10.1007/s00158-015-1294-0. [Google Scholar] [CrossRef]
47. Walpole, L. J. (1966). On bounds for the overall elastic moduli of inhomogeneous systems-I. Journal of the Mechanics and Physics of Solids, 14(3), 151–162. DOI 10.1016/0022-5096(66)90035-4. [Google Scholar] [CrossRef]
48. Walpole, L. J. (1966). On bounds for the overall elastic moduli of inhomogeneous systems-II. Journal of the Mechanics and Physics of Solids, 14(5), 289–301. DOI 10.1016/0022-5096(66)90025-1. [Google Scholar] [CrossRef]
49. Svanberg, K. (1987). The method of moving asymptotes–-A new method for structural optimization. International Journal for Numerical Methods in Engineering, 24(2), 359–373. DOI 10.1002/nme.1620240207. [Google Scholar] [CrossRef]
50. Long, K., Han, D., Gu, X. (2017). Concurrent topology optimization of composite macrostructure and microstructure constructed by constituent phases of distinct Poisson’s ratios for maximum frequency. Computational Material Science, 129, 194–201. DOI 10.1016/j.commatsci.2016.12.013. [Google Scholar] [CrossRef]
51. Wang, Y., Wang, Z., Xia, Z., Poh, L. H. (2018). Structural design optimization using isogeometric analysis: A comprehensive review. Computer Modeling in Engineering & Sciences, 117(3), 455–507. DOI 10.31614/cmes.2018.04603. [Google Scholar] [CrossRef]
 | This work is licensed under a Creative Commons Attribution 4.0 International License, which permits unrestricted use, distribution, and reproduction in any medium, provided the original work is properly cited. |