| Computer Modeling in Engineering & Sciences |
DOI: 10.32604/cmes.2021.013186
ARTICLE
Speech Intelligibility Enhancement Algorithm Based on Multi-Resolution Power-Normalized Cepstral Coefficients (MRPNCC) for Digital Hearing Aids
1School of Information Science and Technology, Nantong University, Nantong, 226019, China
2School of Automation, Key Laboratory of Measurement and Control for CSE, Ministry of Education, Southeast University, Nanjing, 210096, China
3School of Computer Science, Jiangsu University of Science and Technology, Zhenjiang, 212003, China
*Corresponding Author: Hongming Shen. Email: hmshen@ntu.edu.cn
Received: 29 July 2020; Accepted: 23 November 2020
Abstract: Speech intelligibility enhancement in noisy environments is still one of the major challenges for hearing impaired in everyday life. Recently, Machine-learning based approaches to speech enhancement have shown great promise for improving speech intelligibility. Two key issues of these approaches are acoustic features extracted from noisy signals and classifiers used for supervised learning. In this paper, features are focused. Multi-resolution power-normalized cepstral coefficients (MRPNCC) are proposed as a new feature to enhance the speech intelligibility for hearing impaired. The new feature is constructed by combining four cepstrum at different time–frequency (T–F) resolutions in order to capture both the local and contextual information. MRPNCC vectors and binary masking labels calculated by signals passed through gammatone filterbank are used to train support vector machine (SVM) classifier, which aim to identify the binary masking values of the T–F units in the enhancement stage. The enhanced speech is synthesized by using the estimated masking values and wiener filtered T–F unit. Objective experimental results demonstrate that the proposed feature is superior to other comparing features in terms of HIT-FA, STOI, HASPI and PESQ, and that the proposed algorithm not only improves speech intelligibility but also improves speech quality slightly. Subjective tests validate the effectiveness of the proposed algorithm for hearing impaired.
Keywords: Speech intelligibility enhancement; multi-resolution power-normalized cepstral coefficients; binary masking value; hearing impaired
Noise affects speech intelligibility, especially that of hearing-impaired patients. To achieve the same speech intelligibility in a noisy environment, the signal-to-noise ratio (SNR) required for hearing-impaired patients is generally 3–6 dB higher than that of individuals with normal hearing [1]. Traditional noise-suppression algorithms in modern hearing aids can improve the quality of noisy speech, but they have limited capacity to improve intelligibility [2]. Speech intelligibility is closely associated with the information contained in the speech. Therefore, improving the intelligibility of speech requires that the target speech signal should not be distorted while noise is removed. However, the speech signals estimated from noisy speech are often inaccurate. Recently, research on speech intelligibility enhancement based on binary masking is emerging [3]. The noisy signal is first decomposed into two-dimensional time–frequency (T–F) units, of which one dimension is the T–F units of the target signal and the another dimension is the T–F units of the interference signal. The ideal binary masking (IBM) algorithm indicates that if the energy of the target signal is higher than that of the interference signal, then the element value of the binary matrix corresponding to the T–F unit is 1, otherwise, it is 0. Under certain conditions, the algorithm improves speech intelligibility by removing masking signals that do not contribute to intelligibility [4–7]. In general, there are two kinds of research on speech intelligibility enhancement by binary masking. One is based on ideal binary masking, the other is based on estimated binary masking using machine learning. Early research mainly focused on ideal binary masking such as reference [8]. The disadvantage of an ideal binary masking algorithm is that the IBM values are known prior, which is hardly satisfied in practice. Motivated by the success of the IBM algorithm for improvement of speech intelligibility, binary masking algorithms based on machine learning is proposed [9,10]. Two key issues of these algorithms are acoustic features extracted from noisy signals and classifiers used for supervised learning. While previous studies have emphasized classifiers, in this paper, we focus on features. Our goal is to develop superior features to classify T–F unit accurately and to improve speech intelligibility.
In this paper, we proposed a new feature called multi-resolution power-normalized cepstral coefficients (MRPNCC) to improve the performance of the speech intelligibility enhancement algorithm for digital hearing aids. This paper is organized as follows. A speech intelligibility enhancement system based on MRPNCC is constructed in Section 2. Section 3 describes the extraction steps of MRPNCC. Systematic evaluation and comparison are presented in Section 4. We conclude this paper in Section 5.
2 Speech Intelligibility Enhancement System Based on MRPNCC
A block diagram of the speech intelligibility enhancement system based on binary masking is shown in Fig. 1 consisting a training stage and an enhancement stage. In the training stage, noise and clean speech signal are used to train the Support Vector Machine (SVM) model to classify the speech dominant unit and the noise dominant unit. At first, noisy speech is synthesized by clean speech and noise according to the specified SNR. Then the clean speech, noise and noisy speech are passed through gammatone filterbank to generate sub-band signals, from which features of noisy sub-band signals are extracted and priori SNRs are calculated. The label of the T–F unit is determined by the calculated SNR and predetermined local criteria value. Finally, the extracted feature vector and the label of T–F unit are used to train SVM classifiers. In the enhancement stage, noisy speech is enhanced by the classified label and Wiener filter. Firstly, noisy signal is decomposed into sub-band signals using gammatone filterbank. Then, feature vector of each sub-band signal is extracted and classified by the SVM model. At last, the estimated masking value is multiplied by the speech spectrum enhanced by the Wiener filter to generate the enhanced speech spectrum which ultimately gives rise to enhanced speech through inverse Fourier transform.

Figure 1: Diagram of the intelligibility enhancement system
2.2 Binary Masking Value Estimation Based on SVM
SVM is a machine learning algorithm that is based on statistical learning theory. Statistical learning theory adopts the rule of structural risk minimization criterion to improve the generalization ability of the model. In addition, Gaussian mixture model (GMM) is one of the commonly used classification models. The output of GMM reflects the similarity between samples of the same class. However, the output of SVM reflects the difference between the heterogeneous samples. It is suitable for classification with small number of samples and nonlinear data. It has the advantages of short training time and good generalization performance. Furthermore, the researchers in [11] found that under the same experimental conditions, the classification performance of SVM is better than that of the GMM model. This is probably because the GMM has more parameters while the training data is inadequate. It was also found in [11] that the classification performance of the SVM is superior to that of the multilayer perceptron (MLP). Therefore, in this paper SVM is adopted to estimate the label of the T–F units.
During training stage, MRPNCC feature vectors of noisy speech are firstly calculated. Then, the ideal binary masking value of each T–F unit is obtained using the corresponding clean speech and noise to train SVM model. During test stage, the extracted feature vector is used to determine whether the T–F unit is speech-dominant or noise-dominant. The SVM maps the feature vector to a high-dimensional space by applying a kernel function. In the high-dimensional space, a hyperplane is derived to maximize the margin of class separation. Here, the radial basis function (RBF) kernel is chosen:

The reason that we choose RBF as our kernel function is as follows: The first reason is that this kernel nonlinearly maps samples into a higher dimensional space, so it can handle the case when the relation between class labels and attributes is nonlinear. The second reason is the number of hyperparameters which influences the complexity of model selection. The polynomial kernel has more hyperparameters than the RBF kernel. Finally, the RBF kernel has fewer numerical difficulties. Only when the number of features is very large, the RBF kernel is not suitable. In this paper, the feature dimension is 160, so RBF is the best choice.
Given a set of pairs  , where
  is a feature vector and yi is the corresponding binary label, the SVM requires to solve the following optimization problem:
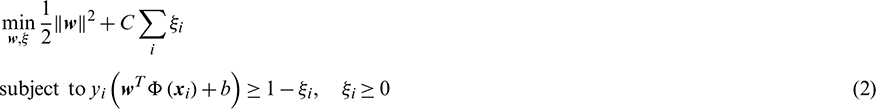
where  is the weight of the hyperplane,
  is a non-negative variable measuring the deviation of a data point from the hyperplane, C controls the trade-off between complexity of the SVM and the number of nonseparable points and
  represents the vector of a set of nonlinear functions that transform the input space to the higher dimensional feature space. b is the bias. After the SVM is well trained, the T–F units can be classified by the model with the following function:

where SV represents the set of support vector indices in training data and  is the Lagrange multiplier that can be determined in the training phase.
2.3 Speech Spectrum Estimation Based on Binary Masking
The binary masking values of T–F units are classified using the SVM model. The identification result of  represents that the T–F unit is dominated by noise, while
  represents that the T–F unit is dominated by speech. Therefore, after the binary masking operation, the speech spectrum of the l th channel for the m th frame is as follows:

where  is the spectrum of the signal for the l th channel of the mth frame after passing through the Wiener filter.
  can be obtained using the following formula:

where  is the frequency spectrum of noisy speech and
  is the gain of the Wiener filter. The gain is defined below:

where  is the a priori SNR. We calculate
  as follows:

where  is the noise variance, which is estimated using the method described in [12].
Power normalized cepstral coefficients (PNCC) are features based on human auditory processing. PNCC simulate the masking effect of human hearing during the process of feature extraction and have been used in robust speech recognition systems. The researchers in [13] have also achieved a recognition accuracy that is superior to that of the traditional Mel-Frequency Cepstral Coefficients (MFCC) feature. Motivated by the PNCC feature extraction algorithm, in this paper we propose a new feature called multi-resolution PNCC (MRPNCC). The new feature is constructed by combining four PNCCs at different spectrotemporal resolutions in order to capture both the local and contextual information of the signal. The MRPNCC is obtained after completing the asymmetric denoising, temporal masking, average power normalizing, power function nonlinearity, and discrete cosine transforming processes. A flow chart for one-resolution parameter extraction is shown in Fig. 2. The other three-resolution parameter extraction methods are similar to it.

Figure 2: One-resolution PNCC feature extraction flow chart
The pre-processing of the signal includes pre-emphasizing, framing, and filtering with the gammatone filterbank, in which the pre-emphasis filter is  . During the framing phase, the pre-emphasized signals are processed at two frame lengths (L1 and L2) with the following parameters in this paper: L1 = 20 ms and L2 = 200 ms. Signals with the two frame lengths are then filtered using a 40-channel gammatone filterbank, generating their respective sub-band signals. Then, the multi-resolution power of the sub-band signals is calculated. Let the mth frame of signals with the lengths of L1 and L2 be
  and
and  . The spectra of lth sub-band signals of
  and
and  are represented as
  and
and  , respectively. Then the powers of the lth sub-band signals are denoted as follows:


 and
and  are then smoothed with square windows with the widths of N1 and N2 in both the time domain and frequency domain to obtain the context information. After the smoothing, the following formula can be obtained:


where  ,
,  ,
,  , and
, and  . Subsequent feature extractions are performed on the basis of
  ,
,  ,
,  and
and  , which are calculated in parallel. The above four kinds of power spectra are uniformly designated as
  to make them easy to express.
3.2 Asymmetric Noise Suppression
In general, the speech power in the channel changes faster than the background noise power in the same channel, i.e., speech has a higher modulation frequency than that of noise. Based on this observation, some algorithms have been developed to perform high-pass or band-pass filtering in the modulation spectrum domain to remove the slowly-varying components which typically represent the additive noise [14]. In this paper the asymmetric denoising method is used to eliminate the interference of the noise during the feature extraction process. The block diagram of asymmetric noise suppression processing with temporal masking is shown in Fig. 3. The relationship between the input and the output of the asymmetric filter is as follows [15]:

In Formula (12), m is the frame index, l is the channel index, and  and
and  are constants between 0 and 1. In the formula above, the parameters are
  and
and  .
.  is initialized to
  . After noise suppression, half-wave rectification is performed on the signal and the output of the rectifier is
  . Since the rectified signal still contains noise, a second asymmetric filtering is performed to obtain a lower envelope which is then used as the basic noise level. The envelope
  is obtained as follows:

 in Formula (13) is initialized as
  . As shown in Fig. 3, we use the lower envelope of the rectified signal
  as floor level for
  after temporal masking:

where  is obtained by performing temporal masking on signal
  . Then,
  and the second asymmetric filtering result are compared, and the higher value is retained.

Figure 3: Asymmetric noise suppression block diagram
Whether the sub-band signal is a speech signal or a silent segment is determined based on  and the lower envelope
  . If
. If  , then the sub-band signal is a speech segment with an asymmetric filtering module output of
  . Otherwise, the sub-band signal is a silent segment with an asymmetric filtering module output of
  . These signals can be expressed mathematically as follows:

In Formula (15), c = 2 provides the best performance according to the pre-experiments.
Studies have shown that the human auditory system pays more attention to the onset of an incoming power envelope rather than the falling edge of the same power envelope [16,17], which has led to various speech onset enhancement systems [18,19]. In this paper, this auditory effect of the human ear has been integrated into the temporal masking algorithm. First, the peak power of each channel  is calculated as follows:

In Formula (16),  is the forgetting factor for obtaining the online peak and
  . The output after temporal masking is as follows:

In Formula (17),  . Therefore, the transfer function of the entire asymmetric denoising process can be expressed as:

The power spectrum after modulating with the transfer function of  is as follows:

where  is the corresponding original spectrum at a different resolution without any smoothing.
The human ear has an automatic gain adjustment function to mitigate the influence of changes in amplitude of the input signal. To simulate this function of the human ear, the power spectrum is normalized during the MRPNCC parameter extraction process. In this paper, the mean power is accomplished by running average [13]:

In Formula (20),  is set to 0.999. The normalized power is obtained directly from the estimated average power:

3.5 Power Function Non-Linearization
The nonlinear function used to describe the relationship between input and output of the channel plays an important role in the auditory model. The power law function has been shown to be a good approximation of the transfer function observed in physiological experiments. Athulya et al. [20] found that the use of a power law function with an exponent of 1/15 best suited for noisy conditions. Therefore, the power law factor is set to 1/15 in this paper:

MHINT is a corpus designed for Mandarin hearing test [21]. Sentences in the corpus represent simple and conversational speech among which some words can be predicted with the contextual information. However, subjects with different hearing loss have different cognitive ability which will affect the experimental results. Therefore, experiments were conducted on the corpus recorded by ourselves in an anechoic chamber, containing 400 sentences. To reduce the effect of cognition in the hearing test, the corpus was designed with relatively low word context. A total of 400 sentences were constructed by a native female speaker in China. The sampling rate of all the utterances was 44.1 kHz and the signals were resampled to 16 kHz. A total of 300 sentences were used to train the SVM model and the remaining 100 sentences were used to test. All these sentences were corrupted by three types of noise at −5, 0 and 5 dB SNR. Three types of noise signals were babble noise, factory noise, and speech shaped noise (SSN).
A baseline system was constructed to determine the parameters for the proposed feature extraction algorithm such as the frame length and the width of the smoothing window. For training and test, clean speech was mixed with babble noise at 0 dB. At first, the training speech was sent to a 40-channel gammatone filterbank. Then, the feature parameters were extracted from the filtered signals to train the SVM model. Lastly, the SVM model generated the classification result based on the feature vectors to determine whether the T–F unit was speech-dominant or noise-dominant. In the model, to determine the category of the T–F unit, the threshold parameter of local SNR criterion was set to −5 dB. Since the task of the system was to classify the T–F unit, the most direct evaluation index should be the classification accuracy. However, it is not reasonable to use the classification accuracy as the evaluation index of the system performance, because it assigns the same importance to the rates of two errors (i.e., misclassifying the speech-dominant T–F unit as the noise-dominated T–F unit and misclassifying the noise-dominated T–F unit as the speech-dominant T–F unit). In fact, studies on speech intelligibility show that the effect of misclassifying the noise-dominated T–F unit as the speech-dominant T–F unit on speech intelligibility is greater than that of misclassifying the speech-dominant T–F unit as the noise-dominated T–F unit [22]. So, the estimation of HIT–FA is considered as a best objective evaluation criteria because of its strong correlation to human speech intelligibility [23]. HIT refers to the hit rate, which is the percentage that the system correctly classifies the speech-dominated T–F unit. FA refers to the false alarm rate, which is the percentage that the system wrongly classifies the noise-dominated T–F unit. Therefore, in this paper, HIT–FA was used as an objective index for the system performance evaluation.
The methods for determining the frame length and the smoothing window width in the MRPNCC feature extraction algorithm are as follows: The features extracted from  ,
,  ,
,  ,
,  were expressed as PNCC1, PNCC2, PNCC3, and PNCC4, respectively. All of these features were cascaded in series to form the feature MRPNCC. Notably, the method used to extract PNCC1-PNCC4 was not exactly the same as that used in Reference [13], so the resulting feature vectors were not identical either. The same symbols are used here because of the convenience of description. First, during calculating PNCC1, the window size was set to 20 ms, the noisy speech with babble noise at 0 dB SNR was used to train the SVM model, and then noisy speech with babble noise at 0 dB SNR was used to identify the T–F units of each channel and the HIT–FA value of the system was calculated. The frame length of PNCC1 was fixed, while that of PNCC2 was varied to compute the HIT–FA. The frame length corresponding to the maximum HIT–FA value was deemed the optimal frame length which was 200 ms. Similarly, the widths of the square sliding windows for PNCC3 and PNCC4 (N1 and N2) were determined, and the optimal widths were determined at N1 = 2 and N2 = 4, respectively. Fig. 4 shows the HIT–FA value of the system after adding contextual information. As can be seen from the Fig. 4, adding PNCC2-4 improves the system performance for babble noisy speech at 0 dB SNR. Similar trends are observed for the other noises.

Figure 4: HIT–FA values of the intelligibility enhancement system after adding different contextual information
A visualization of the MRPNCC feature is given in Fig. 5, where the left plots features extracted from the clean speech and the right from a babble mixture at 0 dB SNR. As shown in Fig. 5, PNCC displayed in the first row is the regular cepstrum coefficients, PNCC2 displayed in the second row captures temporal context, PNCC3 displayed in the third row encodes relatively small spectrotemporal context and PNCC4 displayed in the fourth row encodes relatively large spectrotemporal context. By comparing Figs. 5a and 5b, we find that MRPNCC features can partially retain spectrotemporal information of speech in noise environment, and that it acquires the contextual information in the signal and that it is thus suitable for the classification of T–F units. This rationale behind MRPNCC is that regardless of the speech-dominant T–F unit or the noise-dominant T–F unit, the T–F units are usually clustered.

Figure 5: MRPNCC feature spectrum (a) clean speech and (b) noisy speech with babble noise at 0 dB SNR
The estimated binary masking values of the noisy speech adding babble noise at 0 dB SNR are shown in Fig. 6. Fig. 6a shows the ideal binary masking value. It indicates that the speech-dominant T–F units or noise-dominant T–F units are presented essentially in clusters, and only occasionally a few of the T–F units wander off the T–F cluster. Fig. 6b displays the estimation result of the binary masking value using the SVM model. Using the MRPNCC feature, the SVM identifies most of the speech-dominant T–F units, while a small number of noise-dominant units are misidentified as speech-dominant ones and a small number of speech-dominant units are misidentified as noise-dominant ones.

Figure 6: Binary mask estimation (a) ideal binary masking value and (b) binary masking estimated via SVM
To compare the waveforms of a speech segment before and after enhancement by the proposed algorithm, the speech waveforms before and after enhancement are shown in Fig. 7. Fig. 7a shows the waveform of the clean speech signal. Fig. 7b shows that of the noisy signal with an SNR of 0 dB synthesized by mixing clean speech with babble noise. Fig. 7c shows that of the speech processed by the ideal binary masking enhancement algorithm. Fig. 7d shows that of the speech processed by the proposed algorithm. It is indicated that the waveform of the speech processed by the ideal binary masking algorithm is closest to that of the clean speech, and the waveform of the speech processed by the proposed algorithm is close to that of the clean speech.

Figure 7: Comparison of speech waveforms before and after enhancement (a) clean speech (b) noisy speech (c) enhanced speech by IBM and (d) enhanced speech by proposed method
Experimental results are presented to demonstrate the superiority of MRPNCC feature over competing ones. The features used for comparison were PLP [24], Relative spectral transform PLP (R-PLP) [24], MFCC [25], MRMFCC which is extend from MFCC, Amplitude Modulation Spectrogram (AMS) [26], and Power Normalized Cepstral Coefficients (PNCC) [13]. The HIT–FA values of different features under babble noisy environment at 0 dB SNR are shown in Fig. 8. Comparisons of different features indicate that the HIT–FA value of the MRPNCC feature is the highest and that of the AMS is the lowest, while those of the other features are in the middle. The reason why the MRPNCC feature has the best performance is that it utilizes the multi-resolution information of the signal.

Figure 8: HIT–FA values with different features
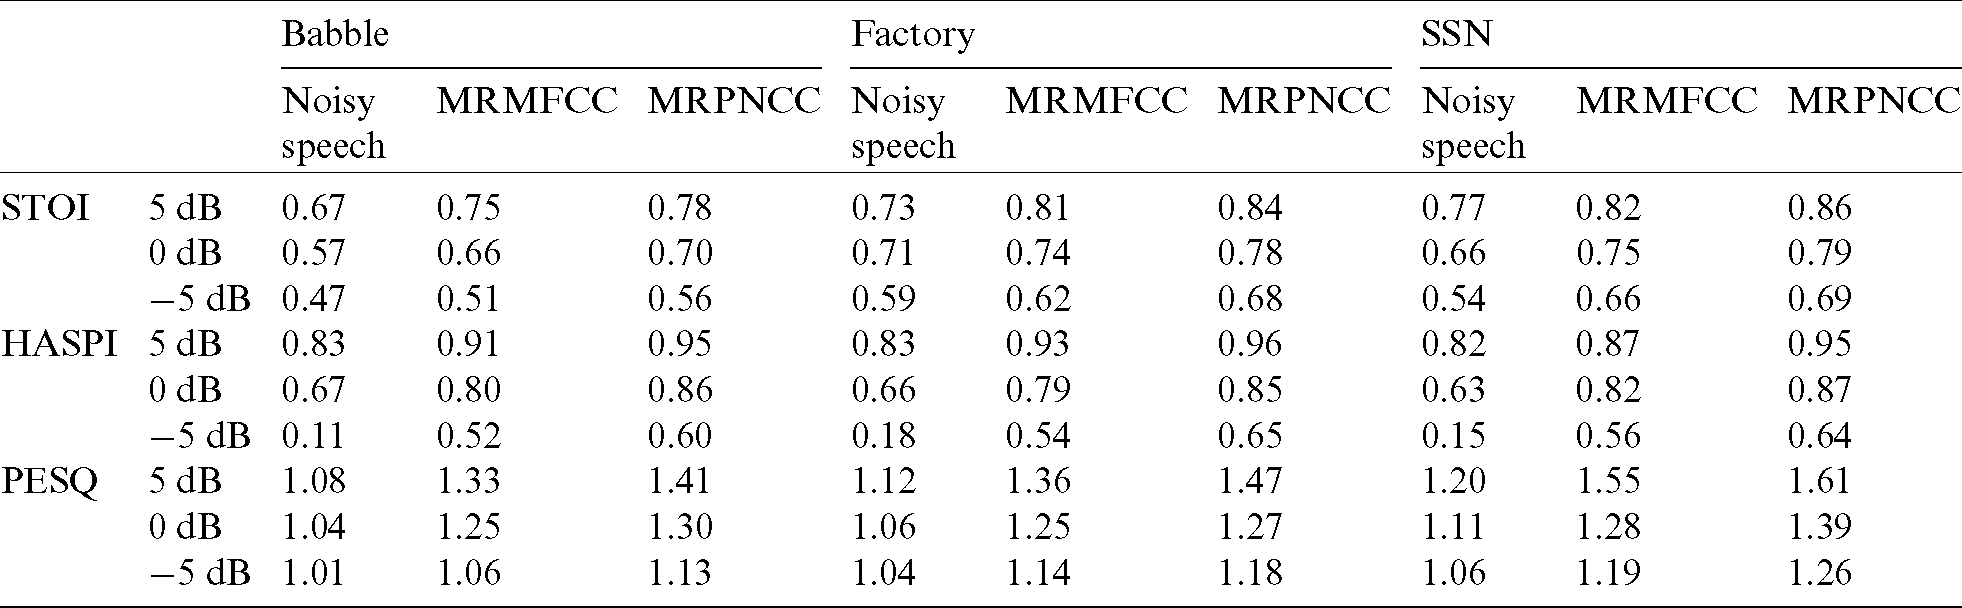
To compare the performance of the MRMFCC and the MRPNCC in 3 noise types, the test results of STOI, HASPI and PESQ are shown in Tab. 1. We can see that all of the methods improve the speech intelligibility and speech quality. Results based on MRPNCC is better than that of MRMFCC due to temporal masking during feature extraction. Comparing the results of 3 noise conditions, results of the babble noise are the worst. This is probably because of the similarity between the babble noise and the speech. At the same time, we find that although PESQ is improved, it is improved slightly.
Table 1: STOI, HASPI and PESQ of the proposed algorithm and contrast algorithm
Ten patients with moderate to moderate-to-severe sensorineural hearing loss participated in the listening test. They were five males and five females aged from 52 to 66 years with an average age of 60.3 years, Pure-tone average (PTA) based on 0.5, 1,and 2 kHz ranged from 35 to 65 dB hearing level (HL: average 54.6), and a sloping hearing loss pattern. The pure tone-hearing threshold for these patients is shown in Tab. 2. The test utterance was taken from the corpus with a total of 100 sentences. The noise types were babble noise, factory noise and SSN with SNRs of −5, 0 and 5 dB, respectively. Because the subjects all had hearing loss, the processed signal had to be amplified. Before the amplification, the root mean square level of the signal was corrected to 65 dB, and the signals were amplified using the NAL-NL1 formula and transmitted to the subject through an earphone. The test was conducted in an anechoic chamber. After hearing one sentence, the subject was asked to speak the sentence out immediately, and the tester recorded the content that the subject had just spoken. After the experiment was completed, the percentage of correctly identified words by the subject was used to represent the intelligibility of the speech. During testing, the noise type was randomized and the SNR was blocked. Firstly, the unprocessed speech with babble noise was tested. Secondly, the processed speech at −5 dB was tested. Thirdly, the processed speech at 0 dB was tested. At last, the processed speech at 5 dB was tested.
Table 2: Subject’s pure tone hearing threshold/dB
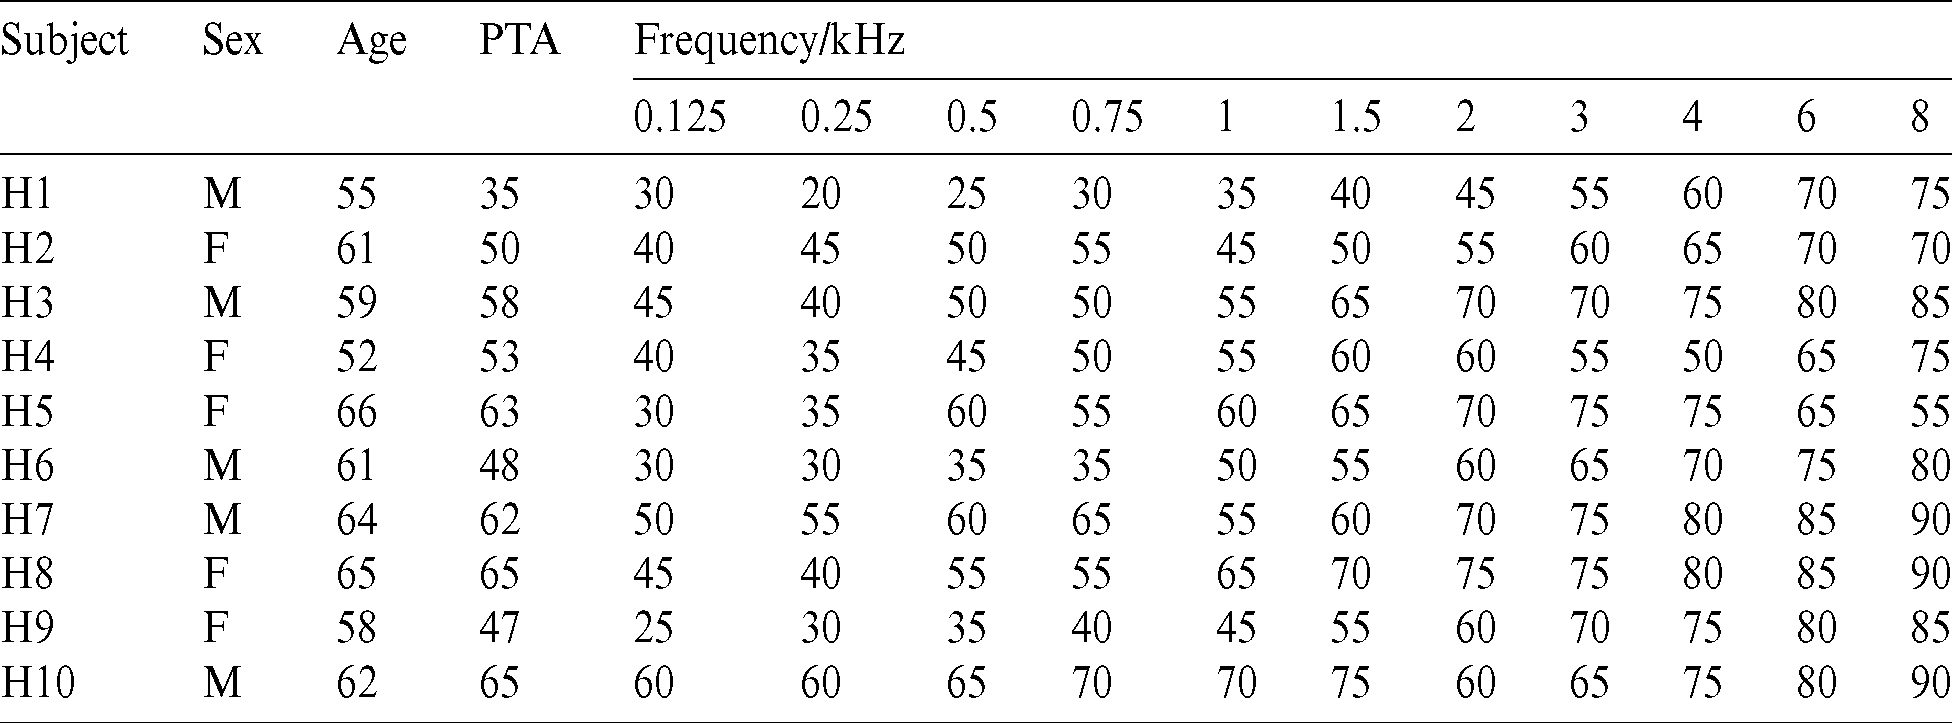
Fig. 9 shows the speech intelligibility results of the ten hearing impaired patients under different SNRs and different environments. Because the intelligibility of the processed speech in the −5 dB environment was lower than 50%, it was not shown in the figure. The intelligibility of the unprocessed speech in a noisy environment is indicated by “ ”. That of the processed speech is indicated by “
 ”, and the improved speech intelligibility is represented by the height of the line. In each figure, the intelligibility of speech at 0 dB SNR is shown in the left and those of speech at 5 dB SNR is shown in the right. Paired t tests confirmed the reliability of the processing benefit in each condition shown in Fig. 9 (p < 0.001).

Figure 9: Speech intelligibility under different noise and SNR conditions (a) babble noise (b) factory noise and (c) SSN
In the babble noise environment, the speech intelligibility for all patients at the SNR of 0 dB was improved. Subject 2 received the most benefit of 49%. Four out of the ten subjects received a benefit of more than 40%. In the babble noise environment, the speech intelligibility for all patients at the SNR of 5 dB was improved. Subject 2 received the most benefit of 36%. Five out of the ten subjects received a benefit of more than 20%.
In the factory noise environment, the speech intelligibility for all patients at the SNR of 0 dB was improved. Subject 9 received the most benefit of 46%. Five out of the ten subjects received a benefit of more than 35%. In the factory noise environment, all of the speech intelligibility at the SNR of 5 dB was improved. Subject 2 received the most benefit of 37%. Five out of the ten subjects received a benefit of more than 20%.
In the SSN environment, the speech intelligibility of all the patients at the SNR of 0 dB was improved. Subject 5 received the most benefit of 44%. Four out of the ten subjects received a benefit of more than 40%. In the SSN environment, except for Subject 1, the speech intelligibility at the SNR of 5 dB for other patients was improved. Subject 2 received the most benefit of 37%. Five out of the ten subjects received a benefit of more than 20%.
A comprehensive comparison of the three panels in Fig. 9 indicates that if the intelligibility of the unprocessed speech for the subject is lower, then the intelligibility of the processed speech for the subject improves more. If the intelligibility of the unprocessed speech for the subject is higher, then that of the processed speech for the subject improves less. Because of the high baseline level, it is difficult to make further improvement. In some cases, the intelligibility even decreases. The group-mean improvement of intelligibility in all environments is 25.57%. It indicates that the proposed algorithm is suitable for improving the speech intelligibility.
In this paper, we proposed the MRPNCC feature for speech intelligibility enhancement system. The signals were firstly decomposed to T–F units using the gammatone filterbank. Then, the novel robust MRPNCC features were extracted from the obtained T–F units, and utilized to train the SVM model together with the known labels. During the recognition stage, the SVM model was used to identify whether the T–F unit was noise-dominated or speech-dominated. If the T–F unit was noise-dominated, then it was removed. Otherwise, it was processed by Wiener filter. Lastly, the processed T–F unit was used to synthesize the enhanced speech. To evaluate the performance of the speech intelligibility enhancement system, experiments under different feature conditions were compared, and results show that the MRPNCC feature outperformed the traditional PLP, R-PLP, MFCC, MRMFCC, AMS, and PNCC features. Finally, subjective auditory experiments results of ten hearing-impaired subjects demonstrated that the intelligibility of the enhanced speech was significantly improved.
Funding Statement: This work was supported by the National Natural Science Foundation of China (Nos. 61902158, 61673108), the Science and Technology Program of Nantong (JC2018129, MS12018082) and Top-notch Academic Programs Project of Jiangsu Higher Education Institutions (PPZY2015B135).
Conflicts of Interest: The authors declare that they have no conflicts of interest to report regarding the present study.
1. Killion, M. C. (1997). The SIN report: Circuits haven’t solved the hearing-in-noise problem. Hearing Journal, 50(3), 28–35. DOI 10.1097/00025572-199710000-00002. [Google Scholar] [CrossRef]
2. Kavalekalam, M. S., Nielsen, J. K., Boldt, J. B., Christensen, M. G. (2018). Model-based speech enhancement for intelligibility improvement in binaural hearing aids. IEEE/ACM Transactions on Audio, Speech, and Language Processing, 27(1), 99–113. DOI 10.1109/TASLP.2018.2872128. [Google Scholar] [CrossRef]
3. Bao, F., Abdulla, W. H. (2018). A new time–frequency binary mask estimation method based on convex optimization of speech power. Speech Communication, 97(1), 51–65. DOI 10.1016/j.specom.2018.01.002. [Google Scholar] [CrossRef]
4. Li, J., Xia, R., Fang, Q., Li, A., Pan, J. et al. (2015). Effect of the division between early and late reflections on intelligibility of ideal binary-masked speech. Journal of the Acoustical Society of America, 137(5), 2801–2810. DOI 10.1121/1.4919287. [Google Scholar] [CrossRef]
5. Hussain, A., Chellappan, K. (2016). Single channel speech enhancement using ideal binary mask technique based on computational auditory scene analysis. Journal of Theoretical and Applied Information Technology, 91(1), 12–22. [Google Scholar]
6. Montazeri, V., Assmann, P. F. (2018). Constraints on ideal binary masking for the perception of spectrally-reduced speech. Journal of the Acoustical Society of America, 144(1), EL59–EL65. DOI 10.1121/1.5046442. [Google Scholar] [CrossRef]
7. Chen, F. (2016). Representing the intelligibility advantage of ideal binary masking with the most energetic channels. Journal of the Acoustical Society of America, 140(6), 4161–4169. DOI 10.1121/1.4971206. [Google Scholar] [CrossRef]
8. Cao, S., Li, L., Wu, X. (2011). Improvement of intelligibility of ideal binary-masked noisy speech by adding background noise. Journal of the Acoustical Society of America, 129(4), 2227–2236. DOI 10.1121/1.3559707. [Google Scholar] [CrossRef]
9. Chen, J., Wang, Y., Yoho, S. E., Wang, D., Healy, E. W. (2016). Large-scale training to increase speech intelligibility for hearing-impaired listeners in novel noises. Journal of the Acoustical Society of America, 139(5), 2604–2612. DOI 10.1121/1.4948445. [Google Scholar] [CrossRef]
10. Healy, E. W., Delfarah, M., Vasko, J. L., Carter, B. L., Wang, D. (2017). An algorithm to increase intelligibility for hearing-impaired listeners in the presence of a competing talker. Journal of the Acoustical Society of America, 141(6), 4230–4239. DOI 10.1121/1.4984271. [Google Scholar] [CrossRef]
11. Han, K., Wang, D. (2012). A classification based approach to speech segregation. Journal of the Acoustical Society of America, 132(5), 3475–3483. DOI 10.1121/1.4754541. [Google Scholar] [CrossRef]
12. Elshamy, S., Madhu, N., Tirry, W., Fingscheidt, T. (2017). Instantaneous a priori SNR estimation by cepstral excitation manipulation. IEEE/ACM Transactions on Audio Speech & Language Processing, 25(8), 1592–1605. DOI 10.1109/TASLP.2017.2702385. [Google Scholar] [CrossRef]
13. Kim, C., Stern, R. M. (2016). Power-normalized cepstral coefficients (PNCC) for robust speech recognition. IEEE/ACM Transactions on Audio, Speech, and Language Processing, 24(7), 1315–1329. DOI 10.1109/TASLP.2016.2545928. [Google Scholar] [CrossRef]
14. Samui, S., Chakrabarti, I., Ghosh, S. K. (2017). Speech enhancement based on modulation domain processing using coherent harmonic demodulation technique. Electronics Letters, 53(24), 1611–1613. DOI 10.1049/el.2017.2857. [Google Scholar] [CrossRef]
15. Farsi, H., Kuhimoghadam, S. (2013). Robust speech recognition based on mixed histogram transform and asymmetric noise suppression. Majlesi Journal of Electrical Engineering, 7(2), 1–11. [Google Scholar]
16. Kumar, A., Shahnawazuddin, S., Pradhan, G. (2017). Improvements in the detection of vowel onset and offset points in a speech sequence. Circuits, Systems, and Signal Processing, 36(6), 2315–2340. DOI 10.1007/s00034-016-0409-1. [Google Scholar] [CrossRef]
17. Mary, L., Antony, A. P., Babu, B. P., Prasanna, S. M. (2018). Automatic syllabification of speech signal using short time energy and vowel onset points. International Journal of Speech Technology, 21(3), 571–579. DOI 10.1007/s10772-018-9517-6. [Google Scholar] [CrossRef]
18. Koning, R., Wouters, J. (2016). Speech onset enhancement improves intelligibility in adverse listening conditions for cochlear implant users. Hearing Research, 342, 13–22. DOI 10.1016/j.heares.2016.09.002. [Google Scholar] [CrossRef]
19. Saha, P., Baruah, U., Laskar, R. H., Mishra, S., Choudhury, S. P. et al. (2016). Robust analysis for improvement of vowel onset point detection under noisy conditions. International Journal of Speech Technology, 19(3), 433–448. DOI 10.1007/s10772-016-9336-6. [Google Scholar] [CrossRef]
20. Athulya, M. S., Sathidevi, P. S. (2018). Speaker verification from codec distorted speech for forensic investigation through serial combination of classifiers. Digital Investigation, 25(2), 70–77. DOI 10.1016/j.diin.2018.03.005. [Google Scholar] [CrossRef]
21. Wong, L. N., Soli, S. D., Liu, S., Han, N., Huang, M. W. (2007). Development of the Mandarin Hearing in Noise Test (MHINT). Ear & Hearing, 28(Supplement), 70S–74S. DOI 10.1097/AUD.0b013e31803154d0. [Google Scholar] [CrossRef]
22. Wang, D., Kjems, U., Pedersen, M. S., Boldt, J. B., Lunner, T. (2009). Speech intelligibility in background noise with ideal binary time–frequency masking. Journal of the Acoustical Society of America, 125(4), 2336–2347. DOI 10.1121/1.3083233. [Google Scholar] [CrossRef]
23. Venkatesan, R., Balaji, Ganesh A. (2017). Binaural classification-based speech segregation and robust speaker recognition system. Circuits Systems & Signal Processing, 37(8), 3383–3411. DOI 10.1007/s00034-017-0712-5. [Google Scholar] [CrossRef]
24. Prithvi, P., Kumar, T. K. (2016). Comparative analysis of MFCC, LFCC, RASTA-PLP. International Journal of Scientific Engineering and Research, 4(5), 1–4. [Google Scholar]
25. Mei, Q., Gül, M., Boay, M. (2019). Indirect health monitoring of bridges using Mel-frequency cepstral coefficients and principal component analysis. Mechanical Systems and Signal Processing, 119(2), 523–546. DOI 10.1016/j.ymssp.2018.10.006. [Google Scholar] [CrossRef]
26. Delfarah, M., Wang, D. L. (2017). Features for masking-based monaural speech separation in reverberant conditions. IEEE/ACM Transactions on Audio, Speech, and Language Processing, 25(5), 1085–1094. DOI 10.1109/TASLP.2017.2687829. [Google Scholar] [CrossRef]
 | This work is licensed under a Creative Commons Attribution 4.0 International License, which permits unrestricted use, distribution, and reproduction in any medium, provided the original work is properly cited. |