DOI: 10.32604/cmes.2021.012969
ARTICLE
The Influence of Various Structure Surface Boundary Conditions on Pressure Characteristics of Underwater Explosion
College of Shipbuilding Engineering , Harbin Engineering University, Harbin, 150001, China
*Corresponding Author: Zhikai Wang. Email: zhikai.wa@gmail.com
Received: 20 July 2020; Accepted: 12 October 2020
Abstract: The shock wave of the underwater explosion can cause severe damage to the ship structure. The propagation characteristics of shock waves near the structure surface are complex, involving lots of complex phenomena such as reflection, transmission, diffraction, and cavitation. However, different structure surface boundaries have a significant effect on the propagation characteristics of pressure. This paper focuses on investigating the behavior of shock wave propagation and cavitation from underwater explosions near various structure surfaces. A coupled Runge–Kutta discontinuous Galerkin (RKDG) and finite element method (FEM) is utilized to solve the problem of the complex waves of fluids and structure dynamic response, considering the fluid compressibility. The level set (LS) method and the ghost fluid (GF) method are combined to capture the moving interface and deal with the stability of the coupling between the shock wave and structure surface. Besides, a cut-off cavitation model is introduced to the RKDG method. The validation of the numerical calculation model is discussed by comparing it with the known solution to verify the numerical solutions. Then, crucial kinds of structure surface boundary conditions include shallow-water single layer elasticity plate, double-layer crevasse elasticity plate, single layer curved elasticity plate, and double-layer curved elasticity plates are analyzed and discussed. The results and analysis can provide references for underwater explosion pressure characteristics, the impacting response of different boundary structures, and designing structures.
Keywords: Underwater explosion; pressure characteristics; structure surface; cavitation; RKDG-FEM
With the rapid development of precision guidance technology and underwater attack weapons, the surface warships and submarines will inevitably be attacked by these weapons such as torpedoes and bombs [1–8]. The shock wave propagation characteristics and dynamic of structures subjected to underwater explosion have been of great interest to researchers. Underwater explosion interaction with structures belongs to typical FSI issues. In recent years, many scholars have carried out extensive research on the dynamic response of typical ship structures subjected to underwater blast. Schiffer et al. [9] investigated the dynamic response of circular composite plates subjected to underwater blast by using dynamic explicit FE simulations. Ming et al. [4] have studied the damage characteristics of a single plate and shown the failure mode of steel panel using the SPH-FEM method. Liu et al. [10] utilized the DAA method to analyze the external fluid-structure interaction (FSI) effect for a double-plated structure filled with liquid. Gannon [11] presented researches about the simulation of the interaction between an underwater explosion, a submerged cylinder, and a free surface or rigid bottom based on the Eulerian Chinook CFD code coupled with the Lagrangian LS-DYNA explicit finite element solver. Liu et al. [12] adopted the BEM method to simulate the interactions between a ship and an underwater explosion bubble, both in still water and waves. Zhang et al. [13] have conducted a numerical study about the underwater explosion and bubble dynamics near a rigid wall using the SPH-BEM method. Jin et al. [14] used the coupling RKDG-FEM method to study the pressure characteristics of coated circular plates in the near-field underwater explosion.
As to the structure surfaces, boundaries can significantly affect the shock wave propagating characteristics and cavitation characteristics. In cases concerned with boundary effects on pressure propagation characteristics, most literature paid attention to the influence of only one boundary, such as free surface, rigid wall, air-backed single plate, water backed single plate, and complete boundary double-layer plates. Kadioglu et al. [15] used adaptive solution techniques for simulating shock wave propagation of 10 cm thickness of flat plate located in deep water. Pishevar et al. [16] adopted an adaptive ALE method to study pressure characteristics and cavitation of an underwater explosion near a solid wall. Petrov et al. [17] utilized a numerical method based on a Godunov-type high-resolution scheme to simulate the underwater explosion near the free surface. Miller et al. [18] developed a cell-centered finite volume method to simulate pressure propagating characteristics, which can show the diffraction characteristics. Wang et al. [19] have simulated the underwater explosion pressure and cavitation near the air-backed plate and water-backed plate using the CEL method (ATUODYN). Zhang et al. [20] studied the pressure characteristics of the underwater explosion of a cylinder charge near a single plate and double plates based on the RKDG-FEM method. Meng et al. [21] used the CEL method (Atuodyn) to study the pressure characteristics of propagating across the multilayer shell structure regarding shock wave reflection and transmission. The references mentioned above have concerned about researching the pressure characteristics and cavitation effect near the structure surfaces in recent years. As the large inhomogeneity between the water and the high-pressure gas product, the underwater explosion numerical simulation more easily causes numerical oscillation resulting numerical error based on commercial software.
However, the structure boundaries surface can significantly affect the shock wave reflection and cavitation characteristics and rarely be focused on by the scholars. Thus, the influence of typical structure surface boundary conditions on pressure characteristics of the underwater explosion will be investigated emphatically in our present work. In this paper, a coupled RKDG-FEM method is utilized to solve the problem of the complex wave and structure dynamic response problem caused by shock wave propagating between different boundary structures and detonation gases, considering the fluid compressibility due to a high Mach number problem. The FEM method is used to calculate the dynamic response of structure because of its advantage of excellent efficiency. Thus, this method’s advantages can be fully utilized to calculate fluid-structure interaction problems [22–27].
The paper is organized as follows. In Section 2, the coupled RKDG-FEM method is introduced. In Section 3, the effectiveness of the cavitation model is validated compared with the literature’s result. In Section 4, the pressure characteristics of the underwater explosion near different boundary structure surfaces are analyzed. Finally, the conclusions are given in Section 5.
2.1 Governing Equation and Equation State of Fluid
2.1.1 Governing Equation for Fluid Eulerian Formulation
Assume that the fluid and the detonation gases are inviscid, irrational, and compressible in simulations of an underwater explosion. The governing equations for a two-dimensional axisymmetric fluid of Euler equations can be written as [22,28]:

where  is the vector of conserved variables and
  is the flux functions,
  is a geometric source. Furthermore
  ,
,  ,
,  are given as:
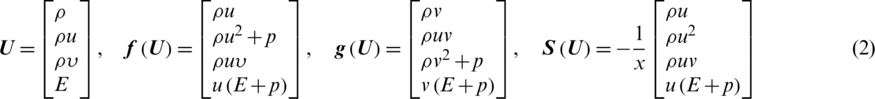
where E is internal energy per unit mass,  is density, u and v are velocities, p is pressures.
In the simulation, gas is considered as an ideal gas, and the equation of state is expressed as follows:

where  is the ratio specific heat of taken as 1.4 in the simulation of an underwater explosion.
The JWL equation of state is usually used for describing the explosive in numerical simulation, stated as follows [29]:

where A, B, R1 , R2 and  are material constant which are
 ,
,  , R1 = 4.15, R2 = 0.95,
  .3,
.3,  is the initial density of TNT set as 1630 kg/m3, E0 is the internal energy per unit mass defined as
  J/m3.
J/m3.
The Tait equation of state is usually applied for water, written as follows [30]:

where the constant A can be set as  Pa, and constant B can be set as
  Pa, the density of water
  is equal to 1000 kg/m3, the constant N is set to 7.15.
2.1.3 Solution of Fluid Governing Equation
The governing equations of fluid motion are solved by the RKDG method. Take for two-dimensional Euler equations, and for example, the spatial discretization is carried by using the RKDG method in computational region  and integrated over a cell K test. The test function
  is introduced and multiplied with both sides of Eq. (1), shown as [25,31,32]:

where  is the outward unit normal of the cell boundary K,
  is all cell boundary sets of cells. The test function
  meets with
 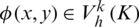 .
.  is test function space, which meets with as:

where  is a polynomial space whose order does not exceed K. The flux and flux integral term in Eq. (7) are shown as:


The flux 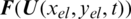 is replaced with a monotone numerical flux
  .
.
The flux 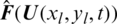 is solved by Lax–Friedrichs, given as:

where  is the maximum eigenvalue of the Jacobian matrix
  . In a quadrilateral cell
  , the approximate solutions is:
where  ,
,  ,
,  ,
,  .
.
The semi-discrete scheme can be further written as:

The discrete difference scheme is obtained by using the third-order total variation diminishing (TVD) of the Runge-Kutta time discretization method for Eq. (12), expressed as:

2.2 Governing Equation and Constitutive Equation for Solid
2.2.1 Governing Equation for Solid
For Lagrangian solid structure, the structural dynamic equations can be expressed by [33]:


where  ,
,  ,
,  , are structure density, Cauchy stress tensor, and body force vector;
  ,
,  ,
,  are structure element displacement, velocity, and acceleration vector;
  and
and  are Dirichlet and Neumann boundaries;
  and
and  are predefined traction boundary condition and predefined displacement boundary condition;
  and
and  are structure spatial coordinate and computational domain;
  and
and  are initial velocity and initial velocity condition.
2.2.2 The Cowper–Symonds Model for Steel
The Cowper–Symonds model is applied for steel material, which can be written as:

where  is initial yield stress,
  is strain rate, the C and P are related parameters for strain rate. The parameters of material Q 235 steel used in this paper are listed in Tab. 1 [34]:
Table 1: Strain-rate-dependent data of Q 235 steel

2.2.3 Solution Governing Equation for Solid
The structure is solved by FEM based on Abaqus/Explicit. In Abaqus/Explicit [35], the time-update is conducted by using the lumped mass matrix and second-order explicit central difference method.


where n is time step increment; n −1/2 and n + 1/2 are middle time step. The acceleration vector of the structural element can be expressed as:

where  is the diagonal lumped mass matrix,
  is the applied load vector, and
  is the internal force vector.
2.3 Interface Treatment for Coupling
The level set method [36] is applied to capture the moving interface, including the gas–water interface and water–solid interface, which can be expressed as:

where  is the velocity of the fluid Euler grid; The Level set method is an implicit interface tracking method, which has certain advantages when dealing with complex material interfaces. However, the volume loss is not taken into account in the solution process of this method, which makes the position of the interface update offset, resulting in the distortion of the flow field. To solve the instability of this calculation, the Level set method needs to be reinitialized, which can be expressed as:

where  is the distance function at the current time step of the Level set equation;
  is signed function;
  ;
;  is the evolution variable.
When the Discontinuous Galerkin is used to solve the near-field underwater explosion problem, the density and pressure of the gas–liquid medium are quite different, that is, the physical quantities on both sides of the gas–liquid interface are discontinuous. When the Euler equation is solved by RKDG, the Non-physical oscillations may occur at the discontinuous interface, which may make the calculation to be absorbed. Therefore, when the RKDG method is used to solve multiphase flow problems such as underwater explosions, it is necessary to introduce the ghost fluid method (GFM) to pre-process the physical quantities on both sides of the gas-liquid interface. The advantage of the Ghost Fluid method is that it can maintain the discontinuous nature of the interface with high resolution, suppress non-physical oscillations near the interface, and the method is easy to extend to multi-dimensional problems.
In this paper, the method based on GFM [37] and modified GFM [38] for the RKDG method is used to solve the grid properties near the interface to improve the stability of calculation of shock wave. For gas-water problems, the method essentially assumes that the two fluids are the same fluid, then artificially define boundary conditions near the interface, and then solve two-fluid equations with boundary conditions. For the water–solid problem, the method essentially defines the boundary conditions of the liquid and the solid according to the state of the liquid–solid interface and then solves the fluid equation and structural equation separately.
Gas–Water Interface Treatment Assume that the fluid and the detonation
For the one-dimensional gas–liquid problem, assuming that the interface is located in cell i, define the Riemann problem:

Here,  is interface state
  ,
,  is left status and
  is the right state,
  is Riemann problem solver. The assignment methods for fluid I and fluid II are shown in Figs. 1a and 1b, respectively. Assign the state of the interface to the cell where the interface is located and the ghost fluid cell where the interface is located outside the cell.

Figure 1: Extrapolate technique for one-dimensional gas-water interface: (a) Solve fluid I; (b) Solve fluid II
Water–Solid Interface Treatment For the water–solid problem, because MGFM needs to establish its Riemann problem for each solid material when dealing with the liquid-solid interface, it lacks flexibility and is not easy to extend to more general problems. Therefore, a more flexible calculation method for solving the liquid-solid interface, that is, using the FEM calculation to obtain the Lagrangian interface velocity and substituting it into the liquid-solid Riemann solver, as the velocity solution of the Riemann problem established at the interface position, and then solving the known interface speed modified Riemann problem, get interface pressure. This method is suitable for strong shocks and can simultaneously impose boundary conditions on the Lagrangian region and Euler region, which greatly improves the flexibility of the fluid-structure coupling calculation method while considering the calculation accuracy.
For the one-dimensional liquid-solid problem, assuming that the interface is located in cell i, define the liquid–solid modified Riemann problem:

where,  is interface state
  ,
,  is left status and
  is the right state,
  is a Liquid–solid modified Riemann problem solver. uI is the velocity of the interface movement, that is, the Lagrangian velocity of the solid boundary calculated by FEM. For Lagrangian solids, assign the interface pressure pI to the interface node, and let the Lagrangian solid calculation program run to get the next solid-state; for Euler fluids, assign the interface state
  to the cell where the interface is located. The ghost fluid cell where is located outside the cell allows the Euler fluid calculation program to run to get the next fluid state, as shown in Fig. 2.

Figure 2: Extrapolate technique for one-dimensional water–solid interface
Nonlinear Euler equations are discretized in space using a discontinuous Galerkin method and discretized in time by the third-order TVD Runge–Kutta method [39]. The level set (LS) method can easily handle the complex material interface, and its topology changes [40] and the ghost fluid (GF) method is more suitable for simulating challenging problems involving strong shock waves or strong discontinuities proposed by Liu et al. [41]. The level set method is applied to solve the interaction of the water-gas interface, and the water–solid interface and the extrapolation of the ghost fluid method are used to deal with boundary conditions at the condition of interaction. The fluid–solid interface treatment is briefly shown as follow in Fig. 3.

Figure 3: The fluid–solid interface treatment: (a) Surface type; (b) Description of what is contained in the second panel. Figures should be placed in the main text near to the first time they are cited. A caption on a single line should be centered
Fig. 3a is showed the interaction surface type in the underwater explosion, and Fig. 3b reveals the interface treatment between the fluid and structure. When the initial shock wave acts on the elastic structure, the structure will deform under the action of external force, and the deformed structure will affect the motion characteristics of the fluid in turn. This is the so-called fluid–solid coupling. When fluid and solid interact, both need to meet normal velocity and continuous pressure conditions at the boundary:

where us, n indicates the normal velocity of structure surface, uf, n is the normal velocity of fluid moving at the surface of the structure, ps indicates the pressure acting on the surface of the structure, pf is the pressure of the fluid at the surface of the structure. For the interaction between the fluid and the rigid wall, only the velocity component perpendicular to the structure surface in the corresponding fluid controlling volume element is set to 0. However, as to a slightly complex structure, the structure will have dynamic response characteristics under the action of external forces. At this time, not only the movement characteristics of fluid are needed to solve, but also need to deal with the boundary conditions at the interface between the fluid and structure.
2.5 Solution Steps for the Procedure
The flow chart of the coupled RKDG-FEM method is shown in Fig. 4. In the first-time step, two Level set functions are defined according to the initial conditions of the gas-liquid interface and the liquid–solid interface. Assuming that the state of the gas–liquid–solid system is known at time  , the steps to calculate the relevant parameters for the next time step are as follows:
Step 1: Calculate fluid time step and solid time step, and take the minimum value of fluid and solid time step as the overall time step;
Step 2: Establish gas–liquid interface Riemann problems, and use Riemann problem solver to solve Riemann problems to obtain the state of the gas–liquid interface and liquid-solid interface, and then extrapolate the state of fluid to obtain the boundary conditions of gas, liquid and solid;
Step 3: After applying boundary conditions, use FEM (Abaqus/Explicit) to calculate the response of the structure, and use RKDG to solve the Euler equation to obtain the response of gas and liquid;
Step 4: Obtain the position of the gas–liquid interface and the liquid-solid interface by solving the Level set equation;
Step 5: According to the position of the gas interface and the liquid interface, the solution of the fluid and the solid at time  is obtained.

Figure 4: The flow chart of coupled RKDG-FEM method
3 Validation of Numerical Calculation Model
3.1 One-Dimensional Shock Tube Verification
The one-dimensional shock tube problem is a theoretical initial value problem of the Euler equation. Because the problem has an exact theoretical solution, it is widely used to verify the accuracy of the numerical method for multiphase flow. Here, the detonation gas-water shock tube problem is used to verify the shock wave load strong discontinuous calculation model. The initial conditions of gas–water are as follows:

where the unit of density is kg/m3, the unit of velocity is m/s, and the unit of pressure is Pa. As the pressure and density in the flow field at the initial moment have large discontinuities, as time goes on, strong shock waves and contact discontinuities t are generated in the flow field. Fig. 5 shows the comparison curves between the numerical and analytical solutions of density and pressure obtained by the RKDG method. It can be seen from Fig. 5 that the calculated results of the shock wave and expansion wave interface captured by this method under such strong discontinuities are in good agreement with the analytical solution.

Figure 5: Validation of one-dimensional shock tube using the RKDG method ( ms) (a) Density; (b) Pressure
3.2 Two-Dimensional Underwater Explosion Bubble Verification
For the interaction between the shock wave and bubble in water, the density and pressure of the flow field on both sides of the interface are discontinuous, and the strength of the shock wave is relatively high, which requires higher stability and accuracy of the discontinuous capture calculation method. The initial conditions of the example are as follows:

The calculation field was  , the mesh number of fluids
  , the initial radius of the bubble is 0.2 m, the bubble canter was located at the point (0, 0). The calculation results in this paper are compared with reference [42] calculation results, as shown in Figs. 6a and 6b. It can be seen that the calculation results of the strong shock wave and bubble interface captured by this method are in good agreement with those in reference [42], which fully proves the effectiveness and correctness of the numerical method in this paper.

Figure 6: Validation of two-dimensional underwater explosion bubble using the RKDG method ( ms): (a) Density; (b) Pressure
3.3 Cut-Off Cavitation Model Verification
In the underwater explosion, the initial shock wave was transmitted and reflected between the structural boundary and explosion bubble. The reflected waves will overlap with the incident wave, causing a sharp drop of pressure in the water [19]. When the pressure reached or even fallen below the saturated vapor pressure of water, local cavitation or regional cavitation would occur. The local cavitation or regional cavitation would have effects on the propagation of the shock wave in the fluid field. It would further change the loading characteristics of the explosion bubble near the structure. Therefore, a cavitation model should be considered to update the relationship between the pressure and density of the fluid. In this paper, a cut-off cavitation model was utilized because of its strong applicability in dealing with underwater explosion issues. It was written as follows [43].

where Psat is saturated-vapor pressure of water,  is the density when the pressure is equal to the Psat.
To verify the effectiveness of the method, a two-dimensional axisymmetric numerical model calculating strong discontinuous shock wave considering the cut-off cavitation was built, and its results were compared with the reference [43]. The calculation field was  , and the rigid wall was located at
  m. The CFL number was set as 0.45, and the mesh was evenly distributed along the x-axis and y-axis, the mesh number of fluids
  . The bubble center was located at the point (0, 0), the initial density inside the bubble was 1270 kg/m3, the pressure was
  Pa, and the ideal gas state equation was adopted. The gas constant
  , the density of water was 1000 kg/m3, the pressure was 105 Pa, and the Tait equation of state was adopted.
Fig. 7 has shown the calculated results of pressure distribution at  ms and
  ms based on the modified Schmidt model [44]. Fig. 8 has gave the pressure distribution at
  ms and
  ms of the model presented in this paper, which shows a good agreement, indicating that the method adopted in this paper could effectively solve the pressure of fluid field including the cavitation effect. When
  ms, the reflected shock wave from the rigid wall acted on the bubble surface, and then reflected the rarefaction wave direction to the rigid wall. Where the rarefaction wave passed, the pressure dropped instantaneously. At this moment, the pressure was not lower than the saturated vapor pressure. After the rarefaction wave acted on the rigid wall, the reflected wave returned to the fluid field in the form of a rarefaction wave. When the reflected rarefaction waves and incident rarefaction waves overlapped together, the pressure of fluid was lower than the saturated vapor pressure, resulting in cavitation in the fluid field, as shown in Fig. 8b.

Figure 7: Pressure distribution from [44] (a)  ms; (b)
  ms
ms

Figure 8: Pressure distribution from this paper: (a)  ms; (b)
  ms
ms
Fig. 9 has shown the comparison curve of pressure–time history in the center of the wall. The method presented in this paper could better calculate the local high strength shock wave and the unloading characteristic caused by the cavitation effect. By comparison with the literature result, it indicated that the combined RKDG-LS-GF method could effectively simulate the pressure propagating and cavitation forming process.

Figure 9: Pressure history at the center of the solid wall
4 The Influence of Structure Boundary Surface on Pressure Characteristics and Bubble Surface
The numerical model and initial parameters are: The initial density of charge is 1630 kg/m3, the pressure is set as 109 Pa, and the radius is 0.24 m. The density of the external fluid field is 1000 kg/m3; the pressure is set as 105 Pa, the size of the calculation field is  for calculating shallow-water elasticity plate and double-layer elasticity plates with a circular crevasse, the size of calculation field is
  for calculating single layer curved elasticity plate and double layer curved elasticity plates, the boundary of left is defined as axisymmetric and the top, bottom and right side are set as outflow boundary, the charge center is located at
  m when calculating in a shallow single-layer elasticity plate and double-layer with circular crevasse elasticity plates while the charge center is located
  m for calculating curved elasticity plates. The CFL number is set as 0.4. The length of the elastic plate is [ −4 m, 4 m], and the thickness
  m, the density is 7850 kg/m3, the elasticity modulus is
  Pa, the yield stress was 235 MPa, the Poisson’s ratio was 0.3, and the outer diameter of the curved elasticity plate is 1.26 m. The initial distance between the bubble center and the inner surface of the curved elasticity plate is 1.2 m. The fluid field is uniformly dispersed into
  grids along the X-axis and Y-axis, with a spacing of 0.02 m. The mesh spacing of the plate is 0.02 m. The time step is taken as
  s.
s.
4.1 Shallow-Water Elasticity Plate
Sometimes, an underwater explosion usually happened in shallow water. The shock wave would interact with the bottom of the sea or nearby ships, also interact with the free surface. This section will study the pressure characteristics between the shallow water elasticity plate and bubble surface, as shown in Fig. 10a. The distance between the center of the bubble and the upper surface of the elasticity plate is 2 m, and the distance between the center of the bubble and the free water surface is also set as 2 m. When shock waves act on the free surface, the transmitted shock wave into the air is of minimal value; most of them are reflected in the fluid field in the form of rarefaction waves due to the low air impedance. Reflected rarefaction wave and incident waves are overlapped, resulting in a decrease of pressure in an instant in overlapping area and producing cavitation area, as shown in Figs. 10b and 10c.
The difference between the shock wave interacting with the free water surface and the elasticity plate is that the free water surface reflects the rarefaction wave while the elasticity plate reflects the shock wave because of the contrast of impedance. When the rarefaction wave acts on the surface of the bubble, one part of them would be reflected in the external fluid field of the bubble, and the other part would transmit to the inside of the bubble. Whether the shock wave or rarefaction wave is transmitted to the inside of the bubble depending on the impedance and pressure on both sides of the bubble interface, as shown in Fig. 10d. When the shock wave is acting on the free surface, the reflected rarefaction wave makes the fluid field soon generating cavitation, and the cavitation expanding continuously, as shown in Fig. 10e. When the reflected shock wave acts on the cavitation region, the pressure in some regions is higher than the saturated vapor pressure. After the shock wave spread to the free water surface, the fluid field would generate cavitation again by the reflected rarefaction wave, as shown in Fig. 10f.
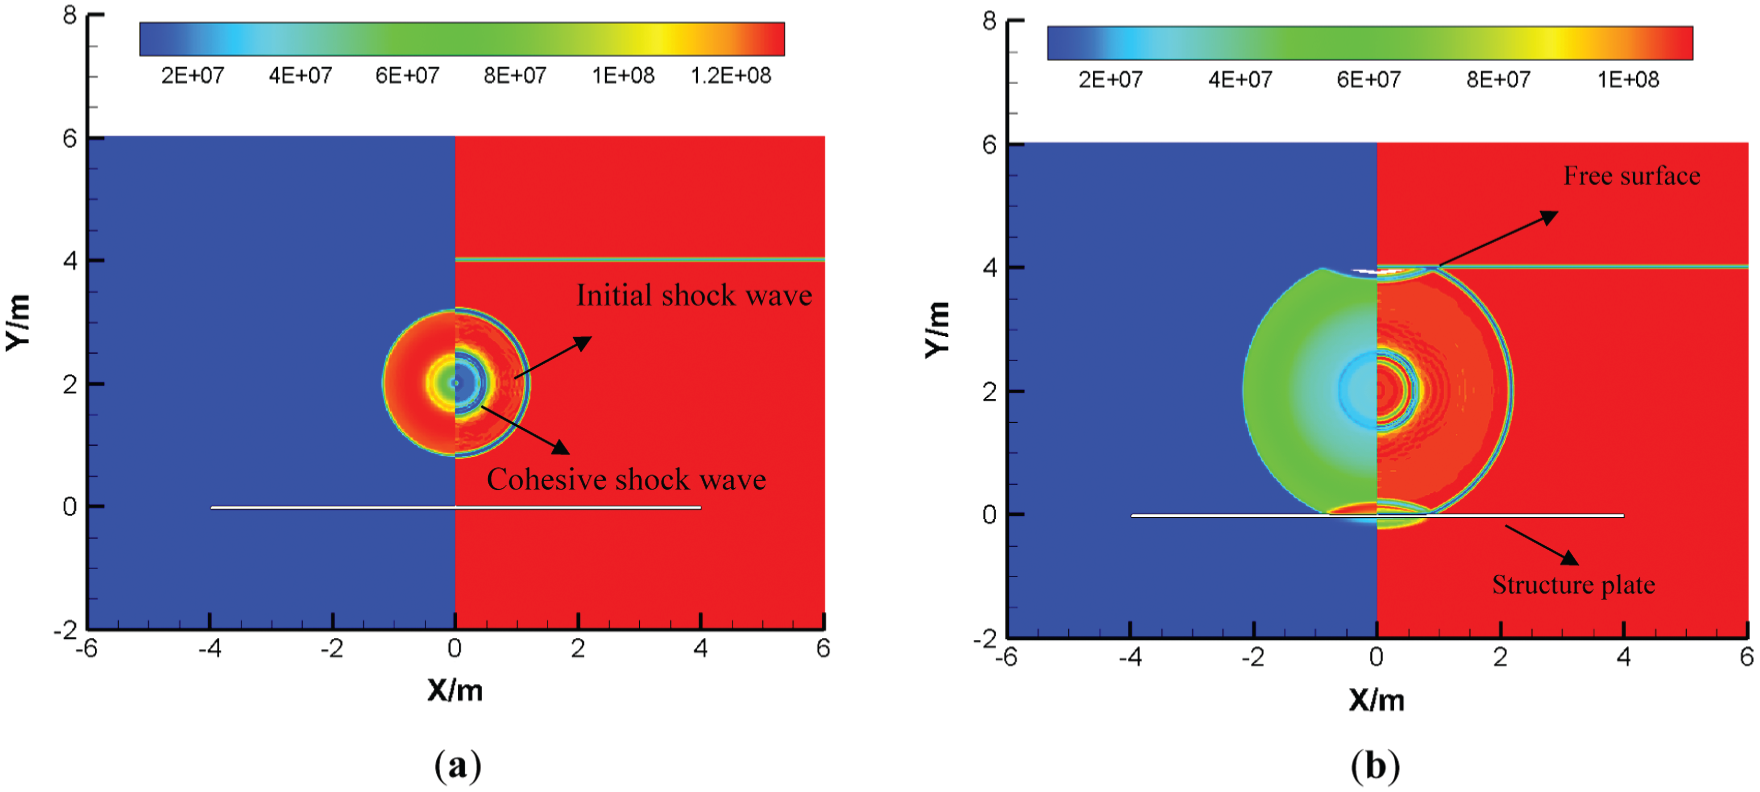

Figure 10: Reflection characteristic of shock wave between shallow-water elasticity plate and bubble, where the distance between the bubble and free surface  m (left is pressure distributions, unit: Pa; right is numerical schlieren images): (a) 0.0005 s; (b) 0.0011 s; (c) 0.00138 s; (d) 0.0018 s; (e) 0.00236 s; (f) 0.003 s
Fig. 11 shows the pressure curves of different gauging point when the initial distance between the bubble and free water surface is 2 m. Cavitation could not occur when the gauging point is 1.0 m to 0.9 m from the free water surface, while cavitation would occur when the gauging point is 0.1 m to 0.8 m from the free water. As the gauging point is closer to the free water surface, the cavitation time is longer. According to the analysis, the area closer to the bubble is less possible to occur cavitation, and the reflected shock wave by elasticity plate acts on the free surface, the reflected rarefaction would cause secondary cavitation in the fluid field.

Figure 11: Pressure with time at different measuring points when the distance between the bubble and free surface is 2.0 m
4.2 Double-Layer Elasticity Plates with a Circular Crevasse
In some times, the double-layer elasticity plates may undergo the near-field explosion or contact explosion, and the outer elasticity plate would appear crevasse because of suffering the shock-wave loading. Thus, this section would pay attention to the pressure characteristic between the double-layer with a circular crevasse structure and the detonation gases. The fluid field and structure are set as following: The length of the elasticity plate is [ −4 m, 4 m]; the thickness both of upper elasticity plate and lower elasticity plate is  m; the radius of a crevasse of the upper elasticity plate is 0.4 m; the distance between two plates is 0.6 m; the distance between bubble center and the upper surface of the elasticity plate is set as 2 m.
Fig. 12a has shown that the initial shock wave is about to reach the upper crevasse elasticity plate. When the shock wave acts on the upper crevasse elasticity plate, one part of the pressure would be reflected in the direction of the bubble and symmetry axis. Some of the pressure transmits the bottom surface of the upper elasticity plate because of the elasticity plate movement; the other pressure would form a diffraction shock wave when passing the crevasse, as shown in Fig. 12b. Then, the reflected shock wave acts on the crevasse boundary of the upper elasticity plate; meanwhile, the diffraction shock wave spread along the bottom surface of the upper elasticity plate, and the other part continues to spread towards the lower elasticity plate. When the diffraction shock wave acts on the lower elasticity plate, one part will be reflected in the direction of the crevasse in the form of the shock wave, and the other part would transmit to the elasticity plate in the original propagation direction, as shown in Fig. 12c. When the diffraction wave is reflected by the lower elasticity plate acted on the upper crevasse elasticity plate, on part would continue to propagate upward through the crevasse, and the other part would be transmitted to another side of the elasticity plate, as shown in Figs. 12d–12e. When the shock wave reflected by the upper elasticity plate acted on the bubble surface, one part would transmit to the inside of the bubble, and the other part would be reflected in the direction of a crevasse in the form of a rarefaction wave, as shown Fig. 12f.

Figure 12: Reflection characteristic of shock wave between double break the elasticity plate and bubble surface, where the distance between the bubble and the upper surface of elasticity plate  m (left is pressure distributions, unit: Pa; right is numerical schlieren images): (a) 0.001 s; (b) 0.00116 s; (c) 0.00144 s; (d) 0.00176 s; (e) 0.00248 s; (f) 0.00276 s
Fig. 13 gives the center pressure with the time history of the lower elasticity plate and the crevasse elasticity plate. There is an obvious contrast of pressure changing trend between the water-backed elasticity plate and the double layer crevasse elasticity plate structure. The pressure of the upper elasticity plate increases to a peak value of 104 MPa at time 0.001 s, while the peak pressure of the lower elasticity plate is 89.6 MPa because of the dissipation energy of pressure. The pressure of the water-backed elasticity plate changing over time is decreasing fairing while the pressure of the double-layer crevasse elasticity plate’s decreasing trend is oscillatory because of the bounced reflection of pressure between the two elasticity plates. In addition to the effect of the initial shock wave produced an initial peak pressure, there would appear a second pressure peak due to the bounced reflection.

Figure 13: Center pressure with the time of the upper break elasticity plate and lower elasticity plate
Fig. 14 shows the pressure distribution curves with the time history of the bottom surface of the upper crevasse elasticity plate. The diffraction shock wave generates at the left was larger than that of the transmission of a wavefront at  s, and then the pressure would gradually propagate to the right along with the elasticity plate. At
  s, the diffraction shock wave acts on the bottom surface of the upper elasticity plate, causing peak pressure, and then, the peak pressure propagates to the right along with the elasticity plate.

Figure 14: Pressure distributions along the lower surface of the upper break elasticity plate at different times
Fig. 15 has given the distributions along the upper surface of the lower elasticity plate at different times. The distribution law is similar to that on the lower surface of the upper elasticity plate. When the diffraction shock wave acts on the elasticity plate, a local pressure region appears and unload subsequently. When the upper elasticity plate reflects the shock wave acted on the lower elasticity plate, it would generate a high pressure again, and move to the right side gradually. According to the pressure distributions at time and space, the bounced reflection of the diffraction wave would cause a secondary impact with higher peak pressure on the elasticity plate.

Figure 15: Pressure distributions along the upper surface of the lower elasticity plate at different times
4.3 Double-Layer Elasticity Plates with a Circular Crevasse
When the shock wave acts on the outside surface, part of it reflects back to the fluid field in the form of the shock wave, and part of it is transmitted to the inside surface of the curved elasticity plate and locally produces cavitation. Besides, the movement of the reflected shock wave propagates towards the bubble surface; there is also a part of it propagating along the outside of the curved elasticity plate, as shown in Fig. 16a. With the transmitted shock wave and reflected shock wave propagating along the inside and outside surfaces, the cavitation area of the inside surface gradually expands and gradually moves toward the end of the curved elasticity plate, as shown in Fig. 16b. Subsequently, the cavitation area gradually collapsed under the action of transmitted shock waves, and some cavitation areas moved toward the central axis. At this time, the rarefaction waves reflected by the bubbles acted on the outside surface, and returned to the flow again in the form of rarefaction waves toward the bubble, as shown in Fig. 16c. Then, the pressure in the inside area of the curved elasticity plate gradually decreased, and cavitation appeared in a part of the area near the central axis of the inside surface, as shown in Fig. 16d. It can be seen that the curved elasticity plate is more prone.

Figure 16: Reflection characteristic of shock wave between the single curved elasticity plate and bubble surface, where the distance between the bubble and outside surface of curved elasticity plate  m (left is pressure distributions, unit: Pa; right is numerical schlieren images): (a) 0.00064 s; (b) 0.001; (c) 0.00136 s; (d) 0.00228
Fig. 17 shows the central pressure of the inside and outside surfaces with time. The pressure reaches the maximum value at the moment when the shock wave touches the outside surface, and then the pressure begins to unload. At  s, the pressure decreases slightly due to the action of the rarefaction wave. Due to the apparent oscillation of the center velocity of the outside surface, as shown in Fig. 18, there is a similar oscillation of the center pressure of the outside surface. The pressure transmitted to the inside of the curved elasticity plate did not reach the maximum value instantaneously like the pressure at the center of the outside surface at the beginning, but had a sweaty climbing process like the speed, and then reached the maximum. The reason for the difference between the pressures of the inside and outside surface elasticity plate is that the outside surface is suffered from the incident shock wave directly acting on the surface, so the pressure will initially have a step phenomenon similar to the incident shock wave. The pressure of the inside surface is generated by the velocity of the inside surface as the excitation source, So its trend with time is similar to the velocity of the inside surface, and the center velocity of the inside surface is shown in Fig. 15. After
  s, the central pressure of the inside surface is lower than the saturated steam pressure, while the central pressure of the outside surface is still above the saturated steam pressure because the center velocity of the inside surface is higher than the center velocity of the outside surface. The impact of the shock wave of the outside surface directly leads to a higher pressure at this location, and the weak rarefaction wave reflected at the bubble interface is not enough to reduce the pressure at this location below the saturated vapor pressure.

Figure 17: Pressure with time on the center of the inside and outside surface

Figure 18: Velocity with time on the center of the inside and outside surface
Figs. 19 and 20 show the pressure distribution along the inside and outside surfaces at different times. At first, the pressure in the central area of the inside surface is higher than the pressure at the end. Then, the pressure in the central area begins to decrease and gradually becomes smaller than the pressure at the end. Finally, a region near the center cavitation occurs. For the pressure of the outside surface, the shock wave acts on the central area to quickly unload, resulting in the end pressure being higher than the pressure in the central area for most of the subsequent time. The subsequent rarefaction wave accelerates the decreased pressure of the central area; however, the cavitation did not occur on the entire outside surface.

Figure 19: Pressure distribution along the inside surface

Figure 20: Pressure distribution along the outside surface
4.4 Double-Layer Curved Elasticity Plate
Ships, submarines, and other underwater structures can use a multi-cabin structure to protect the external shock waves from the internal equipment [10], this section will study the reflection characteristics of shock waves between the double-layer curved elasticity plate and the bubble surface. Fig. 21 shows the reflection characteristics of the shock wave between the double-layer curved elasticity plate and the bubble surface. The diameter of the outer curved elasticity plate is 1.26 m, and the thickness is 0.06 m; the diameter of the inner curved elasticity plate is 0.66 m, the elasticity plate thickness is 0.06 m. The initial parameters of the bubble and the flow field parameters are consistent with the working conditions in the previous section. The bubble acts on the outside of the double-layer curved elasticity plate. The initial center of the bubble is on the same axis as the head of the underwater vehicle and outside curved elasticity plate. The initial distance of the surface is 1.2 m.


Figure 21: Reflection characteristic of the shock wave on the double-curved elasticity plate and bubble surface, Where the distance between the bubble and outside surface  m (left is pressure distributions, unit: Pa; right is numerical schlieren images): (a) 0.00104 s; (b) 0.00148 s; (c) 0.00168 s; (d) 0.002 s; (e) 0.00212 s; (f) 0.00252 s
As shown in Fig. 21, when the shock wave generated by the bubble acts on the outside curved elasticity plate, part of it reflects the backflow field in the form of the shock wave and moves toward the direction of the bubble. The other part is also transmitted between the inside curved elasticity plate and the outside curved elasticity plate in the form of the shock wave. Subsequently, the transmitted shock wave acts on the lower surface of the inside layer curved elasticity plate, and reflection and transmission occur again in the form of a shock wave. At this time, a large area of cavitation occurs in the direction of the surface wavefront on the outside layer curved elasticity plate. A small area of cavitation appears on the surface wavefront direction on the inside layer curved elasticity plate, the shock wave reflected by the outside curved elasticity plate acts on the surface of the bubble, and begins to propagate the rarefaction wave toward the curved elasticity plate, as shown in Fig. 21a. When the rarefaction wave acts on the outside elasticity plate, it is reflected again in the form of rarefaction waves back to the flow field. As the pressure wave propagates toward the end, the cavitation areas on the upper surface of the inside curved elasticity plate and outside curved elasticity plate gradually move toward the end, as shown in Fig. 21b. Subsequently, the cavitation area near the end of the outside curved elasticity plate began to collapse, and the cavitation area near the end of the inside elasticity plate gradually expanded toward the central axis. At this time, between the double curved plates and between the outside curved elasticity plate and the surface of the bubble. After multiple reflections and transmissions, the pressure wave between them has become less obvious, as shown in Fig. 21c. Next, the cavitation area near the end of the upper surface of the inside layer curved elasticity plate also began to collapse, and a part of the surface of the inside layer curved elasticity plate near the central axis was lower than the saturated steam. Meanwhile, the pressure on the surface of the inside layer near the central axis is lower than the saturation vapor pressure, and cavitation occurs, as shown in Fig. 21d. Subsequently, the cavitation area on the upper surface of the inside layer curved elasticity plate gradually developed, and the entire semicircular area on the upper surface of the inside layer curved elasticity plate was covered by cavitation, as shown in Fig. 21e. Finally, due to the gradual decrease in pressure between the double-layer curved elasticity plates, cavitation also occurred in the area near the central axis of the outside elasticity plate surface, and cavitation also appeared on the lower surface of the inside curved elasticity plate, as shown in Fig. 21f.
Fig. 22 shows the central pressure of the upper and lower surfaces of the inside curved elasticity plate and outside curved elasticity plate with time. At  s, the central pressure of the lower surface of the outside layer curved elasticity plate appeared to be cut off phenomenon under the action of rarefaction waves. In the later period, due to the weak intensity of the pressure wave reflected back and forth between the bubble and the outside layer curved elasticity plate, there was no obvious local peak pressure or cut-off phenomenon. The shock wave transmitted between the double-layer curved elasticity plate reflects back and forth between the lower surface of the inside layer curved elasticity plate and the outside layer curved elasticity plate surface, resulting in multiple local peaks in the pressure on the lower surface of the inside layer curved elasticity plate and the upper surface of the outside layer curved elasticity plate, but the intensity is not strong. The intensity of the shock wave reaching the surface of the inside layer curved elasticity plate after reflection and transmission of the outside layer curved elasticity plate and the inside layer curved elasticity plate is minimal, which also means that the multi-cabin structure can be used to protect the internal equipment of underwater structures such as ships and submarines against the external shock wave impact. As to cavitation time, cavitation occurs and collapses twice on the upper surface of the inside layer curved elasticity plate, while the cavitation time on the upper surface of the outside curved layer elasticity plate and the lower surface of the inside layer curved elasticity plate is relatively long. Fig. 23 shows the central velocity of the upper and lower surfaces of both curved elasticity plates. Due to the high peak value and narrow width pulse of the shock wave acting on the lower surface of the outside layer, the speeds of the upper and lower surfaces of the outside layer curved elasticity plate appear to be significantly different for a long period. The pressure peak induced between the double-layer curved elasticity plates is much smaller than the incident shock wave, and the pulse width is wider, so the velocities of the upper and lower surfaces of the inside-layer curved elasticity plate are more consistent. Fig. 24 shows the curve of the plastic strain of the center of the upper and lower surfaces of the inside and outside curved elasticity plate with time. The plastic deformation gradually decreases from the outside layer to the inside layer curved elasticity plate-like with the shock wave.

Figure 22: Center pressure with time at different surfaces

Figure 23: Center velocity with time at different surfaces

Figure 24: Center plastic strain with time at different surfaces
In this work, a developed fluid-structure interaction numerical solver coupled RKDG-FEM method can effectively capture the strong discontinuous shock wave and solve the compressible multiphase flow and structure response. The level set method (LSM) and a ghost fluid method (GFM) were applied to deal with the material interface, besides the numerical model was validated by comparing with the analytical solution or publication [44] and show a good agreement, providing the validity of our method solving strong shock wave discontinuous problem. As the boundaries play an important role in pressure propagating and cavitation, and the pressure and cavitation characteristics are still not clear near different boundary structure surfaces. The main boundaries elasticity plate structures, including shallow-water single layer elasticity plate, double-layer with a circular crevasse, single-layer curved elasticity plate, and double-layer curved elasticity plate, are analyzed emphatically and discussed. The following conclusions can be drawn:
1. For shallow-water elasticity plates, when the incident shock wave acted on the free liquid surface, it would reflect fluid in the form of rarefaction waves. When the rarefaction wave acted on the detonation bubble, it is transmitted into the bubble and reflected the external of the bubble in the form of the shock wave. Excepted for the first shock wave ripple, the subsequent pressure reflected back and forth between detonation gases and the free surface, resulting in forming alternative ripples between rarefaction wave and shock wave, which was exactly the opposite of the ripple between the bubble and the bottom elasticity plate. When the distance between the bubble and the free surface reached a certain value, the rarefaction wave reflected from the free surface would induce cavitation in the fluid field. At the same time, after the shock wave reflected from the bottom elasticity plate acted on the free surface, the reflected rarefaction wave would induce cavitation again in the fluid field.
2. When shock wave acted on the double-layer elasticity plates with a circular crevasse, a diffractive shock wave was formed at the crevasse. The diffractive shock wave reflected back and forth between the upper and lower elasticity plates, which cause a secondary impaction with a high-pressure peak. Shock wave and rarefaction wave propagated back and forth in interlayer water. The superposition of the pressure waves caused the pressure distribution of the fluid field to be very complicated.
3. When the shock wave acts on the single-layer curved elasticity plate from the outside surface, cavitation is first generated in the direction of the wavefront of the inside surface of the curved elasticity plate, and then cavitation occurs in the central area of the inside surface; When the shock wave acts on the double-layer curved elasticity plates, the shock wave reflects and transmits through the inside curved elasticity plate and outside layer curved elasticity plate, the intensity gradually decreases from the outside layer curved elasticity plate to the inner curved layer elasticity plate, and the plastic deformation generated by the curved elasticity plate gradually decreases. The time of cavitation in different areas is different, first the upper surface of the inside layer elasticity plate, then the upper surface of the outside layer elasticity plate, then the lower surface of the inside layer elasticity plate, and finally, the lower surface of the outside layer elasticity plate. Thus, the multi-cabin structure can be designed to protect the equipment from shock waves impact.
Funding Statement: The authors sincerely thank the financial supported by the National Natural Science Foundation of China (No. 11602069 and No. 51779056), the Natural Science Foundation of Heilonjiang Province (No. E2017026).
Conflicts of Interest: The authors declare that they have no conflicts of interest to report regarding the present study.
1. Andrzej, G. (2012). Ship shock modeling of underwater explosion. Mechatronic Systems, Mechanics and Materials, 180, 288–296. DOI 10.4028/www.scientific.net/SSP.180.288. [Google Scholar] [CrossRef]
2. Kim, J. H., Jeon, B. Y., Jeon, J. H. (2008). Application of fluid-structure interaction technique for underwater explosion analysis of a submarine liquefied oxygen tank considering survivabilty. Omae 2008: Proceedings of the 27th International Conference on Offshore Mechanics and Arctic Engineering, vol. 2, pp. 979–986. DOI 10.1115/OMAE2008-58009. [Google Scholar] [CrossRef]
3. Kim, J. H., Shin, H. C. (2008). Application of the ALE technique for underwater explosion analysis of a submarine liquefied oxygen tank. Ocean Engineering, 35(8–9), 812–822. DOI 10.1016/j.oceaneng.2008.01.019. [Google Scholar] [CrossRef]
4. Ming, F. R., Zhang, A. M., Xue, Y. Z., Wang, S. F. (2016). Damage characteristics of ship structures subjected to shockwaves of underwater contact explosions. Ocean Engineering, 117, 359–382. DOI 10.1016/j.oceaneng.2016.03.040. [Google Scholar] [CrossRef]
5. Ramajeyathilagam, K., Vendhan, C. P. (2003). Underwater explosion damage of ship hull panels. Defence Science Journal, 53(4), 393–402. DOI 10.14429/dsj.53.2285. [Google Scholar] [CrossRef]
6. Zhang, Y. K., Gao, X. (2017). Research on the ship local structure damage subjected to underwater explosion. Proceedings of 29th Chinese Control and Decision Conference, pp. 6113–6117. Chongqing, China. [Google Scholar]
7. Zhang, Z., Sun, L., Yao, X., Cao, X. (2015). Smoothed particle hydrodynamics simulation of the submarine structure subjected to a contact underwater explosion. Combustion, Explosion, and Shock Waves, 51(4), 502–510. DOI 10.1134/S0010508215040164. [Google Scholar] [CrossRef]
8. Zong, Z., Zhao, Y. J., Li, H. T. (2013). A numerical study of whole ship structural damage resulting from close-in underwater explosion shock. Marine Structures, 31, 24–43. DOI 10.1016/j.marstruc.2013.01.004. [Google Scholar] [CrossRef]
9. Schiffer, A., Tagarielli, V. L. (2015). The response of circular composite plates to underwater blast: Experiments and modelling. Journal of Fluids and Structures, 52, 130–144. DOI 10.1016/j.jfluidstructs.2014.10.009. [Google Scholar] [CrossRef]
10. Liu, G. Z., Liu, J. H., Wang, J., Pan, J. Q., Mao, H. B. (2017). A numerical method for double-plated structure completely filled with liquid subjected to underwater explosion. Marine Structures, 53, 164–180. DOI 10.1016/j.marstruc.2017.02.004. [Google Scholar] [CrossRef]
11. Gannon, L. (2019). Simulation of underwater explosions in close-proximity to a submerged cylinder and a free-surface or rigid boundary. Journal of Fluids and Structures, 87, 189–205. DOI 10.1016/j.jfluidstructs.2019.03.019. [Google Scholar] [CrossRef]
12. Liu, Y. L., Zhang, A. M., Tian, Z. L., Wang, S. P. (2018). Numerical investigation on global responses of surface ship subjected to underwater explosion in waves. Ocean Engineering, 161, 277–290. DOI 10.1016/j.oceaneng.2018.05.013. [Google Scholar] [CrossRef]
13. Zhang, Z. F., Wang, C., Zhang, A. M., Silberschmidt, V. V., Wang, L. K. (2019). SPH-BEM simulation of underwater explosion and bubble dynamics near rigid wall. Science China-Technological Sciences, 62(7), 1082–1093. DOI 10.1007/s11431-018-9420-2. [Google Scholar] [CrossRef]
14. Jin, Z. Y., Yin, C. Y., Chen, Y., Hua, H. X. (2016). Simulations of the response of coated circular plates subjected to near-field underwater explosion using RKDG-FEM. Proceedings of the Asme 35th International Conference on Ocean, Offshore and Arctic Engineering, pp. 3. Busan, South Korea. [Google Scholar]
15. Kadioglu, S. Y., Sussman, M. (2008). Adaptive solution techniques for simulating underwater explosions and implosions. Journal of Computational Physics, 227(3), 2083–2104. DOI 10.1016/j.jcp.2007.10.019. [Google Scholar] [CrossRef]
16. Pishevar, A. R., Amirifar, R. (2010). An adaptive ALE method for underwater explosion simulations including cavitation. Shock Waves, 20(5), 425–439. DOI 10.1007/s00193-010-0275-x. [Google Scholar] [CrossRef]
17. Petrov, N., Schmidt, A. (2013). Non-equilibrium bubble nucleation in underwater explosion. Proceedings of 11th International Conference of Numerical Analysis and Applied Mathematics, Greece, vol. 1558, pp. 1046–1049. DOI 10.1063/1.4825685. [Google Scholar] [CrossRef]
18. Miller, S. T., Jasak, H., Boger, D. A., Paterson, E. G., Nedungadi, A. (2013). A pressure-based, compressible, two-phase flow finite volume method for underwater explosions. Computers and Fluids, 87, 132–143. DOI 10.1016/j.compfluid.2013.04.002. [Google Scholar] [CrossRef]
19. Wang, G. H., Zhang, S. R., Yu, M., Li, H. B., Kong, Y. (2014). Investigation of the shock wave propagation characteristics and cavitation effects of underwater explosion near boundaries. Applied Ocean Research, 46, 40–53. DOI 10.1016/j.apor.2014.02.003. [Google Scholar] [CrossRef]
20. Zhang, Z. F., Wang, C., Wang, L. K., Zhang, A. M., Silberschmidt, V. V. (2018). Underwater explosion of cylindrical charge near plates: Analysis of pressure characteristics and cavitation effects. International Journal of Impact Engineering, 121, 91–105. DOI 10.1016/j.ijimpeng.2018.06.009. [Google Scholar] [CrossRef]
21. Meng, Z. F., Cao, X. Y., Ming, F. R., Zhang, A. M., Wang, B. (2019). Study on the pressure characteristics of shock wave propagating across multilayer structures during underwater explosion. Shock and Vibration, 2019(2), 1–19. DOI 10.1155/2019/9026214. [Google Scholar] [CrossRef]
22. Deng, X. L., Li, M. J. (2018). Simulating compressible two-medium flows with sharp-interface adaptive runge-kutta discontinuous Galerkin methods. Journal of Scientific Computing, 74(3), 1347–1368. DOI 10.1007/s10915-017-0511-y. [Google Scholar] [CrossRef]
23. Jin, Z. Y., Yin, C. Y., Chen, Y., Hua, H. X. (2017). Coupling Runge–Kutta discontinuous Galerkin method to finite element method for compressible multi-phase flow interacting with a deformable sandwich structure. Ocean Engineering, 130, 597–610. DOI 10.1016/j.oceaneng.2016.12.013. [Google Scholar] [CrossRef]
24. Jin, Z. Y., Yin, C. Y., Chen, Y., Hua, H. X. (2019). Dynamics of an underwater explosion bubble near a sandwich structure. Journal of Fluids and Structures, 86, 247–265. DOI 10.1016/j.jfluidstructs.2019.02.022. [Google Scholar] [CrossRef]
25. Park, J. (2018). Application of the Runge Kutta Discontinuous Galerkin-Direct Ghost Fluid Method to internal explosion inside a water-filled tube. International Journal of Naval Architecture and Ocean Engineering, 11(1), 572–583. DOI 10.1016/j.ijnaoe.2018.10.002. [Google Scholar] [CrossRef]
26. Qiu, J. X., Liu, T. G., Khoo, B. C. (2007). Runge–Kutta discontinuous Galerkin methods for compressible two-medium flow simulations: One-dimensional case. Journal of Computational Physics, 222(1), 353–373. DOI 10.1016/j.jcp.2006.07.023. [Google Scholar] [CrossRef]
27. Wang, L. K., Zhang, Z. F., Wang, S. P. (2016). Pressure characteristics of bubble collapse near a rigid wall in compressible fluid. Applied Ocean Research, 59, 183–192. DOI 10.1016/j.apor.2016.06.003. [Google Scholar] [CrossRef]
28. Yu, J., Pan, J. Q., Wang, H. K., Mao, H. B. (2015). Application of compressible multi-component flow in underwater explosion problems. Procedia Engineering, 126, 339–343. DOI 10.1016/j.proeng.2015.11.198. [Google Scholar] [CrossRef]
29. Zhang, A. M., Yang, W. S., Yao, X. L. (2012). Review numerical simulation of underwater contact explosion. Applied Ocean Research, 34, 10–20. DOI 10.1016/j.apor.2011.07.009. [Google Scholar] [CrossRef]
30. Wang, L., Chen, H., Ye, X., Yao, X. (2015). Study on load characteristics of underwater explosion using RKDG-LS-DGF and BEM. Shock and Vibration, 2015(200), 1–10. DOI 10.1155/2015/165252. [Google Scholar] [CrossRef]
31. Chen, E. Y., Ma, D. W., Le, G. G., Wang, K., Zhao, G. P. (2008). Numerical simulation of highly underexpanded axisymmetric jet with Runge–Kutta discontinuous Galerkin finite element method. Journal of Hydrodynamics, 20(5), 617–623. DOI 10.1016/S1001-6058(08)60103-1. [Google Scholar] [CrossRef]
32. Zhao, J., Tang, H. Z. (2013). Runge-Kutta discontinuous Galerkin methods with WENO limiter for the special relativistic hydrodynamics. Journal of Computational Physics, 242, 138–168. DOI 10.1016/j.jcp.2013.02.018. [Google Scholar] [CrossRef]
33. Xie, W. F., Liu, Z. K., Young, Y. L. (2009). Application of a coupled Eulerian-Lagrangian method to simulate interactions between deformable composite structures and compressible multiphase flow. International Journal For Numerical Methods in Engineering, 80(12), 1497–1519. DOI 10.1002/nme.2667. [Google Scholar] [CrossRef]
34. Peng, Y., Deng, W. Y., Xu, P., Yao, S. G. (2015). Study on the collision performance of a composite energy-absorbing structure for subway vehicles. Thin-Walled Structures, 94, 663–672. DOI 10.1016/j.tws.2015.05.016. [Google Scholar] [CrossRef]
35. Hibbitt, K., Sorensen. (2001). ABAQUS/Explicit: User’s manual. Hibbitt, Karlsson and Sorenson Incorporated. [Google Scholar]
36. Osher, S., Sethian, J. A. (1988). Fronts propagating with curvature-dependent speed: Algorithms based on Hamilton–Jacobi formulations. Journal of Computational Physics, 79(1), 12–49. DOI 10.1016/0021-9991(88)90002-2. [Google Scholar] [CrossRef]
37. Fedkiw, R. P., Aslam, T., Merriman, B., Osher, S. (1999). A non-oscillatory eulerian approach to interfaces in multimaterial flows (the ghost fluid method). Journal of Computational Physics, 152(2), 457–492. DOI 10.1006/jcph.1999.6236. [Google Scholar] [CrossRef]
38. Liu, T. G., Khoo, B. C., Yeo, K. S. (2003). Ghost fluid method for strong shock impacting on material interface. Journal of Computational Physics, 190(2), 651–681. DOI 10.1016/S0021-9991(03)00301-2. [Google Scholar] [CrossRef]
39. Tang, H. Z., Warnecke, G. (2005). A Runge–Kutta discontinuous Galerkin method for the Euler equations. Computers and Fluids, 34(3), 375–398. DOI 10.1016/j.compfluid.2004.01.004. [Google Scholar] [CrossRef]
40. Osher, S., Fedkiw, R. P. (2001). Level set methods: An overview and some recent results. Journal of Computational Physics, 169(2), 463–502. DOI 10.1006/jcph.2000.6636. [Google Scholar] [CrossRef]
41. Liu, T. G., Khoo, B. C., Wang, C. W. (2005). The ghost fluid method for compressible gas-water simulation. Journal of Computational Physics, 204(1), 193–221. DOI 10.1016/j.jcp.2004.10.012. [Google Scholar] [CrossRef]
42. Shyue, K. M. (1998). An efficient shock-capturing algorithm for compressible multicomponent problems. Journal of Computational Physics, 142(1), 208–242. DOI 10.1006/jcph.1998.5930. [Google Scholar] [CrossRef]
43. Liu, T. G., Khoo, B. C., Xie, W. F. (2004). Isentropic one-fluid modelling of unsteady cavitating flow. Journal of Computational Physics, 201(1), 80–108. DOI 10.1016/j.jcp.2004.05.010. [Google Scholar] [CrossRef]
44. Xie, W. F., Liu, T. G., Khoo, B. C. (2006). Application of a one-fluid model for large scale homogeneous unsteady cavitation: The modified Schmidt model. Computers and Fluids, 35(10), 1177–1192. DOI 10.1016/j.compfluid.2005.05.006. [Google Scholar] [CrossRef]
 | This work is licensed under a Creative Commons Attribution 4.0 International License, which permits unrestricted use, distribution, and reproduction in any medium, provided the original work is properly cited. |