DOI: 10.32604/cmes.2021.014176
ARTICLE
School of Energy and Power, Dalian University of Technology, Dalian, China
*Corresponding Author: Min Zhang. Email: modest_zm@dlut.edu.cn
Received: 07 September 2020; Accepted: 23 November 2020
Abstract: For a radial inflow turbine (RIT), leakage flow in impeller backface cavity has critical impacts on aerodynamic performance of the RIT and axial force acting on the RIT impeller. In order to control this leakage flow, different types of labyrinth seals are numerically studied in this paper based on a supercritical carbon dioxide (S-CO2) RIT. The effects of seal clearance and cavity outlet pressure are first analyzed, and the impacts of seal design parameters, including height, number and shape of seal teeth, are evaluated. Results indicate that adding labyrinth seal can improve cavity pressure and hence adequately inhibits leakage flow. Decreasing the seal clearance and increasing the height of seal teeth are beneficial to improve sealing performance, and the same effect can be obtained by increasing the number of seal teeth. Meanwhile, employing seals can reduce leakage loss and improve RIT efficiency under a specific range of cavity outlet pressure. Finally, the influences of seal types on the flow field in seal cavity are numerically analyzed, and results demonstrate that isosceles trapezoidal type of seal cavity has better sealing performance than triangular, rectangular and right-angled trapezoidal seal cavities.
Keywords: Supercritical carbon dioxide; radial inflow turbine; impeller backface cavity; labyrinth seal; CFD simulation
Supercritical carbon dioxide (S-CO2) Brayton cycle may be one of the most promising approaches in future power generation systems [1]. It has higher thermal efficiency, smaller size and better environmental friendliness when compared to traditional steam Rankine and air Brayton cycles. Despite these superiorities, many challenges associated with turbomachinery designs, cycle layouts, heat source and exchanger arrangements and so on need to be overcome for its areal and wide application [2].
Similar to other turbomachinery plants, the S-CO2 power system is equipped with a turbine to generate the work output. The turbine is generally designed in a radial inflow type for small scale applications, and its performance is critical to S-CO2 cycle efficiency [3]. Due to this, improving radial inflow turbine (RIT) performance is one of the major topics in both academic researches and industrial practices. Many institutions such as Sandia National Laboratory (SNL) [4,5], Bechtel Marine Propulsion Corporation [6,7] and Nuclear Power Institute of China [8] have investigated RIT performance through experiments. Other researchers, e.g., Zhou et al. [9,10] and Unglaube et al. [11] have conducted theoretical analyses or numerical simulations to clarify the flow mechanism in S-CO2 RIT.
There are three configurations of RIT impellers, namely closed, semi-open and open types. For a semi-open impeller, a backface cavity duct is connected with it. Therefore, there is a clearance between impeller backface and turbine disc. This backface cavity [12] is generally full with leakage flow that is introduced from the compressor outlet due to the pressure difference (see Fig. 1 which is reproduced from Verstraete et al. [13]). This not only induces aerodynamic loss but also leads to unbalanced axial force on the impeller. Hence, designing seal structures is necessary to control leakage flow and ensure a safe operation for RITs.
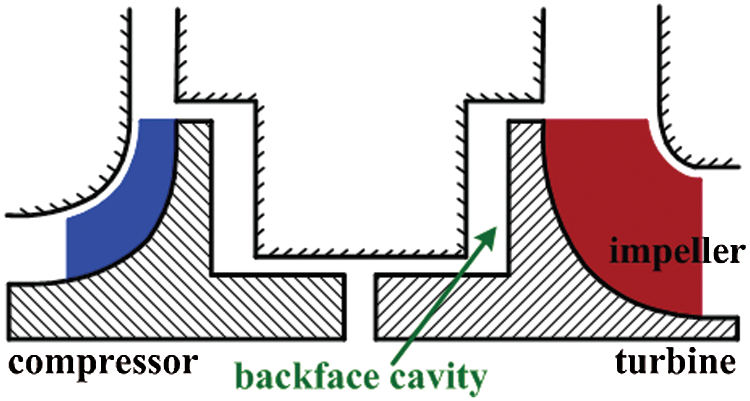
Figure 1: Schematic diagram of backface cavity of semi-open impeller [13]
To the knowledge of the authors, there is little study in the open literature investigating backface cavity flow [14], but seal technique is one of hot research topics. A well established and widely used structure is labyrinth seal [15–17], which is a non-contact and clearance seal that can rub against solid walls. Labyrinth seals have advantages of good sealing effectiveness, simple structure and reliable operation, and are suitable for high temperature, high pressure and high-speed turbine components. The mechanism of labyrinth seals to control leakage flow is ascribed to a throttling effect when leakage crosses the clearance between seal teeth and interface wall, and energy dissipation is produced when leakage flow enters sequential seal cavities. A comprehensive overview of labyrinth seals in steam and gas turbines can be referred to Chupp et al. [18].
Yucel et al. [19] proposed an analytical method to calculate leakage mass flow rate and associated pressure distribution in a labyrinth seal cavity, and got results that had good agreements with numerical and experimental data. Bariaud et al. [20] designed a labyrinth seal for the rotating parts of a turbine, and experimentally proved that their designed seal configuration had a good sealing performance. Li et al. [21] investigated the effect of revolution speed on the performance of a staggered labyrinth seal. They pointed out that when the ratio of circumferential to axial through flow velocity (U/Cax) was lower than 1.0 (this value was the limitation of their experimental setup), revolution speed had negligible impacts on seal leakage flow. However, Paolillo et al. [22] got a conclusion via experiment that when U/Cax was larger than 5.0, employing seals could reduce leakage mass flow rate by more than 20%. During the aerodynamic design process for the impeller backface of an S-CO2 RIT, Ma et al. [14] proposed a pump-out vane to balance the axial force on the impeller. Their numerical simulation results indicated that compared to a baseline backface cavity, the designed one reduced the impeller axial force and improved the isentropic efficiency of the RIT stage by 58% and 2.5% respectively.
According to above literature review, it is found that labyrinth seals have advantageous impacts on RIT performance. However, there is little research to date investigating labyrinth seal effectiveness for S-CO2 RITs. Due to this, based on an S-CO2 RIT previously designed by the authors [23], this paper is intended to design a seal geometry for its impeller backface cavity. The effects of different seal design and operation parameters, i.e., seal clearance, height, number and shape of seal teeth, and cavity outlet pressure, are studied. The purpose is to get a labyrinth seal geometry that can not only reduce leakage mass flow rate but also decrease the axial force acting on impeller backface cavity.
2 The Studied S-CO RIT and Seal Geometry
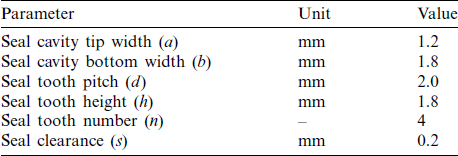
Previously, a MW-class S-CO2 RIT was designed and optimized by the authors [23] using an in-house one-dimensional aero-thermodynamic design code [24], and its typical operating parameters are listed in Tab. 1. Based on the impeller backface of this RIT, labyrinth seals are constructed, as illustrated in Fig. 2, where a two-dimensional schematic diagram of the seal is also displayed. Parameters a, b, d and h represent the tip width, bottom width, pitch and height of seal cavities respectively, while s is leakage clearance [25]. Their values can determine the shape of seal teeth or seal cavities. Impacts of these design parameters and seal teeth number (n) on sealing performance are investigated in this article. In addition, a reference seal structure is constructed as datum case to compare performance of different seal configurations, and its geometrical parameters are listed in Tab. 2.
Table 1: Operating parameters of the designed RIT
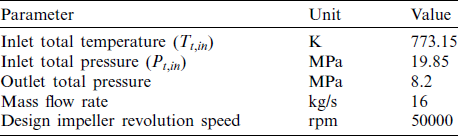
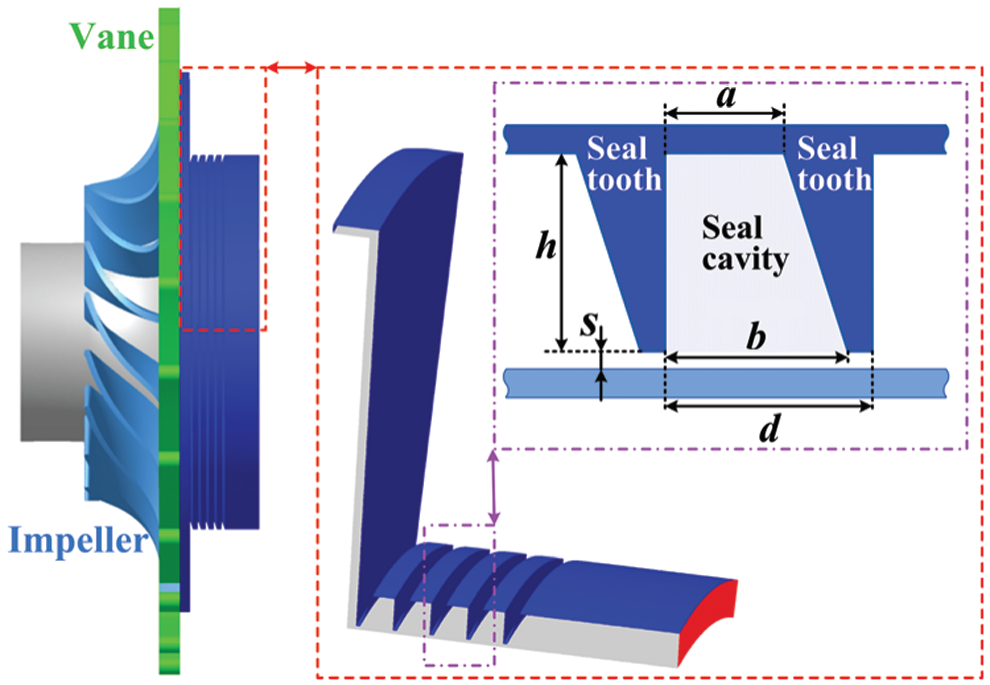
Figure 2: Schematic diagram of the RIT and labyrinth seals
Table 2: Geometric parameters of the datum labyrinth seal
Numerical simulations based on Computation Fluid Dynamic (CFD) technique are conducted to investigate the impact of labyrinth seals on the RIT performance. The commercial software Numeca [26] is used, and details of the numerical setup are described below.
3.1 Computational Domain and Grids
Fig. 3 presents the meridional sketch of the computational domain, which is composed of the flow passage of vane and impeller, and the duct of impeller backface cavity. To reduce computational cost, only one single-passage is constructed to model the RIT. The Numeca/AutoGrid 5 module is used to generate a structured mesh, and details of the mesh are also illustrated in Fig. 3. The total number of computational grids is determined after a mesh-independence analysis, which result will be shown in Fig. 4.
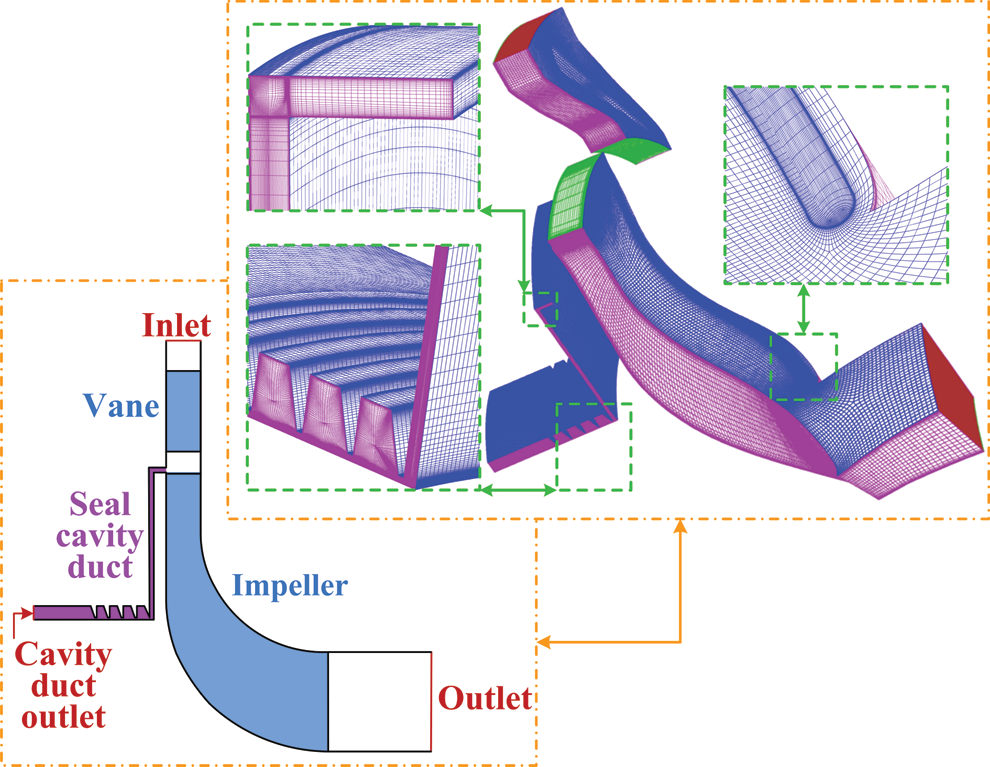
Figure 3: Computational domain of the RIT and details of the mesh
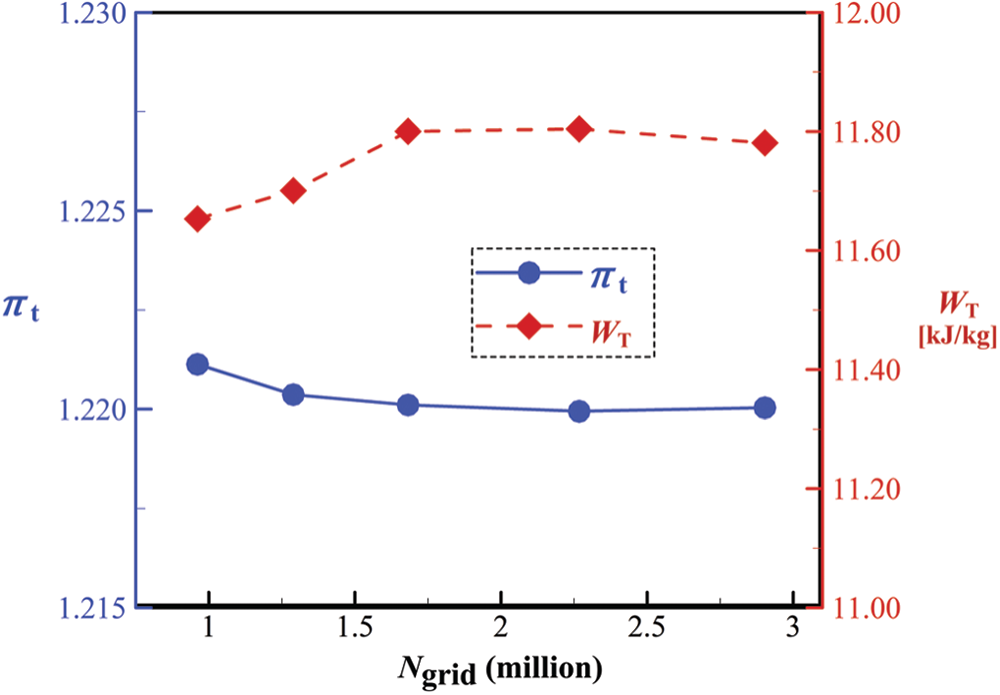
Figure 4: Predicted total pressure ratio and specific output work of the SNL RIT
Flow in the RIT is governed by the Navier–Stokes Equations, which can be expressed as:
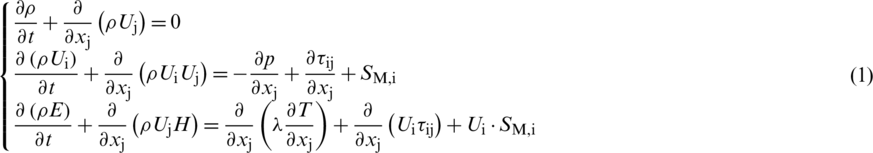
where U, E, H,  and
and  are density, velocity, total energy, total enthalpy, fluid density and thermal conductivity respectively, SM, i contains Coriolis and centrifugal forces when solving the equation in rotating frame, and
  is the shear stress tensor, which is defined for Newtonian fluid as:

where  is dynamic molecular viscosity. Direct solution of Eq. (1) needs huge computation and time cost, so Reynolds-Averaged Navier–Stokes (RANS) equations are solved to model flow in the RIT. Therefore, Eq. (1) is changed to:
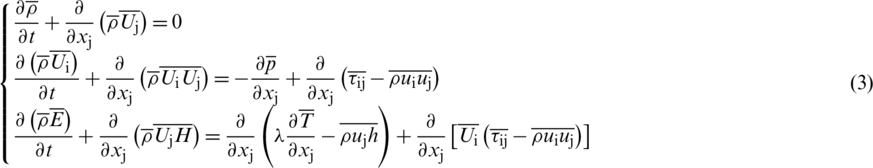
where u and h are instantaneous velocity and enthalpy respectively, and other parameters are time averaged value of flow quantities. In order to evaluate the Reynolds stress and turbulent heat diffusion terms, i.e.,  and
and  in Eq. (3), the Boussinesq’s assumption is used, i.e.,


where  is turbulent viscosity, Prt is turbulent Prandtl number. For turbulent flow, choosing an appropriate turbulence model is important to accurately calculate
  [27]. Therefore, the Spallart–Allmaras turbulence model is employed due to its good estimation of boundary layer flow [28]. Based on this, when generating the computational grid in Fig. 3, and the height of the grid cells adjacent to solid walls (ywall) is about 0.001 mm to make y+ below 10.
Total pressure (Pt, in) and total temperature (Tt, in) are specified at the mainstream inlet, where flow direction and turbulent viscosity are also defined. At the mainstream outlet, static pressure (Ps, out) is defined, and the radial equilibrium equation is used. Also, an average static pressure value (Pc, out) is set at the cavity duct outlet, and Pc, out is determined according to the design leakage mass flow rate [23]. The effect of Pc, out on seal performance is investigated in this study. In addition, all solid walls are no-slip and adiabatic. To calculate thermodynamic properties of S-CO2, the TabGen tool [26] is employed to generate a physical property table for CFD calculations.
To solve the governing equation defined in Eq. (3), a cell centered control volume approach is used based on the computational grid shown in Fig. 3, and central-difference scheme with the Jameson type of artificial dissipation is adopted for spatial discretization. An explicit four-order Runge–Kutta scheme is employed for temporal discretization in the current steady-state simulation, and an implicit residual smoothing technique is combined. The CFL number is set to 3.0 for all simulation cases. Moreover, a multigird strategy is adopted to accelerate convergence of the solution.
Two experimental S-CO2 configurations in the open literature are adopted here to validate the prediction accuracy of the CFD solver. The first case is an RIT from Sandia National Laboratories (SNL) and Barber–Nichols Incorporated (BNI) [29], and its test data at one working point is utilized here. A single passage of the SNL RIT is modelled and similar numerical setups to those in Sections 3.1 and 3.2 are arranged. Grids with different node numbers (Ngrid) are generated to study the effect of mesh density. Predicted total pressure ratio ( ) and specific output work (WT) of the SNL RIT are shown in Fig. 4. It can be observed when Ngrid is larger than 2 million, variations in both
  and WT are tiny. Meanwhile, compared to experimental data, i.e.,
 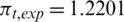 and WT, exp = 11.8032, predicted errors in
  and WT are only 1.41% and 2.10% respectively. Therefore, the level of Ngrid = 3 million is used as a standard for generating computational mesh for the studied RIT with different seal geometries.
The second configuration is an S-CO2 annular orifice tested by Kim et al. [30]. A two-dimensional axisymmetric plane of the test structure is plotted in Fig. 5. Measured total temperature (Tt, in = 319 K) and total pressure (Pt, in = 10 MPa) are defined at inlet, while static pressure (Pout) is specified at outlet. Value of Pout is determined by tested pressure ratios (Pt, in /Pout) in experiments. Fig. 6 compares predicted and measured mass flow rates under different pressure ratios (PR) of outlet pressure to inlet total pressure. When PR is less than 0.74, numerical calculation results are nearly the same as experimental data, while when PR is greater than 0.74, predicted values are a bit higher than measured results. The maximum relative error is about 9.0%, and this occurs at PR being about 0.85. Despite this, numerical results have a generally good agreement with experimental data. This proves that the CFD method employed in this paper can accurately evaluate performance of S-CO2 configurations. Therefore, the effects of labyrinth seals are analyzed below based on numerical calculations of the studied RIT.
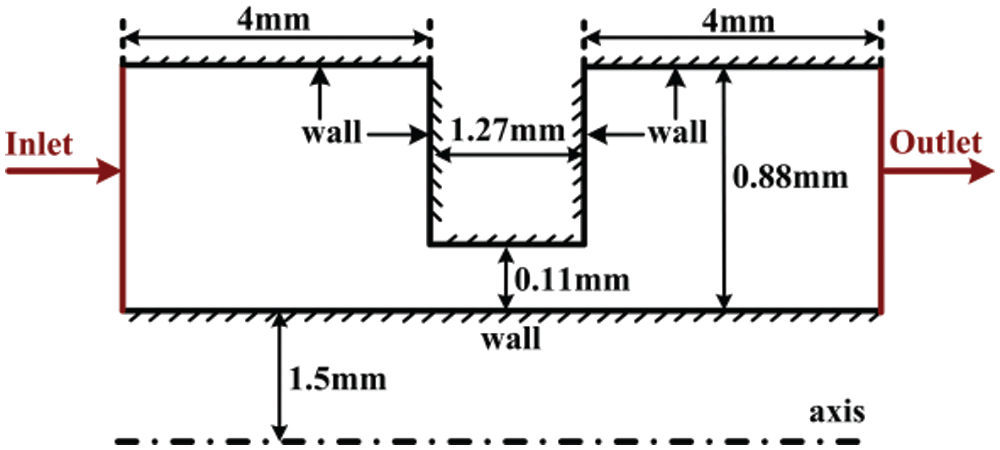
Figure 5: Front view of the annular orifice
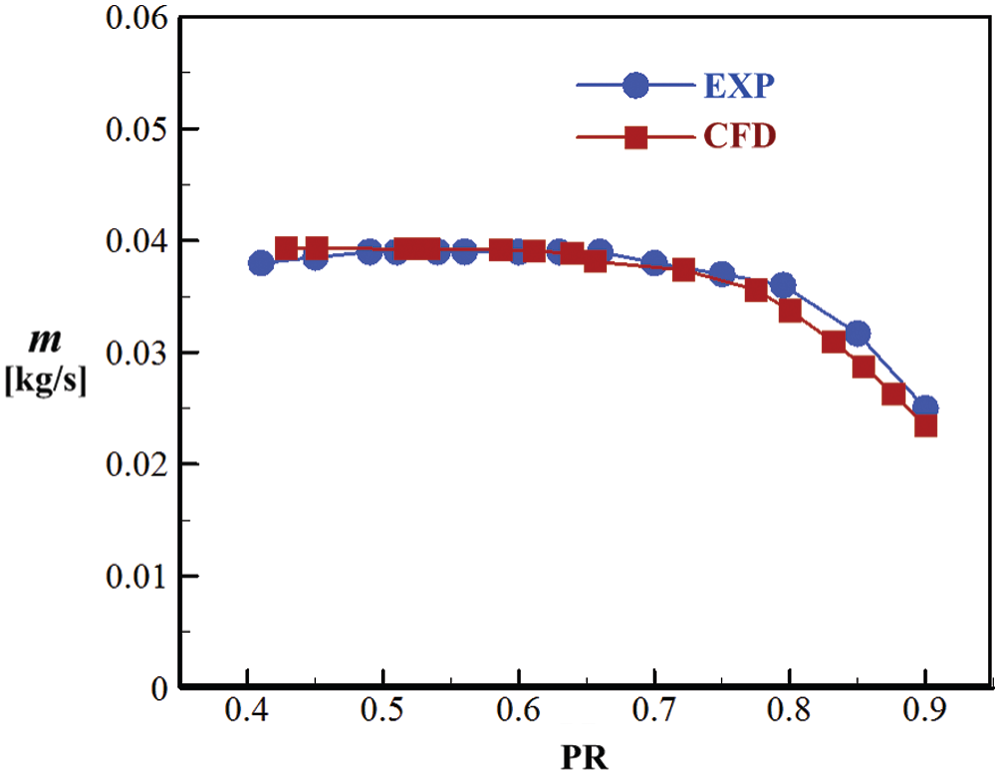
Figure 6: Predicted and measured mass flow rates of the S-CO2 annular orifice
4.1 Axial Force and Leakage Mass Flow Rate
The primary goal of using labyrinth seals is to reduce leakage mass flow rate (mL), which is defined as the calculated mass flow rate at cavity duct outlet in Fig. 3. Another major concern for the RIT is that its impeller endures higher axial force compared to gas turbine or steam turbine rotors under similar output power. Hence, accurate estimation of the axial force is of great significance for lengthening the service life of RITs.
Generally, the axial force is related to pressure distribution on impeller backface cavity walls. Japikse [31] pointed out that pressure in impeller backface cavities can be calculated by assuming a constant relative total pressure across the seal cavity passage. However, as illustrated in Fig. 7, relative total pressure has an obvious change from the inlet to the outlet of the impeller backface cavity. To tackle this issue, pressure is integrated over solid walls of impeller and its backface cavity to calculate the total axial force (Fax), so formulation of Fax is:

where FT1 is the axial force acting on turbine outlet, FT2 is the axial force on impeller blade and hub walls, and F2 is that on impeller backface cavity walls. Schematic diagram of each force is displayed in Fig. 8.
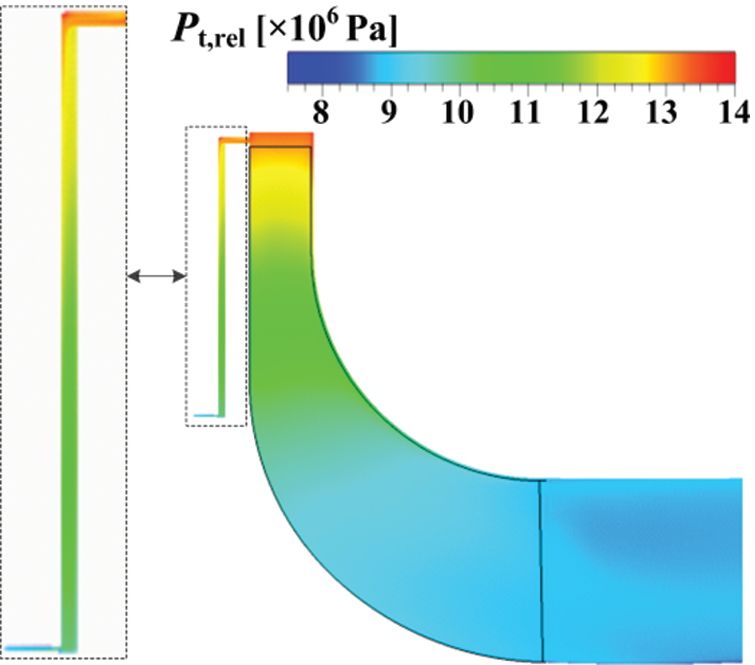
Figure 7: Contours of relative total pressure on the meridional plane of the RIT
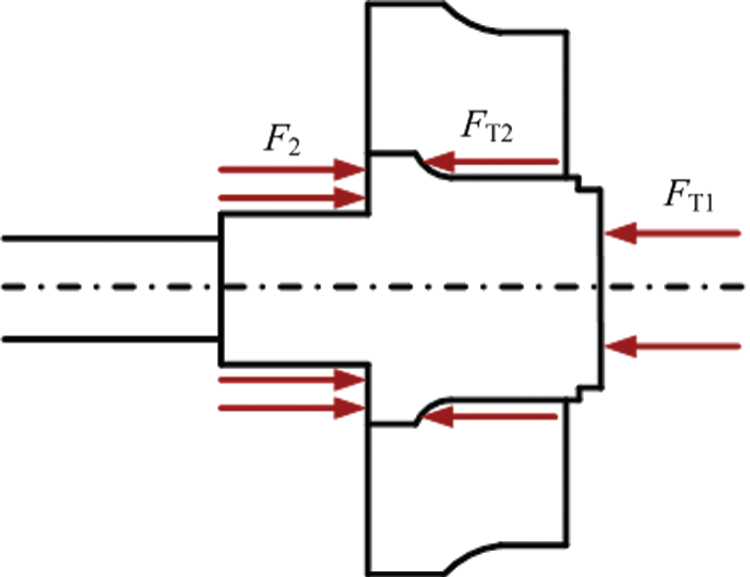
Figure 8: Schematic diagram of axial forces
4.2 Effects of Labyrinth Seal and Seal Outlet Pressure
In order to demonstrate impacts of the labyrinth seal, Figs. 9 and 10 compare Fax, mL, efficiency ( ) and expansion ratio (
 ) of the RIT with and without labyrinth seal respectively. Variable
  and
and  are defined as [32]:


where ht, in and ht, out are total enthalpy at inlet and outlet, ht, s, out is outlet total enthalpy for an isentropic expansion condition, Pt, in and Pt, out are total pressure at inlet and outlet. It should be mentioned since the computational domain includes two outlet boundaries, so ht, out and ht, s, out are mass-averaged data of theirs values at mainstream outlet and cavity duct outlet.
The seal studied in this section is the datum structure in Tab. 2, and different values of seal cavity outlet pressure (Pc, out) are considered in current numerical simulations. It can be first seen from Figs. 9 and 10 that the labyrinth seal can lower both Fax and mL, which are also reduced with the increase of Pc, out. Compared to the no seal case, using labyrinth seal leads to maximum reductions in mL and Fax by 30.97% and 6.61% respectively.
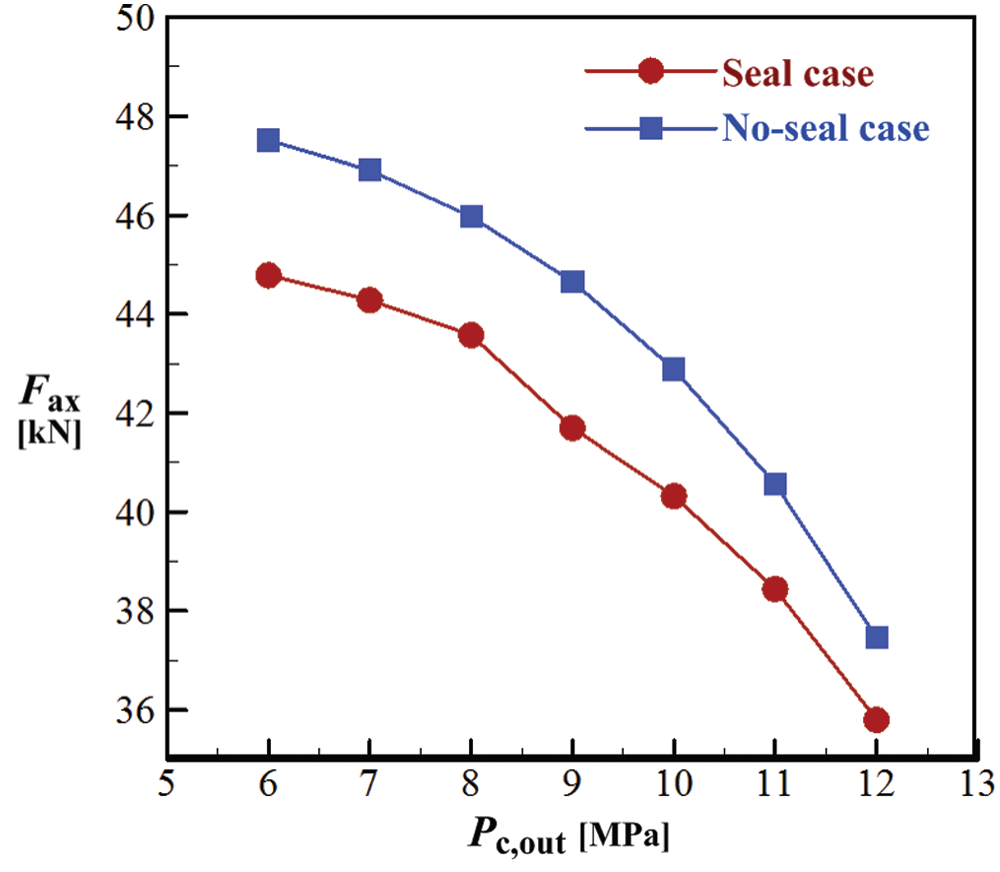
Figure 9: Comparison of axial force for the RIT with and without seal structure
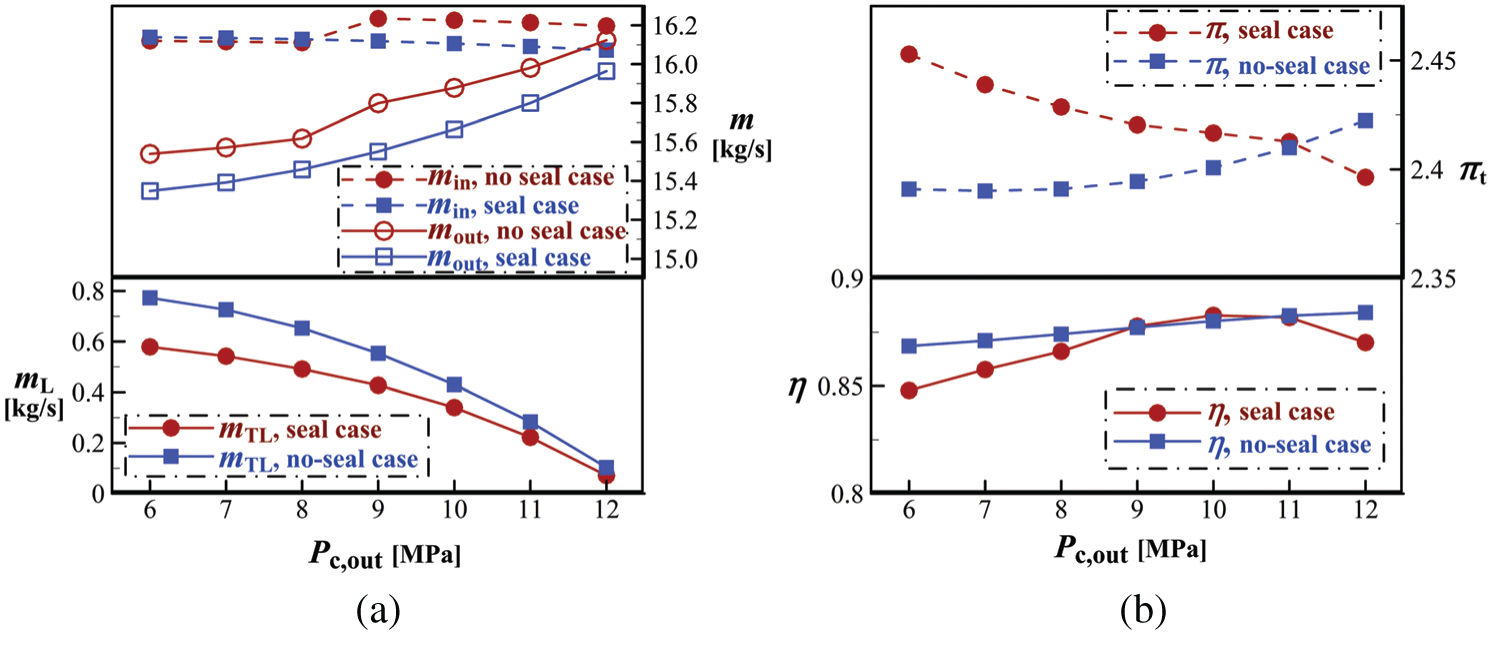
Figure 10: Comparison of performance for the RIT with or without seal structure, (a) leakage and mainstream mass flow rates, (b) efficiency and expansion ratio
With the increase in Pc, out or decrease in mL, mass flow rate at mainstream outlet (mout) is increased, as indicated by Fig. 10a. Since the decreasing trend of mout is smaller than the increasing tendency of mL, mass flow rate at mainstream inlet (min) is reduced with raising Pc, out. In addition, Fig. 10b shows that adding seals deteriorates  and expansion ability of the turbine at some low and high Pc, out conditions. This is because that kinetic energy is dissipated and friction loss is generated when leakage flow crosses seal cavities. When Pc, out changes from 9.0 to 10.0 MPa,
  of the RIT with seals is higher than that without seals. This may offer a guidance for choosing an appropriate condition for the compressor in Fig. 1.
In order to further clarify the influence of Pc, out on Fax, variations of FT1, FT2 and F2 with Pc, out are shown in Fig. 11, where F1 is the sum of FT1 and FT2 as implied by Eq. (6) and Fax is the same as that in Fig. 10. When F1 points to the backface of the impeller, it has a negative sign and F2 has a positive direction. This also results in a negative value for Fax, so all data in Fig. 11 are absolute values. As Pc, out increases, pressure difference between inlet and outlet of the backface cavity becomes smaller, so F2 is enlarged. Since F1 is nearly unchanged for all Pc, out values, Fax is consequently changed in a descending trend as shown in Figs. 9 and 11.
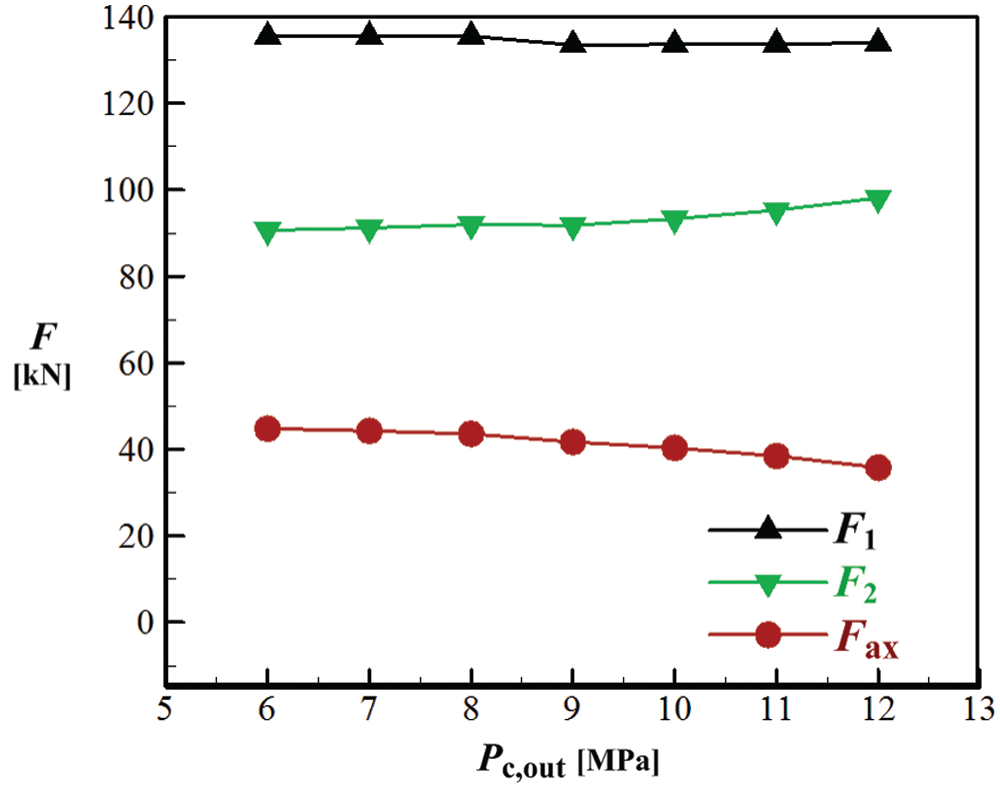
Figure 11: Effect of seal cavity outlet pressure on axial forces
4.3 Influence of Seal Geometry Parameters
Section 2 introduces main geometrical parameters including the seal clearance and the height, and number of labyrinth seal teeth. This section will analyze their impacts on seal performance based on numerical simulations for the S-CO2 RIT.
Four values of s are numerically simulated to examine its influence on seal performance. Meanwhile, three different values of Pc, out including 6, 8 and 10 MPa are considered in the simulation. Fig. 12 presents variations of Fax and mL as s increases. It is observed that mL is nearly proportional to s. This is consistent with the conclusion of Yuan et al. [33]. The reason for this result can be interpreted from two aspects. First, increasing s not only leads to larger flow area of leakage low but also weakens the jet effect, and the latter result induces a small cavity vortex (see cavity flow field in Fig. 15 below) that is usually beneficial to hinder leakage flow. Secondly, larger s weakens the throttling effect of seal teeth. Due to this, both flow resistance and energy dissipation are decreased, so mL is increased.
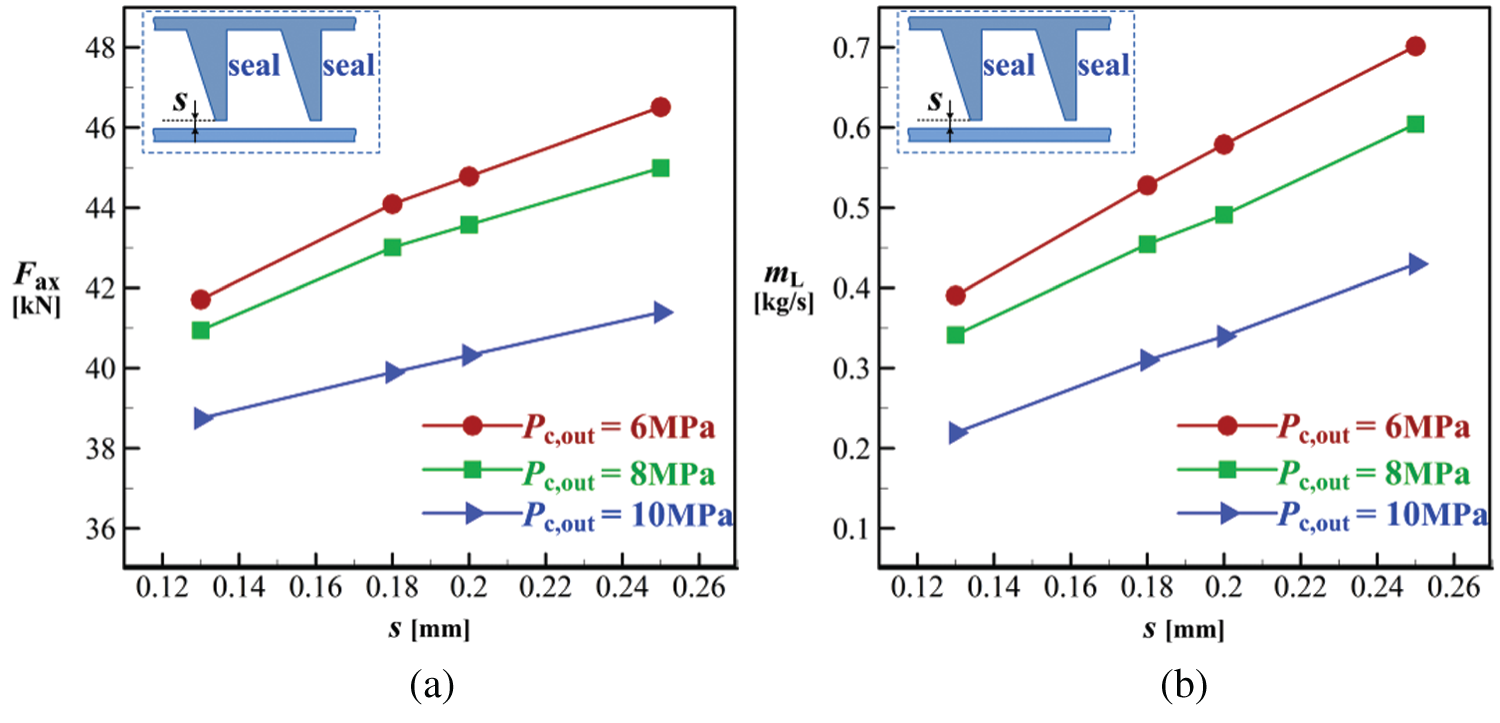
Figure 12: Effects of the seal clearance, (a) axial force, (b) leakage mass flow rate
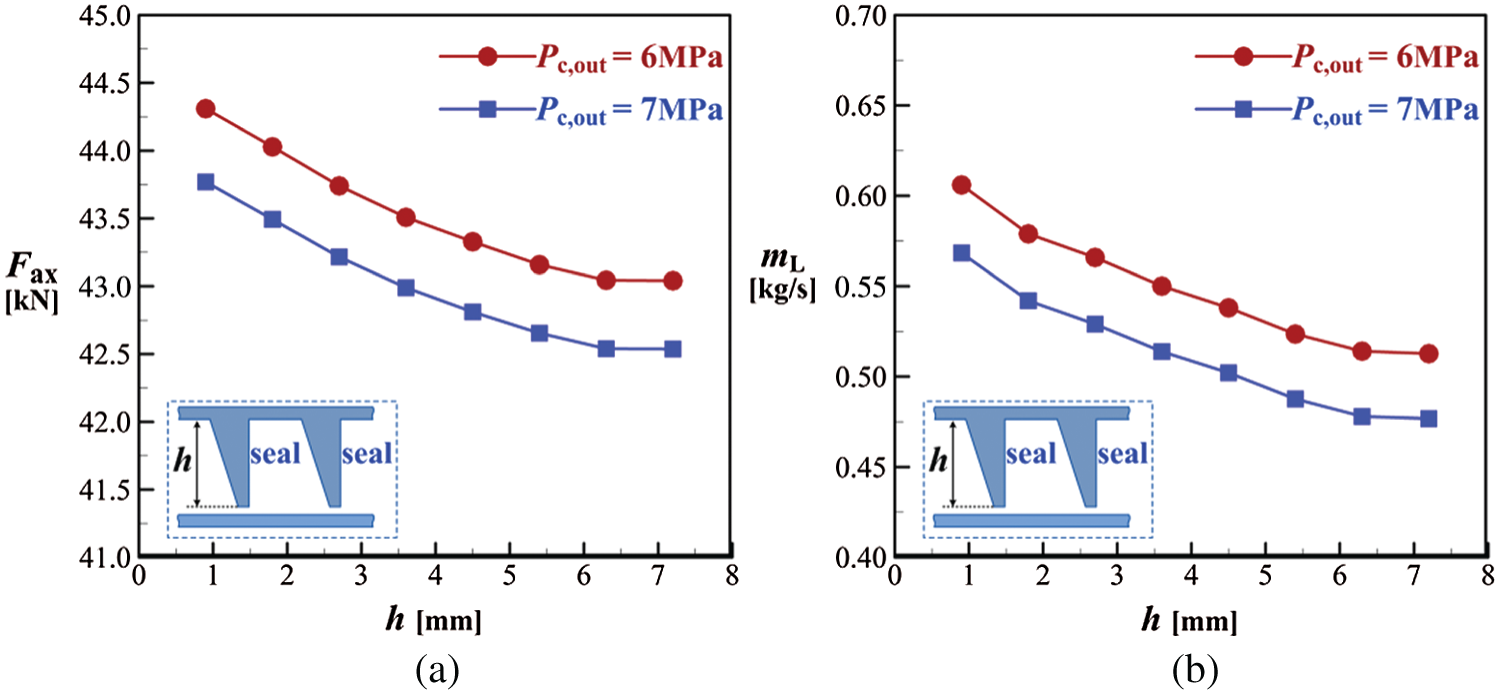
Figure 13: Effects of the height of seal teeth, (a) axial force, (b) leakage mass flow rate
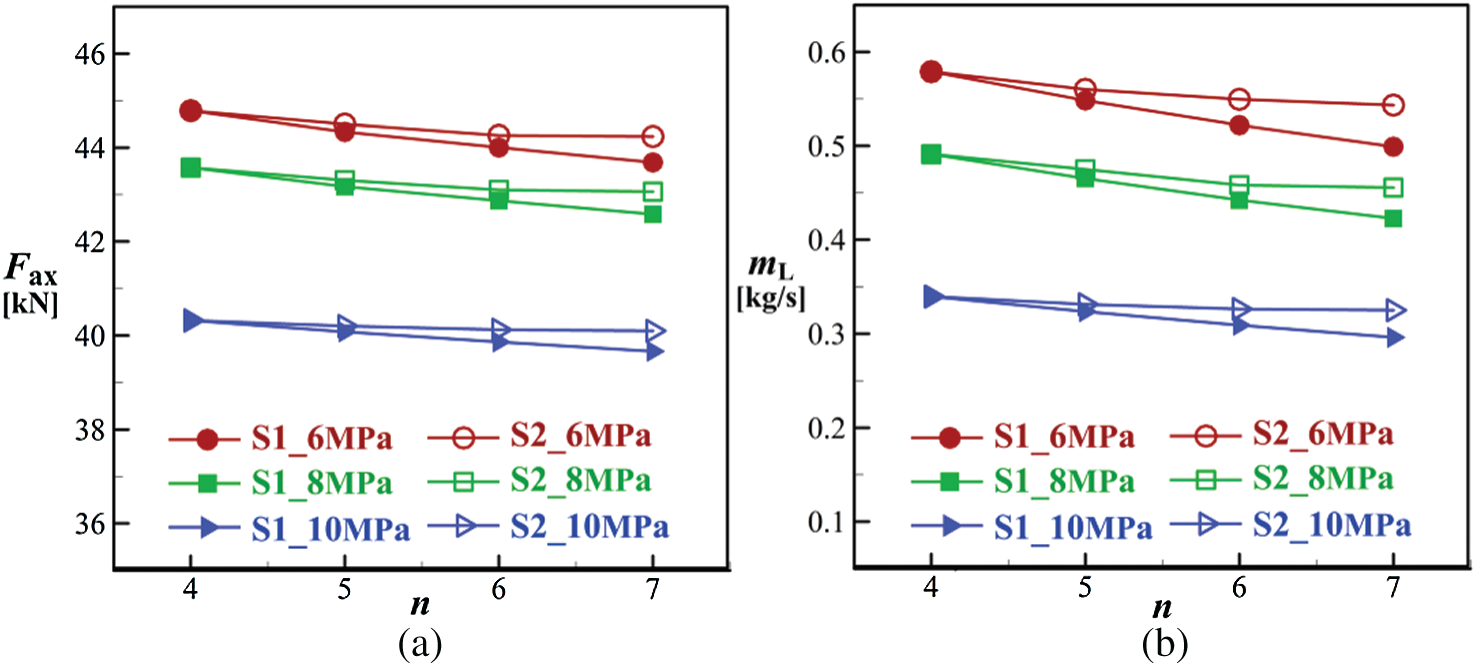
Figure 14: Effects of the number of seal teeth, (a) axial force, (b) leakage mass flow rate
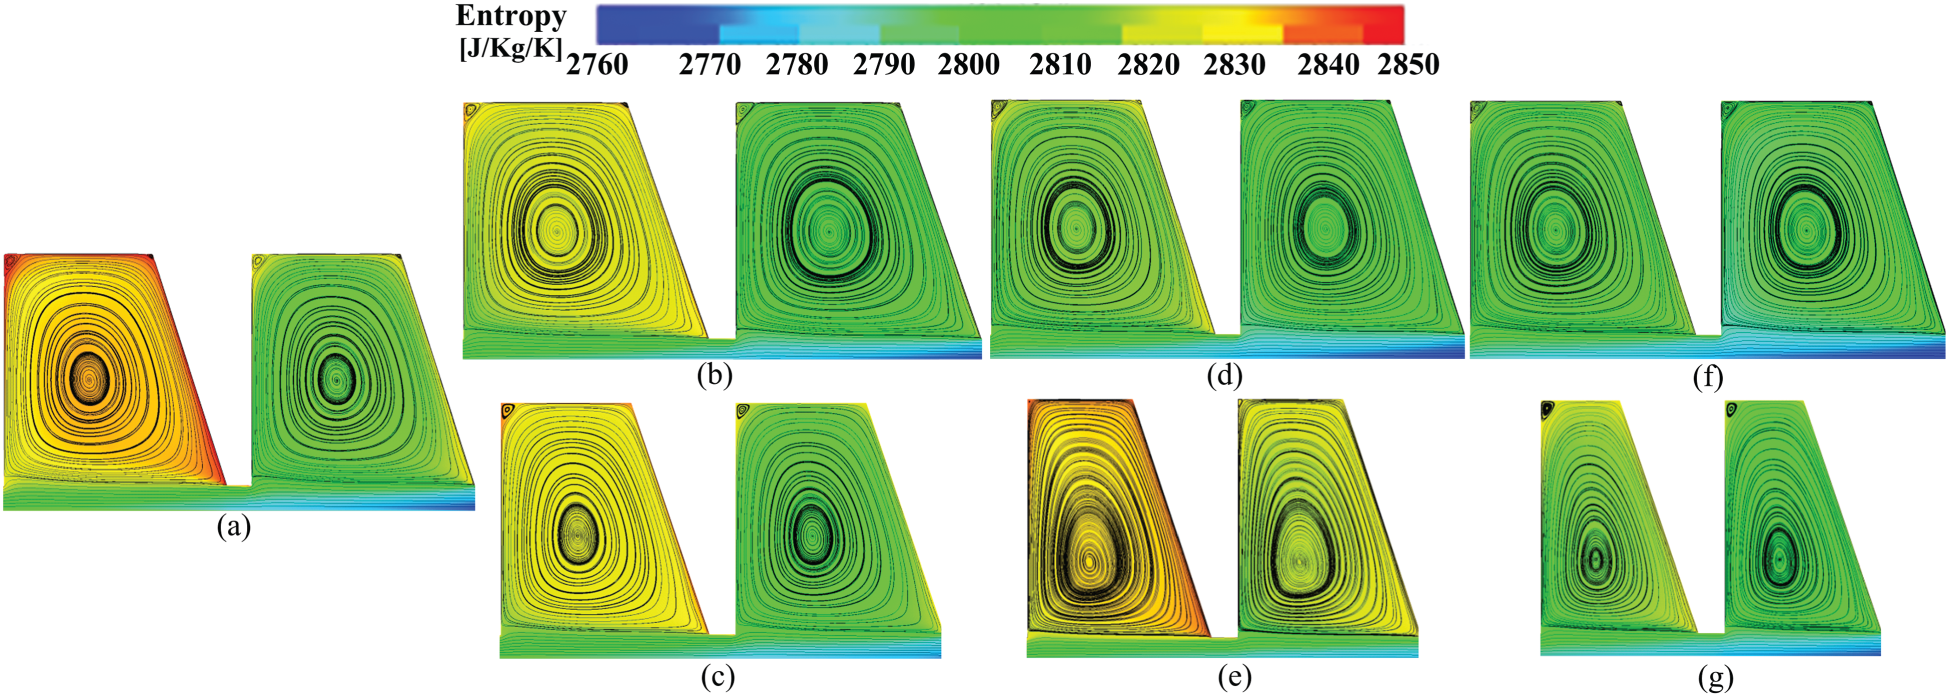
Figure 15: Flow fields in the second and third cavities (Pc, out = 6 MPa), (a) case S1_n4 and case S2_n4, (b) case S1_n5, (c) case S2_n5, (d) case S1_n6, (e) case S2_n6, (f) case S1_n7, (g) case S2_n7
Larger s leads to higher mL and hence lowers impeller backface pressure, so the pressure difference between the inlet and outlet of backface cavity becomes smaller. This results in reduced force on the impeller backface cavity (F2 in Fig. 11). Since the force acting on the turbine impeller and outlet (F1 in Fig. 11) is nearly unchanged, Fax is consequently increased with enlarging s, as demonstrated by Fig. 12a. Therefore, small seal clearance should be chosen as long as requirements of safe operation and manufacturing are satisfied. In addition, Fig. 12 also demonstrates that the effects of s on mL and Fax are the same for all three Pc, out conditions. At a fixed seal clearance, both mL and Fax are decreased as Pc, out increases. This is consistent with the conclusion obtained from Figs. 9 and 10a.
4.3.2 Height of the Seal Teeth
With regard to the height of seal teeth (h) shown in Fig. 2, eight values are considered during CFD simulations. Results of calculated mL and Fax under two Pc, out conditions are presented in Fig. 13. It is observed that when h is increased in the range from 0.9 to 6.3 mm, mL is rapidly decreased. However, as h is further increased when it is larger than 6.3 mm, mL has no obvious change. This indicates that increasing h within a certain range can enlarge the size of cavity vortex and increase the turbulent kinetic energy of leakage flow, but flow reaches to the chocking point when h equals 6.3 mm. Similar changing trend is also observed when analyzing the impacts of h on Fax and Pc, out. Moreover, with the increase of h, the force acting on the impeller working face, i.e., F1, is not obviously changed, but the static pressure in impeller backface cavity is increased. This leads to an increase in F2, and ultimately induces a reduction in the axial force (Fax). As seal leakage flow reaches the critical state, a flow dynamic equilibrium condition is achieved in the backface cavity, so the cavity pressure remains unchanged. Predicted data imply that for both the two conditions of Pc, out, i.e., Pc, out = 6 MPa and Pc, out = 7 MPa, the optimum sealing performance is achieved when h is 6.3 mm. Under this optimum condition and compared to the datum case (h = 1.8 mm), mL is decreased by 11.21% and 11.82%, and Fax is reduced by 2.24% and 2.19% for Pc, out being 6 and 7 MPa respectively.
4.3.3 Number of the Seal Teeth
Based on the seal geometry shown in Fig. 2, four values of the number of seal teeth (n) including 4, 5, 6 and 7 are numerically studied under different Pc, out conditions. Since changing n will influence the axial length of seal cavity passage (L), two schemes are considered. The first scheme is to keep the distance between two teeth (pitch d in Fig. 2) unchanged and hence L equals n times d, while the second one is to make L constant and d is L divided by n. For the first scheme, d is set to 2.0 mm, and for the second one, L is set to be 20 mm. Details of the investigated cases are summarized in Tab. 3, where S1 and S2 represent Scheme 1 and Scheme 2, respectively.
Table 3: Cases with different seal teeth number
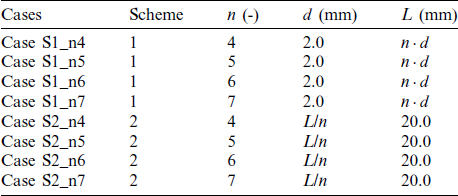
Fig. 14 shows variations of mL and Fax with n. The case with n being 4 corresponds to the datum seal configuration in Tab. 2. For the two schemes in Tab. 3 and under all three Pc, out conditions, with the increase of n, both mL and Fax are continuously decreased. This conclusion is consistent with that of Kim et al. [34] who studied a stepped labyrinth seal. Meanwhile, compared to cases of Scheme 1, those of Scheme 2 have higher mL and Fax for all conditions studied. Reasons for this will be discussed later. In addition, it is also observed from Fig. 14 that for a fixed value of n, mL and Fax are decreased as Pc, out increases. This is consistent with the conclusion in Section 4.2. The influences of Pc, out on mL and Fax are more significant than that of n, as implied by the changing level of mL and Fax when n and Pc, out are altered in Fig. 14.
To further demonstrate the effect of n, Fig. 15 presents contours of entropy and flow streamlines in the second and third cavities of all cases. Flow field in the datum seal cavity is shown in Fig. 15a, where a vortex is generated in each cavity due to a contraction effect. It not only induces two smaller vortices at the upper corners of the cavity, but also imposes flow resistance on the leakage fluid. Large entropy area mainly exists in cavity corners and the borders between leakage and cavity fluids due to the difference in velocity, i.e., the friction effect. Meanwhile, entropy is increased from the upstream (right) cavity to the downstream (left) one because of friction loss.
To analyze the impact of n, comparison can be conducted from horizontal and vertical views of Fig. 15. From the horizontal view, it can be observed that as n increases, the variation of entropy in the cavity becomes smaller compared to the datum case in Fig. 15a, see Figs. 15b, 15d and 15f for Scheme 1 and Figs. 15c, 15e and 15g for Scheme 2. From the vertical view, it is seen that under a specific condition of n, the Scheme 1 approach has lower entropy than the Scheme 2 arrangement. Sun et al. [35] denoted that mL and n have a relationship as below:

where A is the flow area at seal clearance, Tt, c, in is total temperature at the seal cavity inlet, and  is a pressure ratio that is defined as

where Pt, c, in is total pressure at the seal cavity inlet. In addition, if the change in temperature of leakage flow can be neglected, computing formulation for the entropy increase can be simplified as

According to Eqs. (9)–(11), smaller  indicates smaller
  and Pt, c, in if Pc, out is fixed. Hence, larger n and lower Pt, c, in lead to less mL. This is consistent with the conclusion obtained from Fig. 14. Meanwhile, since entropy variations of Scheme 1 cases are smaller than those of Scheme 2 cases, mL of Scheme 1 is lower than that of Scheme 2 for a fixed teeth number. This is also in agreement with results in Fig. 14. In addition, the impacts of n on mL can also be analyzed from the prospective of energy dissipation. Since leakage fluid experiences sequential acceleration-deceleration process in the cavity duct, so increasing n induces more energy dissipation and flow resistance. Meanwhile, with the increase of n, the cavity passage of Scheme 1 approach is longer than that of Scheme 2 arrangement, so friction loss is higher in Scheme 1 cases. This leads to the result in Fig. 14 that mL of Scheme 1 cases is lower than that of Scheme 2 case.
4.3.4 Simple Sensitivity Analysis of Seal Geometry Parameters
In order to pinpoint which parameter has the most important effects on seal performance, Fig. 16 compares reductions in mL and improvements in  when changing s, h and n under different Pc, out conditions. Variables
  and
and  represent changes in mL and
  of each case relative to those of the datum case, where s = 0.2 mm, h = 1.8 mm, n = 4 and Pc, out = 6.0 MPa. So negative
  and positive
  values demonstrate improved seal performance.
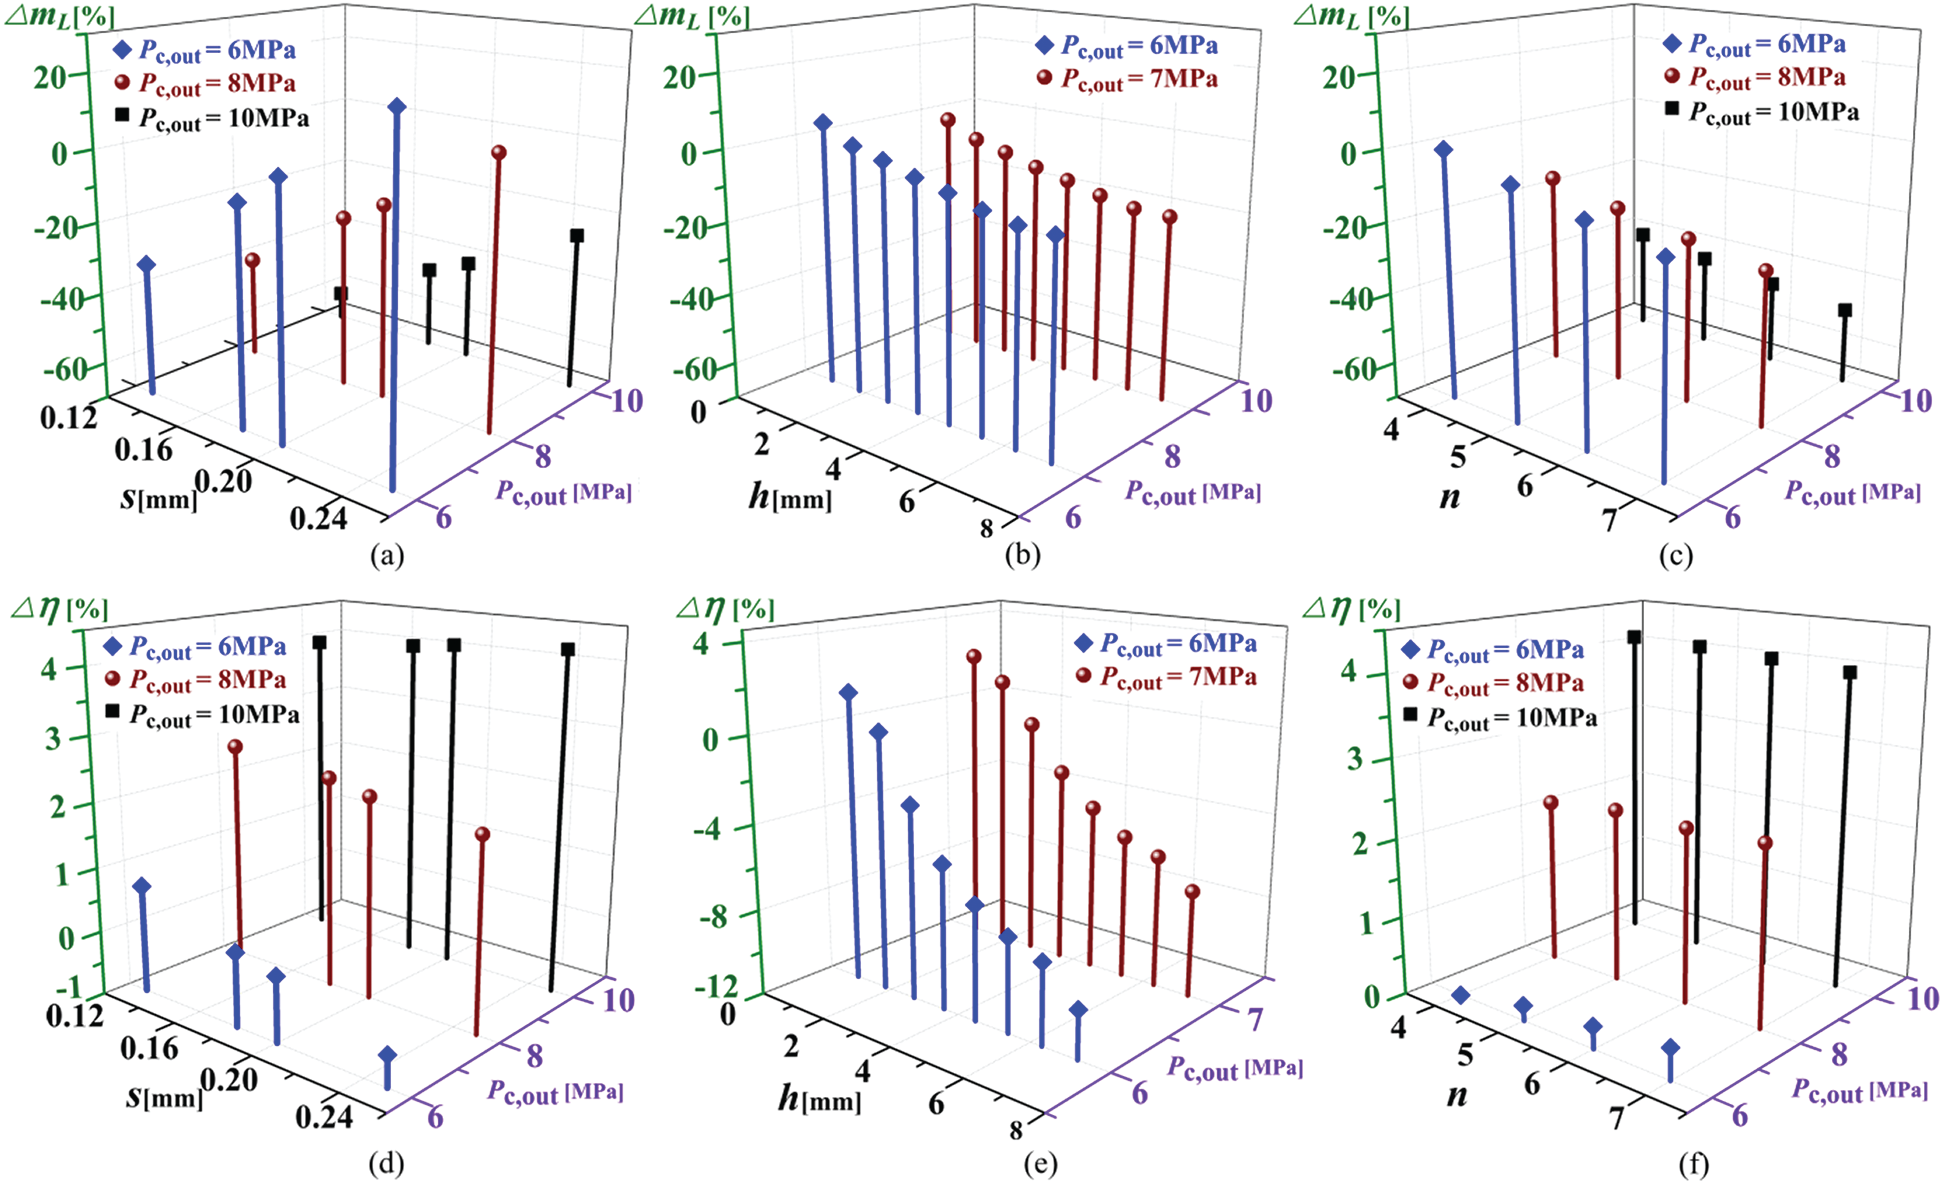
Figure 16: Impacts of seal geometry to performance, (a) seal clearance vs. leakage mass flow, (b) seal teeth height vs. leakage mass flow, (c) seal teeth number vs. leakage mass flow, (d) seal clearance vs. efficiency, (e) seal teeth height vs. efficiency, (f) seal teeth number vs. efficiency
It can be observed that for a specific condition of Pc, out, the changing trend of  with h is weaker than that with s and n. A maximum reduction in mL of 62.14% is obtained when s takes the minimum value (0.13 mm) under the maximum Pc, out condition (10 MPa), where mL is reduced by 44.10%–48.85% with increasing n to 5–7. For the RIT efficiency, a maximum
  of 4.23% is obtained when s = 0.13 mm and Pc, out = 10 MPa, and under this Pc, out condition,
  is increased by about 4.0% for n = 5–7. Therefore, among the three seal geometry parameters, decreasing seal clearance is the most effective approach to improve seal performance.
4.4 Effect of the Seal Teeth Shape
In order to analyze the influence of teeth shape on leakage mass flow rate and axial force, four types of seal teeth are constructed. They create different seal cavities in the shape of triangle, rectangle, a right-angled trapezoid and isosceles trapezoid, as shown in Fig. 17. The labyrinth seal in Fig. 17b is regarded as a standard geometry, and values of s, h and L are kept constant. Consequently, the shape of seal teeth or seal cavities is determined by changing a, b and d. Numerical simulations are conducted for the S-CO2 RIT with these seals under different Pc, out conditions.
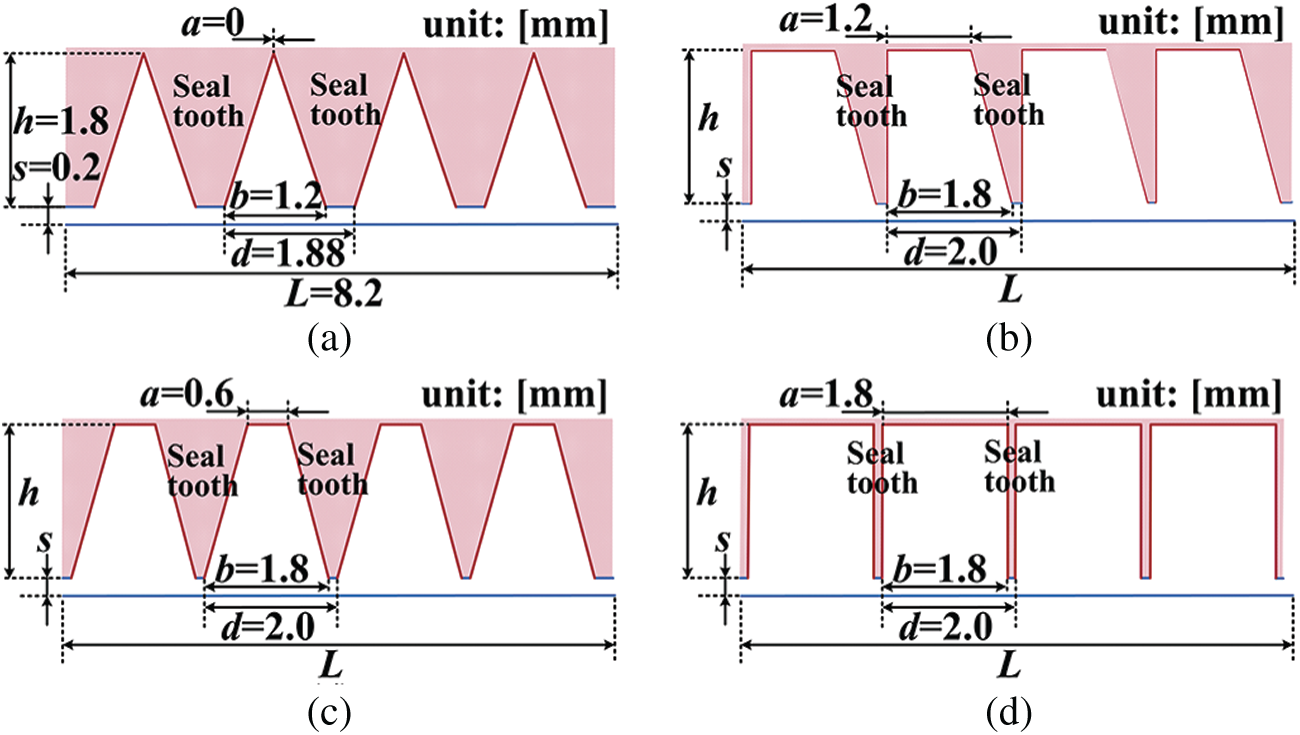
Figure 17: Schematic diagram of labyrinth seals with different shapes of seal cavities, (a) triangular cavity, (b) right-angled trapezoidal cavity, (c) isosceles trapezoidal cavity, (d) rectangular cavity
Fig. 18 compares predicted performance of the four seal geometries. It is observed that the isosceles trapezoidal cavity has the lowest mL and Fax, followed by the right-angled trapezoidal and the rectangular cavities. The triangular cavity in Fig. 17a has the worst seal performance and the largest axial force. Variations in min, mout,  and
and  are small for the RIT with triangular, right-angled trapezoidal, and rectangular seal cavities. For the isosceles trapezoidal cavity case,
  is reduced at low Pc, out conditions, but is improved when Pc, out is larger than 9 MPa. These results also provide a standard for choosing appropriate conditions of Pc, out. In addition, Fig. 18 indicates that mL and Fax are continuously decreased with the increase of Pc, out for all cases.
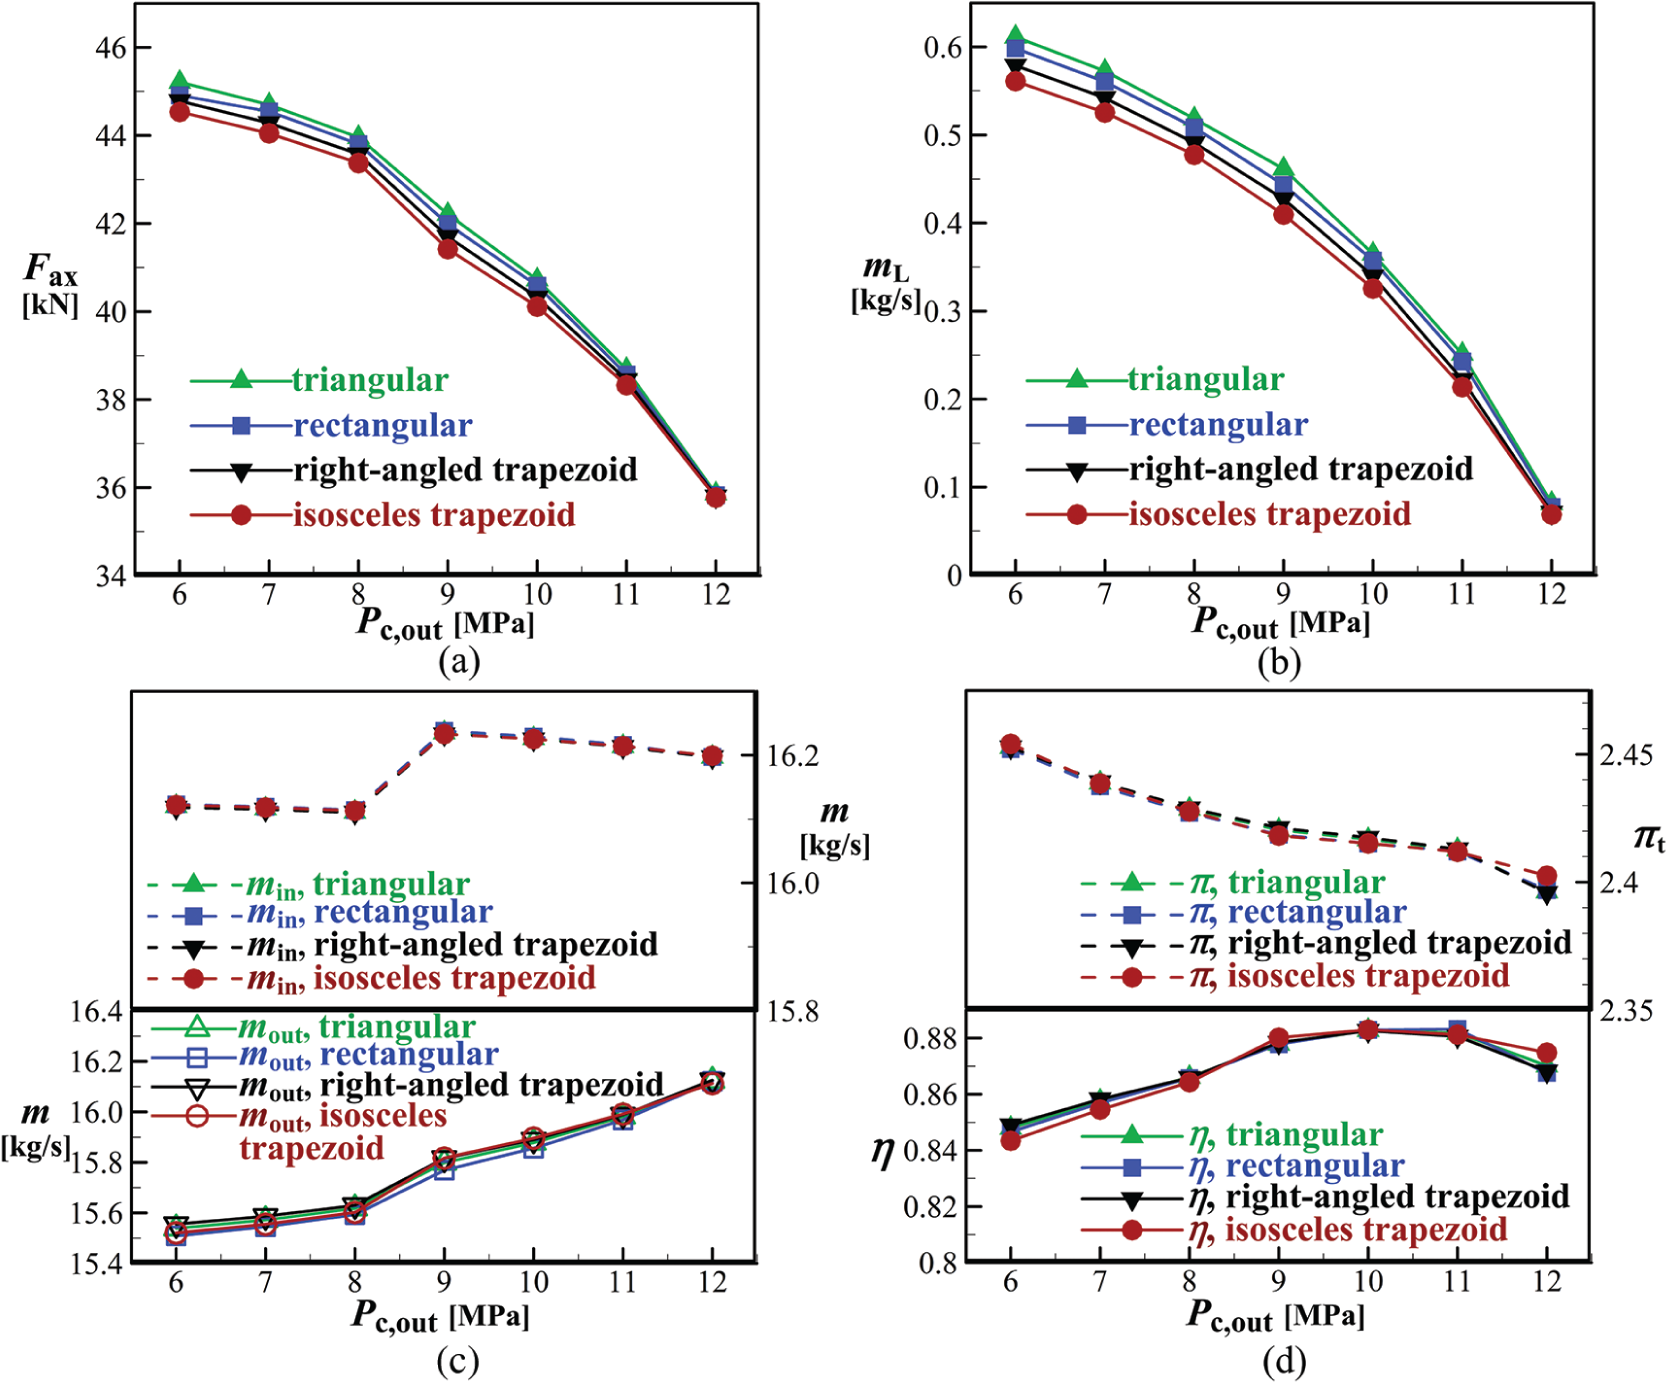
Figure 18: Effects of seal teeth shape, (a) axial force, (b) leakage mass flow rates, (c) mainstream inlet and outlet mass flow rates, (d) turbine efficiency and expansion ratio
Flow field in each seal cavity is shown in Fig. 19, and it has similar properties as that in Fig. 15. The isosceles trapezoidal cavity in Fig. 19c has the least variation in entropy, and the corresponding corner vertex has the weakest intensity. Therefore, as demonstrated in Fig. 15, the lower the entropy change, the smaller the axial force and leakage mass flow rate. It is also concluded that the center vortex has significant impacts on entropy change and seal performance. Therefore, for the RIT studied in this paper, the seal that forms the isosceles trapezoidal cavity has the best sealing performance.
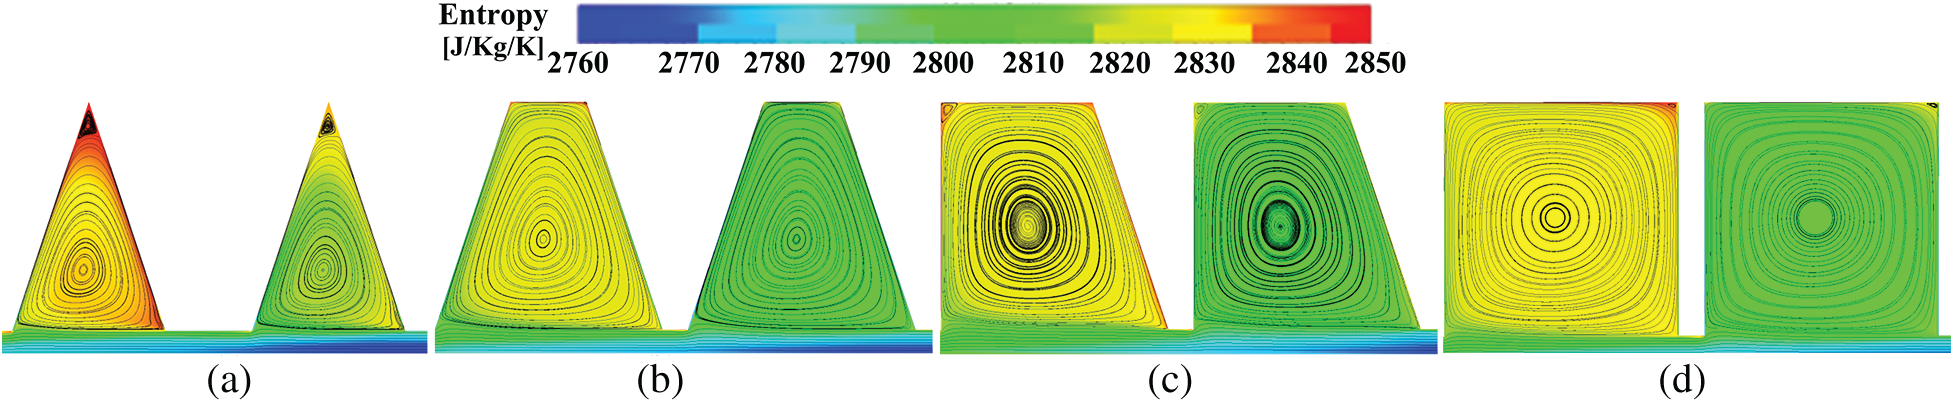
Figure 19: Flow fields in the second and third cavities with different shapes of seal teeth, (a) triangular cavity, (b) isosceles trapezoidal cavity, (c) right-angled trapezoidal cavity, (d) rectangular cavity
In order to control leakage flow of the impeller backface cavity and decrease the associated axial force, CFD simulations have been conducted for an S-CO2 RIT. Effects of seal cavity outlet pressure, seal clearance, height, number and shape of seal teeth are examined. Main conclusions are summarized below.
Compared to the no-seal case, using the labyrinth seal can reduce leakage mass flow rate (mL) and axial force acting on the impeller backface (Fax) by 30.97% and 6.61% respectively. With the increase of cavity outlet pressure, efficiency of the RIT with seals is higher than that without seals.
Larger seal clearance leads to wider flow area of leakage fluid, and weakens the jet and throttling effects. Therefore, the flow resistance of seals to leakage flow and the energy dissipation of leakage are reduced. This makes mL and Fax increased with enlarging the seal clearance. Moreover, increasing the height and number of seal teeth are beneficial to decrease mL and Fax. Leakage flow reaches to its choking point when the teeth height is enlarged to a certain value (6.3 mm for the studied case), beyond which mL and Fax are nearly kept constant. Increasing the number of seal teeth leads to smaller entropy change in seal cavities and more frequent acceleration-deceleration process for leakage fluid. Among these parameters, decreasing the seal clearance is the most effective way to improve seal performance.
The seal that create isosceles trapezoidal cavity has the best seal performance when compared to other types of seal teeth. This is ascribed to complete development of the cavity vortex, which is helpful to hinder leakage flow. In addition, for all cases studied in the paper, mL and Fax are decreased with the increase in seal cavity outlet pressure.
Funding Statement: This paper is founded by the National Key R&D Program of China (Contract No. 2016YFB060010), National Natural Science Foundation of China (Grant Nos. 51606026 and 51876021) and the Fundamental Research Funds for the Central Universities.
Conflicts of Interest: The authors declare that they have no conflicts of interest to report regarding the present study.
1. Crespi, F., Gavagnin, G., Sánchez, D., Martínez, G. S. (2017). Supercritical carbon dioxide cycles for power generation: A review. Applied Energy, 195, 152–183. DOI 10.1016/j.apenergy.2017.02.048. [Google Scholar] [CrossRef]
2. Gou, J., Zhang, K., Lin, Y., Li, Y., Ma, C. et al. (2020). Physical property effects of the compression process with supercritical carbon dioxide as working fluid. Journal of Mechanical Science and Technology, 34(8), 3379–3393. DOI 10.1007/s12206-020-0731-1. [Google Scholar] [CrossRef]
3. Jeong, W. S., Kim, T. W., Suh, K. Y. (2008). Computational fluid dynamics of supercritical carbon dioxide turbine for Brayton thermodynamic cycle. Proceedings of the 16th International Conference on Nuclear Engineering, pp. 265–269, Orlando, Florida, USA. [Google Scholar]
4. Conboy, T., Wright, S., Pasch, J., Fleming, D., Rochau, G. et al. (2012). Performance characteristics of an operating supercritical Brayton cycle. Journal of Engineering for Gas Turbines and Power, 134(11), 229. DOI 10.1115/1.4007199. [Google Scholar] [CrossRef]
5. Pasch, J., Carlson, M., Fleming, D., Rochau, G. (2016). Evaluation of recent data from the SANDIA national laboratories closed Brayton cycle testing. Proceeding of ASME Turbo Expo: Turbomachinery Technical Conference and Exposition, Seoul, South Korea. [Google Scholar]
6. Clementoni, E. M., Cox, T. L., King, M. A. (2016). Off-nominal component performance in a supercritical carbon dioxide Brayton cycle. Journal of Engineering for Gas Turbines and Power, 138(1), 71701. DOI 10.1115/1.4031182. [Google Scholar] [CrossRef]
7. Clementoni, E. M., Cox, T. L. (2014). Steady state power operation of a supercritical carbon dioxide power cycle. Proceeding of ASME Turbo Expo: Turbine Technical Conference and Exposition, Düsseldorf, Germany. [Google Scholar]
8. Huang, Y., Wang, J., Zang, J., Liu, G. (2014). Research activities on supercritical carbon dioxide power conversion technology in China. Proceeding of ASME Turbo Expo: Turbine Technical Conference and Exposition, Düsseldorf, Germany. [Google Scholar]
9. Zhou, A. Z., Li, X. S., Ren, X. D., Song, J., Gu, C. W. (2020). Thermodynamic and economic analysis of a supercritical carbon dioxide (S–) recompression cycle with the radial-inflow turbine efficiency prediction. Energy, 191, 116566. DOI 10.1016/j.energy.2019.116566. [Google Scholar] [CrossRef]
10. Zhou, K., Wang, J., Xia, J., Guo, Y., Zhao, P. et al. (2020). Design and performance analysis of a supercritical radial inflow turbine. Applied Thermal Engineering, 167, 114757. DOI 10.1016/j.applthermaleng.2019.114757. [Google Scholar] [CrossRef]
11. Unglaube, T., Chiang, H. W. D. (2020). Preliminary design of small-scale supercritical radial inflow turbines. Journal of Engineering for Gas Turbines and Power, 142(2), 111703. DOI 10.1115/1.4045273. [Google Scholar] [CrossRef]
12. He, P., Sun, Z. G., Chen, H. S., Tan, C. Q. (2012). Investigation of backface cavity sealing flow in deeply scalloped radial turbines. Proceedings of the Institution of Mechanical Engineers, Part A: Journal of Power and Energy, 226(6), 751–763. DOI 10.1177/0957650912452355. [Google Scholar] [CrossRef]
13. Verstraete, T., Alsalihi, Z., Braembussche, R. A. V. D. (2006). Numerical study of the heat transfer in micro gasturbines. Proceeding of ASME Turbo Expo: Power for Land, Sea and Air, Barcelona, Spain. [Google Scholar]
14. Ma, C., Qiu, Z. Q., Gou, J. L., Wu, J., Zhao, Z. X. et al. (2018). Axial force balance of supercritical radial inflow turbine impeller through backface cavity design. Proceedings of ASME Turbo Expo: Turbomachinery Technical Conference and Exposition, Oslo, Norway. [Google Scholar]
15. Alizadeh, M., Nikkhahi, B., Farahani, A. S., Fathi, A. (2018). Numerical study on the effect of geometrical parameters on the labyrinth-honeycomb seal performance. Proceedings of the Institution of Mechanical Engineers, Part G: Journal of Aerospace Engineering, 232(2), 362–373. DOI 10.1177/0954410017742227. [Google Scholar] [CrossRef]
16. Joachimiak, D., Krzyśłak, P. (2019). Analysis of the gas flow in a labyrinth seal of variable pitch. Journal of Applied Fluid Mechanics, 12(3), 921–930. DOI 10.29252/jafm.12.03.29074. [Google Scholar] [CrossRef]
17. Zhang, M., Yang, J., Xu, W., Xia, Y. (2017). Leakage and rotordynamic performance of a mixed labyrinth seal compared with that of a staggered labyrinth seal. Journal of Mechanical Science and Technology, 31(5), 2261–2277. DOI 10.1007/s12206-017-0423-7. [Google Scholar] [CrossRef]
18. Chupp, R. E., Hendricks, R. C., Lattime, S. B., Steinetz, B. M. (2006). Sealing in turbomachinery. Journal of Propulsion and Power, 22(2), 313–349. DOI 10.2514/1.17778. [Google Scholar] [CrossRef]
19. Yucel, U., Kazakia, J. Y. (2001). Analytical prediction techniques for axisymmetric flow in gas labyrinth seals. Journal of Engineering for Gas Turbines and Power, 123(1), 255–257. DOI 10.1115/1.1340630. [Google Scholar] [CrossRef]
20. Bariaud, C., Delonge, J. C. L. (1986). U.S. Patent No. 4,580,792. Washington, DC: U.S. Patent and Trademark Office. [Google Scholar]
21. Li, Z., Li, J., Yan, X., Feng, Z. (2011). Effects of pressure ratio and rotational speed on leakage flow and cavity pressure in the staggered labyrinth seal. Journal of Engineering for Gas Turbines and Power, 133(11), 313. DOI 10.1115/1.4003788. [Google Scholar] [CrossRef]
22. Paolillo, R., Moore, S., Cloud, D., Glahn, J. A. (2007). Impact of rotational speed on the discharge characteristic of stepped labyrinth seals. Proceedings of the ASME Turbo Expo 2007: Power for Land, Sea, and Air, Vol. 4, pp. 1291–1298, Montreal, Canada. [Google Scholar]
23. Lv, G. C. (2019). Optimization design and analysis of supercritical carbon dioxide radial inflow turbine (Master thesis). Dalian, China: Dalian University of Technology. [Google Scholar]
24. Lv, G., Yang, J., Shao, W., Wang, X. (2018). Aerodynamic design optimization of radial-inflow turbine in supercritical cycles using a one-dimensional model. Energy Conversion and Management, 165, 827–839. DOI 10.1016/j.enconman.2018.03.005. [Google Scholar] [CrossRef]
25. Feng, J., Wang, L., Yang, H., Peng, X. (2018). Numerical investigation on the effects of structural parameters of labyrinth cavity on sealing performance. Mathematical Problems in Engineering, 2018(PT.9), 1–12. [Google Scholar]
26. NUMECA, Int. (2016). FINE TM /Turbo users’ guide V10.2. Belgium: NUMECA Int. [Google Scholar]
27. Moreira1, L. Q., Mariano, F. P., Silveira-Neto, A. (2011). The importance of adequate turbulence modeling in fluid flows. Computer Modeling in Engineering & Sciences, 75(2), 113–139. [Google Scholar]
28. Moon, M. A., Lee, C. S., Kim, K. Y. (2015). Performance evaluation of various rim-seal geometries. Journal of Thermophysics And Heat Transfer, 29(2), 263–273. DOI 10.2514/1.T4363. [Google Scholar] [CrossRef]
29. Wright, S. A., Radel, R. F., Vernon, M. E., Rochau, G. E., Pickard, P. S. (2010). Operation and analysis of a supercritical CO2 Brayton cycle. SANDIA Report 101, SAND2010-0171, 1–101. [Google Scholar]
30. Kim, M. S., Bae, S. J., Son, S., Oh, B. S., Lee, J. I. (2019). Study of critical flow for supercritical seal. International Journal of Heat and Mass Transfer, 138, 85–95. DOI 10.1016/j.ijheatmasstransfer.2019.04.040. [Google Scholar] [CrossRef]
31. Japikse, D. (1997). Centrifugal pump design and performance. Vermont: Concepts ETI. [Google Scholar]
32. Saravanamuttoo, H. I. H., Rogers, G. F. C., Cohen, H. (2001). Gas turbine theory. USA: Pearson Education. [Google Scholar]
33. Yuan, H., Pidaparti, S., Wolf, M., Edlebeck, J., Anderson, M. (2015). Numerical modeling of supercritical carbon dioxide flow in see-through labyrinth seals. Nuclear Engineering and Design, 293, 436–446. DOI 10.1016/j.nucengdes.2015.08.016. [Google Scholar] [CrossRef]
34. Kim, T. S., Cha, K. S. (2009). Comparative analysis of the influence of labyrinth seal configuration on leakage behavior. Journal of Mechanical Science and Technology, 23(10), 2830–2838. DOI 10.1007/s12206-009-0733-5. [Google Scholar] [CrossRef]
35. Sun, D., Lu, J., Wang, W., Ai, Y., Wang, Z. (2018). Numerical study on the sealing mechanism of labyrinth seal based on thermodynamic effect. Thermal Turbine, 47(3), 175–181. [Google Scholar]
 | This work is licensed under a Creative Commons Attribution 4.0 International License, which permits unrestricted use, distribution, and reproduction in any medium, provided the original work is properly cited. |