DOI: 10.32604/cmes.2021.014206
ARTICLE
Failure Patterns and Mechanisms of Hydraulic Fracture Propagation Behavior in the Presence of Naturally Cemented Fractures
1School of Mechanical Engineering, Beijing Key Laboratory of Pipeline Critical Technology and Equipment for Deep Water Oil & Gas Development, Beijing Institute of Petrochemical Technology, Beijing, 102617, China
2Jiangsu Key Laboratory of Advanced Manufacturing Technology, Huaiyin Institute of Technology, Huaiyin, 223003, China
*Corresponding Authors: Fang Shi. Email: shifang@hyit.edu.cn; Hao Qin. Email: nengdongqinhao@163.com
Received: 10 September 2020; Accepted: 18 November 2020
Abstract: In this study, we use the extended finite element method (XFEM) with a consideration of junction enrichment functions to investigate the mechanics of hydraulic fractures related to naturally cemented fractures. In the proposed numerical model, the lubrication equation is adopted to describe the fluid flow within fractures. The fluid-solid coupling systems of the hydraulic fracturing problem are solved using the Newton-Raphson method. The energy release rate criterion is used to determine the cross/arrest behavior between a hydraulic fracture (HF) and a cemented natural fracture (NF). The failure patterns and mechanisms of crack propagation at the intersection of natural fractures are discussed. Simulation results show that after crossing an NF, the failure mode along the cemented NF path may change from the tensile regime to the shear or mixed-mode regime. When an advancing HF kinks back toward the matrix, the failure mode may gradually switch back to the tensile-dominated regime. Key factors, including the length of the upper/lower portion of the cemented NF, horizontal stress anisotropy, and the intersection angle of the crack propagation are investigated in detail. An uncemented or partially cemented NF will form a more complex fracture network than a cemented NF. This study provides insight into the formation mechanism of fracture networks in formations that contain cemented NF.
Keywords: Hydraulic fracturing; natural fractures; crack propagation; unconventional reservoirs; mechanical interaction; joints
Hydraulic fracturing is a common technique for stimulating hydrocarbon production from tight reservoirs, improving waste disposal, and accelerating heat extraction from geothermal reservoirs [1–4]. As exploitation technology improves, more energy from unconventional hydrocarbon resources such as shale gas, tight gas, and coal bed methane are expected to be unlocked [5–9]. Natural fractures (NFs) can significantly enhance the effective permeability of a formation by connecting the primary hydraulic fracture (HF) to a network of natural fractures; hence, NFs can play a key role in boosting hydrocarbon production [10]. Therefore, it is important to develop strategies for reactivating more NFs during hydraulic fracturing treatments [3,6,11–13].
NFs can be classified into two categories: Uncemented or partially cemented joints and faults, or fully cemented joints and faults [2,3,14]. Cemented NFs often have a narrow thickness of less than 0.05 mm and are usually filled with calcite cement [1,15]. The cement varies in composition and texture, and a potential HF extension path may exist alongside the weakly bonded interface [3,16]. Using semicircular bend (SCB) experiments and finite element method (FEM) simulation, Wang et al. [3] found that the interaction behavior between an HF and cemented NFs is controlled by the rock-cement interfacial bond strength and the thickness of the NFs. Furthermore, numerical simulation results have shown that lower cement strength of NFs often leads to a more complex fracture network [14,15].
The interaction between HFs and NFs can have a considerable influence on fracture geometry, as revealed in experimental and field studies [10,17–19]. By conducting a laboratory experiment on a Devonian shale and hydro-stone, Blanton [20] found that an HF is likely to cross pre-existing fractures only under high differential stresses and at a high approach angle. According to observations made during mine-back experiments, the propagation of an HF can be arrested by NFs under moderate to low stress. Three possible types of intersection modes between HFs and NFs: NF slips under shear stress, HF arrested, and direct crossing or a crossing with an arrest [21]. In addition, the shear strength of pre-existing fractures has an obvious impact on the direction of fracture propagation. Through a series of tri-axial fracturing experiments, Zhou et al. [17] observed that with an increase in the shear strength of NFs, the area between the crossed tendency line and dilated tendency line also increases. Based on experimental observations, Gu et al. [22] proposed an extended HF–NF crossing criterion at nonorthogonal angles, which could be used to judge whether HFs cross/divert into NFs under the condition of isotropic and homogeneous rock. The extended criterion accounted for the effect of the approach angle on crossing, and the artificial fracture was more likely to divert along the interface than to cross it when the approach angle was less than 90 degrees.
In terms of the numerical simulation of the interaction between HFs and NFs, different factors such as the approach angle and the cohesive and frictional properties of NFs have been analyzed to capture their mechanical behaviors in the geometry of HFs [1,14,23–25]. The interaction between HFs and NFs may lead to arrest, crossing, or offset [7,22]. After an HF–NF interaction, the fracture propagation mode changes from the tensile mode to the mixed mode with some shearing [26]. Gu et al. [22] found that the fracture intersection is very sensitive to the approach angle, and when the angle of approach is about 90 degrees, an HF is more likely to cross the interface. Chuprakov et al. [18] developed a new OpenT model to investigate an HF contact with a pre-existing discontinuity, and their numerical results showed that injection parameters such as injection rate and fluid viscosity are major factors in the occurrence of crossing. This new model included a dependency on HF pumping characteristics and NF permeability, which had not been considered in other HF–NF interaction models. In addition, the debonding of an NF may occur when an HF is approaching the NF. Using XFEM, Dahi-Taleghani et al. [1,2] came to the conclusion that stress anisotropy may increase the possibility of opening parallel NFs but that it prevents debonded zones from coalescence with the HF. Thus, it may not enhance well performance in this case. Klimenko et al. [16] subsequently modified the above-mentioned XFEM model to consider HF propagation in both toughness-dominated and viscosity-dominated regimes. Recently, many scholars use XFEM model to simulate hydraulic fracturing problems due to its advantage of avoiding using a conforming mesh [27–30].
To the best of our knowledge, previous studies have concentrated mainly on HF–NF intersection behavior. Adopting the perspective of fracture mechanics, this paper focuses on the failure patterns and mechanisms of HF propagation behavior when an HF diverts into a cemented NF. These patterns and mechanisms are not fully understood at present. Using the XFEM technique with a consideration of junction enrichment functions, this study systematically investigates the mechanical properties of HF–NF intersection behavior, such as fracture toughness, maximum principal stress, and failure mode, according to energy release rate criteria. Crack propagation behaviors between cemented NFs and non-cemented or partially cemented NFs in hydraulic fracturing are also compared. This study offers new insight into the formation mechanism of fracture networks in cemented NF formations.
As shown in Fig. 1, we consider the 2D homogeneous, isotropic, and linear elastic properties of a formation that includes an HF with the interface  HF and a cemented NF with the interface
  . The HF is filled with fracturing fluid injected at constant rate Q0. The HF is expected to intersect with the cemented NF after a period of time. The boundary
  of the domain
  comprises prescribed displacement boundary
  and prescribed traction boundary
  , i.e.,
  . The outward-pointing unit normal vectors of the fracture surfaces of the HF and NF are denoted as
  and
and  , respectively. The effect of fluid leakoff on crack propagation is not considered in this study because of the ultra-low matrix permeability of the formation. We assume that fluid flow inside the HF is incompressible and that the propagation of the HF can be considered a quasi-static process in physics. In this model, no gap between the fracture tip and fluid front is assumed because of the low viscosity of fracturing fluids.

Figure 1: Schematics of a domain containing a hydraulic fracture and a cemented natural fracture
The stress equilibrium equation in the domain and associated boundary conditions can be written as [31–36]:

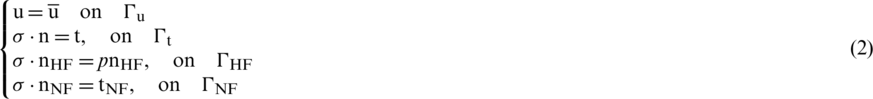
where  denotes the Cauchy stress tensor; b denotes the body force; ū denotes the prescribed displacement at the boundary
  ; t denotes the traction on the prescribed boundary
  ; p denotes fluid pressure in the HF; and
  denotes the contact traction vector on the NF surfaces.
We assume that rock behavior is linear elastic; therefore, the constitutive equation can be expressed as:

where  is the strain tensor; and D denotes the elastic matrix. In a plane strain problem,
 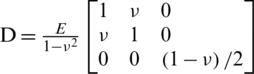 , where E is the elastic modulus and
  is Poisson’s ratio.
2.2 Crack Propagation Criterion
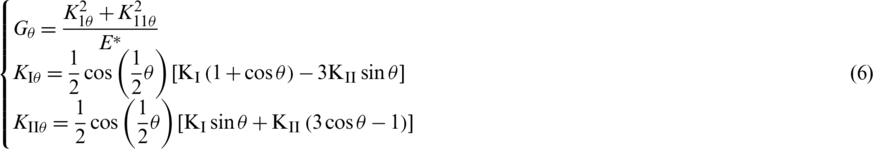
Maximum circumferential stress is used as the criterion to determine the fracture propagation direction during HF propagation [14,23,37]. According to the criterion of maximum circumferential stress, the equivalent stress intensify factor  for each tip is calculated at each time-step to determine whether the artificial fracture propagates at the corresponding tip [18,19]. If Ke is greater than fracture toughness
  , the HF is propagating [3,38]. According to linear elastic fracture mechanics (LEFM), the equivalent stress intensify factor
  can be written as:

where  and
and  denote mode I and mode II fracture intensify factors, respectively. These factors are obtained by the interaction integral method [14,37];
  denotes the fracture propagation angle, which can be calculated in the local polar coordinate system at the crack tip as:

When an HF interacts with a cemented NF, the HF may be diverted toward the NF, as shown in Fig. 2. In this study, the energy release rate criterion is used to determine the cross/arrest behavior between an HF and a cemented NF. In the local polar coordinate system, the energy release rate for any direction  with respect to the fracture direction can be written as [1,37,39–41]
where  denotes the energy release rate;
 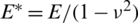 is Young’s modulus for plane strain; and
  denotes the polar angle with respect to the fracture tip. According to the criterion, the fracture propagates along the direction that leads to the maximum energy release rate. Therefore, the more likely path of two potential paths can be determined by comparing the ratio of G/
 and G/
 at the intersection of a closed cemented NF with an HF. If G/
 is greater than G/
 , the fracture will cross the cemented NF; otherwise, the HF will be arrested by the cemented NF [2]. Here,
  denotes the rock fracture energy and G
 denotes the fracture energy of diagenetic cements or the fracture energy between diagenetic cements and the host rock, whichever is lower.

Figure 2: Schematics of a hydraulic fracture intersecting a cemented natural fracture
2.3 Fluid Flow within Hydraulic Fractures
Rather than solving the full Navier–Stokes equation for fluid flow inside fractures, we assume the flow inside a fracture to be flow between two parallel plates. This simplifies the governing equations to Poiseuille’s law to find fluid flow q and fluid pressure p, such that

where w denotes the fracture width,  denotes the fluid viscosity, and s denotes the coordinate along the crack. Under the assumption of incompressible flow conditions within the fracture and no fluid leakoff into the rock matrix, the mass conservation equation can be expressed as:

By substituting Eqs. (8) into (9), the lubrication equation for fracture flow can be obtained as

where t and k denote the injection time and fracture permeability, respectively. Fracture permeability k can be mathematically expressed as follows:

The initial and boundary conditions for fluid flow are zero opening at the tip and the initial time. We further assume that the injection rate is kept constant and there is no flux at the fracture tips
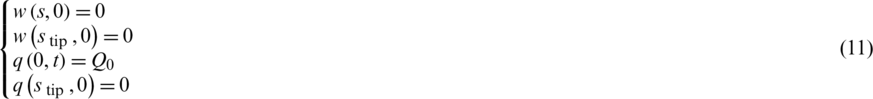
Since the above conditions are Neumann’s boundary conditions, not Dirichlet’s boundary conditions, in order to solve the equations, we need to make sure that the fluid pressure satisfies the global mass conservation law to yield a unique solution, such that

where  denotes the trajectory of HFs.
2.4 The Discretization Form of the Problem in XFEM
The extended finite element method (XFEM) was originally developed by Moes and Belytschko based on the partition of unity method (PUM), a key advantage of which is that the finite element mesh does not need to be updated to track the crack path in the problem of crack propagation. In XFEM, the solution space is enriched to differential equations with discontinuous functions. Accordingly, as shown in Fig. 3, displacement u(x) in the domain can be approximated as [8,20,25,29,30].
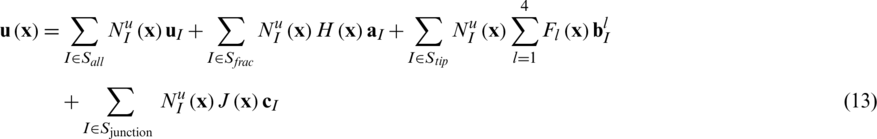
where Sall denotes the complete set of nodes in the mesh; Sfrac denotes the set of nodes whose supports are divided into two parts by the artificial fracture; Stip denotes the set of nodes whose supports contain the fracture tip; Sjunction denotes the set of nodes whose supports contain two intersecting fractures; N (x) denotes the standard finite element shape functions of node I; u
 denotes the standard nodal displacement vector; and a
 , b
, b (
( ; 4), and c
 denotes the enriched degree of freedom (DOF) vectors. H(x), Fl(x), and J(x) denote the enrichment shape functions accounting for the displacement jump across the fracture surfaces, the singular displacement field near the fracture tips, and the displacement field around the intersection point of two fractures, respectively, such that:


where ψm (x) and ψs(x) denote the signed distance functions of the main fracture and the secondary fracture, respectively. It can be seen that J(x) equals 1, −1, or 0 in different sub-domains created by the intersected fractures.

where Nw denotes the matrix of shape function that transforms the nodal displacement into fracture opening; and U denotes the unknown nodal displacement vector.

Figure 3: Schematics of enriched nodes of two crossing cracks
By substituting the XFEM approximation of displacement and Eq. (17) into the variational form of the stress equilibrium equations, we obtain the corresponding discretization schemes as follows [23,42–44].

Accordingly, the fluid pressure in the hydro-fractures can be approximated as:

where Shf denotes the set of nodes of the fluid pressure elements along the hydro-fracture; and  denotes the shape function of nodal fluid pressure pI at node I.
Similarly, we can substitute the above-mentioned FEM approximation into the variational forms of lubrication equation and use the forward Euler time discretization to address the time derivative in this equation. The corresponding discretization schemes of lubrication equation can be written as:

where  denotes the time step;
  denotes the unknown nodal pressure vector; and
  U denotes the increment of vector
  during time step
  .
.
In Eq. (18), the global stiffness matrix  is defined as follows:

where D denotes the contact stiffness of fracture interfaces; and B
 and B
and B , respectively, denote the B matrix based on standard shape function and enrichment shape function, as shown in Eq. (13).
Accordingly, the coupling matrix  and the external force vector F
 are respectively defined as


In Eq. (20), flow matrix  and source term
  are respectively written as:


2.5 The Fluid–Solid Coupling Strategy and the Related Algorithm
By combining Eqs. (18) with (20), we can obtain the fluid–solid coupling systems of the hydraulic fracturing problem as follows:

This fully coupled equation set is nonlinear since the cubic term of fracture permeability k exists in flow matrix  and the frictional interaction between fracture surfaces is also considered in global stiffness matrix
  . Therefore, the Newton–Raphson iterative algorithm is utilized to solve the nonlinear problem at each time step. The corresponding residual
  and Jacobian matrix
  at iteration step n are respectively expressed as:


Thus, the iterative scheme for the fully coupled equations at iteration step n can be written as:

This iteration process converges only when nodal fracture opening vector  and nodal fluid pressure vector
  simultaneously satisfy the following convergence criterion [43,45,46].

where  denotes the L2-norm operator; and
  and
and  denote the specified tolerance and take the value of 10−3 in this paper.
In order to verify our model, we compared the numerical results of 2D hydraulic fracturing based on the XFEM technique with the analytical solutions of the well-known KGD model (Geertsma & De Klerk). HFs can be categorized as toughness- or viscosity-dominated processes according to the dimensionless fracture toughness, which can be written as:

In the case of Km > 4, HFs are toughness-dominated, whereas in the case of Km < 0.5, they are viscosity-dominated [47–50].
In this verification model, the rectangular domain has a length of 100 m and a width of 180 m, and the injection point is located at the center of the edge-width. To reduce the amount of calculation that is necessary, the model is symmetric with respect to the edge-width. Using an injection rate of 0.001 m2/s, fracturing fluid with 1 mPa s viscosity is injected into the rectangular area for 30 s. The input parameters of the model are listed in Tab. 1. According to Eq. (31), Km is equal to 0.313 for this model, and thus the hydro-fracture belongs to viscosity-dominated propagation. The
  rectangular domain is divided into 3,080 quadrilateral elements in total. The initial half-length of hydraulic fracture is equal to 1.25 m. Using the aforementioned XFEM technique, the fracture width along the hydro-fracture and fluid pressure changes over time at the injection point can be calculated, as shown in Fig. 4. We observe that the XFEM results show very good agreement with the results of the analytical solutions of the KGD model [14,23,42,49,50].
Table 1: Input parameters of the 2D hydraulic fracturing problem

3.2 The Effect of the Length of the Upper/Lower Portion of the Cemented Natural Fracture on Crack Propagation
In the model shown in Fig. 2, the constant length of the cemented NF is equal to 6 m under the state of isotropic stress, which is the sum of the length of the upper portion of the NF,  , and the corresponding lower length,
  . The direction of the maximum horizontal principal stress is along the vertical axis. The input parameters of the model are listed in Tab. 2. The black line in Fig. 4 shows the hydro-fracture propagation paths when an HF is intersecting with a closed cemented NF. We observe that in all cases, the advancing HF diverts along the lower side of the NF and then kinks back to propagate along the original fracturing direction near the lower end of the NF. Because the ratio of
  and
and  is less than unity, the hydro-fracture will grow along the cemented natural fracture according to the HF–NF criterion presented in Section 2.3. The advancing hydro-fracture diverts back to the original fracturing direction, which can be attributed to the combined action of the local crack tip stress field and the far-field stress field. According to Irwin’s relation, the conversion between the energy release rate and fracture toughness can be written as:

where  is the plane-strain elastic modulus; E is the elastic modulus; and
  is Poisson’s ratio.
As shown in Fig. 5, there are two high tensile stress zones on the contour maps of maximum principle stress. One is near the intersection point of HF–NF; the other is in the neighborhood of crack tips. This shows that the failure mode is tensile-dominated near the two zones. However, the tensile stress value near the crack tips is greater than that near the intersection point, which is the reason that the diverted HF propagates along just one side of the NF.
Table 2: Input parameters of the model for HF–NF interaction


Figure 4: Results of the XFEM technique and of the analytical solutions: (a) Fluid pressure at the injection point (b) Fracture width
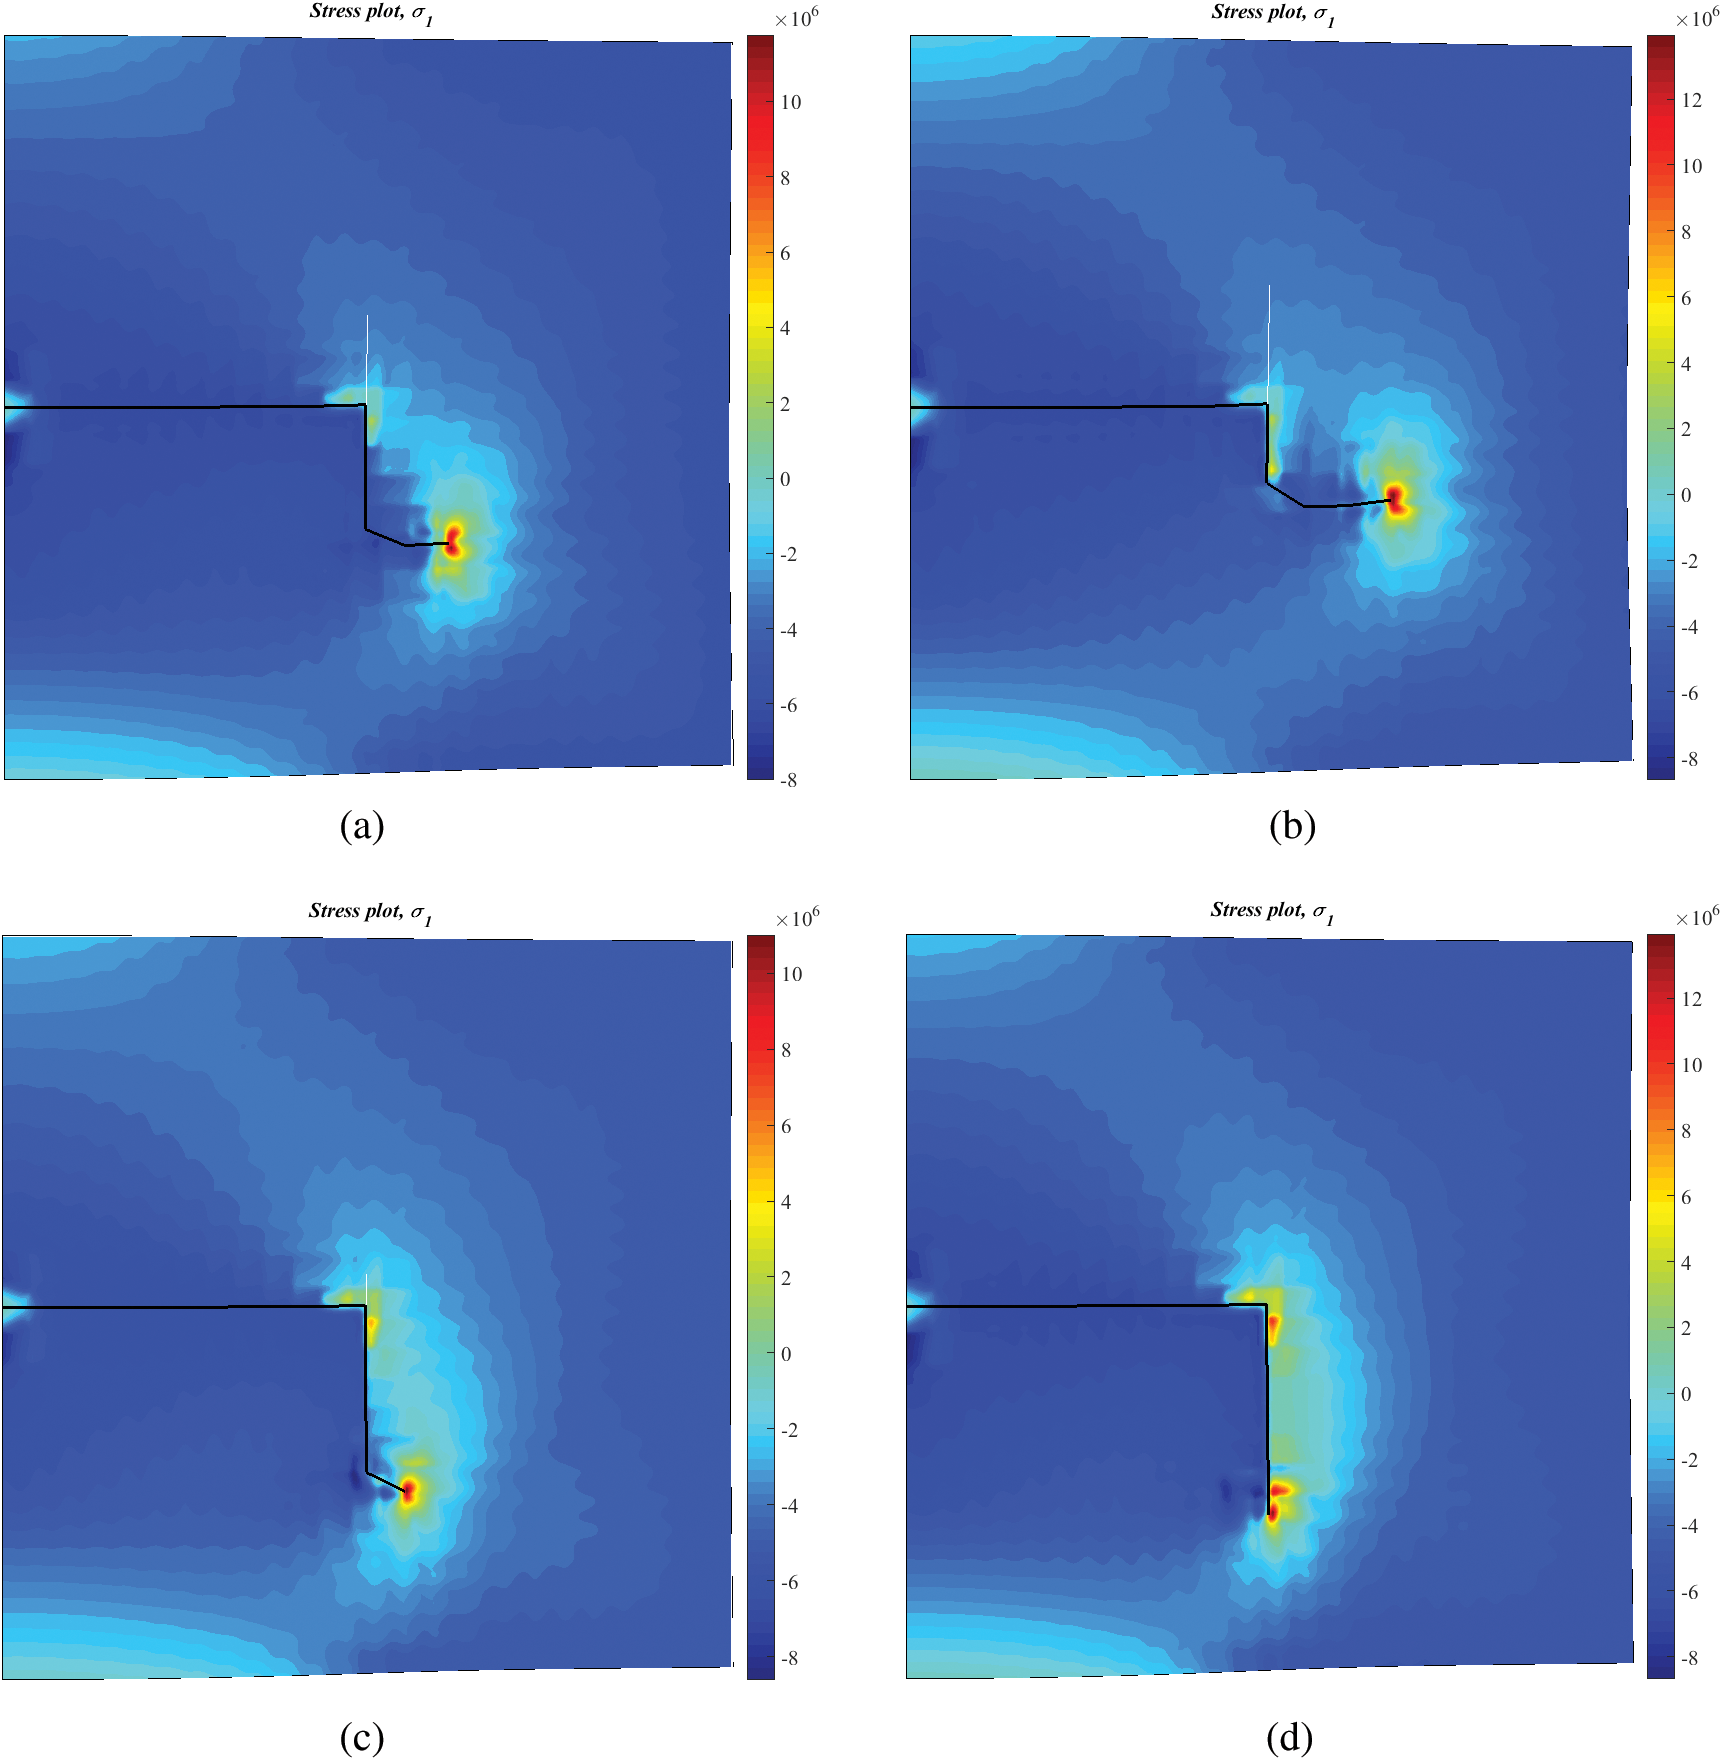
Figure 5: Maximum principal stress at different lengths of the lower and upper parts of a natural fracture: (a)  m,
m,  m; (b)
  m,
m,  m; (c)
  m,
m,  m; (d)
  m,
m,  m
m
The distributions of fracture width and shear slippage along the propagation paths are shown in Fig. 6. We observe that there is a saltation for the values of both the fracture opening and shear slippage near the HF–NF intersection point (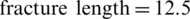 m). When the hydro-fracture propagates from the intersection point to the lower end of the cemented NF, the value of the shear slippage is greater than that of the fracture opening, which indicates that the failure mode in this zone is shear-dominated. When the hydro-fracture kinks back toward the rock matrix from the end of the NF, the value of the shear slippage is close to zero, which shows that the failure mode is tensile-dominated. Therefore, the hydro-fracture propagation will shift from shear fracture to tensile fracture after the HF–NF intersection. We also observe that shear slippage in the zone of the lower portion of the NF decreases as the lower length of the NF, i.e.,
  , increases, while the variation tendency of the fracture width in the same zone is the opposite. This indicates that an increase in the length of the lower portion of the NF promotes tensile failure and weakens shear failure.
The curves of stress intensify factors  and
and  of the lower crack tip at each fracturing step are plotted in Fig. 7. When the fracturing step moves from 6 to 8 (corresponding to the lower portion of the NF), the value of
  peaks while the value of
  reaches its minimum. After fracturing step 8,
  is reduced to zero, and
  is much greater than
  . The variation in stress intensify factors is consistent with that of fracturing width and shear slippage.
The net pressure distribution along the fracture length at different levels of NF length is shown in Fig. 8. We observe that the net pressure along the hydro-fracture increases as the length of the lower portion of the NF decreases, except in the case of  m. The reason is that opening the lower portion of NF requires a higher shear stress for the shorter length of the lower portion of the NF in Fig. 4. While the length of the lower portion of NF is equal to 6 m, the hydro-fracture just reaches the lower end of the NF at fracturing step 10. Therefore, it requires more energy to make the advancing hydro-fracture kink back toward the rock matrix.

Figure 6: Distribution of fracture width and shear slippage along the hydro-fracture length at different levels of natural fracture length: (a) Fracture width (b) Shear slippage

Figure 7: Distributions of stress intensify factors of the lower crack tip for each fracturing step at different levels of natural fracture length: (a)  ; (b)
; (b) 
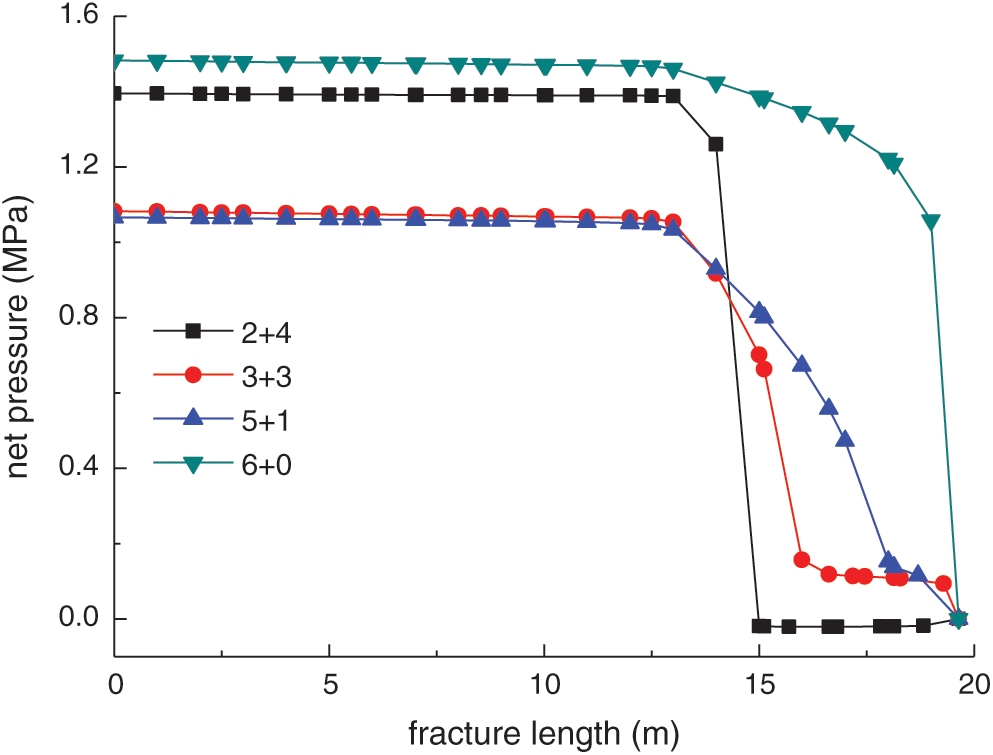
Figure 8: Net pressure distribution along the fracture length at different levels of natural fracture length
3.3 The Effect of Horizontal Stress Anisotropy on Crack Propagation
In this section, we use the parameters listed in Tab. 1 to investigate the effect of horizontal stress anisotropy on the HF–NF interaction. The x-axis along the HF coincides with the perpendicular bisector of the cemented NF with a length of 6 m. The direction of maximum principal stress is along the vertical y-axis direction, and its crack propagation paths at different levels of horizontal differential principal stress are as shown in Fig. 9. These paths correspond to 0, 1, 3, and 5 MPa. We observe that horizontal stress anisotropy has an obvious impact on the growth of the advancing hydro-fracture. In all cases, the HF will first be arrested by the NF before propagating only along the lower portion of the NF. The HF diverts into the rock matrix when it subsequently arrives at the lower tip of the NF. Under the combined action of the far–field stress and the local crack tip stress field, the stronger the horizontal stress anisotropy is, the more likely the diverted HF is to deviate from the direction of the original HF, i.e., the horizontal x-axis direction.

Figure 9: Maximum principal stress at different levels of horizontal differential stress: (a)  MPa,
MPa,  MPa; (b)
  MPa,
MPa,  MPa; (c)
  MPa,
MPa,  MPa; (d)
  MPa,
MPa,  MPa
MPa
From the contour maps of maximum principal stress shown in Fig. 9, we are able to observe that tensile stress zones exist at the intersection point of HF–NF and at the lower tip portion of the NF, which can explain why the advancing HF is arrested by the NF before propagating in a single side direction. With the increase in horizontal stress anisotropy, the tensile stress zone expands below the lower portion of the NF, as shown by the green/yellow color region of Fig. 9c. Therefore, the diverted HF grows away from the horizontal direction more easily.
The distribution of fracture width and shear slippage along the hydro-fracture length at different levels of horizontal differential stress is shown in Fig. 10. We observe the same result as in Fig. 6, i.e., there is abrupt change in both the fracture opening and shear slippage in the vicinity of the HF–NF intersection point. When the HF enters the lower portion of the NF, the fracture width is approximately equal to 1 mm, while the shear slippage ranges from 2 to 3 mm. Obviously, the failure mode is shear-dominated in this segment of the lower portion of the NF. When the HF is diverted into the rock matrix, the fracture opening is greater than the value of the shear slippage. This indicates that the failure mode of the diverted HF is tensile-dominated. Therefore, we conclude that the failure mode shifts from the shear-dominated regime to the tensile-dominated regime after the HF–NF interaction, which is consistent with the result in Fig. 6. In addition, under the condition of increased horizontal stress anisotropy, the values of the fracture opening and shear slippage decrease when the fracture length is less than 12.5 m (corresponding to the primary hydro-fracture). However, when the advancing HF is arrested by the NF, the fracture opening is augmented and the shear slippage decreases with the increase in horizontal stress anisotropy. In this study, we demonstrate that strong stress anisotropy weakens the tendency of shear failure while enhancing the tendency of tensile failure in the segment of the lower portion of the NF.

Figure 10: Distribution of fracture width and shear slippage along the hydro-fracture length at different levels of horizontal differential stress: (a) Fracture width; (b) Shear slippage
The curves of stress intensify factors  and
and  of the lower crack tip at each fracturing step are shown in Fig. 11. From the sixth to the eighth fracturing step, the HF propagates along the lower portion of the NF. We can see that the value of
  peaks at the eighth fracturing step, while
  reaches its minimum value during the same steps. Afterwards,
  sharply decreases and
  sharply increases. This indicates that the HF failure mode shifts from the shear regime to the tensile regime, which is consistent with the analytical results of the fracture opening and shear slippage in Fig. 10.

Figure 11: Distributions of stress intensify factors of the lower crack tip for each fracturing step at different levels of natural fracture length: (a)  ; (b)
; (b) 
The net pressure distribution along the fracture length at different levels of horizontal differential stress is shown in Fig. 12. We observe that the net pressure along the hydro-fracture decreases as horizontal stress anisotropy increases, except in the case of  MPa. However, the net pressure increases when the diverted HF kinks back toward the rock matrix. This is because higher tensile stress is needed to split the rock matrix. Therefore, it requires more energy to make the advancing hydro-fracture kink back toward the rock matrix.

Figure 12: Net pressure distribution along the fracture length at different levels of horizontal differential stress
3.4 The Effect of the Approach Angle on Crack Propagation
In this section, the effect of the approach angle on the propagation of an HF is numerically investigated based on input parameters similar to those listed in Tab. 1. In the isotropic stress state, we observe that the approach angle has a strong impact on the extension paths of the HF, as shown in Fig. 13. For all four cases, i.e., 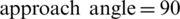 degrees, 60 degrees, 45 degrees, and 30 degrees, the HF is arrested by the cemented NF and can then propagate on only one side along the lower/upper portion of the NF before finally kinking back toward the rock matrix. For the latter three cases, the HF propagates along the upper side of the NF, while it extends along the lower side in the case of
  degrees. We also observe that with the decrease in the approach angle, the diverted HF is more likely to kink back toward the rock matrix.
The contour maps of maximum principal stress at different approach angles are shown in Fig. 13. We observe that there is a tensile stress zone in the vicinity of one side of the crack tips, while the relatively weak tensile zone disappears with a decrease in the approach angle. This indicates that it is most difficult to make the primary HF divert/kink back toward the rock matrix in the case of  degrees.
The distribution of fracture width and shear slippage along the hydro-fracture length at different approach angles is shown in Fig. 14. We observe that there is an abrupt change in both the fracture opening and shear slippage along the fracture length. The value of this sudden change peaks in the case of  degrees. In the cases of decreased approach angles, the values are comparatively small. We verify that the HF is easy to divert in the context of a small approach angle. For
  degrees, the fracture opening at the interval with a 12.5 to 15 m fracture length is close to zero, and the corresponding shear slippage is about 4 mm. For
  degrees, 45 degrees, and 30 degrees, the fracture opening is more than 2 mm, and the corresponding shear slippage is about 2 mm. This demonstrates the failure mode transition from the shear regime to the tensile regime with the decrease in the approach angle.
The curves of stress intensify factors  and
and  of a single-side crack tip at each fracturing step are shown in Fig. 15. We can see that the value of
  peaks around the sixth to eighth fracturing step, while the value of
  reaches its minimum during the same steps. Afterwards,
  sharply decreases while
  maintains its relatively high value. This indicates that the HF failure mode shifts from the shear regime to the tensile regime, which agrees well with the result in Fig. 14.
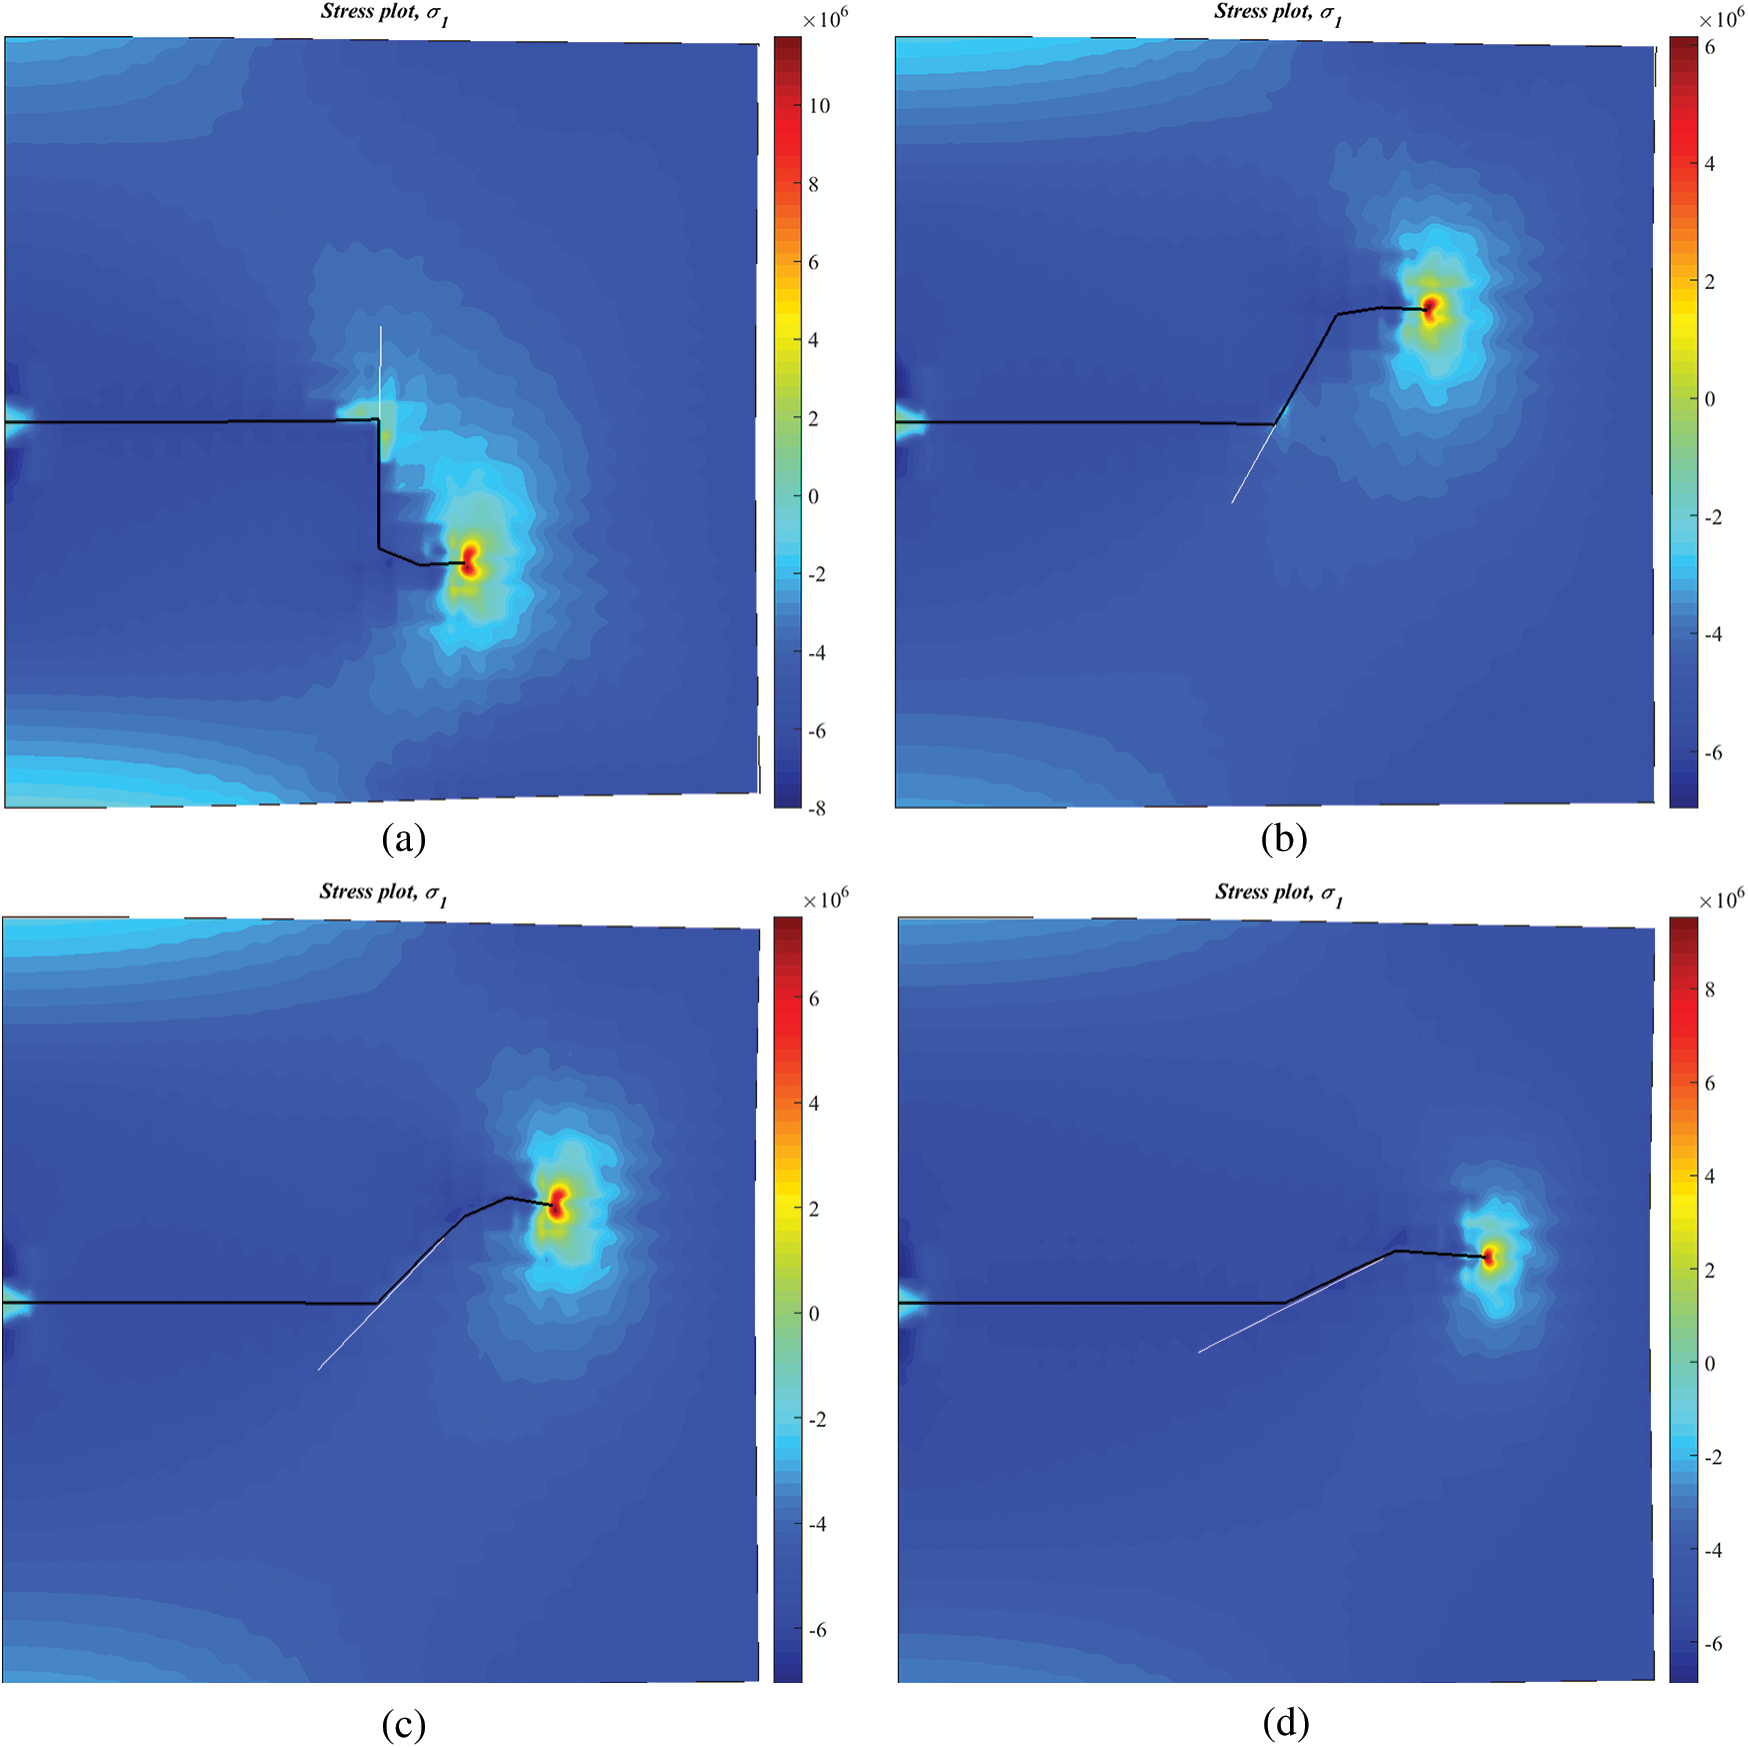
Figure 13: Maximum principal stress at different approach angles: (a)  degrees; (b)
  degrees; (c)
  degrees; (d)
  degrees
The net pressure distribution along the fracture length at different levels of horizontal differential stress is shown in Fig. 16. For the approach angle  degrees, the net pressure at the interval with a 12.5 to 15 m fracture length undergoes a sudden change, while the corresponding sudden change for the non-orthogonal approach angle becomes weak. For the non-orthogonal approach angle, the net pressure experiences a sudden change only when the HF kinks back toward the rock matrix.
The main difference between frictional natural fracture and cemented natural fracture is that natural fracture contains calcite cement [14,15]. There is not calcite cement in frictional natural fractures, but the two fracture surfaces are in contact. In order to better understand the mechanical interaction between HFs and cemented NFs, we compared the crack propagation behavior of uncemented NFs and cemented NFs, as shown in Fig. 17. In the case of an interaction between an HF and an uncemented NF, the advancing HF will propagate along the two sides of the NF. This is quite different from the case of a cemented NF. The tensile stress zone can be only seen in the vicinity of the crack tips after approaching the frictional NF. This indicates that the failure mode is tensile-dominated throughout the interaction process. A comparison of the fracture opening and shear slippage between uncemented NFs and cemented NFs is shown in Fig. 17b. For convenience, the crack propagation path is depicted along the upper side of the NF in both cases. It is obvious that their fracture openings are very close, while the shear slippage of the cemented NF is much greater than that of the uncemented NF. This is very consistent with the results of failure mode. Wang et al.’s simulated numerical results indicated that uncemented NFs attract the propagating crack, causing a higher stress intensity factor compared to that of the cemented NFs. The findings in this study support those of Wang et al. [3].

Figure 14: Distribution of fracture width and shear slippage along the hydro-fracture length at different approach angles: (a) Fracture width; (b) Shear slippage
We numerically simulate the crack propagation paths when an HF is approaching two NFs, as shown in Fig. 18. For frictional NFs, the HF will extend along the upper and lower directions, thereby forming a complex fracture network. For cemented NFs, the HF can only propagate along one side direction. Therefore, the fracture network of cemented NFs is relatively simple compared to that of uncemented NFs.

Figure 15: Distributions of stress intensify factors of the lower crack tip for each fracturing step at different levels of natural fracture length: (a)  ; (b)
; (b) 
Figure 16: Net pressure distribution along the fracture length at different approach angles

Figure 17: Comparison of crack propagation behavior between uncemented NFs and cemented NFs: (a) The maximum principal stress for the interaction between an HF and uncemented NF (b) The fracture opening and shear slippage between an uncemented NF and a cemented NF

Figure 18: Comparison of crack propagation paths between uncemented NFs and cemented NFs: (a) One HF and two uncemented NFs; (b) One HF and two cemented NFs
Using the XFEM technique, this paper systematically analyzed the mechanical mechanism of HF behavior in cemented formations. Mechanical factors include maximum principal stress, stress intensify factors, and shear slippage. Key factors in crack propagation, such as the length of the upper/lower portion of the cemented NF, horizontal stress anisotropy, and the approach angle, were investigated in detail. Our preliminary conclusions are as follows:
1. When an HF encounters a cemented NF, the growing HF is more likely to propagate along only one side of the NF. The corresponding mechanical mechanism lies in that the tensile stress zone is mainly located on one side of the crack tip of the NF, while the value of the stress intensify factor on the other side is approximately equal to zero. After crossing the intersection point, the failure mode along the cemented NF shifters from the tensile-dominated regime to the shear-dominated regime. Meanwhile, shear slippage is greater than the fracture opening along the NF path, and the value of the fracturing width is very small. When the advancing HF kinks back toward the rock matrix, the failure mode shifts back to the tensile-dominated regime.
2. Key factors such as the length of the upper/lower portion of the cemented NF, horizontal stress anisotropy, and the approach angle have a non-negligible effect on crack propagation paths. Under the given conditions, an increase in the length of the lower portion of the cemented NF or horizontal stress anisotropy will promote tensile failure and weaken shear failure, and the net pressure along the HF increases as the length of the lower portion of the NF decreases. The approach angle has a strong impact on the extension paths of the HF. With a decrease in the approach angle, the failure mode shifts from the shear regime to the tensile regime.
3. When an HF encounters an uncemented NF, the advancing HF will propagate along the two sides of the NF, which is quite different from the case of the cemented NF. The failure mode is mainly tensile-dominated throughout the interaction process. The shear slippage of the cemented NF is much greater than that of the uncemented NF. This is very consistent with the results of failure mode. Uncemented NFs will form more complex fracture networks than cemented NFs. The results in this paper provide new insight into the mechanisms of fracture network generation. Future research should consider the primary and secondary relations of various factors using a combination of experiments and numerical calculations.
Acknowledgement: The authors wish to express their appreciation to the reviewers for their helpful suggestions which greatly improved the presentation of this paper.
Funding Statement: This work was financially supported by the National Science Foundation of China (Grant Nos. 51804033 and 51936001), Natural Science Foundation of Jiangsu Province (Grant No. BK20170457), Program of Great Wall Scholar (Grant No. CIT&TCD20180313) and Jointly Projects of Beijing Natural Science Foundation, Beijing Municipal Education Commission (Grant No. KZ201810017023), and Beijing Youth Talent Support Program (CIT & TCD201804037).
Conflicts of Interest: The authors declare that they have no conflicts of interest to report regarding the present study.
1. Dahi Taleghani, A. (2009). Analysis of hydraulic fracture propagation in fractured reservoirs : An improved model for the interaction between induced and natural fractures, The University of Texas at Austin, https://repositories.lib.utexas.edu/handle/2152/18381. [Google Scholar]
2. Taleghani, A. D., Olson, J. E. (2014). How natural fractures could affect hydraulic-fracture geometry. SPE Journal, 19(1), 161–171. DOI 10.2118/167608-PA. [Google Scholar] [CrossRef]
3. Wang, W., Olson, J. E., Prodanović, M., Schultz, R. A. (2018). Interaction between cemented natural fractures and hydraulic fractures assessed by experiments and numerical simulations. Journal of Petroleum Science and Engineering, 167, 506–516. DOI 10.1016/j.petrol.2018.03.095. [Google Scholar] [CrossRef]
4. Ye, Z., Janis, M., Ghassemi, A. (2017). Injection-driven shear slip and the coupled permeability evolution of granite fractures for EGS stimulation. 51st U.S. Rock Mechanics/Geomechanics Symposium, American Rock Mechanics Association, San Francisco, California. https://www.onepetro.org/conference-paper/ARMA-2017-0227. [Google Scholar]
5. Chen, Y., Ma, G., Jin, Y., Wang, H., Wang, Y. (2019). Productivity evaluation of unconventional reservoir development with three-dimensional fracture networks. Fuel, 244, 304–313. DOI 10.1016/j.fuel.2019.01.188. [Google Scholar] [CrossRef]
6. Ren, Z., Yan, R., Huang, X., Liu, W., Yuan, S. et al. (2019). The transient pressure behavior model of multiple horizontal wells with complex fracture networks in tight oil reservoir. Journal of Petroleum Science and Engineering, 173, 650–665. DOI 10.1016/j.petrol.2018.10.029. [Google Scholar] [CrossRef]
7. Wang, D., Zlotnik, S., Diez, P., Ge, H., Zhou, F. et al. (2020). A numerical study on hydraulic fracturing problems via the proper generalized decomposition method. Computer Modeling in Engineering & Sciences, 122(2), 703–720. DOI 10.32604/cmes.2020.08033. [Google Scholar] [CrossRef]
8. Xue, Y., Teng, T., Dang, F., Ma, Z., Wang, S. et al. (2020). Productivity analysis of fractured wells in reservoir of hydrogen and carbon based on dual-porosity medium model. International Journal of Hydrogen Energy, 45(39), 20240–20249. DOI 10.1016/j.ijhydene.2019.11.146. [Google Scholar] [CrossRef]
9. Feng, Y., Jones, J. F., Gray, K. E. (2016). A review on fracture-initiation and -propagation pressures for lost circulation and wellbore strengthening. SPE Drilling & Completion, 31(2), 134–144. DOI 10.2118/181747-PA. [Google Scholar] [CrossRef]
10. Dehghan, A. N., Goshtasbi, K., Ahangari, K., Jin, Y., Bahmani, A. (2017). 3D Numerical modeling of the propagation of hydraulic fracture at its intersection with natural (pre-existing) fracture. Rock Mechanics and Rock Engineering, 50(2), 367–386. DOI 10.1007/s00603-016-1097-7. [Google Scholar] [CrossRef]
11. Li, Y., Jia, D., Rui, Z., Peng, J., Fu, C. et al. (2017). Evaluation method of rock brittleness based on statistical constitutive relations for rock damage. Journal of Petroleum Science and Engineering, 153, 123–132. DOI 10.1016/j.petrol.2017.03.041. [Google Scholar] [CrossRef]
12. Oyelowo, I., Wainer, G., Echegini, N. S., Boi-Ukeme, J., Zlotnik, S. (2018). Cell-devs modeling and simulation of artificial hydraulic fracturing of rocks in boreholes. Proceedings of the Theory of Modeling and Simulation Symposium, pp. 1–12, Society for Computer Simulation International, Kuala Lampur, Malaysia. [Google Scholar]
13. Liu, J., Liang, X., Xue, Y., Yao, K., Fu, Y. (2020). Numerical evaluation on multiphase flow and heat transfer during thermal stimulation enhanced shale gas recovery. Applied Thermal Engineering, 178, 115554. DOI 10.1016/j.applthermaleng.2020.115554. [Google Scholar] [CrossRef]
14. Wang, X. L., Shi, F., Liu, C., Lu, D. T., Liu, H. et al. (2018). Extended finite element simulation of fracture network propagation in formation containing frictional and cemented natural fractures. Journal of Natural Gas Science and Engineering, 50, 309–324. DOI 10.1016/j.jngse.2017.12.013. [Google Scholar] [CrossRef]
15. Gale, J. F. W., Laubach, S. E., Olson, J. E., Eichhubl, P., Fall, A. (2014). Natural fractures in shale: A review and new observations. AAPG Bulletin, 98(11), 2165–2216. DOI 10.1306/08121413151. [Google Scholar] [CrossRef]
16. Klimenko, D., Taleghani, A. D. (2018). A modified extended finite element method for fluid-driven fractures incorporating variable primary energy loss mechanisms. International Journal of Rock Mechanics and Mining Sciences, 106, 329–341. DOI 10.1016/j.ijrmms.2018.04.012. [Google Scholar] [CrossRef]
17. Zhou, J., Chen, M., Jin, Y., Zhang, G. (2008). Analysis of fracture propagation behavior and fracture geometry using a tri-axial fracturing system in naturally fractured reservoirs. International Journal of Rock Mechanics and Mining Sciences, 45(7), 1143–1152. DOI 10.1016/j.ijrmms.2008.01.001. [Google Scholar] [CrossRef]
18. Chuprakov, D., Melchaeva, O., Prioul, R. (2014). Injection-sensitive mechanics of hydraulic fracture interaction with discontinuities. Rock Mechanics and Rock Engineering, 47(5), 1625–1640. DOI 10.1007/s00603-014-0596-7. [Google Scholar] [CrossRef]
19. van Dam, D. B., de Pater, C. J., Romijn, R. (1998). Analysis of hydraulic fracture closure in laboratory experiments. SPE/ISRM Rock Mechanics in Petroleum Engineering, Society of Petroleum Engineers, 15(3), 151–158. DOI 10.2118/47380-MS. [Google Scholar] [CrossRef]
20. Blanton, T. L. (1982). An experimental study of interaction between hydraulically induced and pre-existing fractures. SPE Unconventional Gas Recovery Symposium, Society of Petroleum Engineers, Pittsburgh, Pennsylvania. [Google Scholar]
21. Warpinski, N. R., Teufel, L. W. (1987). Influence of geologic discontinuities on hydraulic fracture propagation. Journal of Petroleum Technology, 39(2), 209–220. DOI 10.2118/13224-PA. [Google Scholar] [CrossRef]
22. Gu, H., Weng, X., Lund, J., Mack, M., Ganguly, U. et al. (2012). Hydraulic fracture crossing natural fracture at nonorthogonal angles: A criterion and its validation. SPE Production & Operations, 27(1), 20–26. DOI 10.2118/139984-PA. [Google Scholar] [CrossRef]
23. Shi, F., Wang, X., Liu, C., Liu, H., Wu, H. (2017). An XFEM-based method with reduction technique for modeling hydraulic fracture propagation in formations containing frictional natural fractures. Engineering Fracture Mechanics, 173, 64–90. DOI 10.1016/j.engfracmech.2017.01.025. [Google Scholar] [CrossRef]
24. Sheng, M., Li, G., Sutula, D., Tian, S., Bordas, S. P. A. (2018). XFEM modeling of multistage hydraulic fracturing in anisotropic shale formations. Journal of Petroleum Science and Engineering, 162, 801–812. DOI 10.1016/j.petrol.2017.11.007. [Google Scholar] [CrossRef]
25. Wang, D., Shi, F., Yu, B., Sun, D., Li, X. et al. (2018). A numerical study on the diversion mechanisms of fracture networks in tight reservoirs with frictional natural fractures. Energies, 11(11), 3035. DOI 10.3390/en11113035. [Google Scholar] [CrossRef]
26. Zhang, X., Jeffrey, R. G. (2006). The role of friction and secondary flaws on deflection and re-initiation of hydraulic fractures at orthogonal pre-existing fractures. Geophysical Journal International, 166(3), 1454–1465. DOI 10.1111/j.1365-246X.2006.03062.x. [Google Scholar] [CrossRef]
27. Roth, S. N., Leger, P., Soulaimani, A. (2020). Strongly coupled XFEM formulation for non-planar three-dimensional simulation of hydraulic fracturing with emphasis on concrete dams. Computer Methods in Applied Mechanics and Engineering, 363, 112899. DOI 10.1016/j.cma.2020.112899. [Google Scholar] [CrossRef]
28. Zheng, H., Pu, C., Sun, C. (2020). Study on the interaction between hydraulic fracture and natural fracture based on extended finite element method. Engineering Fracture Mechanics, 230, 106981. DOI 10.1016/j.engfracmech.2020.106981. [Google Scholar] [CrossRef]
29. Roth, S. N., Leger, P., Soulaimani, A. (2020). Fully-coupled hydro-mechanical cracking using XFEM in 3D for application to complex flow in discontinuities including drainage system. Computer Methods in Applied Mechanics and Engineering, 370, 113282. DOI 10.1016/j.cma.2020.113282. [Google Scholar] [CrossRef]
30. Suri, Y., Islam, S. Z., Hossain, M. (2020). Proppant transport in dynamically propagating hydraulic fractures using CFD-XFEM approach. International Journal of Rock Mechanics and Mining Sciences, 131, 104356. DOI 10.1016/j.ijrmms.2020.104356. [Google Scholar] [CrossRef]
31. Wang, D., Zhou, F., Ding, W., Ge, H., Jia, X. et al. (2015). A numerical simulation study of fracture reorientation with a degradable fiber-diverting agent. Journal of Natural Gas Science and Engineering, 25, 215–225. DOI 10.1016/j.jngse.2015.05.002. [Google Scholar] [CrossRef]
32. Feng, Y., Gray, K. E. (2018). Modeling of curving hydraulic fracture propagation from a wellbore in a poroelastic medium. Journal of Natural Gas Science and Engineering, 53, 83–93. DOI 10.1016/j.jngse.2018.02.020. [Google Scholar] [CrossRef]
33. Khoei, A. R. (2014). Extended finite elementMethod: theory and applications. 1st edition. London: Wiley. [Google Scholar]
34. Yew, C. H., Weng, X. (2015). Chapter 1-fracturing of a wellbore and 2D fracture models. In: Yew, C. H., Weng, X. (eds.Mechanics of hydraulic fracturing. 2nd edition. Boston: Gulf Professional Publishing, pp. 1–22. [Google Scholar]
35. Yu, H., Taleghani, A. D., Lian, Z. (2019). On how pumping hesitations may improve complexity of hydraulic fractures, a simulation study. Fuel, 249, 294–308. DOI 10.1016/j.fuel.2019.02.105. [Google Scholar] [CrossRef]
36. Yu, H., Taleghani, A. D., Lian, Z., Lin, T. (2020). On how asymmetric stimulated rock volume in shales may impact casing integrity. Energy Science & Engineering, 8(5), 1524–1540. DOI 10.1002/ese3.610. [Google Scholar] [CrossRef]
37. Erdogan, F., Sih, G. C. (1963). On the crack extension in plates under plane loading and transverse shear. Journal of Basic Engineering, 85(4), 519–525. DOI 10.1115/1.3656897. [Google Scholar] [CrossRef]
38. Li, Y., Jia, D., Wang, M., Liu, J., Fu, C. et al. (2016). Hydraulic fracturing model featuring initiation beyond the wellbore wall for directional well in coal bed. Journal of Geophysics and Engineering, 13(4), 536–548. DOI 10.1088/1742-2132/13/4/536. [Google Scholar] [CrossRef]
39. Gupta, P., Duarte, C. A. (2014). Simulation of non-planar three-dimensional hydraulic fracture propagation. International Journal for Numerical and Analytical Methods in Geomechanics, 38(13), 1397–1430. DOI 10.1002/nag.2305. [Google Scholar] [CrossRef]
40. Weber, N., Siebert, P., Willbrand, K., Feinendegen, M., Clauser, C. et al. (2013). The XFEM with an explicit-implicit crack description for hydraulic fracture problems. ISRM International Conference for Effective and Sustainable Hydraulic Fracturing, International Society for Rock Mechanics and Rock Engineering, Brisbane, Australia. [Google Scholar]
41. Mohammadnejad, T., Andrade, J. E. (2016). Numerical modeling of hydraulic fracture propagation, closure and reopening using XFEM with application to in-situ stress estimation. International Journal for Numerical and Analytical Methods in Geomechanics, 40(15), 2033–2060. DOI 10.1002/nag.2512. [Google Scholar] [CrossRef]
42. Wang, D., Dong, Y., Sun, D., Yu, B. (2020). A three-dimensional numerical study of hydraulic fracturing with degradable diverting materials via CZM-based FEM. Engineering Fracture Mechanics, 237, 107251. DOI 10.1016/j.engfracmech.2020.107251. [Google Scholar] [CrossRef]
43. Ren, Q. W., Dong, Y. W., Yu, T. T. (2009). Numerical modeling of concrete hydraulic fracturing with extended finite element method. Science in China Series E: Technological Sciences, 52(3), 559–565. DOI 10.1007/s11431-009-0058-8. [Google Scholar] [CrossRef]
44. Lecampion, B. (2009). An extended finite element method for hydraulic fracture problems. Communications in Numerical Methods in Engineering, 25(2), 121–133. DOI 10.1002/cnm.1111. [Google Scholar] [CrossRef]
45. Gordeliy, E., Peirce, A. (2015). Enrichment strategies and convergence properties of the XFEM for hydraulic fracture problems. Computer Methods in Applied Mechanics and Engineering, 283, 474–502. DOI 10.1016/j.cma.2014.09.004. [Google Scholar] [CrossRef]
46. Fu, P., Johnson, S. M., Carrigan, C. R. (2013). An explicitly coupled hydro-geomechanical model for simulating hydraulic fracturing in arbitrary discrete fracture networks. International Journal for Numerical and Analytical Methods in Geomechanics, 37(14), 2278–2300. DOI 10.1002/nag.2135. [Google Scholar] [CrossRef]
47. Salimzadeh, S., Khalili, N. (2015). A three-phase XFEM model for hydraulic fracturing with cohesive crack propagation. Computers and Geotechnics, 69, 82–92. DOI 10.1016/j.compgeo.2015.05.001. [Google Scholar] [CrossRef]
48. Haddad, M., Sepehrnoori, K. (2016). XFEM-based CZM for the simulation of 3d multiple-cluster hydraulic fracturing in Quasi-Brittle shale formations. Rock Mechanics and Rock Engineering, 49(12), 4731–4748. DOI 10.1007/s00603-016-1057-2. [Google Scholar] [CrossRef]
49. Bunger, A. P., Detournay, E., Garagash, D. I. (2005). Toughness-dominated hydraulic fracture with leak-off. International Journal of Fracture, 134(2), 175–190. DOI 10.1007/s10704-005-0154-0. [Google Scholar] [CrossRef]
50. Chen, Z. (2012). Finite element modelling of viscosity-dominated hydraulic fractures. Journal of Petroleum Science and Engineering, 88–89, 136–144. DOI 10.1016/j.petrol.2011.12.021. [Google Scholar] [CrossRef]
 | This work is licensed under a Creative Commons Attribution 4.0 International License, which permits unrestricted use, distribution, and reproduction in any medium, provided the original work is properly cited. |