| Computer Modeling in Engineering & Sciences |
DOI: 10.32604/cmes.2021.014808
ARTICLE
Experimental and Numerical Study on the Shear Strength and Strain Energy of Rock Under Constant Shear Stress and Unloading Normal Stress
1School of Highway, Chang’an University, Xi’an, 710064, China
2College of Geological Engineering and Geomatics, Chang’an University, Xi’an, 710064, China
3School of Civil and Transportation Engineering, Hebei University of Technology, Tianjin, 300401, China
*Corresponding Author: Da Huang. Email: dahuang@hebut.edu.cn
Received: 30 October 2020; Accepted: 22 December 2020
Abstract: Excavation and earth surface processes (e.g., river incision) always induce the unloading of stress, which can cause the failure of rocks. To study the shear mechanical behavior of a rock sample under unloading normal stress conditions, a new stress path for direct shear tests was proposed to model the unloading of stress caused by excavation and other processes. The effects of the initial stresses (i.e., the normal stress and shear stress before unloading) on the shear behavior and energy conversion were investigated using laboratory tests and numerical simulations. The shear strength of a rock under constant stress or under unloading normal stress conforms to the Mohr Coulomb criterion. As the initial normal stress increases, the cohesion decreases linearly and the tangent of the internal friction angle increases linearly. Compared with the results of the tests under constant normal stress, the cohesions of the rock samples under unloading normal stress are smaller and their internal friction angles are larger. A strength envelope surface can be used to describe the relationship between the initial stresses and the failure normal stress. Shear dilatancy can decrease the total energy of the direct shear test under constant normal stress or unloading normal stress, particularly when the stress levels (the initial stresses in the test under unloading normal stress or the normal stress in the test under constant normal stress) are high. The ratio of the dissipated energy to the total energy at the moment failure occurs decreases exponentially with increasing initial stresses. The direct shear test under constant normal stress can be considered to be a special case of a direct shear test under unloading normal stress with an unloading amount of zero.
Keywords: Unloading normal stress; direct shear test; strain energy; energy conversion
Shear failure is one of the fundamental forms of rock failure [1,2]. Many studies have been conducted on this topic [3–5]. Previous studies have focused on the shear behavior of rocks under constant normal stress [6,7]. The Mohr–Coulomb (M–C) criterion is widely used to describe the shear strength of rocks under this condition [8]. However, excavation and several earth surface processes (e.g., river incision) can decrease the stress in the disturbed zone in at least one direction, which can result in rock failure [9,10]. For instance, as shown in Fig. 1, the excavation of a deeply buried tunnel releases the stress on the surrounding rocks in the radial direction of openings [11–14]. According to the results obtained from numerical simulations (Fig. 1a), model tests (Fig. 1b), and theoretical solutions (Fig. 1c), the surrounding rock may fail in the form of shear slip, that is, the surrounding rock experiences shear failure. The rock surrounding of the deeply buried tunnel is subjected to compressive stress along the radial direction. However, the compressive stress decreases gradually during the excavation process. Taking a local area near the shear fracture as the shear element (Figs. 1a and 1b), as shown in Fig. 1d, the shear element is subjected to normal compressive stress and shear stress. Nevertheless, the direction of the normal displacement is opposite to that of the normal stress because the unloading occurs along the radial direction. In addition, the unloading in the direction perpendicular to the slope’s surface caused by excavation or river incision can induce landslide events due to the decrease in the shear resistance [15,16]. Triaxial and biaxial unloading tests are commonly used to model rock failure caused by stress unloading [13,17]. Nevertheless, neither the direct shear test nor the triaxial and biaxial unloading tests can directly and effectively model the shear failure of a rock experiencing unloading normal stress.
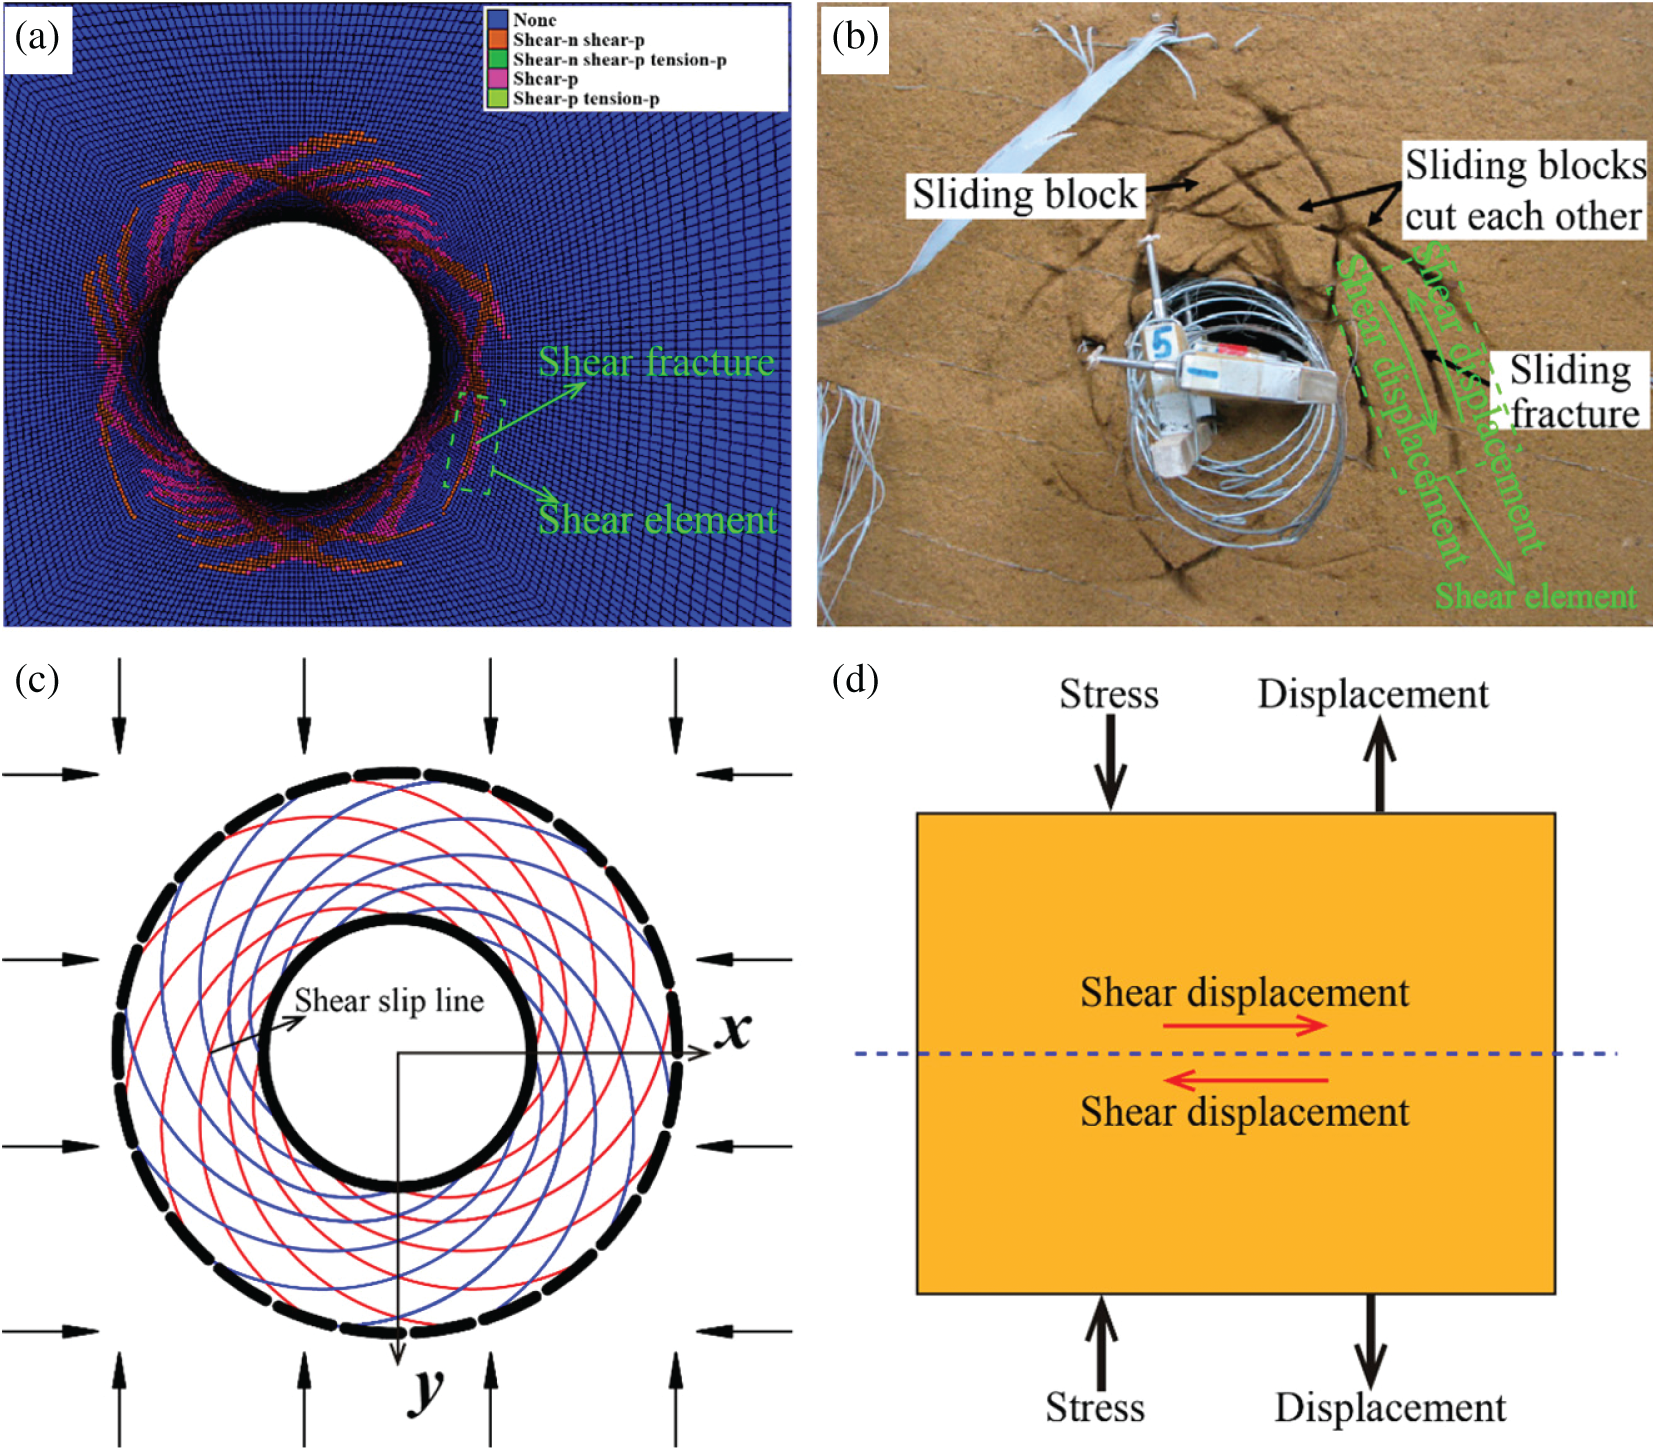
Figure 1: Shear failure patterns of a deeply buried tunnel produced using (a) a numerical simulation [11], (b) a model test [12], and (c) a theoretical solution and (d) a simplified shear element
In the rock failure process, energy is converted, including energy accumulation, dissipation, and release [17,18]. The laws of thermodynamics indicate that energy conversion is a basic factor controlling the physical processes of materials. Understanding the energy conversion process is significant to determining the rock failure mechanism. Tsoutrelis et al. [19] conducted uniaxial compressive tests on five sets of marble to study the correlations between the rock strength and the energy parameters. Peng et al. [20] conducted triaxial compressive tests and proposed a failure energy ratio and stress drop coefficient to describe the failure mode of coal. Huang et al. [17] and Li et al. [21] conducted triaxial unloading tests on marble and granite, respectively. Then, they analyzed the energy conversion process of the rock samples under unloading conditions. However, the energy conversion law of the direct shear test has rarely been reported.
In this study, a new loading path for direct shear tests is proposed to model the shear failure process of a rock under unloading normal stress caused by excavation or other processes. In the direct shear test under unloading normal stress (DSTUNS), the normal stress is gradually unloaded, while the shear stress remains unchanged. In addition, a direct shear test under constant normal stress (DSTCNS) was conducted for comparison and to determine the parameters. Laboratory tests and numerical simulations were conducted to compare the strength, failure, and energy evolution of the rock in the two types of direct shear tests.
2.1.1 Specimen Preparation and Test Program
The sandstone used in this study was collected from the Three Gorges Reservoir area of China, where there are a lot of landslides due to the rise and fall of reservoir water. Its average bulk density is 2390 kg/m3. According to the X-ray diffraction results, the main minerals of the sandstone mainly include quartz, illite, feldspar, and a small amount of magnetite and hematite. An intact rock block without observable bedding planes was cut and ground into cubic test samples with the side lengths of 60 mm. The upper and lower surface parallelism of the sample is controlled within
The direct shear tests were carried out using a compression-shear test machine with a loading capacity of 600 kN in both the vertical and horizontal directions. Fig. 2 shows the testing system and the auxiliary device comprised of two shear boxes and two rows of anti-friction balls. The vertical and horizontal actuators applied the normal compressive stress and the shear stress to the rock sample, respectively. The loading path shown in Fig. 3 is proposed to model the shear failure of the rock under unloading normal stress. The loading of the DSTUNS involved three steps:
Step 1: Load the normal stress to the target level at a constant loading rate of 0.1 kN/s. Name the target normal stress as initial normal stress (INS)
Step 2: Load the shear stress to the desired level at a constant displacement rate of 0.1 mm/min while keeping the normal stress constant. Name the desired shear stress level as initial shear stress (ISS)
Step 3: Keep the shear stress constant and unload the normal stress at an unloading rate of 0.1 kN/s until the rock sample fails.
During unloading (Step 3), the shear failure occurring in the middle of the rock sample is caused by both the decrease in the normal compressive stress and the constant shear stress. As is well known, there is a positive correlation between the shear resistance and the normal compressive stress of rock materials. Thus, the shear resistance of the sample gradually decreases with decreasing normal stress. When the shear resistance is less than the ISS, failure occurs.

Figure 2: Schematic of the direct compressive-shear test system and the auxiliary device

Figure 3: Loading path of the direct shear test under unloading normal stress
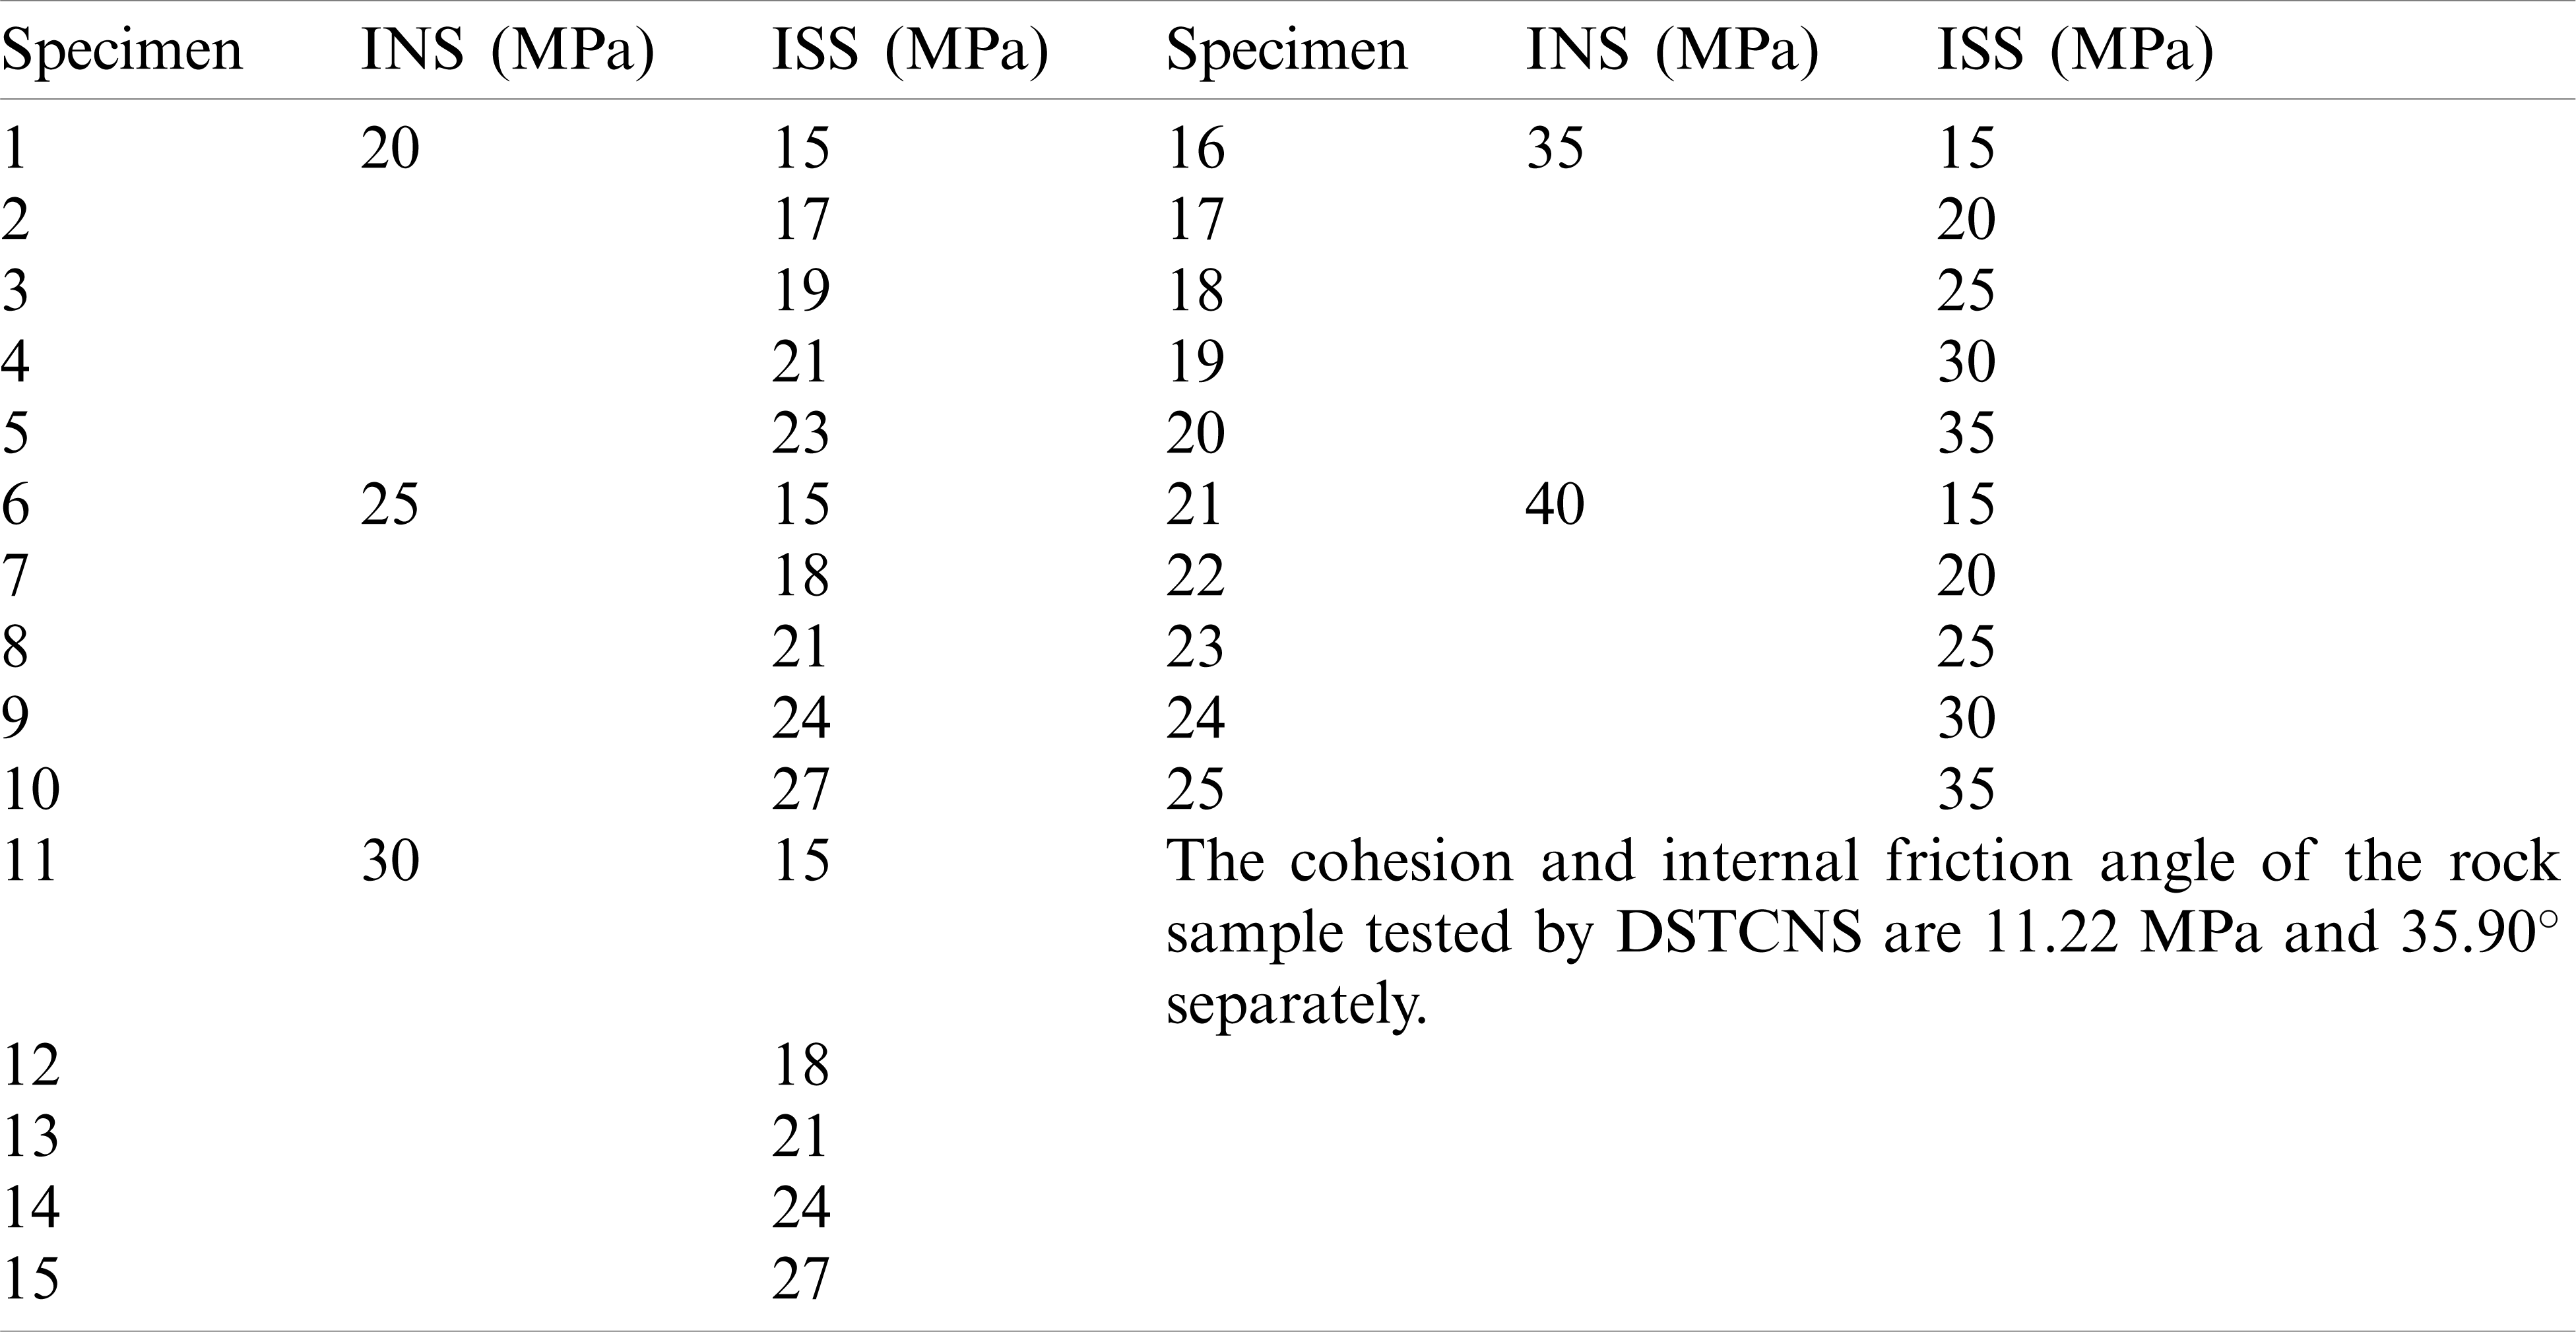
Prior to the beginning of unloading, the normal and shear stresses were applied. The shear resistance of the rock is related to the normal stress, cohesion, and friction angle. If the ISS is large enough or the INS is small enough, the sample may fail before unloading. Whereas it will not fail when the normal stress is unloaded to zero if the ISS is smaller than a certain value. Consequently, the DSTCNS was carried out to determine the values of the INS and ISS. Tab. 1 provides the detailed descriptions of the ISS and INS values of the rock samples. Herein, five test sets corresponding to five INS levels (20–40 MPa at a 5 MPa interval) were conducted. Each set included five ISS levels. In each set, the maximum ISS was less than the shear resistance under the given normal stress and was greater than the shear resistance under an INS of zero.
Table 1: Initial normal stress and initial shear stress
The two-dimension particle flow code (PFC2D) was used to perform the simulations of the DSTCNS and DSTUNS. The PFC2D simplifies the rock material into discs and bonds. Discs are assumed to be rigid bodies, but they can overlap each other. The adjacent discs are connected by a bond. The discs are used to simulate the rock grains, and the bonds are used to simulate the cement between the rock grains. The mechanical relationship between particles obeys the Newton’s second law:
The linear parallel bond model, which can transmit both force and moment between the pieces, is commonly used in rock mechanic simulations [22]. The force-displacement law for the parallel bond force and moment consists of seven steps: Update the bond cross-sectional properties, update normal force, update shear force, update twisting moment, update bending moment, update the maximum normal and shear stresses at the parallel bond periphery, and enforce the strength limits. In the last step, if the tensile or shear strength limit of a parallel bond is exceeded, then the bond is broken and a crack is formed. Thus, the PFC2D can simulate rock fracture and fracture propagation. In this respect, the finite element method and the finite difference method have obvious defects. In the PFC, the energy consists of boundary work U input by the walls, body work Ug done by gravity, strain energy Es stored in the linear springs, slip energy Ef dissipated by frictional slip, dashpot energy Ed dissipated by the dashpots, bond strain energy Eb stored in the parallel bonds, and kinetic energy Ek. According to the first law of thermodynamics, energy can be converted from one form to another, but the total energy remains unchanged. The total energy is the sum of the elastic strain energy Ue and the dissipated energy Ud:
where the elastic strain energy Ue includes the strain energy Es and the bond strain energy Eb; and the dissipated energy Ud includes the slip energy Ef, the dashpot energy Ed, and the kinetic energy Ek. In this study, the kinetic energy Ek is negligible due to the quasi-static nature of the simulation [23]. In addition, the body work Ug is equal to zero because gravity was set to zero. Thus, Eq. (2) can be rewritten as follows:
Strain energy, slip energy, dashpot energy, and bond strain energy can be calculated as follows:
In this study, the planar dimensions of the numerically simulated sample are the same as those of the sandstone sample used in the laboratory tests. As shown in Fig. 4, eight walls surround the numerically simulated sample. To establish the same boundary conditions used in the laboratory test, the two walls between walls 2 and 5 and walls 3 and 6 were deleted after the particles were bonded. During the test, walls 4, 5, and 6 were fixed in both the vertical and horizontal directions. The normal stress was applied and unloaded by moving the wall 2 vertically, and the shear stress was applied by moving walls 1–3 horizontally. The normal force was obtained by averaging the vertical forces of walls 1 and 4, and the shear force was obtained by adding the horizontal forces of walls 1, 2, and 3. A ratio of the maximum particle radius to the minimum particle radius of 1.5 and a minimum particle radius of 0.3 mm was adopted. The numerically simulated sample was discretized into 7,384 particles with 19,139 parallel bonds. The PFC2D code applied the stress by moving walls or particles, and the stress-controlled mode was difficult to implement. Thus, the normal and shear stresses were applied in the displacement-controlled mode with a constant displacement loading and unloading rate of 0.01 m/s. This loading rate is low enough for a rock static loading simulation using the PFC2D code [24–26].

Figure 4: Numerically simulated sample used in the simulation
There are no macro-parameters that reflect the mechanical characteristics of the rock material. It is essential to establish a correlation between the micro-parameters in the PFC2D code and the experimental macro-parameters of the tested sandstone sample. A parameter calibration should be performed for the micro-parameter selection. According to Huang et al. [22], the mechanical behavior is significantly influenced by the parallel bond’s tensile strength, the cohesion, the friction angle, and the ratio of the normal stiffness to the shear stiffness. The DSTCNS and the trial and error method were used for the calibration, and a set of reasonable parallel bond parameters were obtained (Tab. 2). Fig. 5 shows the comparison between the simulated and experimental results of the DSTCNS. The internal friction angel of the simulation was only 3.29% greater than that of the laboratory test. Although the relative error of the cohesion was relatively large (the simulated value was 21.66% less than the experimental value), the micro-parameters listed in Tab. 2 can still describe the shear strength of the tested sandstone well.
Table 2: Micro-parameters used for direct shear test


Figure 5: Comparison of the simulated and experimental results of the DSTCNS
Fig. 6 shows the typical curves of the normal and shear displacements versus elapsed time for the DSTUNS. The normal displacement increases nonlinearly during the loading of the normal stress due to the stress state of the uniaxial compression and the nonlinear relationship between the axial displacement and the axial stress. In the period of loading of the shear stress, the normal stress remains constant and the normal displacement decreases nonlinearly. During the unloading of the normal stress, the shear displacement gradually increases, and the rate (the increment of the shear displacement divided by the elapsed time, i.e., the slope of the curve) increases gradually as the normal stress decreases. Early on, before the sample fails, the shear displacement increases rapidly. This rapid increase is caused by two factors: (1) The formation of a large number of micro-cracks and macro-cracks and (2) The decrease in the shear resistance due to the decrease in the normal stress. These two factors result in a reduction in the resisting deformation capability in the shear direction.

Figure 6: Typical curves of the normal and shear displacements during test
In addition, the normal displacement during the unloading process decreases faster than during the loading of the shear stress. The growth of the shear displacement leads to shear dilatancy deformation in the direct shear test due to crack propagation and frictional sliding along the sloping micro-failure surfaces inside the rock. Thus, it is guaranteed that shear dilatancy deformation will occur during the unloading of the normal stress due to the gradual increase in the shear displacement. Furthermore, the release of the elastic deformation in the normal direction occurs because of the decrease in the normal stress. Therefore, the decrease in the normal displacement consists of shear dilatancy deformation and elastic deformation release.
The M–C and Hoek–Brown (H–B) criteria are commonly used to describe the change in shear strength of rocks. The tensile strength of a rock is necessary in the H–B criterion. In addition, according to the experimental results from Huang et al. [27], the H–B criterion describes the shear strength under normal tensile stresses better, while the M–C criterion is better to fit that under normal compressive stresses. The tensile strength and tensile-shear strength are not considered in this study. Thus, the M–C criterion is used to describe the change in the shear strength. The shear strength envelope obtained from the linear fitting of the DSTCNS data is as follows:
The root-mean-square error (RMSE) of which is 0.83 MPa. The internal friction angle and the cohesion are
In the DSTUNS, at the moment when the sample fails, the failure shear stress (
where C is the cohesion and
Table 3: Cohesion and internal friction angle under different initial normal stresses


Figure 7: Changes in the cohesion and internal friction angle with increasing INS in the DSTUNS
According to the above analysis, the failure normal stress
where

Figure 8: Test data and envelope surface in a three-dimensional coordinate system
Since the RMSE of 0.58 MPa is small enough, Eq. (14) characterizes the relationships between the INS, the failure normal stress
4 Results of the Numerical Simulation
Fig. 9 shows the typical crack propagation process that occurred in the experiments and the simulations. In the DSTCNS (Figs. 9a–9d), first, the sample cracked at the two ends of the shear plane (Fig. 9a), and then, the cracks propagated to the interior of the sample at a certain angle (Fig. 9b). As the shear stress increased, numerous micro-cracks formed in the middle of the sample. Then, an S-shaped macro-crack formed. The S-shaped crack mainly formed due to the coalescence of the cracks in the middle of the sample and the inclined cracks at the two ends of the shear plane. An S-shaped crack was also observed in the experiment (Fig. 9d).

Figure 9: Crack propagation process and S-shaped crack under constant normal stress and unloading normal stress. (a–d) for the DSTCNS with a constant normal stress of 20 MPa; (e–h) for the DSTUNS with an INS of 20 MPa and an ISS of 15 MPa; and (i–l) for the DSTUNS with an INS of 45 MPa and an ISS of 25 MPa
In the laboratory tests under unloading normal stress, surface spalling occurred around the shear plane on all of the samples (Figs. 9h and 9l), while this phenomenon was infrequent in the DSTCNS. This is because more secondary cracks were formed around the principal crack during the loading and unloading processes, as shown in Figs. 9g and 9k. In addition, when the initial stress was high, there were numerous micro-cracks evenly distributed inside the sample (Fig. 9i). After that, the sample started to crack at the ends of the shear plane (marked by ovals in Fig. 9j). The internal damage caused by the high initial stress (Fig. 9i) is an important reason why the shear strength in the DSTUNS was less than that in the DSTCNS.
Fig. 10 shows the change in the number of micro-cracks in the simulated samples. No micro-cracks (when the normal stress is at a low level, as shown in Figs. 10a and 10b) or only a few micro-cracks (when the normal stress was high; Fig. 10c) were formed during the loading of the normal stress in both the DSTCNS and the DSTUNS. In the DSTCNS, most of the cracks were produced in the later stage of the shear stress application, particularly in the post-peak stage. In the DSTUNS, during the application of the shear stress, there were not many micro-cracks when the shear stress was less than the shear strength of the sample. Most of the micro-cracks were formed during the unloading of the normal stress. In the initial stage of the unloading, the number of cracks increased slowly due to the constant shear stress and the relatively high normal stress. As the normal stress decreased, the ability of the sample to resist shear deformation was significant reduced, which accelerated the formation of the micro-cracks.

Figure 10: Changes in the number of micro-cracks in (a) the DSTCNS with a constant normal stress of 20 MPa; (b) the DSTUNS with an INS of 20 MPa and an ISS of 15 MPa; and (c) the DSTUNS with an INS of 40 MPa and an ISS of 25 MPa
Fig. 11 shows the changes in the energies in the DSTCNS and the DSTUNS. In the DSTCNS, the dissipated energy Ud increases slowly before the peak shear stress, particularly in the linear elastic stage (Fig. 11a). In the stage after the linear elastic stage and before the peak shear stress, the number of cracks increases slightly faster, and there are several small magnitude stress drops. In the post-peak stage, the dissipated energy Ud increases rapidly due to the rapid growth of the cracks. The total energy keeps increasing before the peak shear stress. However, after the peak shear stress, its behavior is different under different normal stresses. Fig. 12a shows the statistics of the change in the total energy in the post-peak stage. The total energy increases gradually when the normal stress is low (5, 10, and 15 MPa) and decreases gradually when the normal stress is high (20 and 25 MPa).

Figure 11: Energy evolution process in (a) the DSTCNS with a constant normal stress of 20 MPa; (b) the DSTUNS with an INS of 20 MPa and an ISS of 15 MPa; and (c) the DSTUNS with an INS of 40 MPa and an ISS of 25 MPa

Figure 12: Statistics of the change in the total energy in (a) the DSTCNS and (b) the DSTUNS
In the DSTUNS, the dissipated energy Ud increases slowly during the loading of the normal stress and the shear stress. During the unloading of the normal stress, the rate of the dissipated energy Ud increases, while the elastic strain energy Ue decreases overall. However, the total energy also exhibits two different variations during the unloading of the normal stress: (1) Gradually decreases and (2) Initially decreases and then increases. As shown in Fig. 12b, this is related to the initial stresses. When the ISS is low, the total energy tends to decrease first and then increase; whereas when the ISS is high, it is more likely to gradually decrease. The INS also affect the total energy during the unloading of the normal stress. For instance, when the ISS is 18 MPa, under an INS of 25 MPa, the total energy of the sample decreases first and then increases; whereas under an INS of 30 MPa, it decreases gradually. Therefore, the greater the INS, the more likely the total energy is to gradually decrease.
The total energy changes in two different manners in the DSTCNS and DSTUNS. This is mainly due to the different failure patterns. As shown in Fig. 9, when the stress (the normal stress in the DSTCNS or the initial stresses in the DSTUNS) is small, the S-shaped crack is relatively smooth, whereas there are more secondary cracks around it when the stress is high. A rougher S-shaped crack causes more intense shear dilatancy, which results in a larger amount of negative work done by the normal stress. When the negative work done is greater than the positive work done by the shear stress, the total energy decreases. Otherwise, the total energy increases.
As shown in Figs. 11b and 11c, the elastic strain energy and the shear stress suddenly and rapidly decrease and the dissipated energy increases rapidly. This indicates that the sample has failed. Therefore, we chose the energy at this point to study the energy characteristics of the sample when it is about to be failed. The dissipated energy ratio is defined as the ratio of the dissipated energy to the total energy (Ed/U). According to Wang et al. [23], the dissipated energy ratio is meaningful to the failure mechanism of rocks. As shown in Fig. 13a, the dissipated energy ratio decreases exponentially with increasing ISS in the DSTUNS. The dissipated energy ratio can be expressed as follows:
As shown in Fig. 13a, the parameter a increases linearly, and the parameter b decreases linearly as INS

Figure 13: Change in Ud/U for (a) the DSTUNS, and (b) the DSTCNS
Thus, the dissipated energy ratio in the DSTUNS can be rewritten as
In both the DSTCNS and the DSTUNS, the normal stress and the shear stress are applied successively. However, there is no unloading process in the DSTCNS. The DSTCNS can be considered to be a special case of the DSTUNS, with an INS of
As shown in Fig. 13b, the RMSE of 0.019 indicates that Eq. (19) describes the variation in the dissipated energy ratio well.
In the process of deep tunnel excavation, shear slip fractures will occur in the surrounding rock accompanied by unloading. In this process, the normal stress on the potential shear fracture surface gradually decreases. Under the action of slope excavation or groundwater rising, the normal stress on the potential shear fracture surface of a slope decreases gradually. Based on the fact that the normal stress of the potential shear fracture surface gradually decreases in engineering rock mass, the DSTUNS was proposed to study the shear mechanical behavior and energy evolution characteristics of rock mass under unloading normal stress. The DSTUNS under different initial stress levels was carried out on the common sandstone in the Three Gorges Reservoir Area, and the numerical simulation is carried out by using PFC2D. The characteristics of strength, deformation, fracture and energy evolution of rock in the DSTUNS were analyzed. The research results have certain guiding significance for the stability evaluation of rock mass in slope and deep tunnel.
In this study, the normal stress on the shear fracture surface gradually decreases and the shear stress remains unchanged. However, in the process of tunnel, slope excavation and groundwater rising, the shear stress on the potential shear fracture surface of rock will also change and will not remain constant. Therefore, the results of this study have certain limitations, and further research is needed.
In this study, a new stress path was proposed for simulating the shear failure of rocks under unloading normal stress. Then, laboratory direct shear tests and simulations were carried out under constant normal stress and unloading normal stress to investigate the shear deformation, the shear strength, and the energy conversion within the rock. The conclusions of this study are summarized as follows:
1. The shear strengths in the DSTCNS and DSTUNS conform to the M–C criterion. The cohesion and internal friction angle are related to the initial normal stress and the initial shear stress. As the initial normal stress increases, the cohesion decreases linearly and the tangent of the internal friction angle increases linearly. In addition, in the DSTUNS, the cohesion is smaller and the internal friction angle is larger than that in the DSTCNS.
2. When the sample is subjected to a high initial stress level, there are many micro-cracks evenly distributed inside the sample before the cracking begins at the ends of the shear plane. This results in a decrease in the shear resistance. Surface spalling occurred on all of the samples in the DSTUNS, while spalling rarely occurred in the DSTCNS.
3. Shear dilatancy caused a decrease in the total energy during the direct shear tests. A high initial stress is more likely to result in a reduction in the total energy. The dissipated energy ratio decreases exponentially with increasing initial shear stress. The DSTCNS is a special case of the DSTUNS, with an unloading amount equal to zero.
Funding Statement: This research was funded by the Fundamental Research Funds for the Central Universities, CHD (Grant Nos. 300102210307 and 300102210308), the National Natural Science Foundation of China (Grant Nos. 41831286 and 41972297), the Natural Science Foundation of Shaanxi Province (Grant No. 2020JQ-369).
Conflicts of Interest: The authors declare that they have no conflicts of interest to report regarding the present study.
1. Ramsey, J. M., Chester, F. M. (2004). Hybrid fracture and the transition from extension fracture to shear fracture. Nature, 428, 63–66. DOI 10.1038/nature02333. [Google Scholar] [CrossRef]
2. Ferrill, D. A., McGinnis, R. N., Morris, A. P., Smart, K. J. (2012). Hybrid failure: Field evidence and influence on fault refraction. Journal of Structural Geology, 42, 140–150. DOI 10.1016/j.jsg.2012.05.012. [Google Scholar] [CrossRef]
3. Jewell, R. A., Wroth, C. P. (1989). Direct shear tests on reinforced sand. Geotechnique, 37, 53–68. DOI 10.1680/geot.1987.37.1.53. [Google Scholar] [CrossRef]
4. Luong, M. P. (1990). Tensile and shear strengths of concrete and rock. Engineering Fracture Mechanics, 35, 127–135. DOI 10.1016/0013-7944(90)90190-R. [Google Scholar] [CrossRef]
5. Cen, D., Huang, D. (2007). Direct shear tests of sandstone under constant normal tensile stress condition using a simple auxiliary device. Rock Mechanics and Rock Engineering, 50, 1425–1438. DOI 10.1007/s00603-017-1179-1. [Google Scholar] [CrossRef]
6. Zhang, L., Thornton, C. A. (2007). Numerical examination of the direct shear test. Géotechnique, 57, 343–354. DOI 10.1680/geot.2007.57.4.343. [Google Scholar] [CrossRef]
7. Cen, D., Huang, D., Ren, F. (2017). Shear deformation and strength of the interphase between the soil-rock mixture and the benched bedrock slope surface. Acta Geotechnica, 12, 1–23. DOI 10.1007/s11440-016-0468-2. [Google Scholar] [CrossRef]
8. Hoek, E., Brown, E. T. (1980). Empirical strength criterion for rock masses. Journal of Geotechnical and Geoenvironmental Engineering, 106, 1013–1035. DOI 10.1016/0022-1694(80)90029-3. [Google Scholar] [CrossRef]
9. Bossart, P., Trick, T., Meier, P. M., Mayor, J. C. (2004). Structural and hydrogeological characterisation of the excavation-disturbed zone in the Opalinus Clay (Mont Terri Project, Switzerland). Applied Clay Science, 26, 429–448. DOI 10.1016/j.clay.2003.12.018. [Google Scholar] [CrossRef]
10. Li, T., Ma, C., Zhu, M., Meng, L., Chen, G. (2017). Geomechanical types and mechanical analyses of rockbursts. Engineering Geology, 222, 72–83. DOI 10.1016/j.enggeo.2017.03.011. [Google Scholar] [CrossRef]
11. Meng, B. (2013). Study of bearing characteristic of soft and fractured roadway surrounding rock anchorage unit and its applications in engineering (Ph.D. Thesis). Xuzhou: China University of Mining and Technology (in Chinese). [Google Scholar]
12. Meng, B., Jing, H. W., Chen, K. F., Su, H. J. (2013). Failure mechanism and stability control of a large section of very soft roadway surrounding rock shear slip. International Journal of Mining Science and Technology, 23, 127–134. DOI 10.1016/j.ijmst.2013.03.002. [Google Scholar] [CrossRef]
13. Huang, R. Q., Huang, D. (2014). Evolution of rock cracks under unloading condition. Rock Mechanics and Rock Engineering, 47, 453–466. DOI 10.1007/s00603-013-0429-0. [Google Scholar] [CrossRef]
14. Zeng, B., Huang, D. (2016). Soil deformation induced by Double-O-Tube shield tunneling with rolling based on stochastic medium theory. Tunnelling and Underground Space Technology, 60, 165–177. DOI 10.1016/j.tust.2016.09.001. [Google Scholar] [CrossRef]
15. Gu, D. M., Huang, D., Yang, W. D., Zhu, J. L., Fu, G. Y. (2017). Understanding the triggering mechanism and possible kinematic evolution of a reactivated landslide in the Three Gorges Reservoir. Landslides, 14, 2073–2087. DOI 10.1007/s10346-017-0845-4. [Google Scholar] [CrossRef]
16. Huang, D., Gu, D. M., Song, Y. X., Cen, D. F., Zeng, B. (2018). Towards a complete understanding of the triggering mechanism of a large reactivated landslide in the Three Gorges Reservoir. Engineering Geology, 238, 36–51. DOI 10.1016/j.enggeo.2018.03.008. [Google Scholar] [CrossRef]
17. Huang, D., Li, Y. (2014). Conversion of strain energy in triaxial unloading tests on marble. International Journal of Rock Mechanics and Mining Sciences, 2014(66), 160–168. DOI 10.1016/j.ijrmms.2013.12.001. [Google Scholar] [CrossRef]
18. Sanchidrian, J. A., Segarra, P., Lopez, L. M. (2007). Energy components in rock blasting. International Journal of Rock Mechanics and Mining Sciences, 44, 130–147. DOI 10.1016/j.ijrmms.2006.05.002. [Google Scholar] [CrossRef]
19. Tsoutrelis, C. E., Exadaktylos, G. E. (1993). Effect of rock discontinuities on certain rock strength and fracture energy parameters under uniaxial compression. Geotechnical and Geological Engineering, 11, 81–105. DOI 10.1007/BF00423337. [Google Scholar] [CrossRef]
20. Peng, R. D., Ju, Y., Wang, J. G., Xie, H. P., Gao, F. et al. (2015). Energy dissipation and release during coal failure under conventional triaxial compression. Rock Mechanics and Rock Engineering, 48, 509–526. DOI 10.1007/s00603-014-0602-0. [Google Scholar] [CrossRef]
21. Li, D., Sun, Z., Xie, T., Li, X., Ranjith, P. G. (2017). Energy evolution characteristics of hard rock during triaxial failure with different loading and unloading paths. Engineering Geology, 228, 270–281. DOI 10.1016/j.enggeo.2017.08.006. [Google Scholar] [CrossRef]
22. Huang, D., Zhu, T. T. (2018). Experimental and numerical study on the strength and hybrid fracture of sandstone under tension-shear stress. Engineering Fracture Mechanics, 2018(200), 387–400. DOI 10.1016/j.engfracmech.2018.08.012. [Google Scholar] [CrossRef]
23. Wang, J., Yan, H. (2012). DEM analysis of energy dissipation in crushable soils. Soils and Foundations, 52, 644–657. DOI 10.1016/j.sandf.2012.07.006. [Google Scholar] [CrossRef]
24. Potyondy, D. O., Cundall, P. A. A. (2004). A bonded-particle model for rock. International Journal of Rock Mechanics and Mining Sciences, 41, 1329–1364. DOI 10.1016/j.ijrmms.2004.09.011. [Google Scholar] [CrossRef]
25. Zhang, X. P., Wong, L. N. Y. (2013). Crack initiation, propagation and coalescence in rock-like material containing two flaws: A numerical study based on bonded-particle model approach. Rock Mechanics and Rock Engineering, 46, 1001–1021. DOI 10.1007/s00603-012-0323-1. [Google Scholar] [CrossRef]
26. Yang, S. Q., Huang, Y. H., Jing, H. W., Liu, X. R. (2014). Discrete element modeling on fracture coalescence behavior of red sandstone containing two unparallel fissures under uniaxial compression. Engineering Geology, 2014(178), 28–48. DOI 10.1016/j.enggeo.2014.06.005. [Google Scholar] [CrossRef]
27. Huang, D., Zhu, T. T. (2019). Experimental Study on the shear mechanical behavior of sandstone under normal tensile stress using a new double-shear testing device. Rock Mechanics and Rock Engineering, 52, 3467–3474. DOI 10.1007/s00603-019-01762-3. [Google Scholar] [CrossRef]
 | This work is licensed under a Creative Commons Attribution 4.0 International License, which permits unrestricted use, distribution, and reproduction in any medium, provided the original work is properly cited. |