| Computer Modeling in Engineering & Sciences |
DOI: 10.32604/cmes.2021.013792
ARTICLE
Maximum Probabilistic and Dynamic Traffic Load Effects on Short-to-Medium Span Bridges
1School of Civil Engineering, Changsha University of Science and Technology, Changsha, 410114, China
2School of Civil Engineering, Hunan University of Technology, Zhuzhou, 412007, China
*Corresponding Author: Naiwei Lu. Email: lunaiweide@163.com
Received: 21 August 2020; Accepted: 11 January 2021
Abstract: The steadily growing traffic load has resulted in lots of bridge collapse events over the past decades, especially for short-to-medium span bridges. This study investigated probabilistic and dynamic traffic load effects on short-to-medium span bridges using practical heavy traffic data in China. Mathematical formulations for traffic-bridge coupled vibration and probabilistic extrapolation were derived. A framework for extrapolating probabilistic and dynamic traffic load effect was presented to conduct an efficient and accurate extrapolation. An equivalent dynamic wheel load model was demonstrated to be feasible for short-to-medium span bridges. Numerical studies of two types of simply-supported bridges were conducted based on site-specific traffic monitoring data. Numerical results show that the simulated samples and fitting lines follow a curve line in the Gumbel distribution coordinate system. It can be assumed that dynamic traffic load effects follow Gaussian distribution and the extreme value follows Gumbel distribution. The equivalent probabilistic amplification factor is smaller than the individual dynamic amplification factor, which might be due to the variability of individual samples. Eurocode 1 is the most conservative specification on vehicle load models, followed by the BS5400 specification. The D60-2015 specification in China and ASSHTO specification provide lower conservative traffic load models.
Keywords: Bridge engineering; vehicle load; extreme value; extrapolation; stochastic traffic flow
In recent decades, the highway freight volume has a significant increase leading by the steady expansion of transportation industry [1,2]. According to the official data provided by the ministry of transportation of China, the traffic volume has increased by 10.1% in 2019. Meanwhile, the current traffic load on bridges may exceed the design load that was estimated based on traffic data over several decades. Thus, the growing traffic load may evolve into a threat to the structural safety of existing bridges. In practice, numerous bridges were collapsed due to heavy and dense traffic loading, especially for short-to-medium span bridges [3]. For instance, Yangmingtan Bridge collapsed in 2012 in Harbin due to the simultaneous presence of 3 overloaded trucks driving in the slow lane [4]. Wuyishan Bridge collapsed in 2011 due to an overloaded truck with total weight of 80 ton. Faridabad Bridge in India collapsed in 2018. Cook et al. [5] investigated the bridge collapse event in New York State between 1992 and 2014, and found that 16 of 98 bridge collapse events were caused by truck overloading. Even though truck overloading is associated with traffic management department, the objective truck overloading phenomenon should be considered in the design phase.
Several researchers indicated that the present design vehicle load model was underestimated compared to practical traffic loads. A study conducted by Han et al. [6] indicated that 15% bridges had higher traffic load effects compared to the design value. Note that the traffic load mostly governs the design of short-to-medium span bridges, while truck overloading has a relative low impact on the safety of long-span bridges. It is acknowledged that shorter span bridges have more significant dynamic effects of moving vehicle loads. Moreover, a degraded road roughness condition adds to the severe dynamic vibration on the bridge [7,8]. Therefore, it is critical to evaluate the dynamic traffic load effects on short-to-medium span bridges using practical traffic data. The analytical results provide a theoretical basis for a reasonable management scheme of truck overloading. In addition, the dynamic effect analysis associated with the road roughness parameters can be treated as a theoretical basis for pavement reconstruction.
Since the traffic is random in nature probabilistic analysis is essential to estimate the characteristic load effect on a bridge. Evaluating vehicle load effects on bridges using probabilistic extreme probability is one of the research hotspots in the field of bridge engineering [9–11]. The numerical result can be utilized to calibrate the design vehicle load model. In general, the commonly used probability approach is maximum traffic load evaluation based on extreme value theory. The traditional analytical procedures are summarized as follows. Firstly, establish a probabilistic vehicle load model based on the traffic data for the purpose of capturing probabilistic traffic features [12,13]. Secondly, estimate a cumulative distribution function (CDF) using extreme value extrapolation methods, such as generalized extreme value (GEV) distribution, Pareto distribution and Rice’s level-crossing model [14]. Finally, the characteristic load effect within a certain return period can be evaluated based on extreme value theory. The traditional approach can provide a reasonable extrapolation of traffic load effects. Note that these procedures adopt several mathematical assumptions, including the interval maximum value, the Gaussian distribution, and the stationary random process. Therefore, there will be a certain deviation between the extrapolation and the exact value. An exact solution needs large simulations that cause a time-consuming problem.
With the development of weigh-in-motion (WIM) technology [15], it is popular to conduct traffic load effect simulation using site-specific traffic monitoring data. Obrien et al. [16] investigated the traffic flow data of several European countries, and found that the design load is not conservative compared to actual traffic loads. Lu et al. [17] investigated the probabilistic traffic load effect on long-span bridges based on traffic monitoring data and the Rice’s level-crossing theory. Liu et al. [18] compared the maximum traffic load effect on a cable-stayed bridge and a suspension bridge. Deng et al. [19] evaluated the dynamic traffic load effect on a prestressed concrete bridge. Yu et al. [20] predicted the maximum load effect considering traffic growth using a non-stationary Bayesian method. Zhou et al. [21] investigated the reduction factor for multilane traffic loads on long-span bridges using coincident lanes loads. Ruan et al. [22] developed a site-specific traffic load model consisting of load form, loading pattern, multi-lane factor and load value to predict extreme responses of long-span bridges. Kim et al. [23] presented a probabilistic traffic load model based on the WIM data collected in South Korea. Xia et al. [24] utilized long-term structural health monitoring data to extrapolate the traffic load effect on Tsing Ma Bridge. Lu et al. [25] evaluate the system reliability of a cable-supported bridge under stochastic traffic load. However, research effect on the combination of dynamic and probabilistic analysis for short-span bridges is still insufficient.
It is a common phenomenon that short-to-medium span bridges were collapsed or significantly damaged due to heavy traffic loads. In addition, the current freight traffic volume keeps a sustained growth tendency, which may evolve into a risk source for existing bridges. Thus, it is an urgent task to estimate and predict the traffic load effect on existing bridges with consideration of site-specific traffic loads rather than the design load. In this research area, most studies concentrate to the probabilistic traffic load effect modeling via static analysis. Several researchers developed dynamic analysis accounting for stochastic traffic loads. However, the probabilistic dynamic analysis for the bridges in extremely heavy traffic load area is still insufficient. Therefore, it is difficult to conduct a reasonable prediction of the maximum dynamic traffic load effect in a bridge lifetime.
This study presented a computational framework for extrapolating maximum dynamic traffic load effect on short-to-medium span bridges. A huge traffic data in the heavy traffic area was utilized to predict the maximum traffic load effect on short-to-medium span bridges. Two types of simply supported prestressed concrete bridges were selected to demonstrate the feasibility of the proposed framework. Parametric studies were conducted to investigate dynamic extrapolation effect. The numerical results were utilized for calibrating the vehicle load models in several design specifications.
The novelty of this study is the big traffic data collected in highway bridges in China, combined with the probabilistic analysis of the dynamic traffic load effects on short span bridges. Even though several researchers [16] conducted the similar research in European countries and the US, this study utilized the representative heavy traffic data in China, which included extremely overloaded trucks. The probabilistic characteristics and dynamic effects are different with the referred literatures, which can be used as verification for representative design load models. The proposed computational framework combines the vehicle-bridge coupled vibration system and the probability modeling of extreme values effectively. In addition, four typical design vehicle load models were calibrated on the basis of probabilistic simulations of long-term traffic monitoring data. The numerical results can provide a theoretical basis for updating national design specifications and making a reasonable scheme to control truck overloading.
3 Theoretical Basis for Stochastic Vibration of Traffic-Bridge System
3.1 Traffic-Bridge Coupled Vibration Model
For short-to-medium span bridges, traffic dynamic effects are more significant than that of a long-span bridge. Thus, the dynamic effect should be considered in the numerical simulation. In general, the dynamic effect can be considered in a vehicle-bridge coupled vibration system. The equations of motion of the system can be established based on forces and displacement of the system, which are written by [26]:
where, Mv and Mb represents mass matrix of the vehicle and the bridge, respectively; Fbv and Fvb represents interaction force between the bridge and the vehicle, respectively; Fbg and Fvg represents dead load of the bridges and the vehicle, respectively; uv and ub represents the displacement vectors of the vehicle and the bridge, respectively;
The coupled equations of motion are differential equations with variable coefficients for parameters include displacements, velocities and accelerations. In general, the equation can be solved by utilizing a step-by-step integration method with the following procedures [27]. Firstly, extract the natural frequencies and modes of the bridge from the finite element model. Secondly, estimate the interaction force between vehicles and the bridge within a small time step
The above method can be used to calculate dynamic effects of a bridge under individual vehicle load. For multiple vehicle loads on the bridge, the estimation of dynamic effects is more complex. Zhou et al. [28] presented an equivalent dynamic wheel load (EDWL) approach to simplify the analysis of dynamic traffic load effects on long-span bridges. This approach was demonstrated with the numerical study of Luling Bridge with a mid-span length of 372 m. The maximum deviation to the detailed model is about 6.8% for the bridge acceleration. The present study develops the EDWL approach to the probabilistic analysis of vehicle-bridge interaction system. In general, the EDWL approach is written as [29]:
where,
By combining the equations of motion and the EDWL function, the traffic-bridge coupled vibration equation can be written as [30]:
where, xj and dj represent the longitudinal and transverse coordinates of the vehicles center gravity when the jth vehicle loading on bridge; hk and
In order to improve the computational efficiency, structural mode parameters are added to the motion equations. Considering the orthogonality of bridge modes, the equation of motion can be written as [31]:
where,
where, I is a unit vector,
This equation can be solved by Newmark-
where, n represents modal orders of bridges;
3.2 Probabilistic Modeling of Extreme Values
In general, the vehicle load can be regarded as a stationary stochastic process according to the design specification and many research results [34,35]. The commonly used theory is the general extreme value distribution. According to the general extreme value theory, the extreme value of traffic load effects can be approximated to the three types of distribution functions [36]:
where, a, b and
where,
For the topic of traffic load effect, the commonly used method is to divide the simulated data into groups, Therefore, according to probability function of the binomial distribution, the probability FT(t) of the extreme value of vehicle load effects can be written as [37]:
where, F(x) represents probability distribution of vehicle load effect extreme value during a return period; m represents the number of groups corresponding to F(x).
In the design reference period, a characteristic value Qk can be calculated based on above probability model. The equation is written as:
where, P represents a probability assurance of Qk during time period T. In other words, the probability of vehicle load effect exceeding Qk in this time period is 1 − P. According to design code in china, probability promise rate of design load should be 95%, and the return period is approximately 1950 years.
4 A Framework for Extrapolating Probabilistic and Dynamic Traffic Load Effects on Bridges
In general, the traffic load effect on a bridge can be evaluated based on static influence lines of the bridge extracted from the finite element model. However, dynamic effects in the vehicle–bridge coupled system have no concern with the static influence lines. For the vehicle-bridge interaction analysis, there is a time consuming process to evaluate a large number of block maximum values for probabilistic modelling. Therefore, there should be a balance between the large number of dynamic simulations and the accurate probabilistic modeling. This study presented a comprehensive computational framework for a reasonable extrapolation of dynamic and probabilistic traffic load effects.
By combining the theories of traffic-bridge coupled vibration and probabilistic extreme theory, the maximum probabilistic and dynamic traffic load effect on the bridge can be evaluated. In order to improve the computational efficiency, the static influence line was utilized for the purpose of identifying the critical loading scenarios, which could be subsequently utilized for the dynamic analysis. A flow chart of the computational framework is shown in Fig. 1.
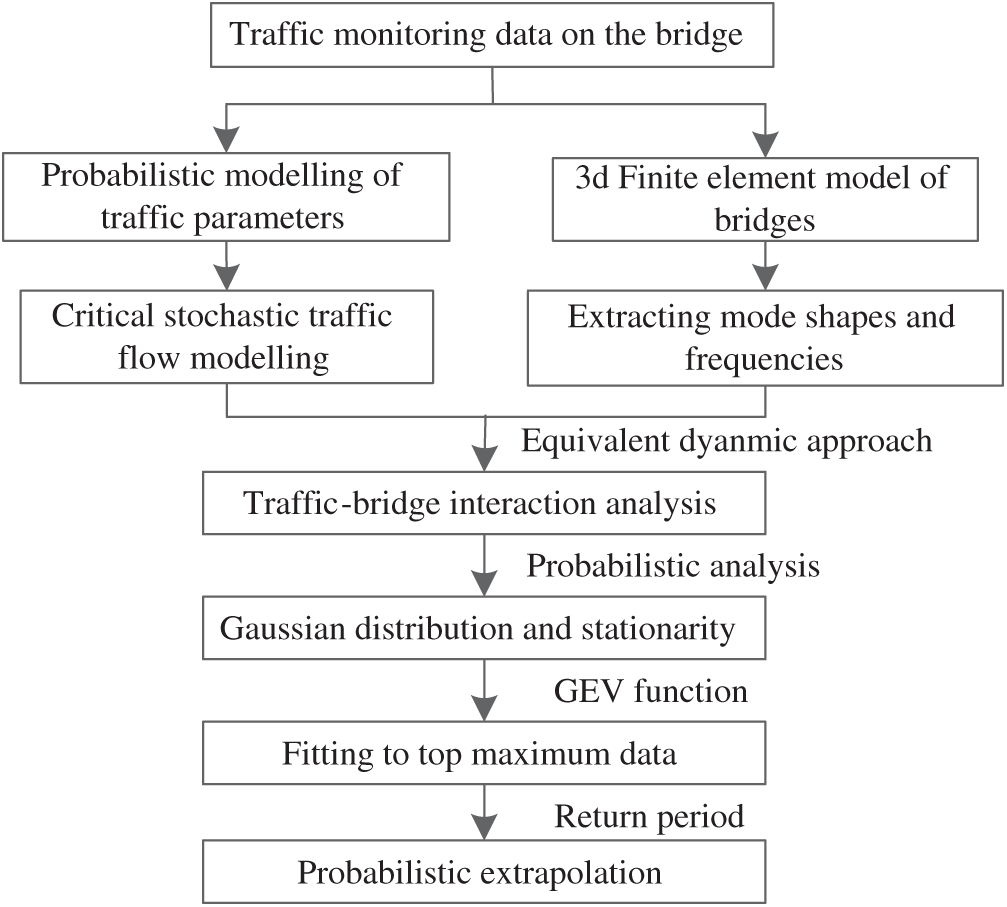
Figure 1: Flow chart of the proposed framework for evaluating maximum probabilistic and dynamic traffic load effect
As shown in Fig. 1, the key procedures of the analytical framework are summarized as follows. Firstly, conduct the probabilistic modelling of traffic parameters using the traffic monitoring data and assumed probability functions, and then select the critical daily random traffic samples based on bridge influence lines. Secondly, extract the mode shapes and frequencies based on the 3D finite element model of the bridge. Thirdly, conduct traffic-bridge couple vibration analysis to evaluate the maximum dynamic effect under critical load conditions. Fourthly, the extreme value samples are fitted based on the generalized extreme value (GEV) distribution function. Finally, the standard value in a return period can be extrapolated, and the probability assurance level of the design vehicle model can be verified.
Compared with the traditional computational approach, the proposed computational framework has the following benefits. Firstly, the equivalent dynamic approach can provide efficient and considerable accurate dynamic solution for the traffic load effect on the bridge. Secondly, the stochastic traffic load model derived from the practical traffic monitoring data can provide real-time probabilistic parameters for the site-specific bridge. Finally, the traffic change due to traffic growth or overloading control can be reflected by the traffic monitoring data, where the change tendency of the maximum traffic load effect can be reflected. However, it is important to note that the accuracy of the probabilistic extrapolation mostly depends on the number of simulations. Meanwhile, more input traffic data will lead to a more realistic extrapolation.
5.1 Traffic Load Modeling Based on Measured Data
The WIM data collected from a highway bridge in China was selected for probabilistic modeling of traffic loads. Illustration of the WIM system is shown in Fig. 2, and more detailed information can be found in Lu et al. [30]. The traffic parameters utilized in the present study are vehicle weights, axle weights, driving lanes, and vehicle spacing. The proportion of trucks and the ratio of truck overloading are 12% and 21%, respectively.
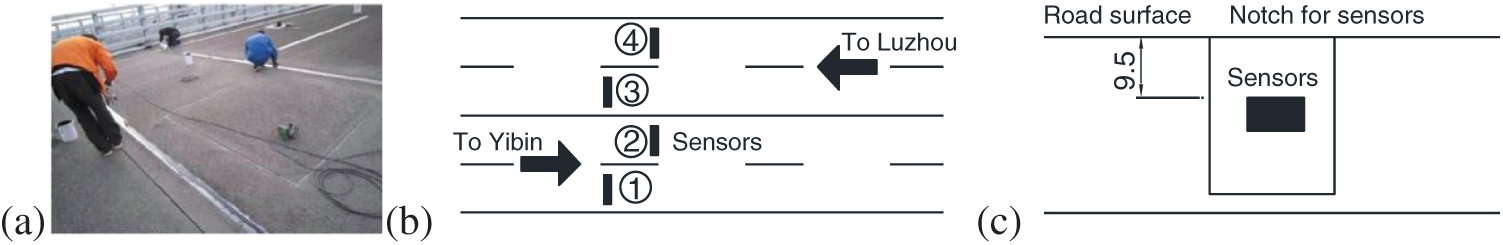
Figure 2: Weigh-in-motion system of a highway bridge: (a) Site photos; (b) Plane view; (c) Elevation view (unit: mm)
All vehicles were classified into 6 types based on the vehicle configurations and axle characteristics. The proportions of all type of vehicles are shown in Tab. 1. The occupancy of different vehicle types and their distribution in each lane are shown in Fig. 3.
Table 1: Classification of vehicle types and corresponding proportions
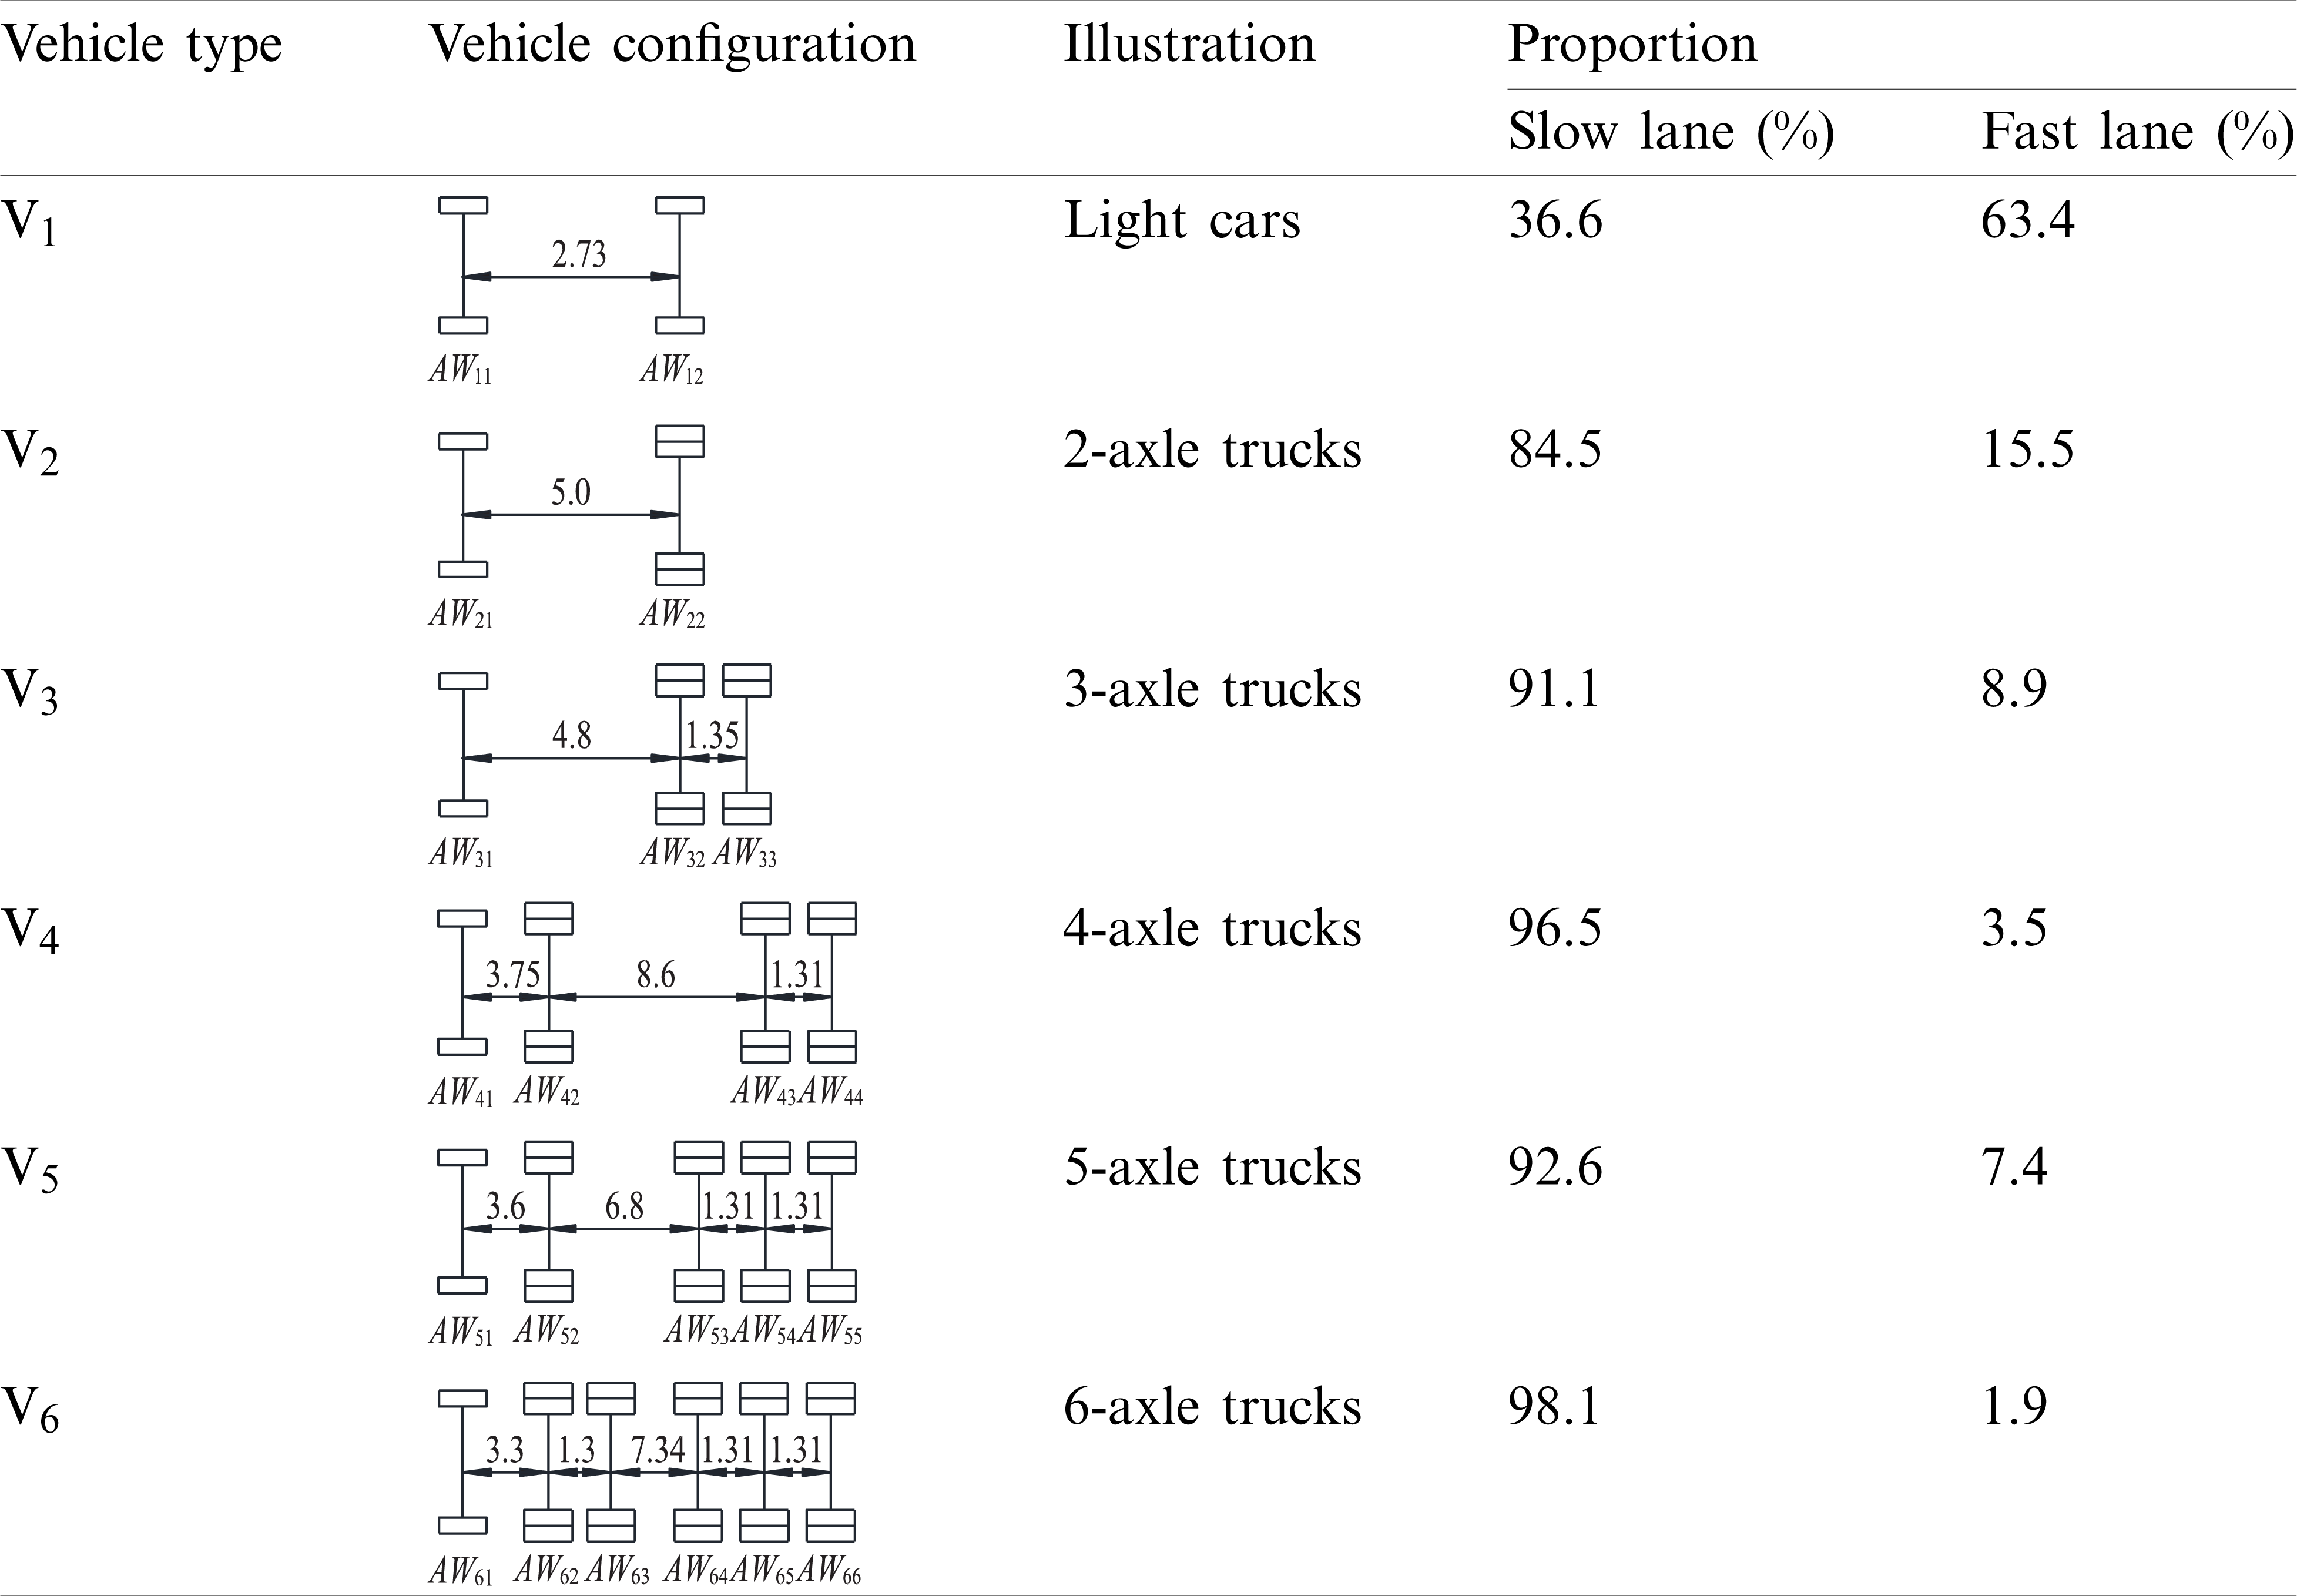
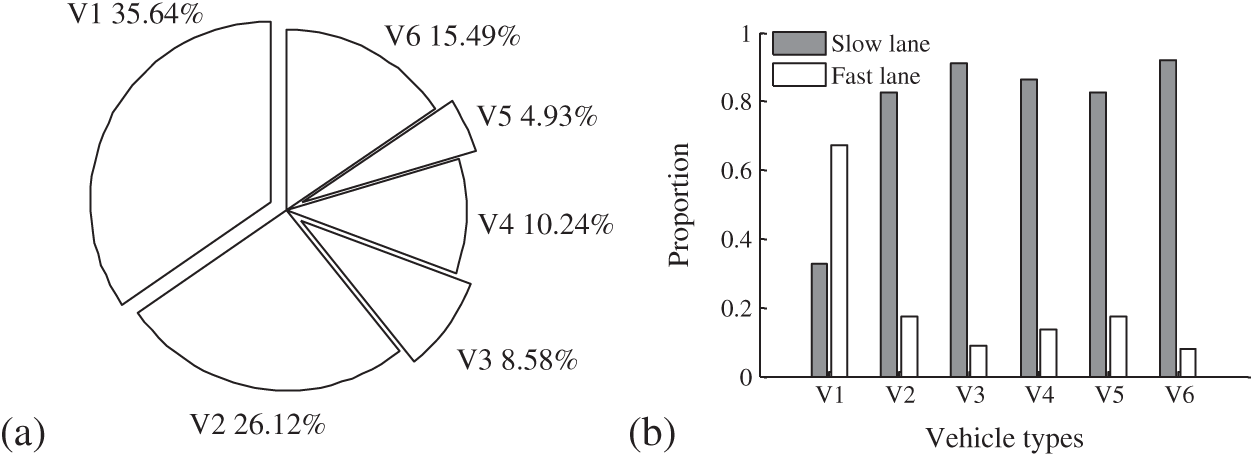
Figure 3: Proportion of vehicles (a) vehicle types; (b) driving lanes
As shown in Fig. 3a, the light cars (V1) have the highest proportion of 35.64%, and two-axle truck (V2) and six-axle trucks (V6) have higher proportion compared with other types of trucks. As observed in Fig. 3b, the light cars have a high probability driving in the fast lane, while heavy trucks mostly driving in the slow lane. This phenomenon is in accordance with the practical rule.
In order to study the probability distribution of axle weights and total weights of heavy trucks, the proportion of axle weights was assigned as a parameter. Fig. 4a plots the fitted probability distribution model of V6 trucks, Fig. 4b shows the relation between the GVW and the axle weight. It is observed that the GVW follows a multimodal distribution, where the truck overloading effect was captured by the probabilistic model. In addition, the relationship between the axle weight and the GVW mostly follows a linear function.
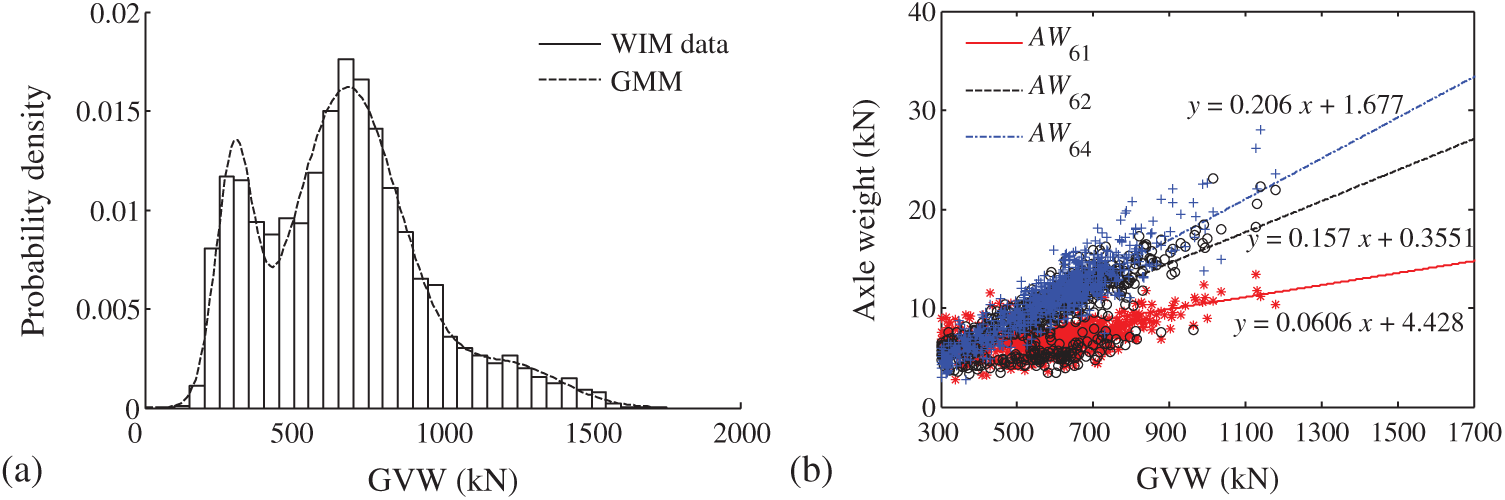
Figure 4: Probability distribution of V6 trucks: (a) PDF of GVWs; (b) relation between the GVW and the axle weight
Based on estimated probability distribution models, the stochastic traffic flow load model was established using Monte Carlo simulation. Fig. 5 plots the simulated dense traffic load model in 60 min. The stochastic traffic load model contains the parameters of vehicle types, GVW, driving lanes and vehicle spacing.
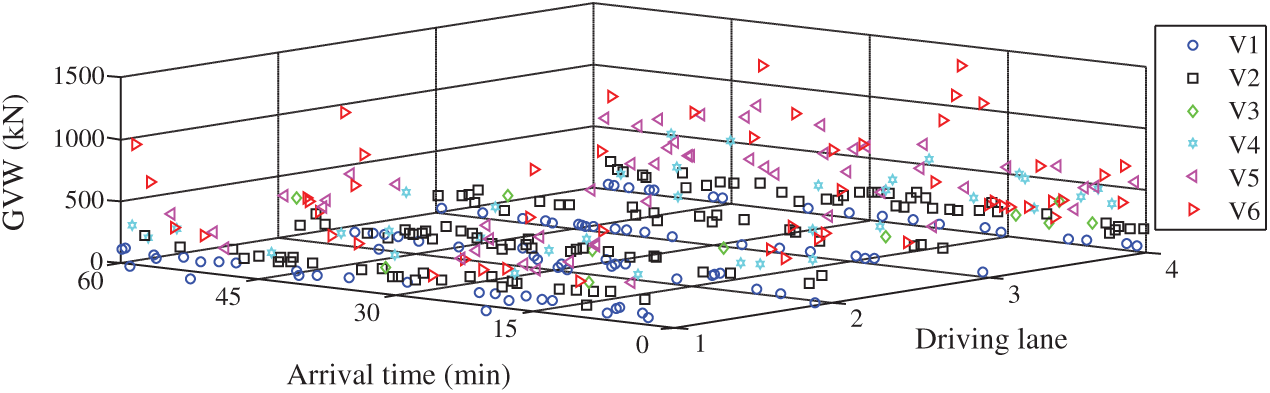
Figure 5: Stochastic load model for dense traffic flow
5.2 Simulation of Traffic Load Effects
Two typical simply-supported T-girder bridges with span-length of 20 and 40 m were selected as prototypes for the numerical simulation. The dimensions of the bridges are shown in Fig. 6. The transverse direction of bridge consists of five T-girders with height Hb = 1.7 and 2.5 m for the short-span and medium-span bridges, respectively. The design traffic loads on the bridge were the highway traffic loads in the design specifications [38–41]. The road roughness conditions in the present study are considered as “good” and “poor” shown in Fig. 7 to investigate the dynamic impact of road conditions on the bridge.
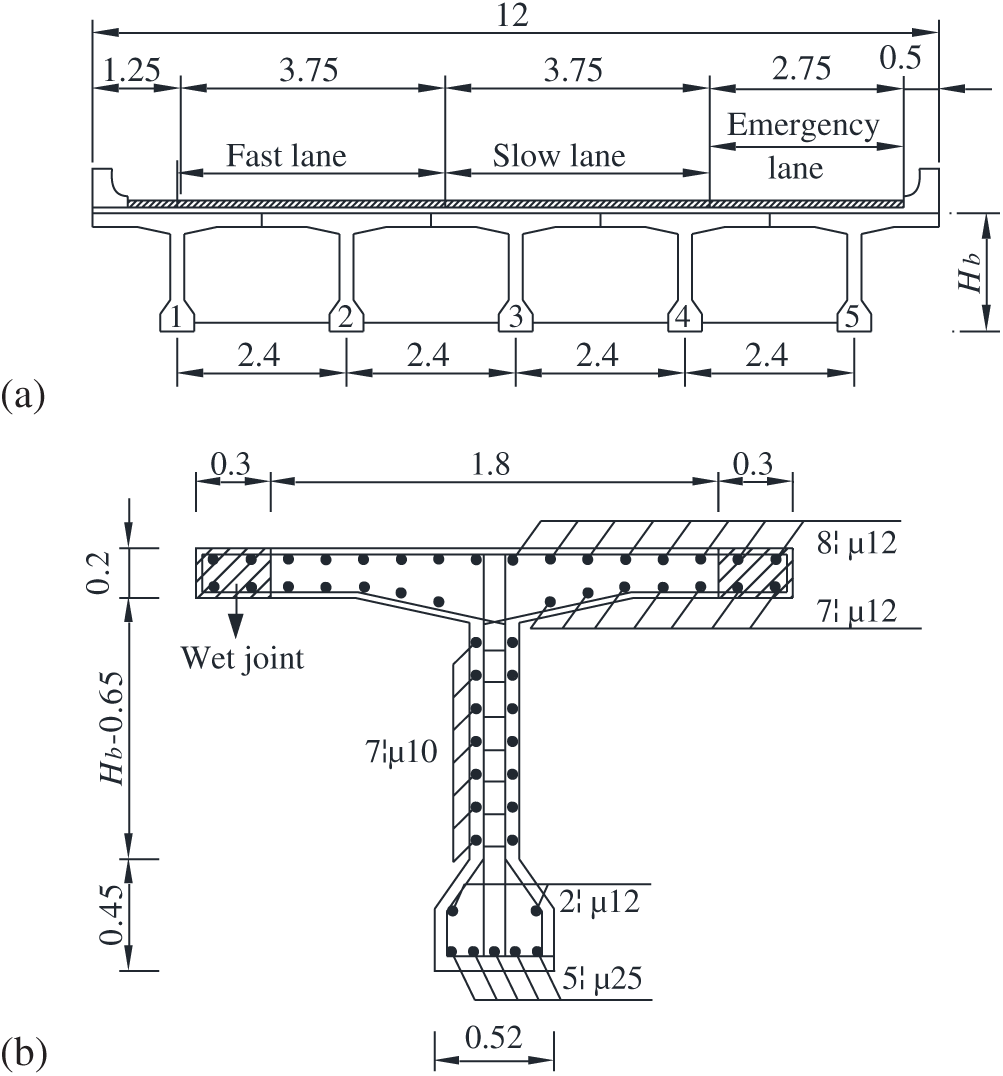
Figure 6: Dimensions of cross-sections of a girder bridge: (a) All girders; (b) A detailed girder (unit: m)
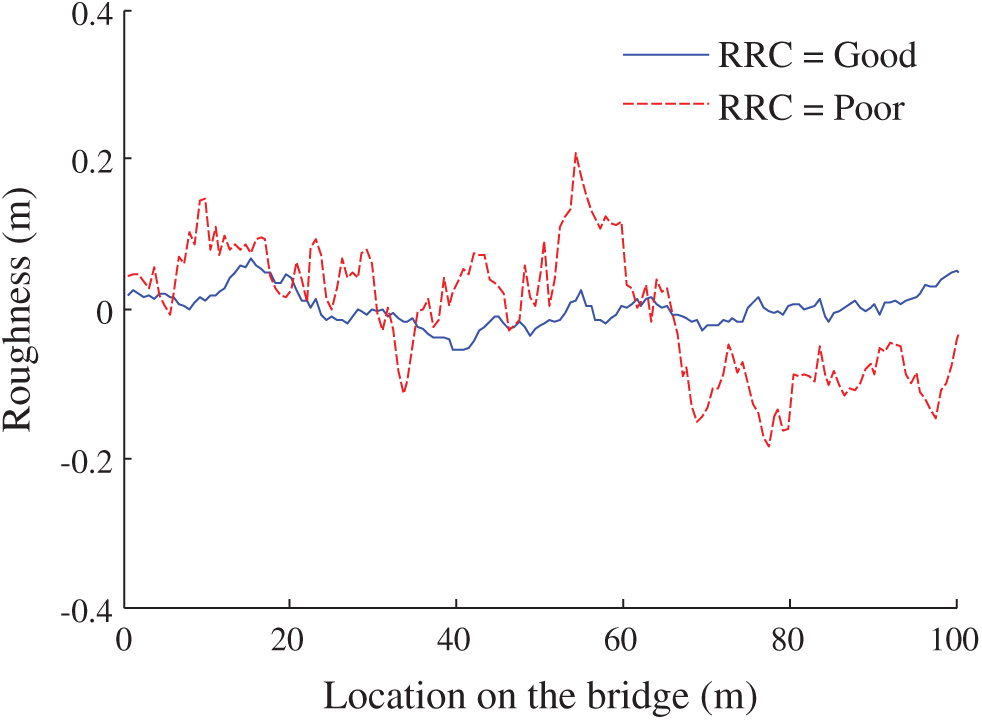
Figure 7: Two types of road roughness conditions
The simulated stochastic load model for dense traffic flow shown in Fig. 5 was utilized to estimate the maximum traffic load effect. The simulated time-histories of the bending moments under the two-lane dense traffic load in 12 h for the two types of bridges are shown in Fig. 8. It is observed that the daily maxima for the shorter span bridge and the longer span bridge are 641 and 2917 kN.m, respectively.
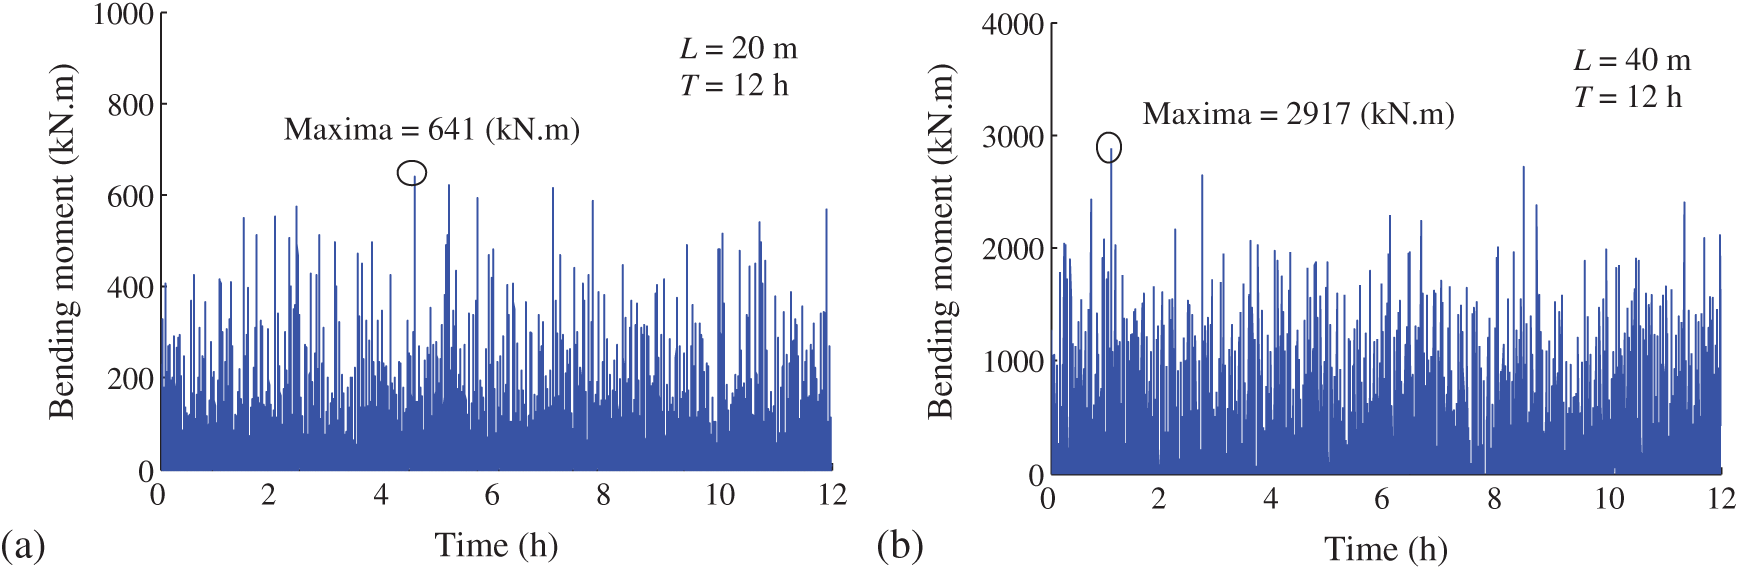
Figure 8: Static time histories of the bending moment in 2 h for: (a) The 20 m girder; (b) The 40 m girder
Since the EDWL approach was primarily developed by Chen et al. [29] for long-span bridges, this study should demonstrate the feasibility of applying this approach for short-span bridges. In this regard, the bridge girder with span length of 20 m was selected for the comparison study between the EDWL approach and the commotional vehicle-bridge fully coupled vibration approach. In order to show the deviation more conservatively, the poor RRC and a constant speed V = 20 m/s were selected. Fig. 9 plots the bending moment histories computed via the two types of approaches. It is observed that the maximum variation rate for the EDWL approach is 3.7% compared with the fully coupled VBI approach. Therefore, it is feasible to utilize the EDWL approach for dynamic analysis of short-span bridges.
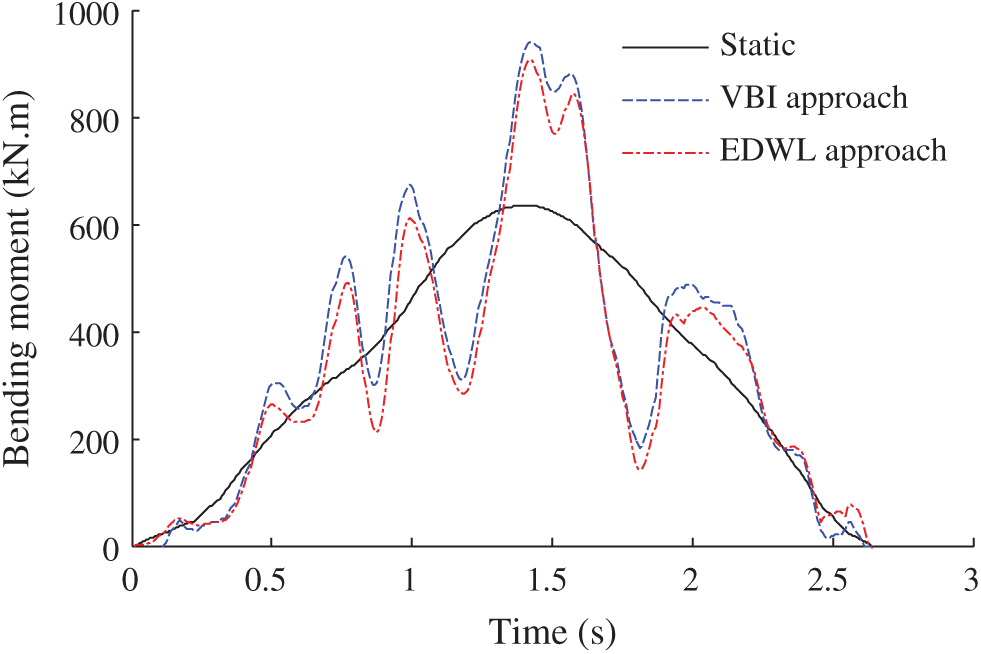
Figure 9: Comparison of bending moments computed via the EDWL and VBI approaches
Subsequently, consider the critical loading vehicles passing on the bridge with a constant speed V = 20 m/s under the condition of
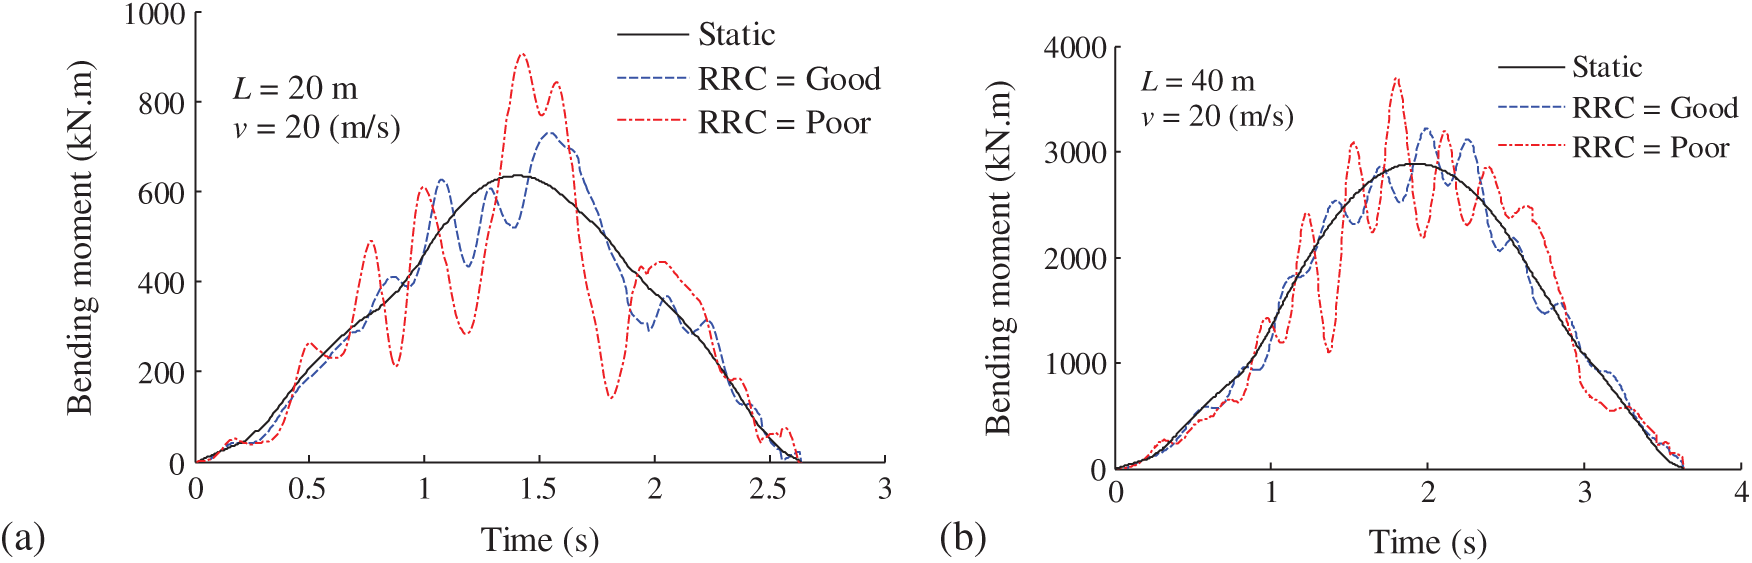
Figure 10: Time-histories of the bending moment of the simply-supported T-girder bridge under the 6-alxe vehicle load: (a) L = 20 m; (b) L = 40 m
Table 2: Summary of the simulated characteristic values
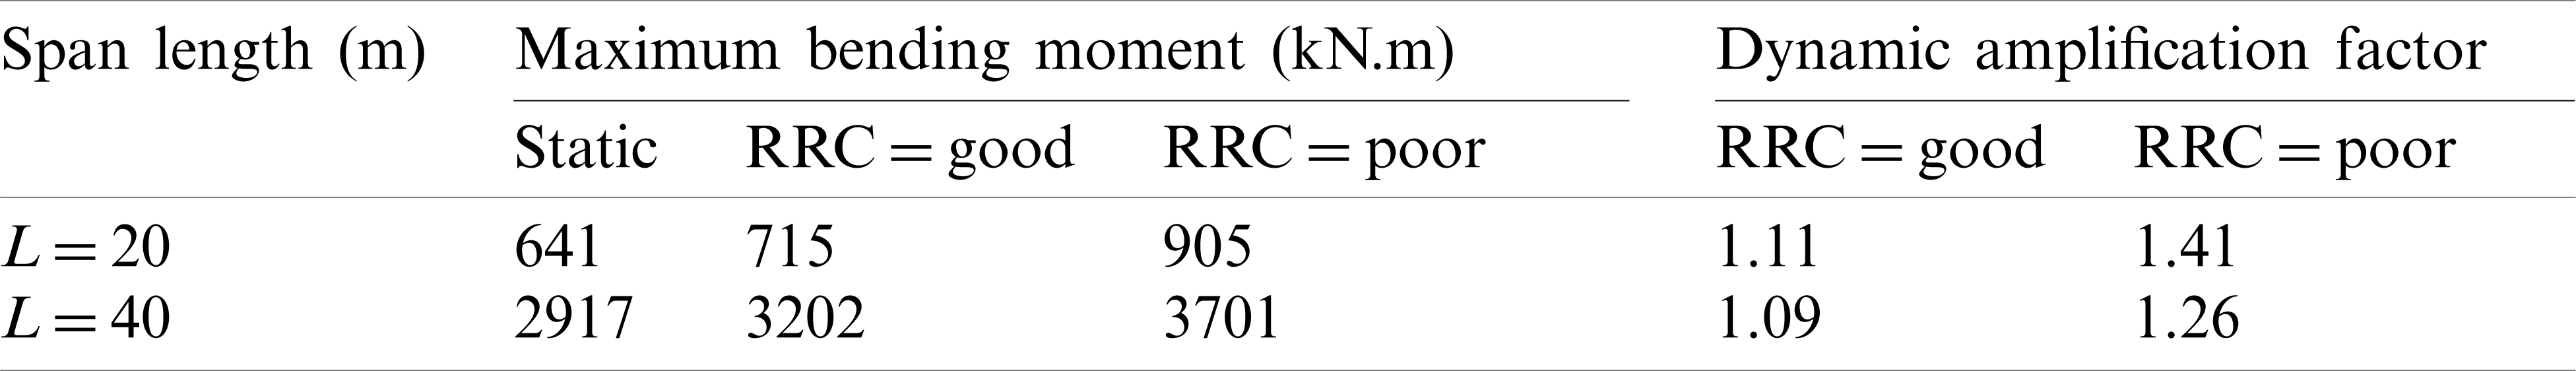
Based on the above analysis, it can be inferred that a bridge with a shorter span-length and a worse RRC has a larger dynamic amplification factor. This conclusion is in accordance with the theoretical basis that a bridge with a shorter span-length has a higher stiffness, which leads to stronger vibrations. Therefore, the influence of dynamic effects on the probabilistic extrapolation of traffic load effects should be considered in the bridge with a shorter span length.
5.3 Probabilistic Extrapolation
For the probabilistic evaluation, 10-year samples (N = 3650 days) were utilized to fit the GEV function as shown in Fig. 11. The corresponding Gumbel cumulative distribution function value is 12.43 for the return period of 1000 years. It is observed that all of the simulated samples and fitting lines are close to a curve line, which mostly results in the lack of samples. Since the traffic load effects follow Gaussian distribution, it can be assumed that the extreme value follows Gumbel distribution.
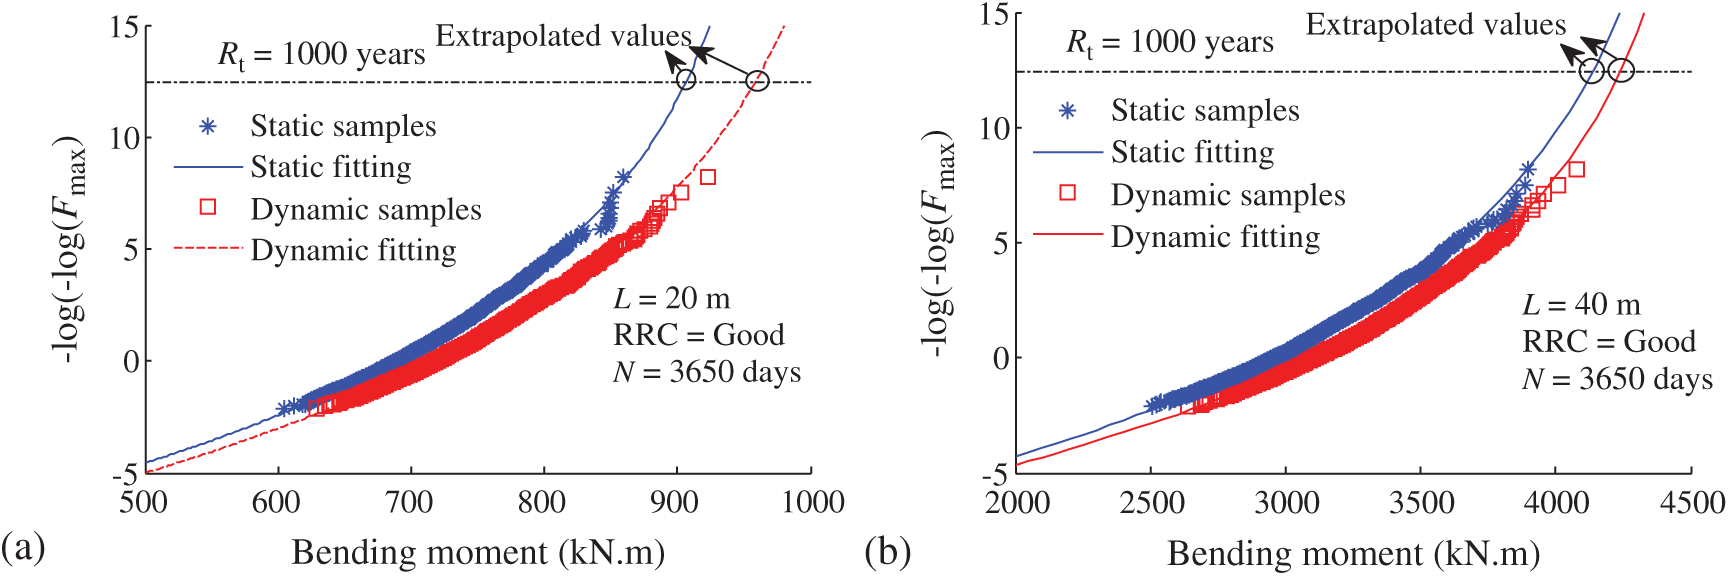
Figure 11: Probabilistic extrapolation on Gumbel distribution: (a) The 20 m girder; (b) The 40 m girder
As shown in Fig. 11, the static and dynamic extrapolations are 902 and 969 kN.m for the bending moment of the 20 m girder, respectively. The static and dynamic extrapolations are 4070 and 4313 kN.m for the bending moment of the 40 m girder, respectively. The corresponding equivalent probabilistic amplification factors are 1.07 and 1.05, respectively. It is an interesting phenomenon that the probabilistic dynamic factor is less than the individual dynamic factor. This might due to the variability of individual samples.
Based on the established probability models, this study examined and compared the traffic load effect accounting for different national design specifications, such as AASHTO, Eurocode 1, BS5400, and D60-2015 in China. The referenced bending moment was considered as a return period of 1000 years and the RRC was considered as good. Tab. 3 summaries the standard values and the corresponding return period of the estimated values and design values.
Table 3: Standard value of the bending moment of the simply supported T-girder bridge for varity design vehicle loads
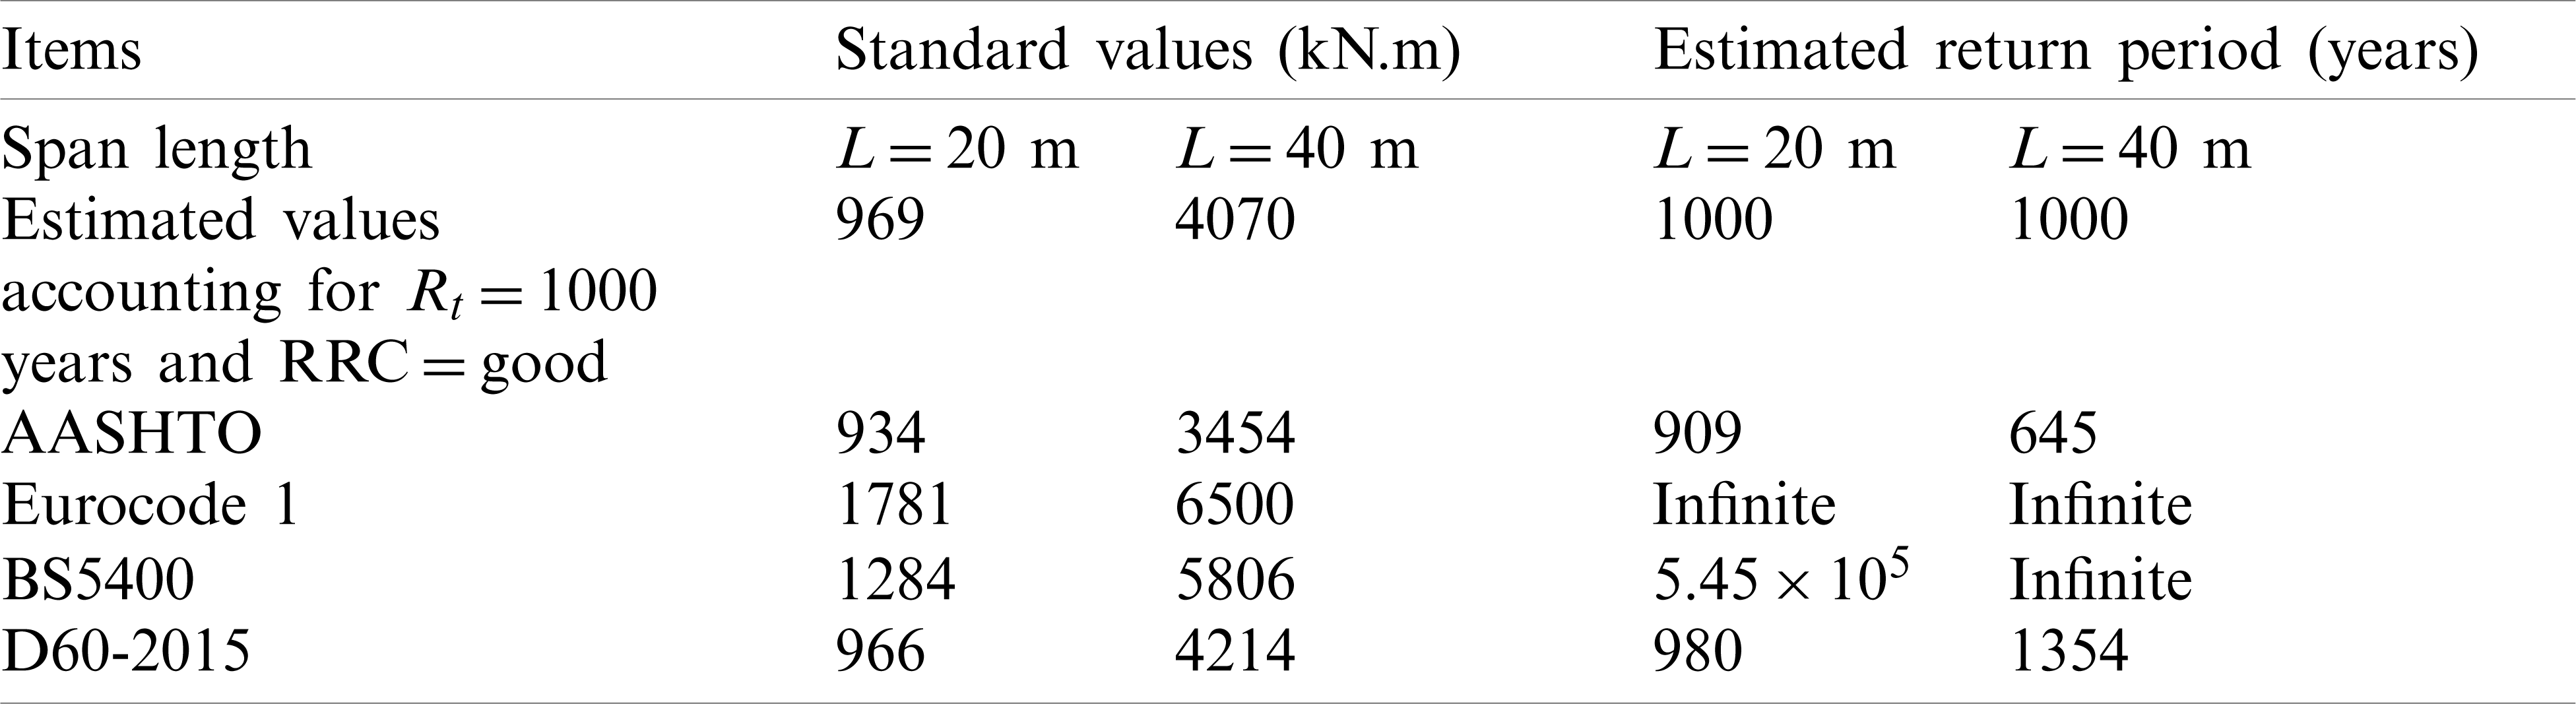
It is observed that Eurocode 1 has the highest standard value compared to the other design specifications and the actual value. In addition, the return period for the Eurocode 1 value is infinite, which can be treated as the most conservative design specification. Subsequently, the BS5400 value is much higher than the estimated value, ASSHTO value and D60-2015 value. The return period for the BS5400 value is approximately infinite. The AASHTO and the D60-2015 have the lowest values, which are close to the estimated values. For the D60-2015 code in China, the standard value for longer span bridges is conservative than short span bridges.
This study presented an efficient computational framework combining vehicle-bridge interaction analysis and probabilistic extrapolation, which provided reasonable characteristic dynamic traffic load effects on short-to-medium span bridges. A stochastic traffic load model can provide a reliable connection for transmitting probability distributions from site-specific traffic loads to the dynamic load effects on the bridge. Case studies of two simply supported bridges were conducted taking into account traffic monitoring data. Comparison of deterministic and probabilistic dynamic amplification factors shows advantages of the proposed computational framework. Based on the site-specific traffic data, the estimated bending moments of the two bridges were utilized to calibrate the characteristic values in several design specifications. The conclusions are summarized as follows:
(1) The stochastic traffic flow model contains the individual vehicle parameters and the probability characteristics estimated from the actual traffic data. In addition, the simulated traffic samples is appropriate for the vehicle-bridge interaction analysis in time domain, where the interspace between the deterministic simulation and probability extrapolation.
(2) The simulated samples follow a curve line in the Gumbel distribution coordinate system. With increase of the number of samples, the extreme value will follow a straight line. This phenomenon demonstrates that the dynamic traffic load effects follow Gaussian distribution, and the extreme values follow Gumbel distribution.
(3) The dynamic amplification factors for the 20 and 40 m girders with a good road roughness condition are 1.11 and 1.09, respectively. However, the equivalent probabilistic amplification factors are 1.07 and 1.05, respectively. It is an interesting phenomenon that the probabilistic dynamic factor is less than the individual dynamic factor, which might due to the variability of individual samples. In other words, equivalent probabilistic amplification factor contains a large number of simulations, while the individual dynamic amplification factor is just one of the data base. Therefore, the probabilistic amplification factor is more reliable.
(4) The vehicle load models in representative national design codes have a great deviation corresponding to the practical traffic data. The design vehicle load model in Eurocode 1 is the most conservative one, followed by the BS5400 specification. The D60-2015 specification in China provides an approximated load model for the practical traffic data. The traffic load model in ASSHTO specification provides the lowest traffic load value that is less conservative for the traffic load in China.
Funding Statement: The research was supported by the National Science Foundation of China (Grant No. 51908068), and the support from the Key Laboratory of Bridge Engineering Safety Control by Department of Education (Changsha University of Science & Technology). Industry Key Laboratory of Traffic Infrastructure Security Risk Management in Changsha University of Science and Technology (Grant Nos. 19KF03, 19KB02), Open Fund of Engineering Research Center of Catastrophic Prophylaxis and Treatment of Road & Traffic Safety of Ministry of Education (Grant No. KFJ190403).
Conflicts of Interest: The authors declare that they have no conflicts of interest to report regarding the present study.
1. Obrien, E. J., Bordallo-Ruiz, A., Enright, B. (2014). Lifetime maximum load effects on short-span bridges subject to growing traffic volumes. Structural Safety, 50(4), 113–122. DOI 10.1016/j.strusafe.2014.05.005. [Google Scholar] [CrossRef]
2. Lu, N., Beer, M., Noori, M., Liu, Y. (2017). Lifetime deflections of long-span bridges under dynamic and growing traffic load. Journal of Bridge Engineering, 22(11), 4017086. DOI 10.1061/(ASCE)BE.1943-5592.0001125. [Google Scholar] [CrossRef]
3. Deng, L., Wang, W., Yu, Y. (2016). State-of-the-art review on the causes and mechanisms of bridge collapse. Journal of Performance of Constructed Facilities, 30(2), 4015005. DOI 10.1061/(ASCE)CF.1943-5509.0000731. [Google Scholar] [CrossRef]
4. Fan, Y., Zhu, J., Pei, J., Li, Z., Wu, Y. (2015). Analysis for Yangmingtan bridge collapse. Engineering Failure Analysis, 56(2), 20–27. DOI 10.1016/j.engfailanal.2015.05.003. [Google Scholar] [CrossRef]
5. Cook, W., Barr, P. J. (2017). Observations and trends among collapsed bridges in New York state. Journal of Performance of Constructed Facilities, 31(4), 04017011. DOI 10.1061/(ASCE)CF.1943-5509.0000996. [Google Scholar] [CrossRef]
6. Han, W., Yuan, Y., Xie, Q., Gao, G. (2019). Load effect, safety assessment, and traffic strategy of multigirder bridges under lateral eccentric customized transport vehicle. Journal of Performance of Constructed Facilities, 33(2), 4018110. DOI 10.1061/(ASCE)CF.1943-5509.0001257. [Google Scholar] [CrossRef]
7. Zhong, H., Yang, M. (2015). Dynamic effect of foundation settlement on bridge-vehicle interaction. Engineering Structures, 135(15), 149–160. DOI 10.1016/j.engstruct.2017.01.006. [Google Scholar] [CrossRef]
8. Deng, L., Cai, C. S., Barbato, M. (2011). Reliability-based dynamic load allowance for capacity rating of prestressed concrete girder bridges. Journal of Bridge Engineering, 16(6), 872–880. DOI 10.1061/(ASCE)BE.1943-5592.0000178. [Google Scholar] [CrossRef]
9. Zhou, J., Shi, X., Zhang, L., Sun, Z. (2019). Traffic control technologies without interruption for component replacement of long-span bridges using microsimulation and site-specific data. Structural Engineering and Mechanics, 70(2), 169–178. DOI 10.12989/sem.2019.70.2.169. [Google Scholar] [CrossRef]
10. Zhou, J., Li, T., Ye, X., Shi, X. (2020). Safety assessment of widened bridges considering uneven multilane traffic-load modeling: Case study in China. Journal of Bridge Engineering, 25(9), 05020008. DOI 10.1061/(ASCE)BE.1943-5592.0001610. [Google Scholar] [CrossRef]
11. Caprani, C. C., Obrien, E. J. (2010). The use of predictive likelihood to estimate the distribution of extreme bridge traffic load effect. Structural Safety, 32(2), 138–144. DOI 10.1016/j.strusafe.2009.09.001. [Google Scholar] [CrossRef]
12. Zhou, G., Yi, T., Chen, B., Zhang, H. (2016). A generalized Pareto distribution-based extreme value model of thermal gradients in a long-span bridge combining parameter updating. Advances in Structural Engineering, 20(2), 202–213. DOI 10.1177/1369433216660010. [Google Scholar] [CrossRef]
13. Ma, Y., Liu, X., Guo, Z., Wang, L., Lu, N. (2020). Predicting corrosion fatigue crack propagation behavior of HRB400 steel bars in simulated corrosive environments. Journal of Materials in Civil Engineering. DOI 10.1061/(ASCE)MT.1943-5533.0003761. [Google Scholar] [CrossRef]
14. Chen, J. B., Li, J. (2007). The extreme value distribution and dynamic reliability analysis of nonlinear structures with uncertain parameters. Structural Safety, 29(2), 77–93. DOI 10.1016/j.strusafe.2006.02.002. [Google Scholar] [CrossRef]
15. Lydon, M., Taylor, S. E., Robinson, D., Mufti, D., Obrien, E. J. (2016). Recent developments in bridge weigh in motion (B-WIM). Journal of Civil Structural Health Monitoring, 6(1), 69–81. DOI 10.1007/s13349-015-0119-6. [Google Scholar] [CrossRef]
16. Obrien, E. J., Schmidt, F., Hajializadeh, D., Zhou, X. Y., Enright, B. et al. (2015). A review of probabilistic methods of assessment of load effects in bridges. Structural Safety, 53(9), 44–56. DOI 10.1016/j.strusafe.2015.01.002. [Google Scholar] [CrossRef]
17. Lu, N. W., Ma, Y. F., Liu, Y. (2019). Evaluating probabilistic traffic load effects on large bridges using long-term traffic monitoring data. Sensors, 19(22), 5056. DOI 10.3390/s19225056. [Google Scholar] [CrossRef]
18. Liu, Y., Wang, Q., Lu, N. (2021). Probabilistic evaluation of maximum dynamic traffic load effects on cable-supported bridges under actual heavy traffic loads. Proceedings of the Institution of Mechanical Engineers Part O—Journal of Risk and Reliability, 235(1), 108–119. [Google Scholar]
19. Deng, L., Yan, W., Li, S. (2019). Computer modeling and weight limit analysis for bridge structure fatigue using openSEES. Journal of Bridge Engineering, 24(8), 04019081. [Google Scholar]
20. Yu, Y., Cai, C., He, W., Peng, H. (2019). Prediction of bridge maximum load effects under growing traffic using non-stationary bayesian method. Engineering Structures, 185(1–2), 171–183. DOI 10.1016/j.engstruct.2019.01.085. [Google Scholar] [CrossRef]
21. Zhou, J., Shi, X., Caprani, C. C., Ruan, X. (2018). Multi-lane factor for bridge traffic load from extreme events of coincident lane load effects. Structural Safety, 72(3), 17–29. DOI 10.1016/j.strusafe.2017.12.002. [Google Scholar] [CrossRef]
22. Ruan, X., Zhou, J., Shi, X., Caprani, C. C. (2017). A site-specific traffic load model for long-span multi-pylon cable-stayed bridges. Structure and Infrastructure Engineering, 13(4), 494–504. DOI 10.1080/15732479.2016.1164724. [Google Scholar] [CrossRef]
23. Kim, J., Song, J. (2019). A comprehensive probabilistic model of traffic loads based on weigh-in-motion data for applications to bridge structures. KSCE Journal of Civil Engineering, 23(8), 3628–3643. DOI 10.1007/s12205-019-2432-9. [Google Scholar] [CrossRef]
24. Xia, Y. X., Ni, Y. Q. (2016). Extrapolation of extreme traffic load effects on bridges based on long-term SHM data. Smart Structures and Systems, 17(6), 995–1015. DOI 10.12989/sss.2016.17.6.995. [Google Scholar] [CrossRef]
25. Lu, N., Liu, Y., Noori, M., Xiao, X. (2020). System reliability assessment of cable-supported bridges under stochastic traffic loads based on deep belief networks. Applied Science, 10(22), 8049. DOI 10.3390/app10228049. [Google Scholar] [CrossRef]
26. Zhu, X. Q., Law, S. S. (2016). Recent developments in inverse problems of vehicle-bridge interaction dynamics. Journal of Civil Structural Health Monitoring, 6(1), 107–128. DOI 10.1007/s13349-016-0155-x. [Google Scholar] [CrossRef]
27. Wang, X., Yue, X., Wen, H., Yuan, J. (2020). Hybrid passive/active vibration control of a loosely connected spacecraft system. Computer Modeling in Engineering & Sciences, 122(1), 61–87. DOI 10.32604/cmes.2020.06871. [Google Scholar] [CrossRef]
28. Zhou, Y., Chen, S. (2015). Fully coupled driving safety analysis of moving traffic on long-span bridges subjected to crosswind. Journal of Wind Engineering and Industrial Aerodynamics, 143(1), 1–18. DOI 10.1016/j.jweia.2015.04.015. [Google Scholar] [CrossRef]
29. Chen, S. R., Cai, C. S. (2007). Equivalent wheel load approach for slender cable-stayed bridge fatigue assessment under traffic and wind: Feasibility study. Journal of Bridge Engineering, 12(6), 755–764. DOI 10.1061/(ASCE)1084-0702(2007)12:6(755). [Google Scholar] [CrossRef]
30. Lu, N., Noori, M., Liu, Y. (2017). Fatigue reliability assessment of welded steel bridge decks under stochastic truck loads via machine learning. Journal of Bridge Engineering, 22(1), 4016105. DOI 10.1061/(ASCE)BE.1943-5592.0000982. [Google Scholar] [CrossRef]
31. Greco, F., Lonetti, P. (2018). Numerical formulation based on moving mesh method for vehicle-bridge interaction. Advances in Engineering Software, 121(2), 75–83. DOI 10.1016/j.advengsoft.2018.03.013. [Google Scholar] [CrossRef]
32. Jiang, L., Feng, Y., Zhou, W., He, B. (2019). Vibration characteristic analysis of high-speed railway simply supported beam bridge-track structure system. Steel and Composite Structures, 31(6), 591–600. DOI 10.12989/scs.2019.31.6.591. [Google Scholar] [CrossRef]
33. Zhu, X., Zeng, L., Li, B. (2019). Vibration analysis of a drillstring in horizontal well. Computer Modeling in Engineering & Sciences, 121(2), 631–660. DOI 10.32604/cmes.2019.06755. [Google Scholar] [CrossRef]
34. Leahy, C., Obrien, E., O’Connor, A. (2016). The effect of traffic growth on characteristic bridge load effects. Transportation Research Procedia, 14, 3990–3999. DOI 10.1016/j.trpro.2016.05.496. [Google Scholar] [CrossRef]
35. Enright, B., Obrien, E. J. (2012). Monte Carlo simulation of extreme traffic loading on short and medium span bridges. Structure & Infrastructure Engineering, 9(12), 1267–1282. DOI 10.1080/15732479.2012.688753. [Google Scholar] [CrossRef]
36. Faranda, D., Lucarini, V., Turchetti, G., Vaienti, S. (2011). Numerical convergence of the block-maxima approach to the generalized extreme value distribution. Journal of Statistical Physics, 145(5), 1156–1180. DOI 10.1007/s10955-011-0234-7. [Google Scholar] [CrossRef]
37. Chen, W., Ma, C., Xie, Z., Yan, B., Xu, J. et al. (2015). Improvement of extrapolation of traffic load effect on highway bridges based on Rice’s theory. International Journal of Steel Structures, 15(3), 527–539. DOI 10.1007/s13296-015-9002-x. [Google Scholar] [CrossRef]
38. Ministry of Communications and Communication. (2015). General code for design of highway bridges and culverts. JTG D60-2015, Beijing, China. [Google Scholar]
39. AASHTO. (2015). LRFD bridge design specifications. 6th edition, Washington, DC: AASHTO. [Google Scholar]
40. ECS (European Committee for Standardization). (2005). Design of steel structures: General rules and rules for buildings. EN 1993-1-1. Brussels, Belgium: ECS (European Committee for Standardization). [Google Scholar]
41. British Standards Institution. (2006). Steel, concrete and composite bridges. Part 2: Specification for loads. BS 5400-2. London, UK: British Standards Institution. [Google Scholar]
 | This work is licensed under a Creative Commons Attribution 4.0 International License, which permits unrestricted use, distribution, and reproduction in any medium, provided the original work is properly cited. |