Engineering & Sciences
| Computer Modeling in Engineering & Sciences |
DOI: 10.32604/cmes.2021.015426
ARTICLE
Micro Hierarchical Structure and Mechanical Property of Sparrow Hawk (Accipiter nisus) Feather Shaft
1Key Laboratory of Solidification Control and Digital Preparation Technology (Liaoning Province), School of Materials Science and Engineering, Dalian University of Technology, Dalian, 116024, China
2School of Civil Engineering, Liaoning University of Technology, Jinzhou, 121001, China
3AVIC Manufacturing Technology Institute, Beijing, 100024, China
4Key Laboratory for Light-Weight Materials, Nanjing Tech University, Nanjing, 211816, China
*Corresponding Authors: Enyu Guo. Email: eyguo@dlut.edu.cn; Tongmin Wang. Email: tmwang@dlut.edu.cn
Received: 31 December 2020; Accepted: 08 February 2021
Abstract: In this study, the real 3D model of the feather shaft that is composed of medulla and cortex is characterized by X-ray computer tomography, and the structural features are quantitatively analyzed. Compression and tensile tests are conducted to evaluate the mechanical performance of the feather shaft and cortex at different regions. The analysis of the 3D model shows that the medulla accounts for
Keywords: Biomechanics; feather shaft; structure; mechanical properties; tomography
After millions of years of natural selection, the birds have adapted to flying in various environments, being the best pilots in nature. This is mainly due to their unique bone and feather structure. The bird flight feathers are considered to be the most complex skin derivative of all vertebrates due to their unique structure [1]. As the backbone of flight feathers, the feather shaft has strong mechanical properties yet with very lightweight characteristics. This lightweight and high-strength feature satisfies the need for tensile, compression and bending performance which is caused by its own motion and air resistance during flight [2–4]. Research on the special structure of the feather shaft may bring inspiration into the design of aircraft structural devices, making it lighter in weight and at the same time with strong mechanical properties.
In recent years, some scholars start to investigate the feather shafts of birds, and the studies mainly focus on charadriiformes and anseriformes. Both Wang et al. [5] and Zou et al. [6] studied the structure of the feather shafts of seagulls (Larus canus). They found that the feather shaft contains calamus and rachis. The calamus is a hollow tube with no vane covered and it is below the skin. The feather rachis is covered with vane and filled with foam-like medulla. Besides, the medulla is surrounded by the cortex. Other researchers found that the feather shaft structures of other birds, such as bean geese (Anser fabalis) and pigeons (Columbia livia) [7,8], also possess very similar structure. In order to understand the composition of the feather shaft, Fraser et al. [9] determined the structure of the protein by X-ray diffraction (XRD) and proved that the feather shaft is composed of
It is pointed out that the research on the structure of the feather shaft is mostly based on 2D images by SEM, whereas the structures are in three-dimension (3D). Therefore, the description of some specific structures such as the porosity of the medulla and the shape of the cell in the medulla is insufficient. Some errors might be produced when calculating the mechanical properties such as the compressive strength due to lack of the quantitative data for specific structures. With the development of X-ray technology, it is readily available to perform 3D analysis of materials using 3D characterization techniques such as X-ray computed tomography (CT) [18]. This technology can be used to analyze the structure of biological materials and obtain quantitative information through the reconstruction of real 3D model. However, to the best of our knowledge there is no such report on the application of this technique to study the feather shaft.
In this study, the feather shaft of the sparrow hawk (Accipiter nisus) is used as the research object. The X-ray microscope is utilized to perform CT scans of the feather shaft to obtain the digital features in the feather shaft. In order to evaluate the mechanical performance of the feather shaft, the compression tests and tensile tests are conducted on different parts of the feather shaft and on the cortex at different positions of the shaft, respectively. The relationships between the shaft structure and mechanical properties are the focus of the current study, and will be discussed.
2 Materials and Experimental Procedures
Flight feathers from sparrow hawk were used in this study. The feathers were purchased from Yishuai Trading Co., Ltd., China. The feathers were noninvasively picked from their habitat. According to the morphological characteristics of bird feathers, the similar primary flight feathers without visible fault bars were chosen for study. The feathers were stored at room temperature (25
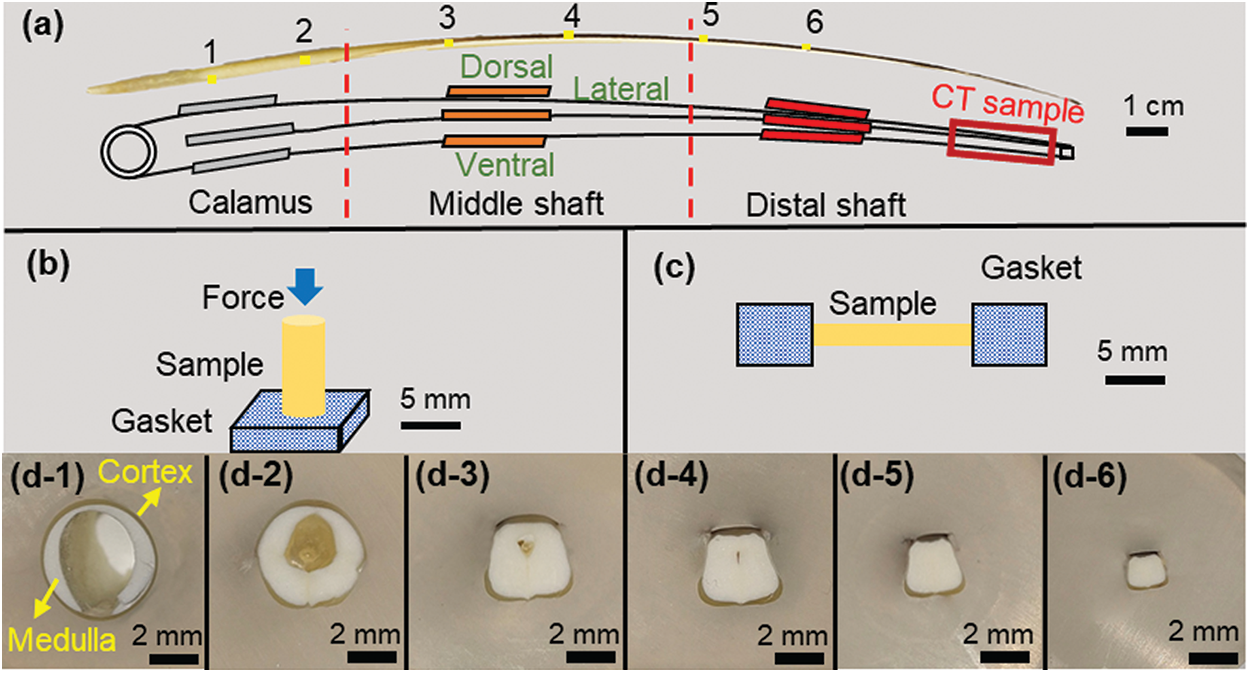
Figure 1: (a) Schematic diagram of sampling locations for different experimental samples of feather shaft; (b) schematic diagram of axial compression test; (c) schematic diagram of the tensile test of the cortex; (d1–d6) the cross-sectional morphology of feather shaft at positions 1–6 in Fig. 1a
2.2 Structural Characterization
2.2.1 2D Morphology Characterization
The structure of the feather shaft was macroscopically observed using optical microscope. The feather shaft was cut into several segments (numbered as 1–6) along the feather axis, as shown in Fig. 1a, and cleaned in ultrasonic environment with alcohol for 10 min. These segments were embedded in epoxy and smoothed by 2000# sandpaper until each transverse section of the feather shaft was exposed.
Furthermore, the specimens were observed in a scanning electron microscope (ZEISS SUPRA 55, Germany). The feather shaft was cut at calamus, middle shaft and distal shaft in the liquid nitrogen environment, and processed into round rod-shaped samples with scalpel. After cleaning with alcohol for 10 min in ultrasonic environment, all samples were coated with a layer of gold using the ion sputter-coater (Quorum Technologies Q150T ES, England). The secondary electron signal was used to observe these samples under the voltage of 15 kV.
2.2.2 3D Morphology Characterization
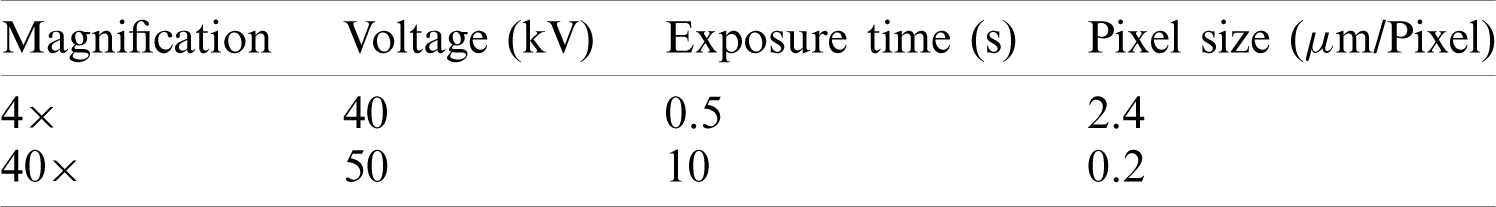
In order to better observe the structure of the feather shaft, X-ray computer tomography of the feather shaft was performed using an X-ray microscope (ZEISS VERSA, Germany). The projected images of the feather shaft structure were reconstructed by Scout and Scan System coupled in the X-ray microscope itself. The data were rendered using Avizo software (FEI VSG, France) to obtain the 3D model and the features were also quantitively analyzed using the same software package. The detailed processing method of slice data can be found in the appendix.
In order to compromise the spatial resolution and sample size, only the distal shaft with
Table 1: The parameters of X-ray microscope used for 3D characterization
Axial compression samples were prepared from the calamus, middle shaft and distal shaft, which correspond to the positions 1, 3 and 5, respectively, in Fig. 1a. These compression samples were divided into five types: ax-calamus, ax-middle shaft, ax-middle shaft-no, ax-distal shaft, ax-distal shaft-no. The “ax” means axial compression and the “no” means the medulla is removed to obtain cortex specimens. For the accuracy of the experiment, the samples in the same position have similar size and shape, and three tests were conducted for each sample condition. The height of the samples is
In this study, the tensile properties of the dorsal, ventral and lateral cortex along the shaft length are examined. The sample positions are shown in Fig. 1a and three sets of parallel samples are tested at each position for good statistics. The sample preparation process is as follows: first, the medulla was removed using a scalpel and was cleaned in an ultrasonic environment with alcohol for 10 min; then, the cortex was carefully cut into rectangular strips without gaps; finally, each sample was glued to the metal gasket, as shown in Fig. 1c. The samples for tensile test have a size of
3.1 Cross-Sectional Morphology of the Shaft
The cross-sectional morphology of sparrow hawk feather shaft varies along the shaft length, as shown in Fig. 1d. At the calamus, the cross-sectional shape is round-like, with the extension to the direction of the distal shaft where the cross section becomes rectangular-like. The cross-sectional dimension of the shaft gradually changes. The equivalent diameter of the calamus cross section is about 5–6 mm, and the length of the cross section at the distal shaft is only 2–3 mm. The white part in the figures is the medulla and it is wrapped by the cortex. It is seen that the shaft is hollow in the central region. Along the direction of the distal shaft, the hollow region gradually disappears as it is filled by the medulla.
The calamus of the feather shaft is a cylinder formed by the cortex. The middle and distal shaft have the same structure in that the cortex is filled with medulla. In order to compare with the CT-3D model of the feather shaft, the most representative SEM images of the distal shaft are shown in Fig. 2a. Fig. 2b shows the interface at high magnification. It is seen that the cortex and medulla are very tightly connected through irregular protrusions with a clear boundary. The barb on the cortex has a hollow structure which helps to reduce the weight of feathers, as shown in Fig. 2c. The medulla exhibits a closed-cell foam-like structure. In addition, the cells that make up the medulla are uniform in shape and size, and are nearly circular with a diameter of
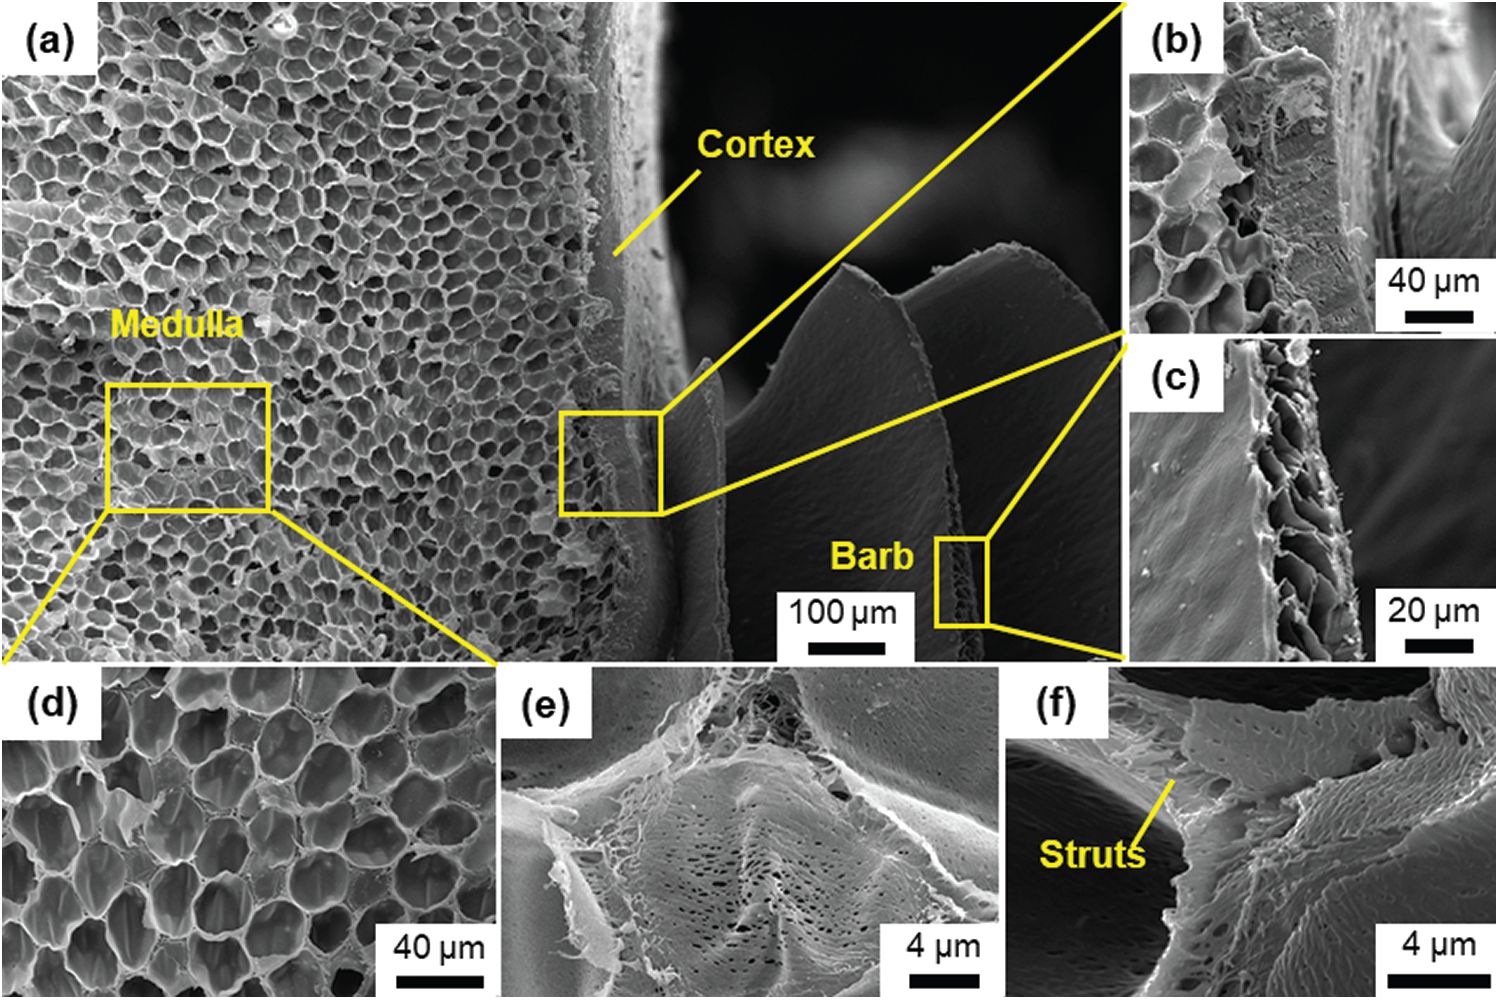
Figure 2: The SEM images showing the details of (a) the distal shaft, (b) the medulla and cortex, (c) the barb of the shaft, (d) the medulla of the shaft, (e) the single cell in the medulla, and (f) the struts between cells
3.3 3D Reconstruction Model of Feather Shaft
Fig. 3a shows the 3D model of the feather shaft. In this model, the blue and green part represents the cortex of the feather shaft and medulla, respectively. Each cell in the medulla is quantified in size and the result is shown in Fig. 3b. The cells are individually colored in the figure. The volume of the cell presents a Gaussian normal distribution with the maximum value of
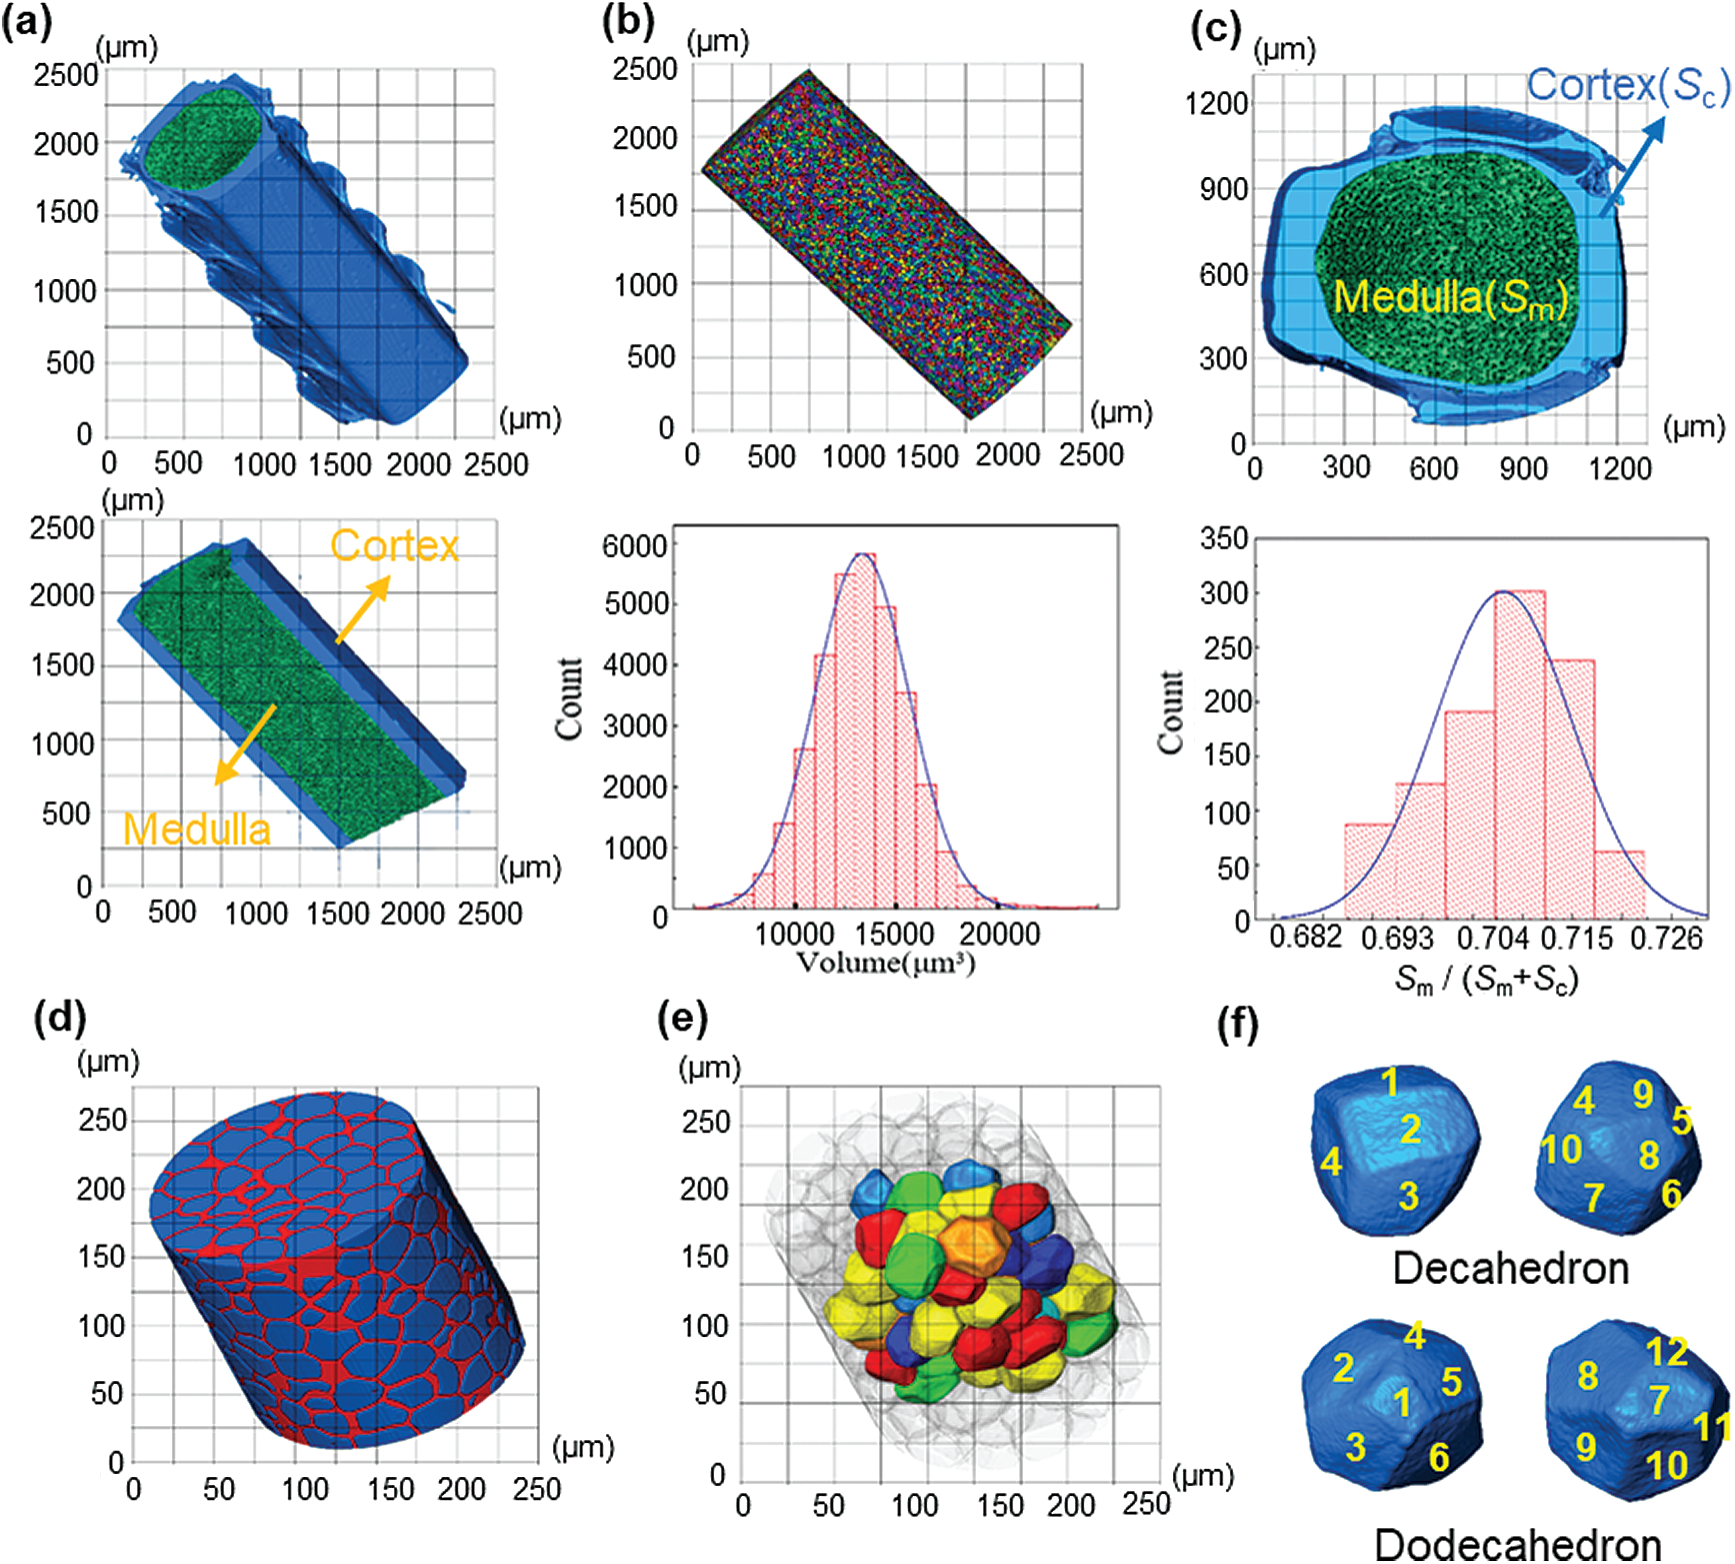
Figure 3: (a) The 3D rendering of feather shaft; (b) the extracted 3D medulla cells and their volume distribution; (c) the cross-section of medulla and analysis of the proportion of medulla in the feather shaft; (d) extracted magnified 3D model of medulla; (e) the 3D complete cells extracted from medulla; (f) representative single cell
After calculation, the porosity of the medulla is 59%. Besides, the proportion of medulla in the shaft is 69%–72%, which is calculated by
The medulla was further examined in 3D with high resolution of 0.2
3.4 Axial Compression Test Results
Figs. 4a-1–4a-5 show the deformed samples of the feather shaft and different instability states of the samples after compression. The ax-calamus and ax-middle shaft-no show progressive buckling, while the ax-distal shaft, ax-distal shaft-no show Eulerian buckling, and the ax-middle shaft is somewhere in between. This phenomenon may be related to the difference in the length to diameter ratio.
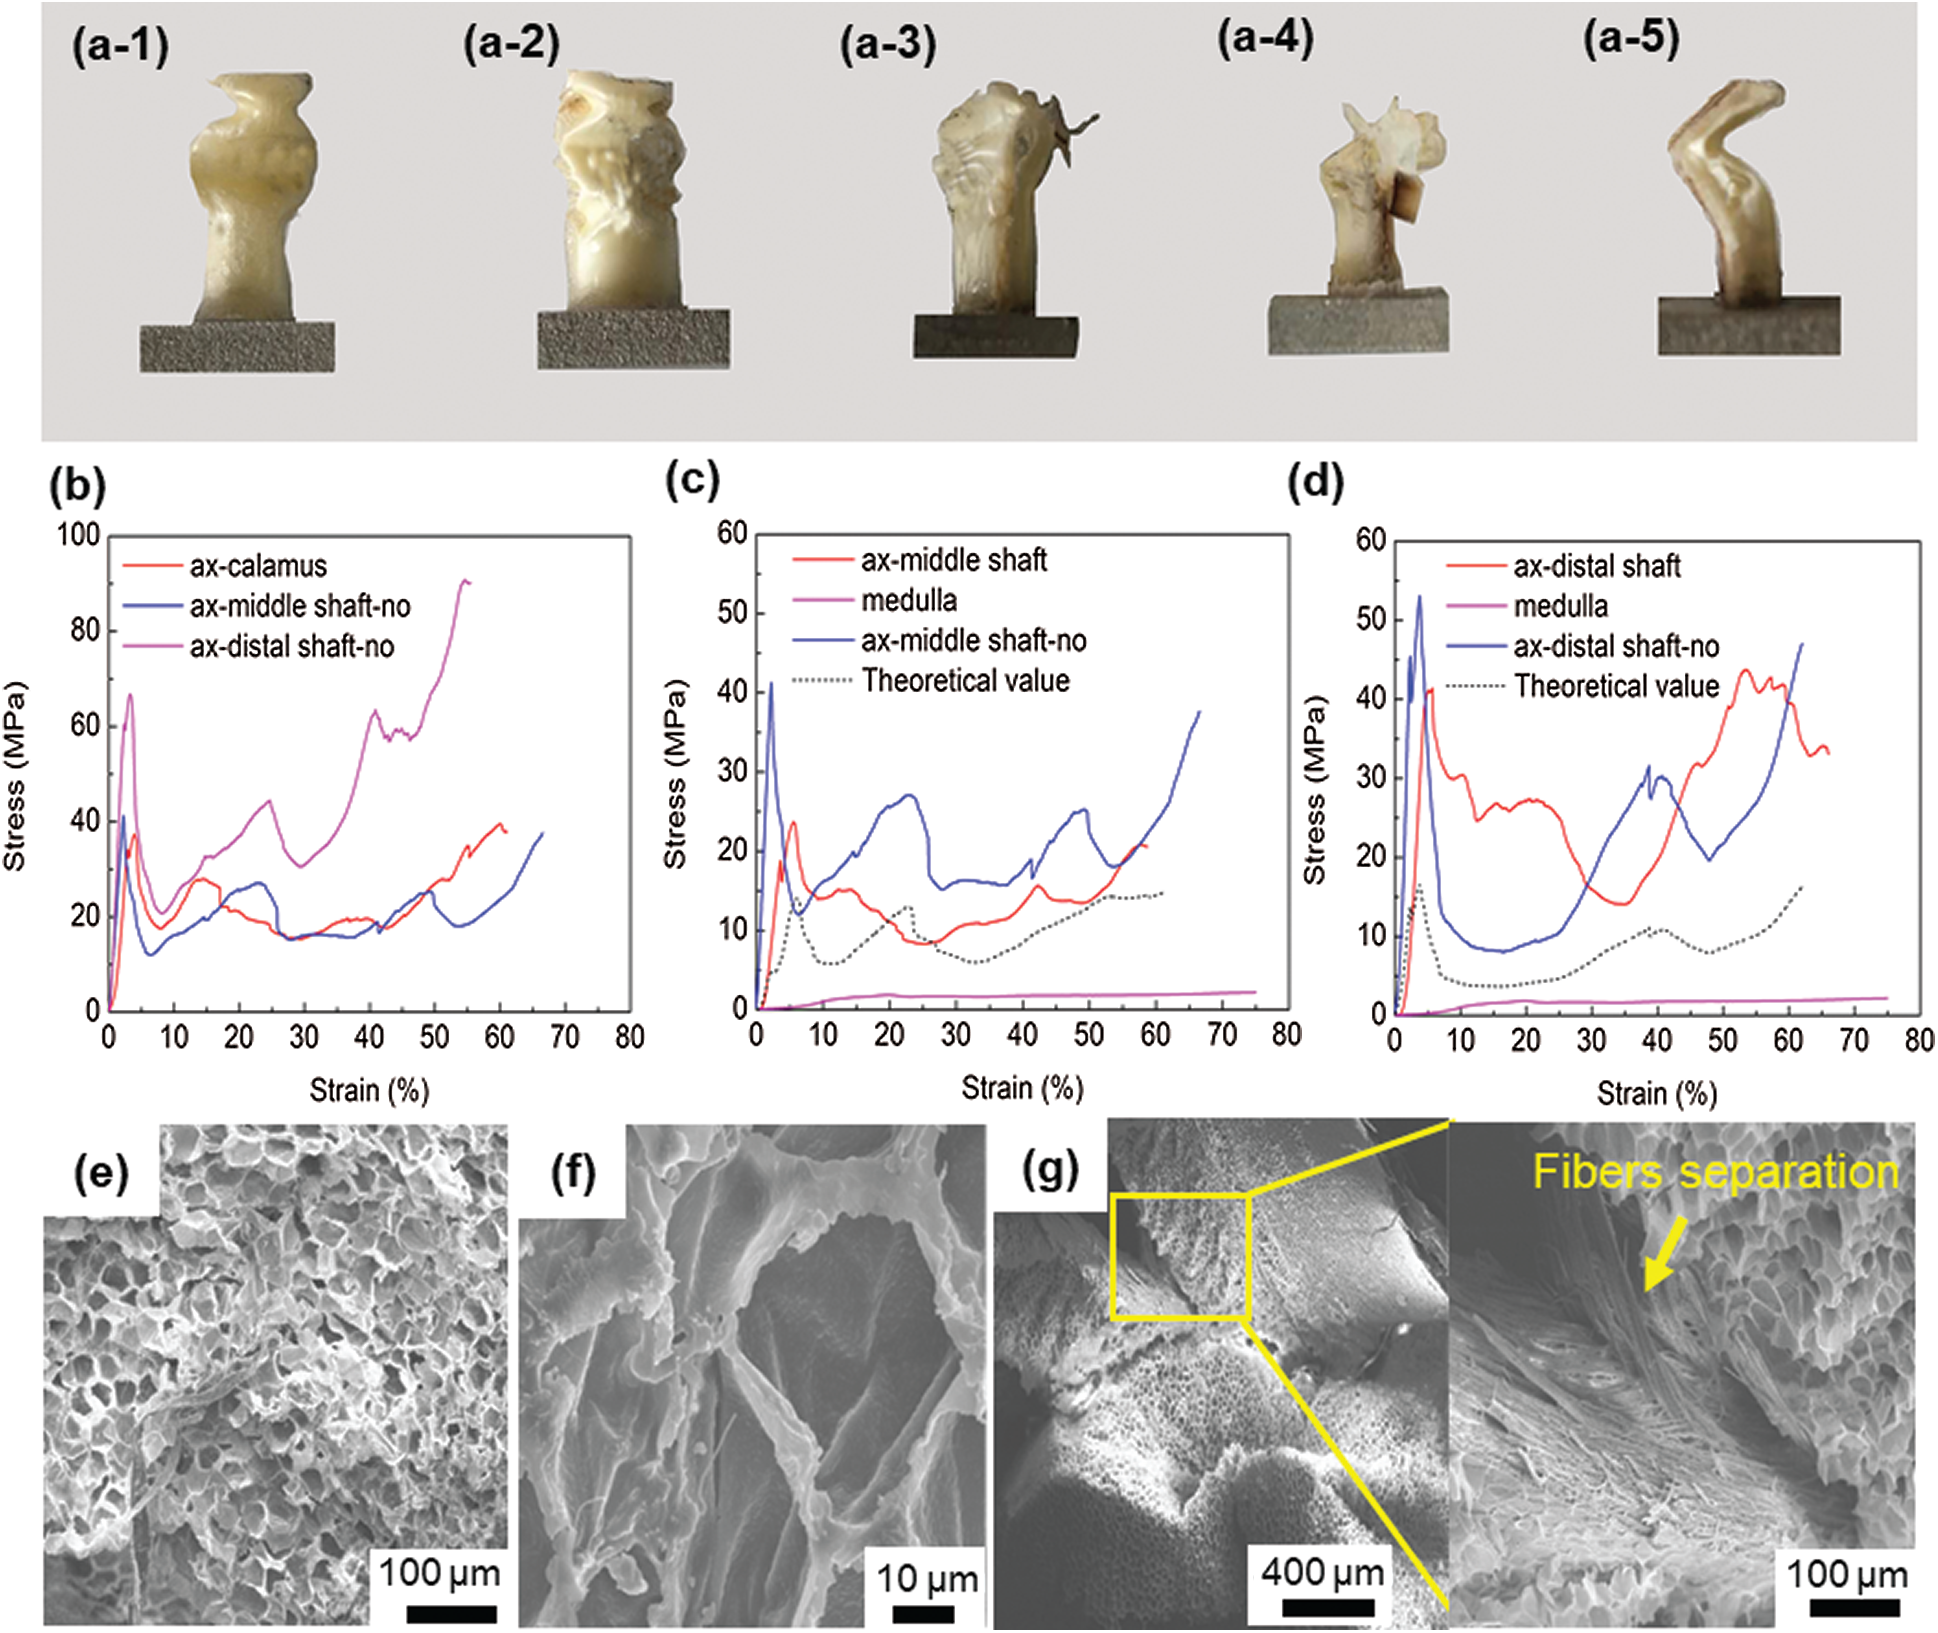
Figure 4: (a1–a5) The morphology of the samples after axial compression, 1–5 represent ax-calamus, ax-middle shaft-no, ax-middle shaft, ax-distal shaft, and ax-distal shaft-no, respectively; (b) typical compression stress-strain curves of cortex without medulla; (c) typical axial compression stress-strain curves in middle shaft; (d) typical axial compression response in distal shaft; (e) typical medulla with altered shape after compression; (f) deformed single cell; (g) shows the separation between cortex and medulla, with the magnified image showing the separation of fibers in the cortex
Fig. 4b shows the typical cortex compression response at different sampling locations. The compressive curves exhibit a typical elastic deformation mode at the early stage, then, the stress value suddenly drops and fluctuates. The first peak point is considered as the critical point of buckling of the sample, and the maximum slope of the curve before this point is considered as the compressive Young’s modulus [13,16]. The buckling strength of the cortex at the calamus, middle shaft and distal shaft samples is 37, 41 and 67 MPa, respectively. Correspondingly, the Young’s modulus is 1.6, 2.8 and 3.4 GPa. The buckling strength and modulus gradually increase along the extension direction of the distal shaft.
In order to better show the contribution of medulla and cortex to buckling strength, the compression properties of the medulla were separately studied. Due to the foam-like structure of the medulla, its effective area (
The stress value (
The calculated stress–strain curve and the experimentally measured curve of middle shaft and distal shaft are shown in Figs. 4c and 4d. The buckling strength of the medulla is only 2 MPa, while medulla shows good stability without curve fluctuation. It is found that the buckling strength of the middle and distal shaft filled with medulla is much higher than the theoretical strength of medulla and cortex calculated using the linear mixed rule.
The compressed samples were observed in SEM, and Figs. 4e–4g show the most representative images of the ax-middle shaft. The overall integrity of the medulla is destroyed, and the deformed structure results in stacking, as shown in Fig. 4e. As for the single cell, its shape becomes irregular, however, the cell wall is not damaged, as shown in Fig. 4f. It is seen that the cortex is separated from the medulla after compression, as shown in Fig. 4g. Besides, the fibers of the cortex are also separated, as shown in high magnification image of Fig. 4g.
3.5 Tensile Test Results of Cortex
Tensile tests were carried out for the cortex at different positions along the length of the feather shaft to further understand the mechanical performance of the cortex in a tensile loading condition. Fig. 5 shows the tensile response of cortex strips of dorsal, lateral, and ventral regions along the shaft length, and the specific mechanical properties including strength, Young’s modulus and breaking strain are summarized in Tab. 2. The stress-strain curves of all samples are very similar in that each curve first undergoes a uniform elastic deformation stage that is approximately straight, and then followed by a non-uniform deformation stage until the sample breaks. As for the tensile strength, cortex of the dorsal, ventral, and lateral of the calamus is almost the same (
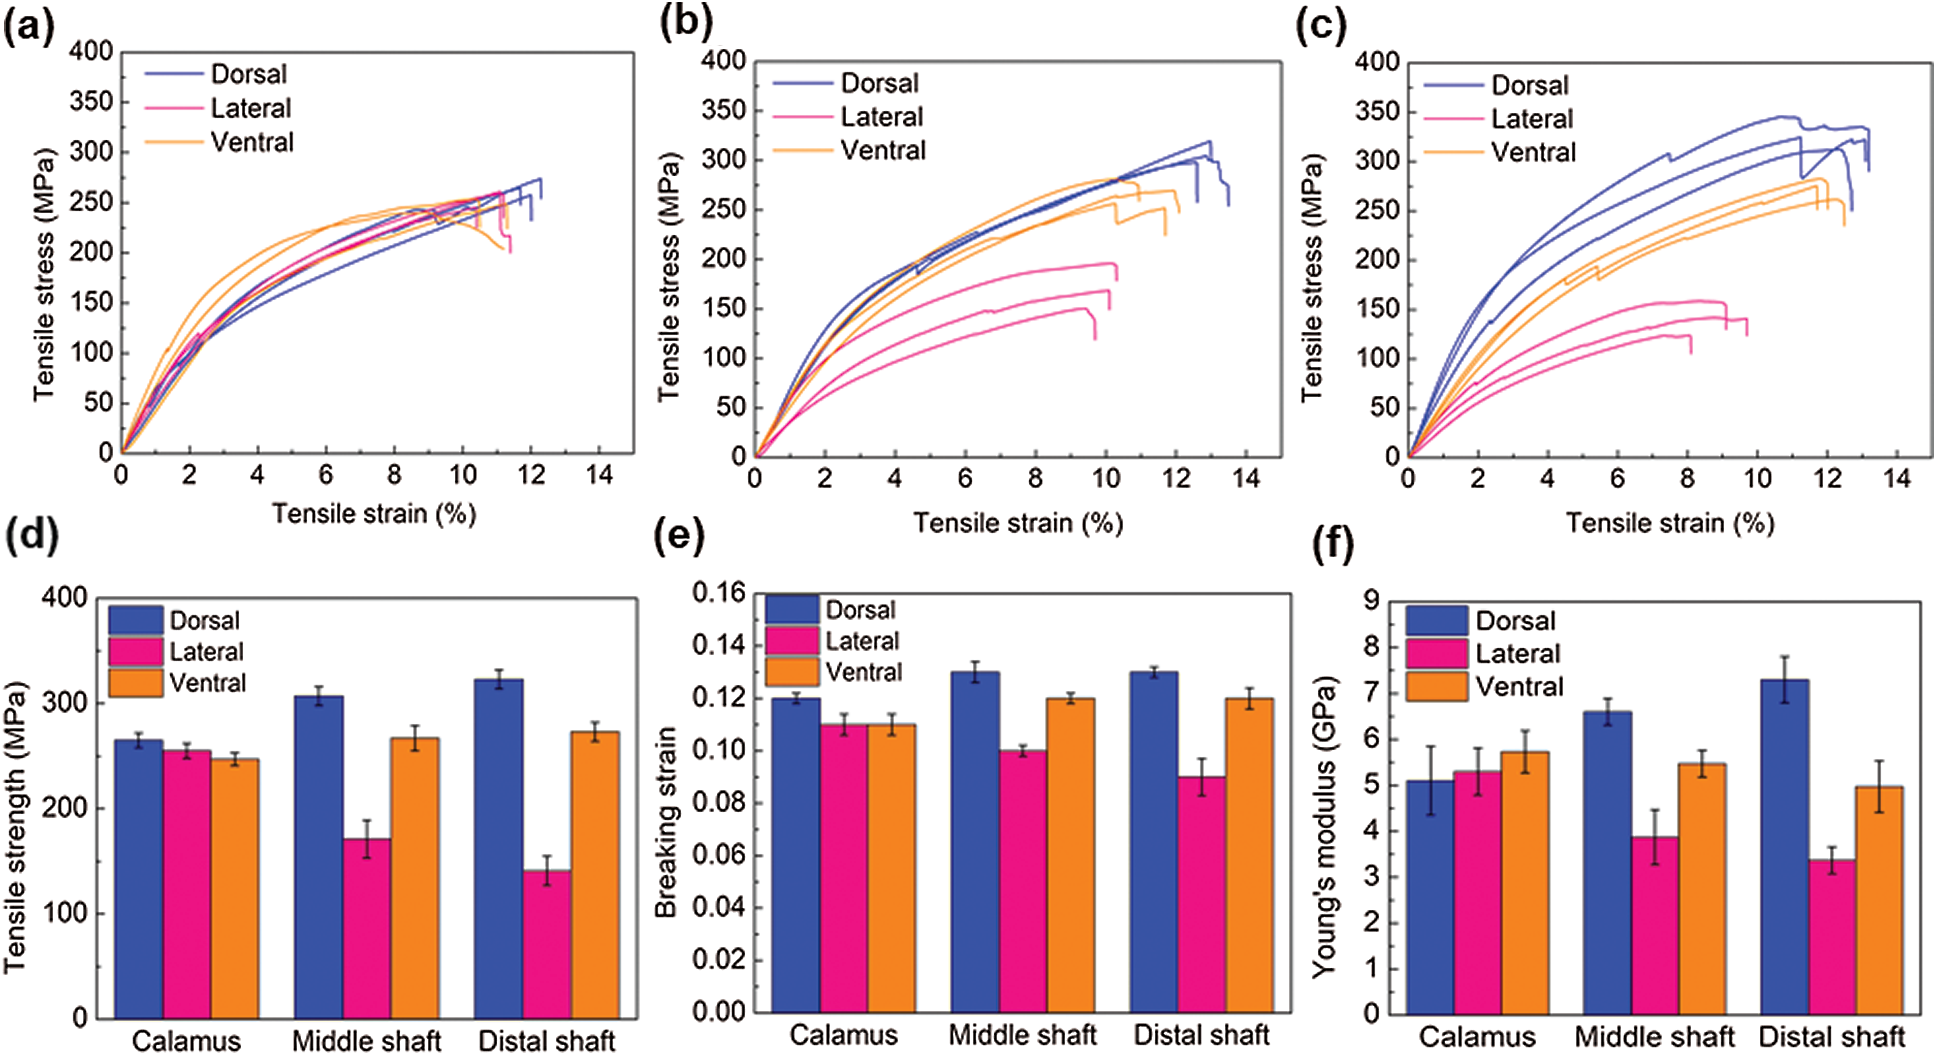
Figure 5: Tensile stress–strain curves of the cortex of (a) calamus, (b) middle shaft, and (c) distal shaft; (d–e) the variation of (d) Young’s modulus, (e) tensile strength, and (f) breaking strain of the dorsal, lateral and ventral cortex strips along the shaft length
Table 2: Tensile results of dorsal, ventral and lateral cortex strips along the shaft length
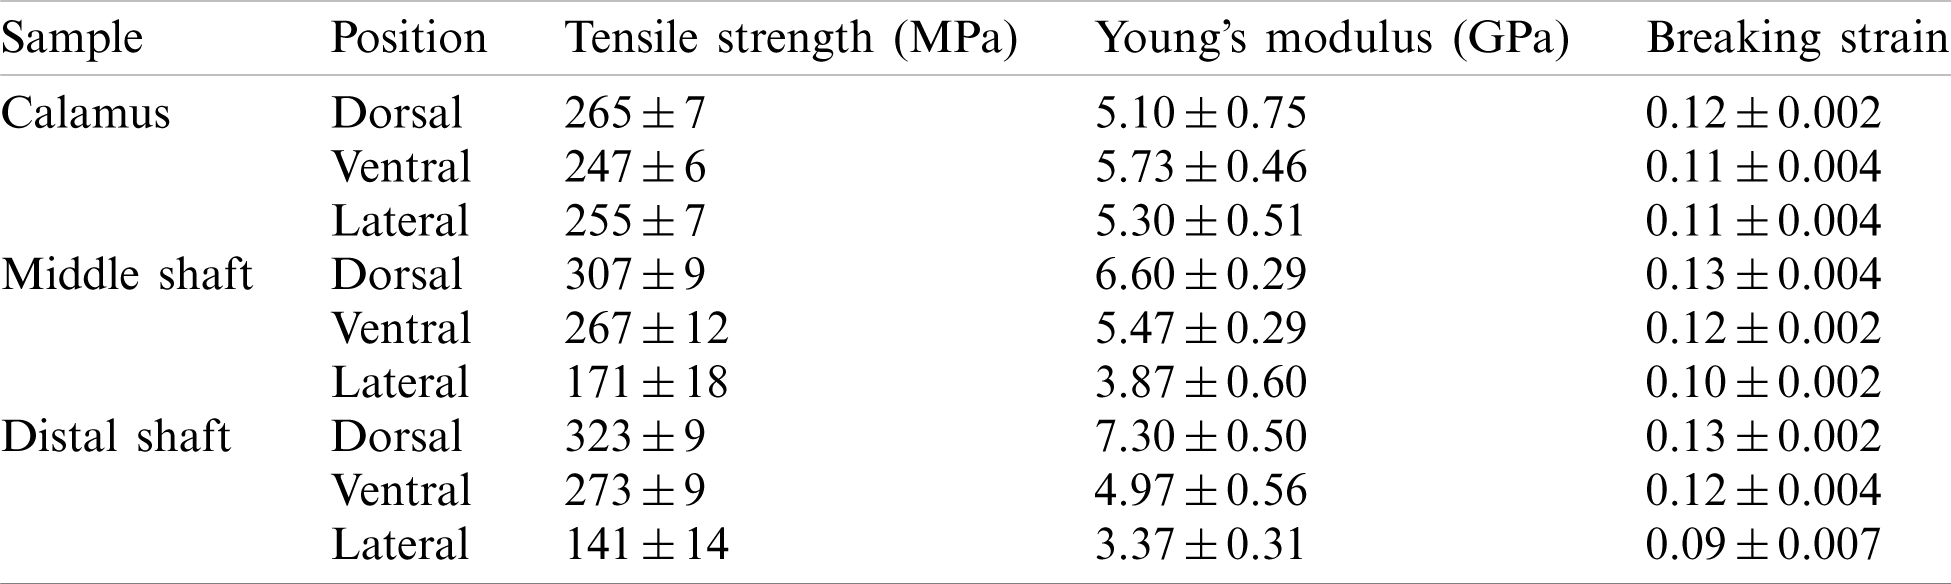
The breaking strain of the cortex at different parts of the feather shaft is almost the same (about 0.12), with a slightly lower value observed for the lateral of middle and distal shaft, as shown in Fig. 5e. The Young’s modulus in the tensile specimen is calculated using the slope of the elastic stage of the curve [16], as shown in Fig. 5f. The results show that the modulus of the cortex on the dorsal of calamus is about 5.1 GPa. The modulus at the same position of the middle and distal shaft is 29% and 43%, respectively, higher than that of calamus. The Young’s modulus of the ventral and lateral tends to decrease from the calamus to the distal shaft. The modulus of the calamus and distal shaft is about 5.3 and 3.4 GPa, respectively, the modulus of distal shaft is 36% lower than that of the calamus. The Young’s modulus is within the reported modulus of barn owls and pigeon, which is 3–7 GPa [22].
The unique structure of the feather shaft that combines the foam-like medulla and strong cortex determines the excellent compression and tensile properties of sparrow hawk, and enables its extremely strong flying ability. The cross-section of the feather shaft is not uniform along the axis direction. Extending from the calamus to the distal shaft, the cross-section of the shaft changes from circular to rectangular morphology. This change can reduce the weight of the shaft while maintaining good rigidity. The calamus needs to be circular to penetrate smoothly into and connect efficiently with the tissue. As for the distal shaft, it is exposed to the skin and bears more air resistance during flight. The rectangular cross-section can better maintain the overall shape of the shaft. Wang et al. [23] also proved that the cross-section having the rectangular morphology is more rigid than the circle with the same area, and can maintain the original shape during flight. Feather shafts from other volant birds generally exhibit similar feature characteristics, such as pigeon and bar owl [8,22]. Note that the cross-section of the peacock feather shaft is basically round throughout its length [20]. The existence of structural change along the feather shaft in sparrow hawk further confirms that this cross-sectional shape change is beneficial to the flying.
In addition, the equivalent diameter of the cross-section of the feather shaft gradually decreases along the feather shaft (from the calamus to distal shaft) resulting in changes in the buckling form of compression samples at different positions. This change is related to the length to diameter ratio. Andrew et al. [24] found that if the length to diameter ratio is beyond a certain threshold, tubes fail by Eulerian buckling. The samples used in the current study have the same length, and the length to diameter ratio gradually increases from calamus to distal shaft. The length to diameter ratio of the calamus, middle shaft and distal shaft is about 2, 2.4 and 4, respectively. As the ratio of length to diameter increases (between 2 and 4), the buckling form of the feather shaft changes from progressive buckling to Eulerian buckling.
The weight of feathers is an important aspect that restricts the flight ability of the sparrow hawk. It is seen from the 3D model reconstructed by CT that the medulla occupies about 70% of the volume of the feather shaft. The foam-like structure of the medulla greatly reduces the weight of the shaft. Furthermore, the small cavities on the cell wall further reduce the weight [25].
The existence of medulla also has extraordinary significance to the compression test of the feather shaft. Darvizeh et al. [26] found that the low strength polyurethane foam provides stability to slender metal tubes during axial compression. Torres et al. [27] showed that the foamy core of porcupine quills can retardate catastrophic destruction. In this study, it is again confirmed that the presence of the foam-like medulla increases the buckling strength of the shaft structure. During the axial compression test, the force is transferred from the cortex to the medulla and the cortex also limits the deformation of the medulla during compression. This enables the cell wall of the medulla to provide a larger area to withstand the force. Besides, we observed through the reconstructed 3D model that the shape of the cell is dodecahedron and decahedron, which is similar with the hexagonal and pentagonal cells observed by Schelestow et al. [13]. This means that under the same volume, decahedron and dodecahedron cells can provide a larger bearing area than spherical cells. When axial compression occurs, these cell walls dent inwards to absorb the loading force and improve the overall stability of the medulla, as shown in Figs. 4e and 4f.
In addition, the actual buckling strength of the middle and distal shaft (23 and 41 MPa, respectively) is 77% and 141%, respectively, higher than the theoretical value (13 and 17 MPa, respectively) using the linear rule. This phenomenon was also revealed in Wang’s experiment on seagull feather shafts [5]. During axial compression test, they found that the load carried by rachis is much greater than the sum of the loads carried by the medulla and cortex with the same area. This is attributed to the layer of medulla attached to the inner side of the cortex after compression, as revealed in Fig. 4g. Besides, it can be seen from the high-magnification image of Fig. 4g that the fibers of the cortex are separated under the compressive force.
Three main processes should take place during the axial compression: (i) separation of the medulla and cortex, (ii) separation of fibers on the cortex, and (iii) deformation of the medulla under loading. However, the sequence of these three processes is not determined in the current study which would be possible after conducting a more detailed in-situ mechanical experimental research in the scanning electron microscope and three-dimensional X-ray computed tomography in the future.
Compared to the medulla, the strength of the feather shaft is largely determined by the cortex. From the results of axial compression and tensile tests, it is shown that the properties of cortex at different positions is anisotropic. Fig. 6 shows the SEM morphology of the samples after tensile test. It is found that the stretch fracture and anisotropy of performance is closely related to the fiber structure. The tensile strength, breaking strain and Young’s modulus of the dorsal, lateral and ventral of the calamus are similar, as shown in Fig. 5a, and their fracture forms are tortuous fractures, as shown in Figs. 6a-1 and 6a-2. The appearance of this type of fracture is related to fiber rupture. The fibers of the cortex present obvious delamination. Circumferential fibers and axial fibers are observed to be present in the outer layer and inner layer, respectively, as shown in Figs. 6a-3 and 6a-4. When tensile fracture occurs, the circumferential fibers of the outer layer provide little axial support, but can restrain the splitting of the axial fibers, leading to the tortuous fracture. This tortuous fracture is more obvious than the reported transverse straight fracture of the seagull calamus [5]. This is because the cortex of sparrow hawk calamus has fewer circumferential fibers than the seagull. This kind of fiber delamination phenomenon becomes insignificant at the dorsal of the middle shaft. And as the quantity of circumferential fiber decreases, the extension length of the fracture in the axial direction increases, as shown in Fig. 6b.
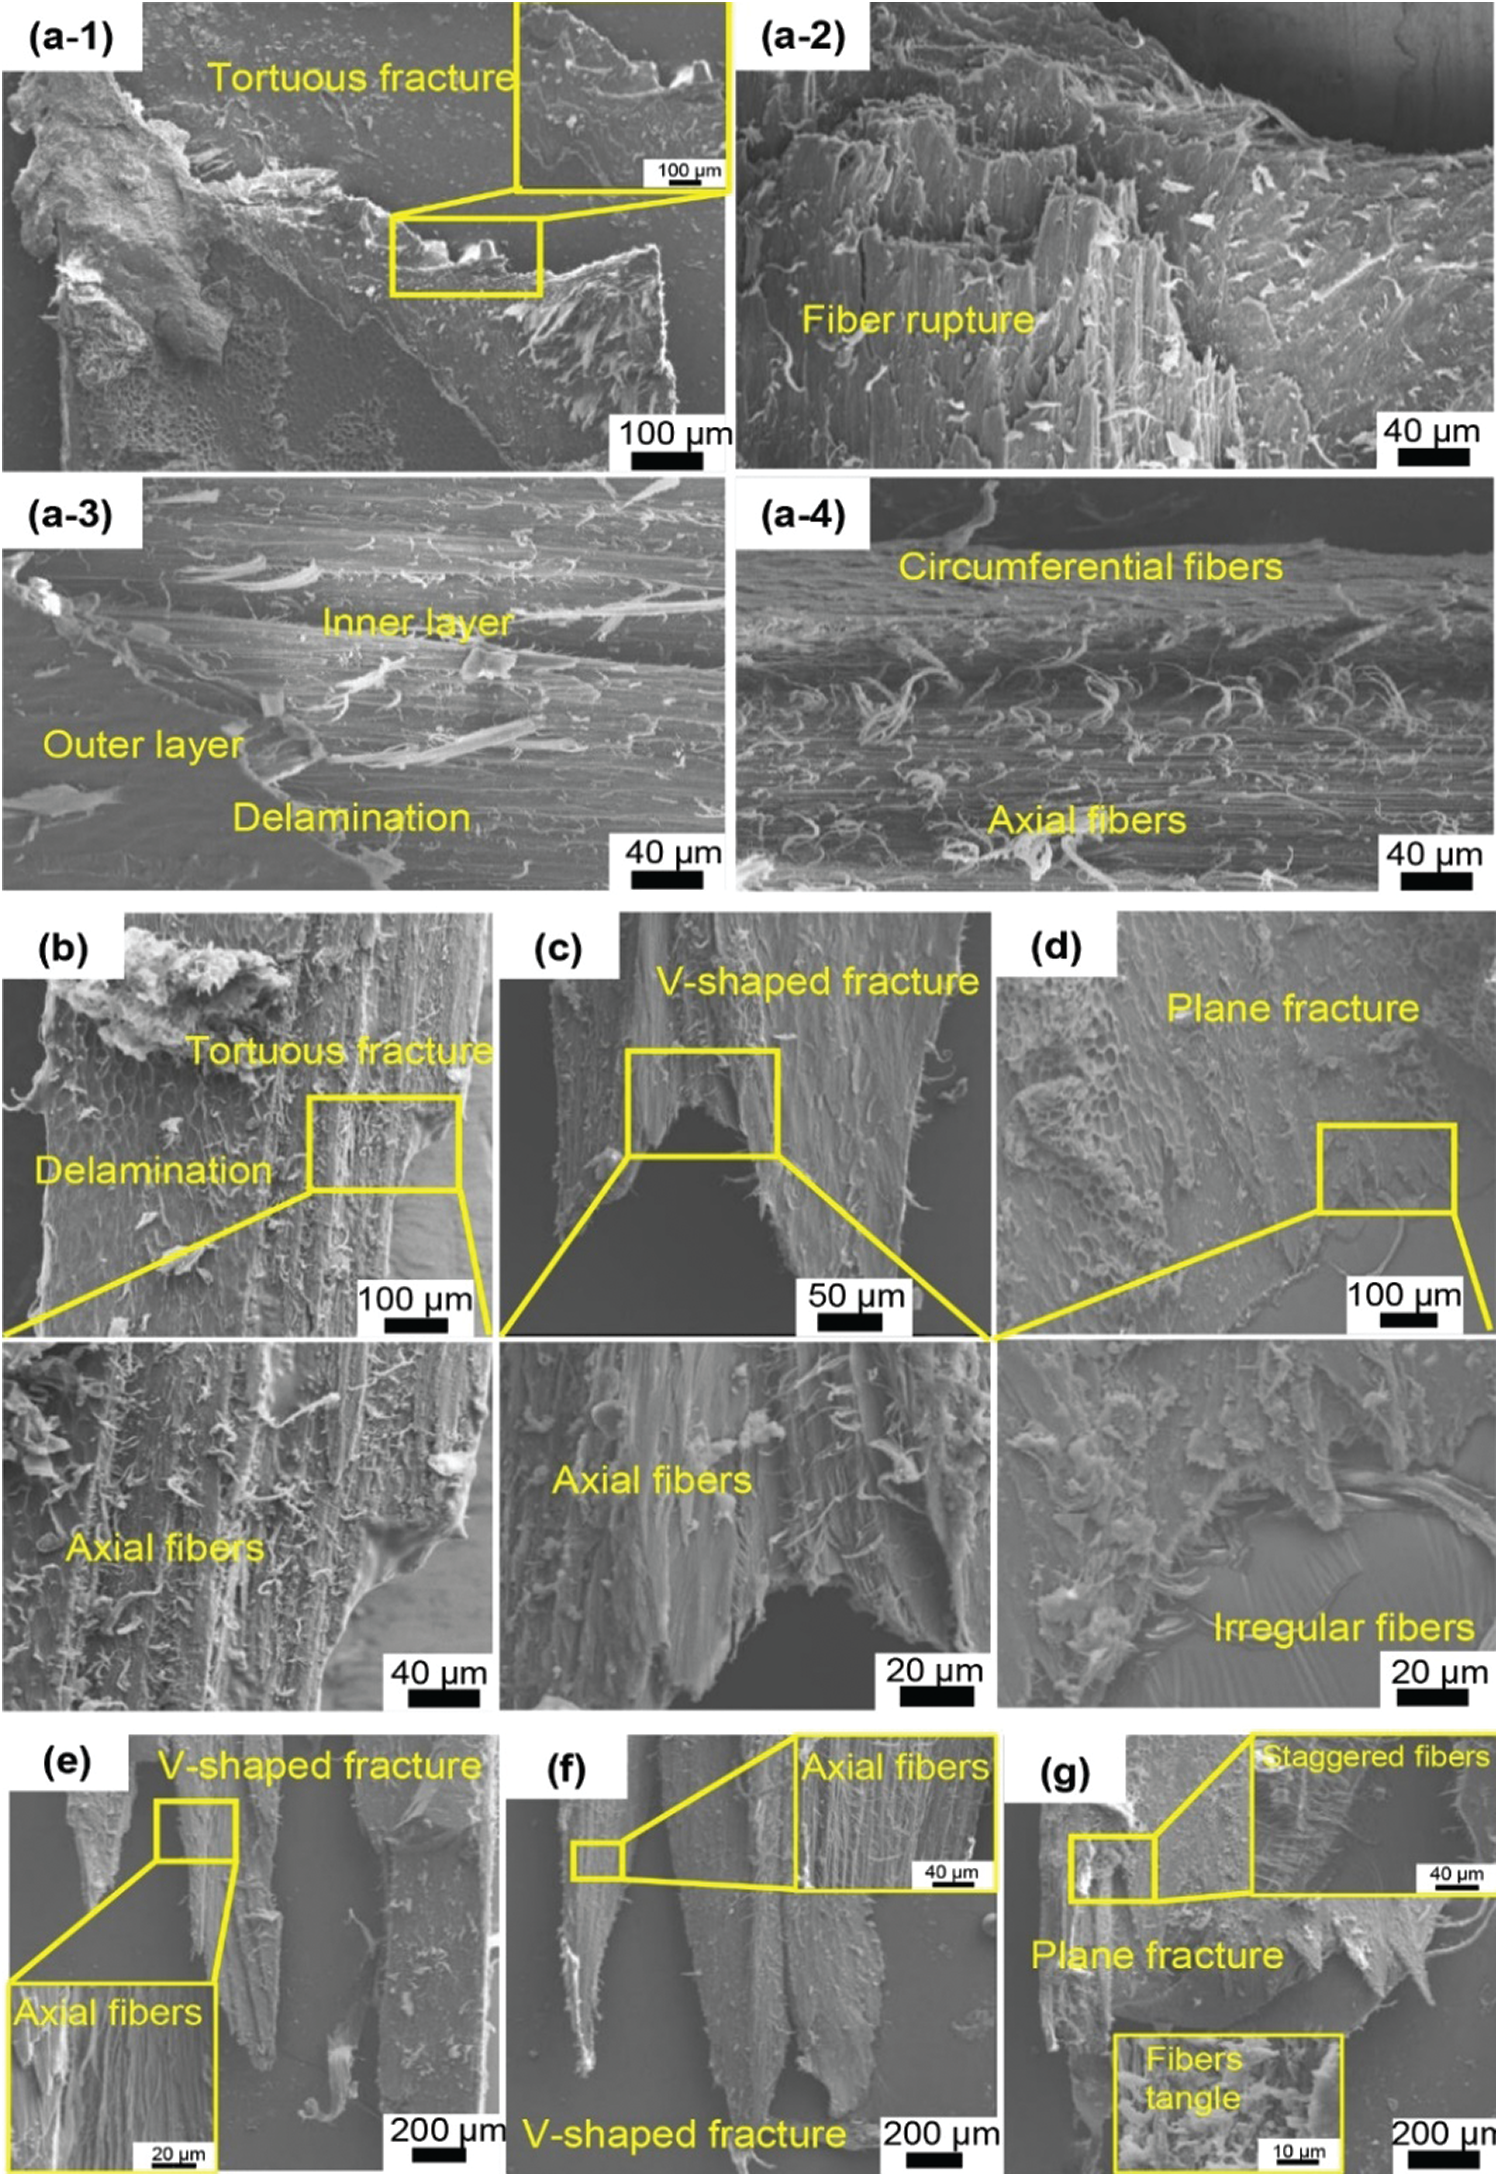
Figure 6: SEM images of tensile fractured cortex specimens along the shaft length: (a1–a4) the dorsal, lateral and ventral cortex of the calamus all show a tortuous fracture due to the fiber delamination, which means the outer circumferential fiber wraps the inner axial fiber; (b) the dorsal of middle shaft has insignificant delamination; (c) the ventral of middle shaft, (e) the dorsal and (f) ventral of distal shaft all show a V-shaped fracture; (d) and (g) show the plane fracture for the lateral of middle and distal shaft, respectively
As shown in Figs. 5b and 5c, the tensile performance of the dorsal and ventral of the middle and distal shaft is significantly better than that of the lateral. This mainly depends on the way the fibers are arranged. The ventral of the middle shaft, the dorsal and the ventral of the distal shaft are all composed of axial fiber, so that the fracture along the axial length is further increased and becomes the V-shaped fracture, as shown in Figs. 6c, 6e and 6f. This is consistent with reports that towards the distal shaft the volume of circumferential fibers decreases [28]. In Wang’s research, the fracture of the cortex at the same position of seagull feather shaft still shows a transverse straight fracture [5]. In these positions, there is a thinner circumferential fiber layer on the outer side of the seagull feather shaft, which is not observed on the feather shaft of the sparrow hawk. When subjected to axial tension, some of the axial fibers break first, yet the whole cortex is not broken. This also explains why the fluctuations of the curve in Figs. 5b and 5c often appear in the ventral of the middle shaft, the dorsal and the ventral of the distal shaft. This part of the broken fiber will cause the stress to drop suddenly, while the stress continues to increase upon loading. Therefore, the fracture extends in the axial length and forms a V-shaped fracture.
At the same time, since the fibers of the dorsal cortex gradually tend to distribute in the axial direction as the shaft extends from the calamus to the distal shaft, the Young’s modulus and strength gradually increase. And the modulus of the cortex during stretching is higher than that during compression. This is determined by the structural characteristics of the fiber material itself. The fiber arrangement in the lateral cortex of the middle and distal shaft is disordered, and there are many staggered fibers and fiber tangles, as shown in Figs. 6d and 6g. These staggered fibers have little effect on axial unidirectional stretching, but they can maintain shape stability. Therefore, the tensile strength of the lateral cortex of the middle and distal shaft is much lower than that of the other positions, as shown in Figs. 5b and 5c.
Based on the above experimental results, the hierarchical structure of the sparrow hawk feather shaft is extracted and is shown in Fig. 7. The calamus is only composed of cortex, and the rachis is composed of cortex and medulla. As shown in Fig. 7a, the outer cortex tightly wraps the inner medulla in the distal shaft. The closed-cell foam-like medulla is filled with decahedral and dodecahedral cells, and there are many cavities on the cell wall which are formed by staggered fibers. This unique structure enables the medulla to reduce the weight of the shaft to the greatest extent. Besides, the presence of medulla and the combination of medulla and cortex also greatly improves the axial compression performance of the shaft.
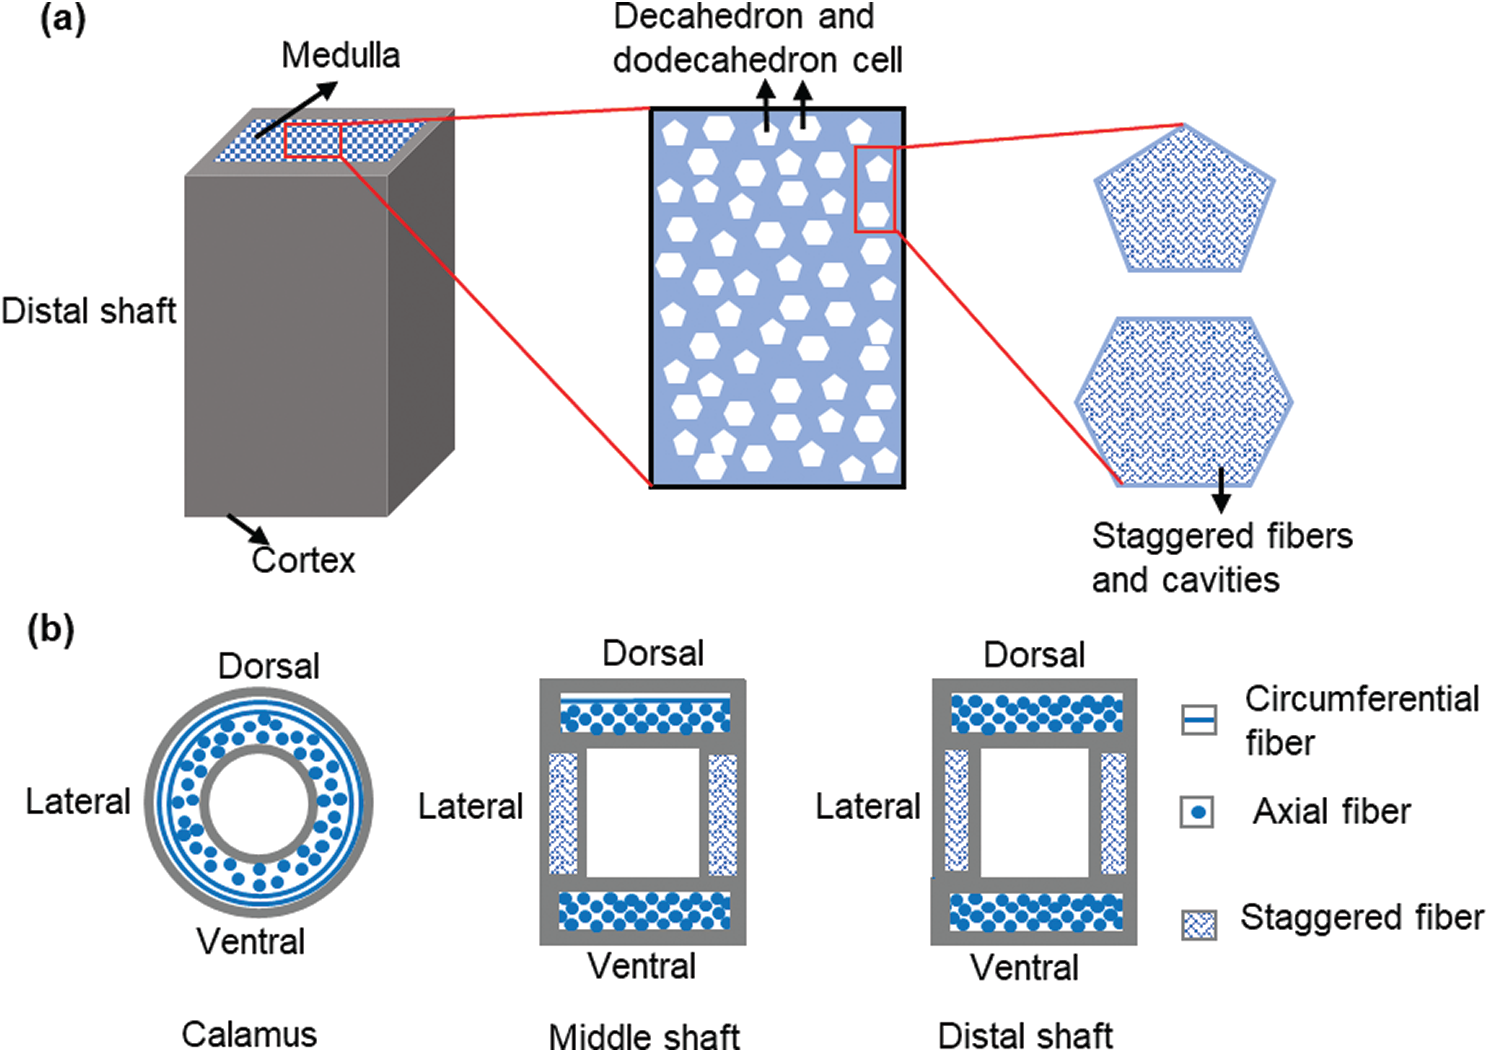
Figure 7: Schematic diagram of the hierarchical structure of feather shaft, (a) the structure of distal shaft, (b) the fiber arrangement of the cortex at different positions (cross section)
As for the structure of the cortex, the fiber arrangement of the cortex at different positions is shown in the Fig. 7b. This anisotropy of the cortex is closely related to the flight of the sparrow hawk. When the sparrow hawk swings its wings, the cortex at different positions of the calamus has similar performance to better ensure the transmission of power. As for the middle and distal shaft, the air resistance during flight is perpendicular to the cortex of the dorsal and ventral, and parallel to the cortex of the lateral. Therefore, the strength and modulus of the dorsal and ventral are higher than that of the lateral, which can keep the shape of the feather shaft unchanged. This ingenious combination of fiber structure perfectly meets the strength requirements in flight.
In this hierarchical structure of feather shaft, the internal cell walls of the medulla with a closed-cell foam-like structure provide a large area to distribute the load while greatly reducing the overall weight of the feather shaft. The cortex, as a high-strength outer sheath, the different fiber structure of the cortex brings the anisotropic mechanical performance of the cortex, which is better adapted to the needs of flight. The medulla and cortex are closely combined through the interface to form a special structure, which can reduce the weight of the feather shaft as much as possible while meeting various mechanical properties required for flight. This unique hierarchical structure of the feather shaft provides us with a more detailed reference in the design of aircraft structural devices.
In addition, further mechanical modeling and simulations based on the extracted 3D model of the feather shaft and the hierarchical structure of the feather shaft and cortex can be further performed, which would be more realistically simulate the deformation and instability process of the feather shaft. In situ mechanical test in a scanning electron microscope and via X-ray computed tomography can be also used to directly study the biomechanisms of the feather shaft and to further validate the mechanical models that would be used in those simulations. Of course, those work is not performed in the current work and is worth of study in the future.
The conclusions of the current work are as follows:
1. The feather shaft of sparrow hawk is composed of medulla and cortex, and its cross-section shape changes from round to rectangular morphology as the feather extends from the calamus to the distal shaft. The medulla is a closed-cell foam-like structure with a porosity of 59%, which accounts for 70% of the total volume of the feather shaft. The shape of each single cell in the medulla is decahedron and dodecahedron, and the equivalent diameter of each cell is about 30
2. As the calamus extends to the distal shaft, the instability pattern changes from progressive buckling to Euler buckling in compression test. The axial buckling of the shaft includes three processes: separation of the medulla and cortex, separation of fibers on the cortex and deformation of the medulla under loading. The combination of medulla and cortex greatly improves the buckling strength of shaft.
3. The cortex at different positions on the feather shaft is anisotropic in structure and tensile properties. The tensile strength and modulus of the dorsal cortex gradually increase from the calamus to the distal shaft along the axis direction, while the lateral cortex shows the opposite trend which is mainly due to the different fiber structure of the cortex. When the fiber orientations are interlaced, the fracture mode transfers to plane fracture and the strength is low. When the fiber orientation tends to be uniform along the axial direction, the fracture form becomes tortuous fracture and V-shaped fracture, and the tensile performance is improved.
Funding Statement: We acknowledge the financial support by the National Key Research and Development Program of China (No. 2017YFA0403803), Liaoning Revitalization Talents Program (No. XLYC1808005) and the fundamental research funds for the central universities.
Conflicts of Interest: The authors declare that they have no conflicts of interest to report regarding the present study.
1. Lingham-Soliar, T. (2013). Feather structure, biomechanics and biomimetics: The incredible lightness of being. Journal of Ornithology, 155(2), 323–336. DOI 10.1007/s10336-013-1038-0. [Google Scholar] [CrossRef]
2. Chen, H. W., Rao, F. G., Shang, X. P., Zhang, D. Y., Hagiwara, I. (2013). Biomimetic drag reduction study on herringbone riblets of bird feather. Journal of Bionic Engineering, 10(3), 341–349. DOI 10.1016/S1672-6529(13)60229-2. [Google Scholar] [CrossRef]
3. Mahapatra, B. B., Marathe, S. A., Meyer-Rochow, V. B., Mishra, M. (2016). A closer look at the feather coloration in the male purple sunbird, nectarinia asiatica. Micron, 85(2), 44–50. DOI 10.1016/j.micron.2016.04.001. [Google Scholar] [CrossRef]
4. Sullivan, T. N., Pissarenko, A., Herrera, S. A., Kisailus, D., Lubarda, V. A. et al. (2016). A lightweight, biological structure with tailored stiffness: The feather vane. Acta Biomaterialia, 41, 27–39. DOI 10.1016/j.actbio.2016.05.022. [Google Scholar] [CrossRef]
5. Wang, B., Meyers, M. A. (2017). Seagull feather shaft: Correlation between structure and mechanical response. Acta Biomaterialia, 48(Pt 22), 270–288. DOI 10.1016/j.actbio.2016.11.006. [Google Scholar] [CrossRef]
6. Zou, M., Zhou, J., Xu, L., Song, J., Liu, S. et al. (2019). An engineering perspective on the microstructure and compression properties of the seagull larus argentatus feather rachis. Micron, 126(3), 102735. DOI 10.1016/j.micron.2019.102735. [Google Scholar] [CrossRef]
7. Zou, M., Xu, L., Zhou, J., Song, J., Liu, S. et al. (2020). Microstructure and compression resistance of bean goose (anser fabalis) feather shaft. Microscopy Research and Technique, 83(2), 156–164. DOI 10.1002/jemt.23398. [Google Scholar] [CrossRef]
8. Purslow, P. P., Vincent, J. F. V. (1978). Mechanical properties of primary feathers from pigeon. Journal of Experimental Biology, 9, 251–260. [Google Scholar]
9. Fraser, R. D. B., Parry, D. A. D. (2008). Molecular packing in the feather keratin filament. Journal of Structural Biology, 162(1), 1–13. DOI 10.1016/j.jsb.2008.01.011. [Google Scholar] [CrossRef]
10. Lingham-Soliar, T., Bonser, R. H. C., Wesley-Smith, J. (2010). Selective biodegradation of keratin matrix in feather rachis reveals classic bioengineering. Proceedings of the Royal Society B: Biological Sciences, 277(1685), 1161–1168. DOI 10.1098/rspb.2009.1980. [Google Scholar] [CrossRef]
11. Wang, B., Yang, W., McKittrick, J., Meyers, M. A. (2016). Keratin: Structure, mechanical properties, occurrence in biological organisms, and efforts at bioinspiration. Progress in Materials Science, 76(5), 229–318. DOI 10.1016/j.pmatsci.2015.06.001. [Google Scholar] [CrossRef]
12. Ashby, M. F., Gibson, L. J., Wegst, U., Olive, R. (1997). The mechanical properties of natural materials. I. Material property charts. Proceedings of the Royal Society of London. Series A: Mathematical and Physical Sciences, 450(1938), 123–140. DOI 10.1098/rspa.1995.0075. [Google Scholar] [CrossRef]
13. Schelestow, K., Troncoso, O. P., Torres, F. G. (2017). Failure of flight feathers under uniaxial compression. Materials Science & Engineering C, 78(3), 923–931. DOI 10.1016/j.msec.2017.04.146. [Google Scholar] [CrossRef]
14. Weiss, I. M., Kirchner, H. O. K. (2010). The peacock’s train (pavo cristatus and pavo cristatus mut. Alba) I. Structure, mechanics, and chemistry of the tail feather coverts. Journal of Experimental Zoology, 313(10), 690–703. DOI 10.1002/jez.641. [Google Scholar] [CrossRef]
15. Richard, H. C., Bonser, Purslow, P. P. (1995). The young’s modulus of feather keratin. Journal of Experimental Biology, 198, 1029–1033. [Google Scholar]
16. Macelod, G. D. (1980). Mechanical properties of contour feathers. Journal of Experimental Biology, 87, 65–71. [Google Scholar]
17. Cameron, G. J., Wess, T. J., Bonser, R. H. C. (2003). Young’s modulus varies with differential orientation of keratin in feathers. Journal of Structural Biology, 143(2), 118–123. DOI 10.1016/S1047-8477(03)00142-4. [Google Scholar] [CrossRef]
18. Guo, E. Y., Shuai, S. S., Kazantsev, D., Karagadde, S., Phillion, A. B. et al. (2018). The influence of nanoparticles on dendritic grain growth in mg alloys. Acta Materialia, 152(2), 127–137. DOI 10.1016/j.actamat.2018.04.023. [Google Scholar] [CrossRef]
19. Takahashi, K., Yamamoto, H., Yokote, Y., Hattori, M. (2004). Thermal behavior of fowl feather keratin. Bioence Biotechnology & Biochemistry, 68(9), 1875–1881. DOI 10.1271/bbb.68.1875. [Google Scholar] [CrossRef]
20. Liu, Z. Q., Jiao, D., Meyers, M. A., Zhang, Z. F. (2015). Structure and mechanical properties of naturally occurring lightweight foam-filled cylinder–the peacock’s tail coverts shaft and its components. Acta Biomaterialia, 17, 137–151. DOI 10.1016/j.actbio.2015.01.035. [Google Scholar] [CrossRef]
21. Hangai, Y., Kato, H., Utsunomiya, T., Kitahara, S., Kuwazuru, O. et al. (2012). Effects of porosity and pore structure on compression properties of blowing-agent-free aluminum foams fabricated from aluminum alloy die castings. Materials Transactions, 53(8), 1515–1520. DOI 10.2320/matertrans.M2012125. [Google Scholar] [CrossRef]
22. Bachmann, T., Emmerlich, J., Baumgartner, W., Schneider, J. M., Wagner, H. (2012). Flexural stiffness of feather shafts: Geometry rules over material properties. Journal of Experimental Biology, 215(3), 405–415. DOI 10.1242/jeb.059451. [Google Scholar] [CrossRef]
23. Wang, B., Meyers, M. A. (2016). Light like a feather: A fibrous natural composite with a shape changing from round to square. Advanced Science, 4(3), 1600360. DOI 10.1002/advs.201600360. [Google Scholar] [CrossRef]
24. Andrews K. R. F., England G. L., Ghani E. (1983). Classification of the axial collapse of cylindrical tubes under quasi-static loading. International Journal of Mechanical Sciences, 25(9–10), 687–696. DOI 10.1016/0020-7403(83)90076-0. [Google Scholar] [CrossRef]
25. Chen, P. Y., McKittrick, J., Meyers, M. A. (2012). Biological materials: Functional adaptations and bioinspired designs. Progress in Materials Science, 57(8), 1492–1704. DOI 10.1016/j.pmatsci.2012.03.001. [Google Scholar] [CrossRef]
26. Darvizeh, A., Darvizeh, M., Ansari, R., Meshkinzar, A. (2013). Effect of low density, low strength polyurethane foam on the energy absorption characteristics of circumferentially grooved thick-walled circular tubes. Thin-Walled Structures, 71(9–10), 81–90. DOI 10.1016/j.tws.2013.04.014. [Google Scholar] [CrossRef]
27. Torres, F. G., Troncoso, O. P., Diaz, J., Arce, D. (2014). Failure analysis of porcupine quills under axial compression reveals their mechanical response during buckling. Journal of the Mechanical Behavior of Biomedical Materials, 39, 111–118. DOI 10.1016/j.jmbbm.2014.07.017. [Google Scholar] [CrossRef]
28. Earland, C., Blakey, P. R., Stell, J. G. P. (1962). Molecular orientation of some keratins. Nature, 196(4861), 1287–1291. DOI 10.1038/1961287a0. [Google Scholar] [CrossRef]
 | This work is licensed under a Creative Commons Attribution 4.0 International License, which permits unrestricted use, distribution, and reproduction in any medium, provided the original work is properly cited. |