Engineering & Sciences
| Computer Modeling in Engineering & Sciences |
DOI: 10.32604/cmes.2021.014882
ARTICLE
Dynamical Transmission of Coronavirus Model with Analysis and Simulation
1Department of Mathematics and Statistics, University of Lahore, Lahore, 54590, Pakistan
2Faculty of Art and Science, Department of Mathematics, Siirt University, Siirt, 56100, Turkey
3Department of Mathematics, Cankaya University, Ankara, 06530, Turkey
4Institute of Space Sciences, Magurele, R76900, Romania
5Department of Medical Research, China Medical University, Taichung, 40402, Taiwan
6Department of Mathematics, University of Education, Lahore, 54770, Pakistan
*Corresponding Author: Ali Akgül. Email: aliakgul00727@gmail.com
Received: 05 November 2020; Accepted: 04 February 2021
Abstract: COVID-19 acts as a serious challenge to the whole world. Epidemiological data of COVID-19 is collected through media and web sources to analyze and investigate a system of nonlinear ordinary differential equation to understand the outbreaks of this epidemic disease. We analyze the diseases free and endemic equilibrium point including stability of the model. The certain threshold value of the basic reproduction number R0 is found to observe whether population is in disease free state or endemic state. Moreover, the epidemic peak has been obtained and we expect a considerable number of cases. Finally, some numerical results are presented which show the effect of parameters estimation and different step size on our obtained solutions at the real data of some countries to check the actual behavior of the COVID-19 at different countries.
Keywords: Epidemic model; COVID-19; parameter estimation; reproductive number; stability analysis
Epidemiological research plays a significant role in understanding the effects of community-based infectious disease. In mathematical modeling, we investigate model building models, perform parameter estimation, test model sensitivity by varying parameters and compute their numerical simulations. Such research helps to understand the ratio of disease spread within the population and infection of disease [1]. These types of diseased models are often called infectious diseases (i.e., the disease which transferred from one person to another person). Measles, rubella, chicken pox, mumps, aids and gonorrhea syphilis are the examples of infectious disease [2].
Severe Acute Respiratory Syndrome (SARS) is caused by a coronavirus and plays important role for its investigation [3]. According to the group of investigators that has been working since 30 years on the coronavirus family investigated that SARS and coronavirus has many similar features like biology and pathogenesis [4]. RNA enveloped viruses known as coronavirus are spread among humans, mammals and birds. Many respiratory, enteric, hepatic and neurological diseases are caused by coronavirus [5,6]. Human disease is caused by six types of coronavirus [7]. The symptom of the common cold in immune-compromised individuals is caused by 229E, OC43, NL63 and HKU1 coronaviruses. The other 2 coronavirus types are zoonotic in origin. These are severe acute respiratory syndrome coronavirus (SARS- CoV) and Middle East Respiratory Syndrome Coronavirus (MERS-CoV). SARS-CoV and MERS-CoV are fatal illnesses [8]. In 2002 and 2003, Guangdong (The Province of China) faced major outbreaks of acute respiratory syndrome which has a caustic agent of SARS-CoV. The Middle East suffered from severe respiratory disease outbreaks which have a caustic agent of MERS-CoV in 2012. Considering the high occurrence and wide dispersal of coronaviruses, the vast inherent diversity and frequent recombination of their genomes, and the interface between human and animal activity, new coronaviruses are likely to occur frequently in humans due to recurrent cross-species infections and occasional spillover events [9,10].
In 2019, China faced a major outbreak of coronavirus disease 2019 (COVID-19) and this outbreak has the potential to become a worldwide pandemic [11]. Interventions and real-time data is needed for the control on this outbreak of coronavirus [12]. In previous studies, the transfer of the virus from one person to another person, its severity and history of the pathogen in the first week of the outbreak has been explained with the help of real-time analyses [13]. In December 2019, a group of people in Wuhan admitted to the hospital that all were suffering from pneumonia and the cause of pneumonia was idiopathic. Most of the people linked cause of pneumonia with the eating of wet markets meet and seafood. Investigation on etiology and epidemiology of disease was conducted on 31 December 2019 by Chinese Center for Disease Control and Prevention (China CDC) with the help of Wuhan city health authorities [10]. Epidemical changing was measured by time-delay distributions including date of admission to hospital and death. According to the clinical study on the COVID-19, symptoms of coronavirus appear after 7 days of onset of illness [14]. The time from hospital admission to death is also important to prevent undervaluing when measuring the risk of death [15]. COVID-19 epidemiological data and incubation period was measured through public data on known cases [16]. For more details, see [16–28]. The SIR epidemic model with delay in the context of the fractional derivative with Mittag–Leffler kernel has been considered. The Atangana–Baleanu fractional derivative is a non-singular fractional derivative with Mittag–Leffler kernel. The deterministic model of the coronavirus the terms of the stochastic perturbations [29,30].
The goal of this article is to expand on mathematical ways of obtaining R0 for ODE disease models in a population, taking into account the epidemiological significance of R0, and to show how this reproduction numbers can be utilized to direct control strategies that address disease rates and impacts in different countries. Stability and qualitative analysis of the model are discussed in Section 2. In Sections 3 and 4 actual data of different countries are formulated, also find the infected, death and recovered rate. At the end numerical simulation design which support the result and predict the disease stage in society.
Kermack et al. [17] are those persons who are inventor of the diseases models and played an important role in Mathematical epidemiology. A deterministic, compartmental mathematical model is formulated for describing the transmission dynamics of the measles. The population is increasingly fraternizing and replicates a traditional developing country’s dynamics as it explores an exponentially growing trend [17,18]. To continue with a basic model, suppose that each member of a population is either susceptible, contagious (infected with the disease) or life-long resistant from the disease. If the illness is short lived relative to the lifespan of the population, so infection is overlooked in various ways. Such a model could fit COVID 19 as a very simple model. Let S, I and R define the number of susceptible, infectious, recovered individuals at time t. Transmission of coronavirus is human, social life and some others ways are responsible for enhance the disease, so this is often modeled by mass action, namely a term
With initial condition
Here hard immunity and precaution level is more important at endemic stage to control the virus. The modified form of coronavirus model after adding new parakeets in the model which is given as
where
To evaluate the equilibrium point, we take left hand side equal to zero of Eqs. (4)–(6). Therefore the disease free equilibrium is
Thus the endemic equilibrium state is given as
Theorem 1: The endemic equilibrium E0 is locally asymptotically stable if R0 > 1 and otherwise unstable
Proof: In this system the threshold result of this equilibrium is R0 > 1, so this is in endemic state. Consider the Jacobean matrix (J) as
Were
By using the relation
Theorem 2: E0 is locally asymptotically stable if
Proof: For the system (4)–(6) the
The equation which is given above is called characteristic equation. But recall that E is given as
i.e.,
if
Therefore,
Many COVID-19-patients are adults. Of the 44,672 confirmed infection patients in China, 2.1% were below the age of 20. Fever, dry cough, and shortness of breath were the most commonly reported symptoms, and most patients (80%) experienced mild illness. Approximately 14% experienced severe disease and 5% were critically ill. The latest outbreak of coronavirus 2019 noted 12 March 12, 2020, as noted in [20], Coronavirus Cases are 126,369, death is 4,633 and recovered population is 68,304. Active cases are 53428 in the mild condition is 89% and critical is 11%, closed cases recovered is 94% and death is 6% with this disease. The data given in Tab. 1 for study are taken from literature and some website [19–24]. Tab. 1 shows COVID-19 population of different countries which are taken from these sources [20–24] till 23rd March 2020. China is the most populated area. According to our data the most affected area from COVID-19 is USA, which has 449555 total COVID-19 cases. Italy has maximum death rate and the Pakistan has minimum death rate as well as affected cases. Tab. 1 shows direct relation of deaths with the cases of COVID-19. Tab. 2 shows death, infected, recovered and suspected cases in different countries. Death rate, infected rate, recovered rate and suspected cases are in a country depends on how many citizens of that country are taking precautionary measures. Spain had maximum death rate from COVID-19 at the end of the march because they skip to take precautionary measures. Now-a-days, china has downfall of COVID-19 because they took precautionary measures. Iran has maximum suspected cases. The value of h is the fraction between infected and recovered cases of COVID-19. The parameter of h tells about reproductive rate of COVID-19 which ultimately gives data about disease existence or absence. Endemic equilibrium means disease is spreading in specific area and disease free equilibrium is antonym of endemic equilibrium. According to our data china, Russia and Pakistan are the disease free areas. USA, Italy and many other countries are in danger zone of COVID-19. Data is at end of December 2020, Figs. 1, 8, 9 and 12, 14–16 show data of USA, Belgium, Switzerland, Portugal, South Korea, Russia and Pakistan respectively. These countries have more infected population than recovered rate. It means the latent period of above mentioned countries are just started. Figs. 2–7, 10, 11, 13 show data of different countries with initial conditions
Table 1: Table of population and disease data

Table 2: Table of infected, death and recovered rated according to collected data


Figure 1: Actual behavior of Coronavirus at USA in a time t
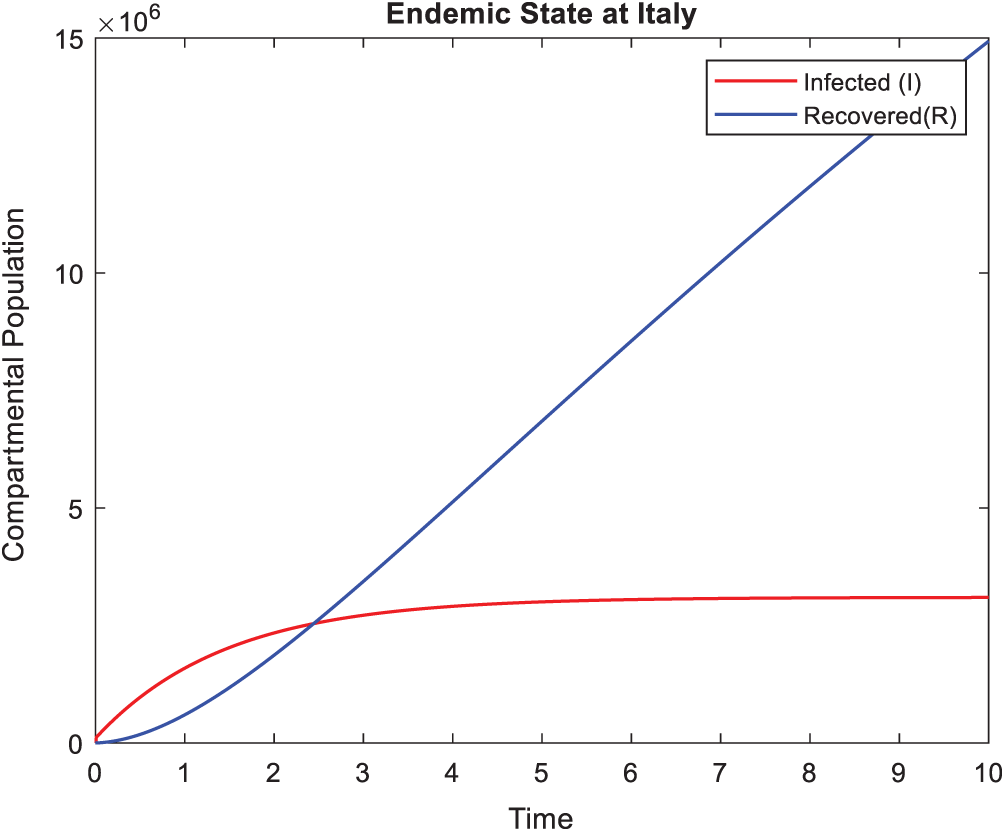
Figure 2: Actual behavior of Coronavirus at Italy in a time t

Figure 3: Actual behavior of Coronavirus at Germany in a time t

Figure 4: Actual behavior of Coronavirus at France in a time t

Figure 5: Actual behavior of Coronavirus at China in a time t

Figure 6: Actual behavior of Coronavirus at Iran in a time t

Figure 7: Actual behavior of Coronavirus at Turkey in a time t

Figure 8: Actual behavior of Coronavirus at Belgium in a time t

Figure 9: Actual behavior of Coronavirus at Switzerland in a time t

Figure 10: Actual behavior of Coronavirus at Canada in a time t
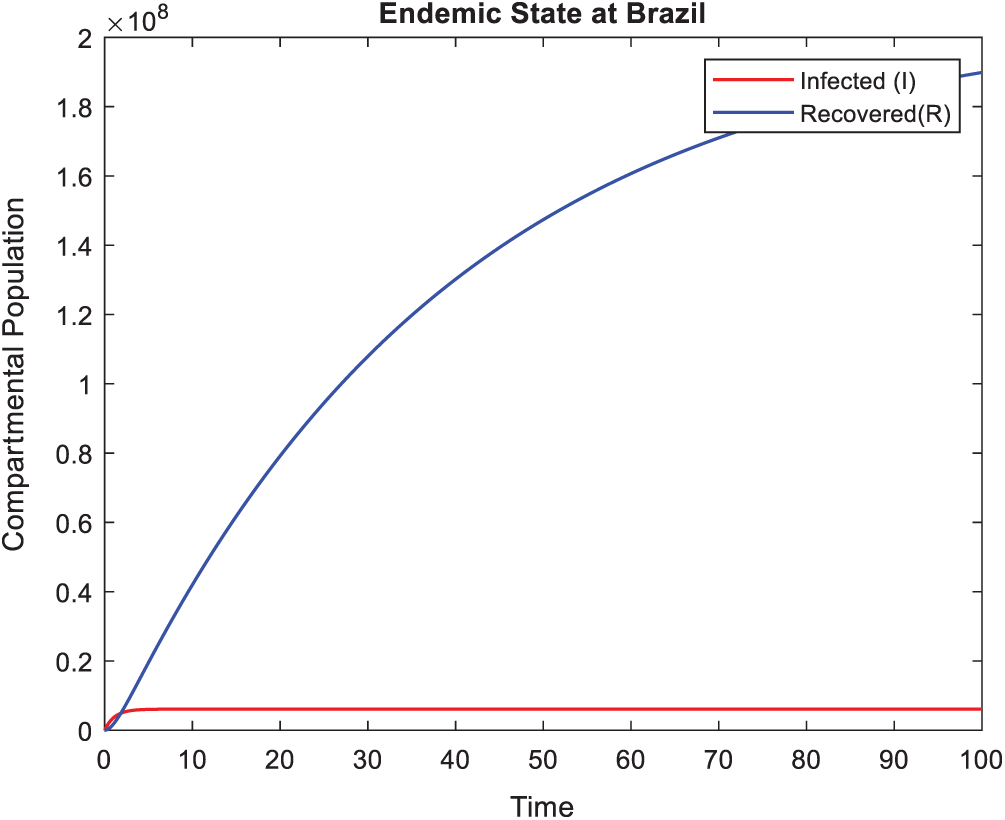
Figure 11: Actual behavior of Coronavirus at Brazil in a time t

Figure 12: Actual behavior of Coronavirus at Portugal in a time t

Figure 13: Actual behavior of Coronavirus at Austria in a time t

Figure 14: Actual behavior of Coronavirus at South Korea in a time t

Figure 15: Actual behavior of Coronavirus at Russia in a time t

Figure 16: Actual behavior of Coronavirus at Pakistan in a time t
Before the migration to and from Wuhan was cut off, the basic reproduction number in China was 5.6015. From 23 January to 26 January 2020, the basic reproduction number in China was 6.6037. From 27 January to 11 February 2020, the basic reproduction number outside Hubei province dropped below 1, but that in Hubei province remained 3.7732. Because of stricter controlling measures, especially after the initiation of the large-scale case-screening, the epidemic rampancy in Hubei has also been contained. The average basic reproduction number in Hubei province was 3.4094 as of 25 February 2020. The two uses of the R0 are, to assess the ability of an infectious disease to invade the community (when the R0 of a disease is greater than 1, the infection will spread, as it indicates that one infected individual will spread the disease to more than one individual) and to determine the fraction of the community which should be vaccinated in order to prevent the growth of the epidemic [31,32].
The above results are based on some data collected by the 24th December 2020, but our results are expected by different countries to increase or decrease the rate of infection and recover which help to study the outbreak of COVID-19. Countries properly follow the precautionary measure and operate on it. They are many countries which contain the coronavirus, but most of countries increased the recovered rate efficiently but the risk of infection either fluctuates or stable after some period. The model chosen is easy but it gives the ton of valuable disease-related knowledge that will help prepare and handle the disease in society to reduce the risk of death.
In this paper, we developed an epidemic model analytical solution scheme and formulated the reproductive number in order to observe the state of the coronavirus. The well-known Susceptible-Infected-Recovered (SIR) epidemic model is considered with and without demographic results. It is found that infection and recovered rate play a key role for an epidemic to occur, and that vaccination will regulate the epidemic. The effect of parameter estimation on our obtained solutions is expressed by figures. The numerical simulations show the actual behavior of the COVID-19 in a time t which will be helpful to analyze and control this pandemic disease. This model will assist the public health planar in framing a COVID-19 control policy. In addition, we will expand the model incorporating deterministic and stochastic model comparisons with fractional technique, as well as using optimal control theory for new outcomes.
Funding Statement: The authors received no specific funding for this study.
Conflicts of Interest: The authors declare that they have no conflicts of interest to report regarding the present study.
1. Abubakar, S., Akinwande, N. I., Abdulrahman, S. (2012). A mathematical model of yellow fever epidemics. Afrika Mathematika, 6, 56–58. [Google Scholar]
2. Hethcote, H. W. (2000). The mathematics of infectious diseases. Society for Industrial and Applied Mathematics, SIAM Review, 42(4), 599–653. [Google Scholar]
3. Baric, R. S., Fu, K., Chen, W., Yount, B. (1995). High recombination and mutation rates in mouse hepatitis virus suggest that coronaviruses may be potentially important emerging viruses. Advances in Experimental Medicine and Biology, 380, 571–576. [Google Scholar]
4. Denison, M. R. (2004). Coronavirus research: Keys to diagnosis, treatment and prevention of SARS. Learning from SARS: Preparing for the Next Disease Outbreak: Workshop Summary, pp. 149. National Academies Press. [Google Scholar]
5. Weiss, S. R., Leibowitz, J. L. (2011). Coronavirus pathogenesis. Virus Structure and Assembly, 81, 85–164. [Google Scholar]
6. Masters, P. S., Perlman, S. (2013). Coronaviridae. In: Knipe, D. M., Howley, P. M. (eds.) Fields Virology, 6th edition. pp. 825–858. Philadelphia: Lippincott Williams & Wilkins. [Google Scholar]
7. Su, S., Wong, G., Shi, W., Liu, J., Lai, A. C. K. et al. (2016). Epidemiology, genetic recombination, and pathogenesis of coronaviruses. Trends in Microbiology, 24(6), 490–502. DOI 10.1016/j.tim.2016.03.003. [Google Scholar] [CrossRef]
8. Zhong, N. S., Zheng, B. J., Li, Y. M., Poon, L. L. M., Xie, Z. H. et al. (2003). Epidemiology and cause of severe acute respiratory syndrome (SARS) in Guangdong, China. Lancet, 362, 1353–1358, 2003. [Google Scholar]
9. Wong, G., Liu, W., Liu, Y., Zhou, B., Bi, Y. et al. (2015). MERS, SARS, and Ebola: The role of super-spreaders in infectious disease. Cell Host & Microbe, 18(4), 398–401. DOI 10.1016/j.chom.2015.09.013. [Google Scholar] [CrossRef]
10. Zhu, N. A., Zhang, D., Wang, W., Li, X., Yang, B. et al. (2019). A novel coronavirus from patients with pneumonia in China, 2019. New England Journal of Medicine, 727, 1–7. [Google Scholar]
11. WHO (2005). Statement on the second meeting of the international health regulations emergency committee regarding the outbreak of novel coronavirus (2019-nCoV). Geneva: WHO. [Google Scholar]
12. Rivers, C., Chretien, J. P., Riley, S., Pavlin, J. A., Woodward, A. et al. (2019). Using outbreak science to strengthen the use of models during epidemics. Nature Communications, 10(1), 3102. DOI 10.1038/s41467-019-11067-2. [Google Scholar] [CrossRef]
13. Sun, K., Chen, J., Viboud, C. (2020). Early epidemiological analysis of the coronavirus disease 2019 outbreak based on crowd sourced data: A population-level observational study. Lancet Digital Health, 2(4), e201–e208. DOI 10.1016/S2589-7500(20)30026-1. [Google Scholar] [CrossRef]
14. Natalie, M. L., Kobayashi, T. (2019). Yichi Yang incubation period and other epidemiological characteristics of 2019 Novel Coronavirus infections with right truncation: A statistical analysis of publicly available case data. Journal of Clinical Medicine, 9(2), 538. DOI 10.3390/jcm9020538. [Google Scholar] [CrossRef]
15. Huang, C., Wang, Y., Li, X., Ren, L., Zhao, J. et al. (2020). Clinical features of patients infected with 2019 novel coronavirus in Wuhan, China. Lancet, 395(10223), 497–506. DOI 10.1016/S0140-6736(20)30183-5. [Google Scholar] [CrossRef]
16. Donnelly, C. A., Ghani, A. C., Leung, G. M., Hedley, A. J., Fraser, C. et al. (2003). Epidemiological determinants of spread of causal agent of severe acute respiratory syndrome in Hong Kong. Lancet, 361(9371), 1761–1766. DOI 10.1016/S0140-6736(03)13410-1. [Google Scholar] [CrossRef]
17. Kermack, W. O., McKendrick, A. G. (1927). A contribution to the mathematical theory of epidemics. Proceedings of the Royal Society of London. Series A, 115(772), 700–721. DOI 10.1098/rspa.1927.0118. [Google Scholar] [CrossRef]
18. Pauline, V. D. (2017). Reproduction numbers of infectious disease models. Infectious Disease Modelling, 2(3), 288–303. DOI 10.1016/j.idm.2017.06.002. [Google Scholar] [CrossRef]
19. WHO (2020). Coronavirus disease 2019 (COVID-19) Situation Report–41. Geneva: WHO. [Google Scholar]
20. World meters Coronavirus. https://www.worldometers.info/coronavirus/. [Google Scholar]
21. Memo Middle East Monitor. https://www.middleeastmonitor.com/20200323-iran-tests-33-million-people-for-coronavirus/. [Google Scholar]
22. The Brazilian report. https://brazilian.report/coronavirus-brazil-live-blog/. [Google Scholar]
23. Coronavirus Pandemic in Portugal. https://en.wikipedia.org/wiki/2020_coronavirus_pandemic_in_Portugal. [Google Scholar]
24. Coronavirus Pandemic in Russia. https://en.wikipedia.org/wiki/2020_coronavirus_pandemic_in_Russia. [Google Scholar]
25. Naveed, N., Baleanu, D., Rafiq, M., Raza, A., Soori, A. H. (2020). Dynamical behavior and sensitivity analysis of a delayed coronavirus epidemic model. Computers, Materials & Continua, 65(1), 225–241. DOI 10.32604/cmc.2020.011534. [Google Scholar] [CrossRef]
26. Baleanu, D., Mohammadi, H., Rezapour, S. (2020). A fractional differential equation model for the COVID-19 transmission by using the Caputo-Fabrizio derivative. Advances in Difference Equations, 2020, 299. [Google Scholar]
27. Raza, A., Farman, M., Akgül, A., Iqbal, M. S., Ahmad, A. (2020). Simulation and numerical solution of fractional order Ebola virus model with novel technique. AIMS Bioengineering, 7(4), 194–207. DOI 10.3934/bioeng.2020017. [Google Scholar] [CrossRef]
28. Ahmed, A., Salam, B., Mohammad, M., Akgül, A., Khoshnaw, S. H. A. (2020). Analysis coronavirus disease (COVID-19) model using numerical approaches and logistic model. AIMS Bioengineering, 7(3), 130–146. DOI 10.3934/bioeng.2020013. [Google Scholar] [CrossRef]
29. Sene, N. (2020). SIR epidemic model with Mittag-Leffler fractional derivative. Chaos, Solitons & Fractals, 137(3), 109833. DOI 10.1016/j.chaos.2020.109833. [Google Scholar] [CrossRef]
30. Sene, N. (2020). Analysis of the stochastic model for predicting the novel coronavirus disease. Advances in Difference Equations, 1, 1–19. [Google Scholar]
31. Dharmaratne, S., Sudaraka, S., Abeyagunawardena, I., Manchanayake, K., Kothalawala, M. et al. (2020). Estimation of the basic reproduction number (R0) for the novel coronavirus disease in Sri Lanka. Virology Journal, 17(1), 144. DOI 10.1186/s12985-020-01411-0. [Google Scholar] [CrossRef]
32. Li, Y., Wang, L. W., Peng, Z. H., Shen, H. B. (2020). Basic reproduction number and predicted trends of coronavirus disease 2019 epidemic in the mainland of China. Infectious Diseases of Poverty, 9(1), 94. DOI 10.1186/s40249-020-00704-4. [Google Scholar] [CrossRef]
 | This work is licensed under a Creative Commons Attribution 4.0 International License, which permits unrestricted use, distribution, and reproduction in any medium, provided the original work is properly cited. |