| Computer Modeling in Engineering & Sciences |
DOI: 10.32604/cmes.2021.016485
REVIEW
Review of Computational Techniques for the Analysis of Abnormal Patterns of ECG Signal Provoked by Cardiac Disease
1Kalaignarkarunanidhi Institute of Technology, Coimbatore, 641402, India
2Department of ECE, Karunya Institute of Technology and Sciences, Coimbatore, 641114, India
*Corresponding Author: Duraisamy Jude Hemanth. Email: judehemanth@karunya.edu
Received: 09 March 2021; Accepted: 16 June 2021
Abstract: The 12-lead ECG aids in the diagnosis of myocardial infarction and is helpful in the prediction of cardiovascular disease complications. It does, though, have certain drawbacks. For other electrocardiographic anomalies such as Left Bundle Branch Block and Left Ventricular Hypertrophy syndrome, the ECG signal with Myocardial Infarction is difficult to interpret. These diseases cause variations in the ST portion of the ECG signal. It reduces the clarity of ECG signals, making it more difficult to diagnose these diseases. As a result, the specialist is misled into making an erroneous diagnosis by using the incorrect therapeutic technique. Based on these concepts, this article reviews the different procedures involved in ECG signal pre-processing, feature extraction, feature selection, and classification techniques to diagnose heart disorders such as Left Ventricular Hypertrophy, Bundle Branch Block, and Myocardial Infarction. It reveals the flaws and benefits in each segment, as well as recommendations for developing more advanced and robust methods for diagnosing these diseases, which will increase the system’s accuracy. The current issues and prospective research directions are also addressed.
Keywords: Bundle branch block; myocardial infarction; left ventricular hypertrophy; feature selection; feature extraction; classification
ECG signal is one of the greatest initial sources to obtain diagnostic information. In recent research, an effective computational technique has been evolved in processing and analyzing the ECG signal. The major challenging research using the ECG signal is to provide a computational technique based on signal processing to diagnose a heart disease which includes Bundle Branch Block, Left Ventricular Hypertrophy (LVH), and Myocardial Infarction. The ECG with 12 leads helps to diagnose Myocardial Infarction and is useful in predicting complications in cardiovascular disease [1]. However, it has some limitations. The ECG signal with the presence of Myocardial Infarction is difficult to interpret with other electrocardiographic abnormalities such as Left Bundle Branch Block (LBBB) and Left Ventricular Hypertrophy disease [2]. The ECG patterns of Left Bundle Branch Block and Left Ventricular Hypertrophy may resemble the ECG findings related to myocardial Infarction. These patterns decrease the clarity of the ECG signals to detect Myocardial Infarction [2]. Bacharova et al. [3] reported that left ventricular hypertrophy induced modification in the QRS and T pattern, and based on Romhilt-Estes Score, the amplitude of R wave and S wave was greater than 2.0 mV and induced depression in the ST segment. Gubner reported that the sum of the amplitude of the R wave in lead I and S wave in lead III was greater than 25 mV indicated in the LVH. Sokolow Lyon reported that the sum of amplitude of S Wave in V1 lead and R wave in lead V5 caused an increase in voltage by 3.5 mV. Based on Cornell voltage the sum of amplitude of R wave in avL and S wave in V3 was greater than 2.0 mV [3]. Gosse et al. [4] reported that the amplitude of the R wave in lead aVL produced a huge change in the ECG signal for identifying LVH. This approach was simple and cost-effective. Increases in voltage and length of the QRS complex, which are suggestive of a rise in LVM and repolarization changes considered to indicate anomalies in myocardial perfusion, are the most common signs [4]. de la Garza-Salazar et al. [5] reported that the LVH could be diagnosed using ECG and that it was independent of the parameter called ventricular mass. The measurements of ECG parameters were complex and provided a low accuracy for the diagnosis of LVH. Efficient machine learning algorithms were required for the diagnosis of LVH with the highest accuracy [5].
The Electrocardiographic pattern of Left Ventricular Hypertrophy induces a great change in the ST segment and T waves. It shows depression in the ST segment with negative T waves and elevation in the ST segment with positive T waves. This changed pattern may mean that the patient with the ECG signal has a condition that is compatible with Myocardial Infarction [6–8]. The LVH based ECG signal is shown in Fig. 1. An EKG with an R wave in lead I (17 mm) that is greater than 14 mm is seen below. The R wave in lead V5 and/or V6 is about 24 mm, while the S wave in lead V1 is 21 mm. According to Sokolow-Lyon guidelines, the total is 45 mm, which is higher than 35 mm, suggesting left ventricular hypertrophy.
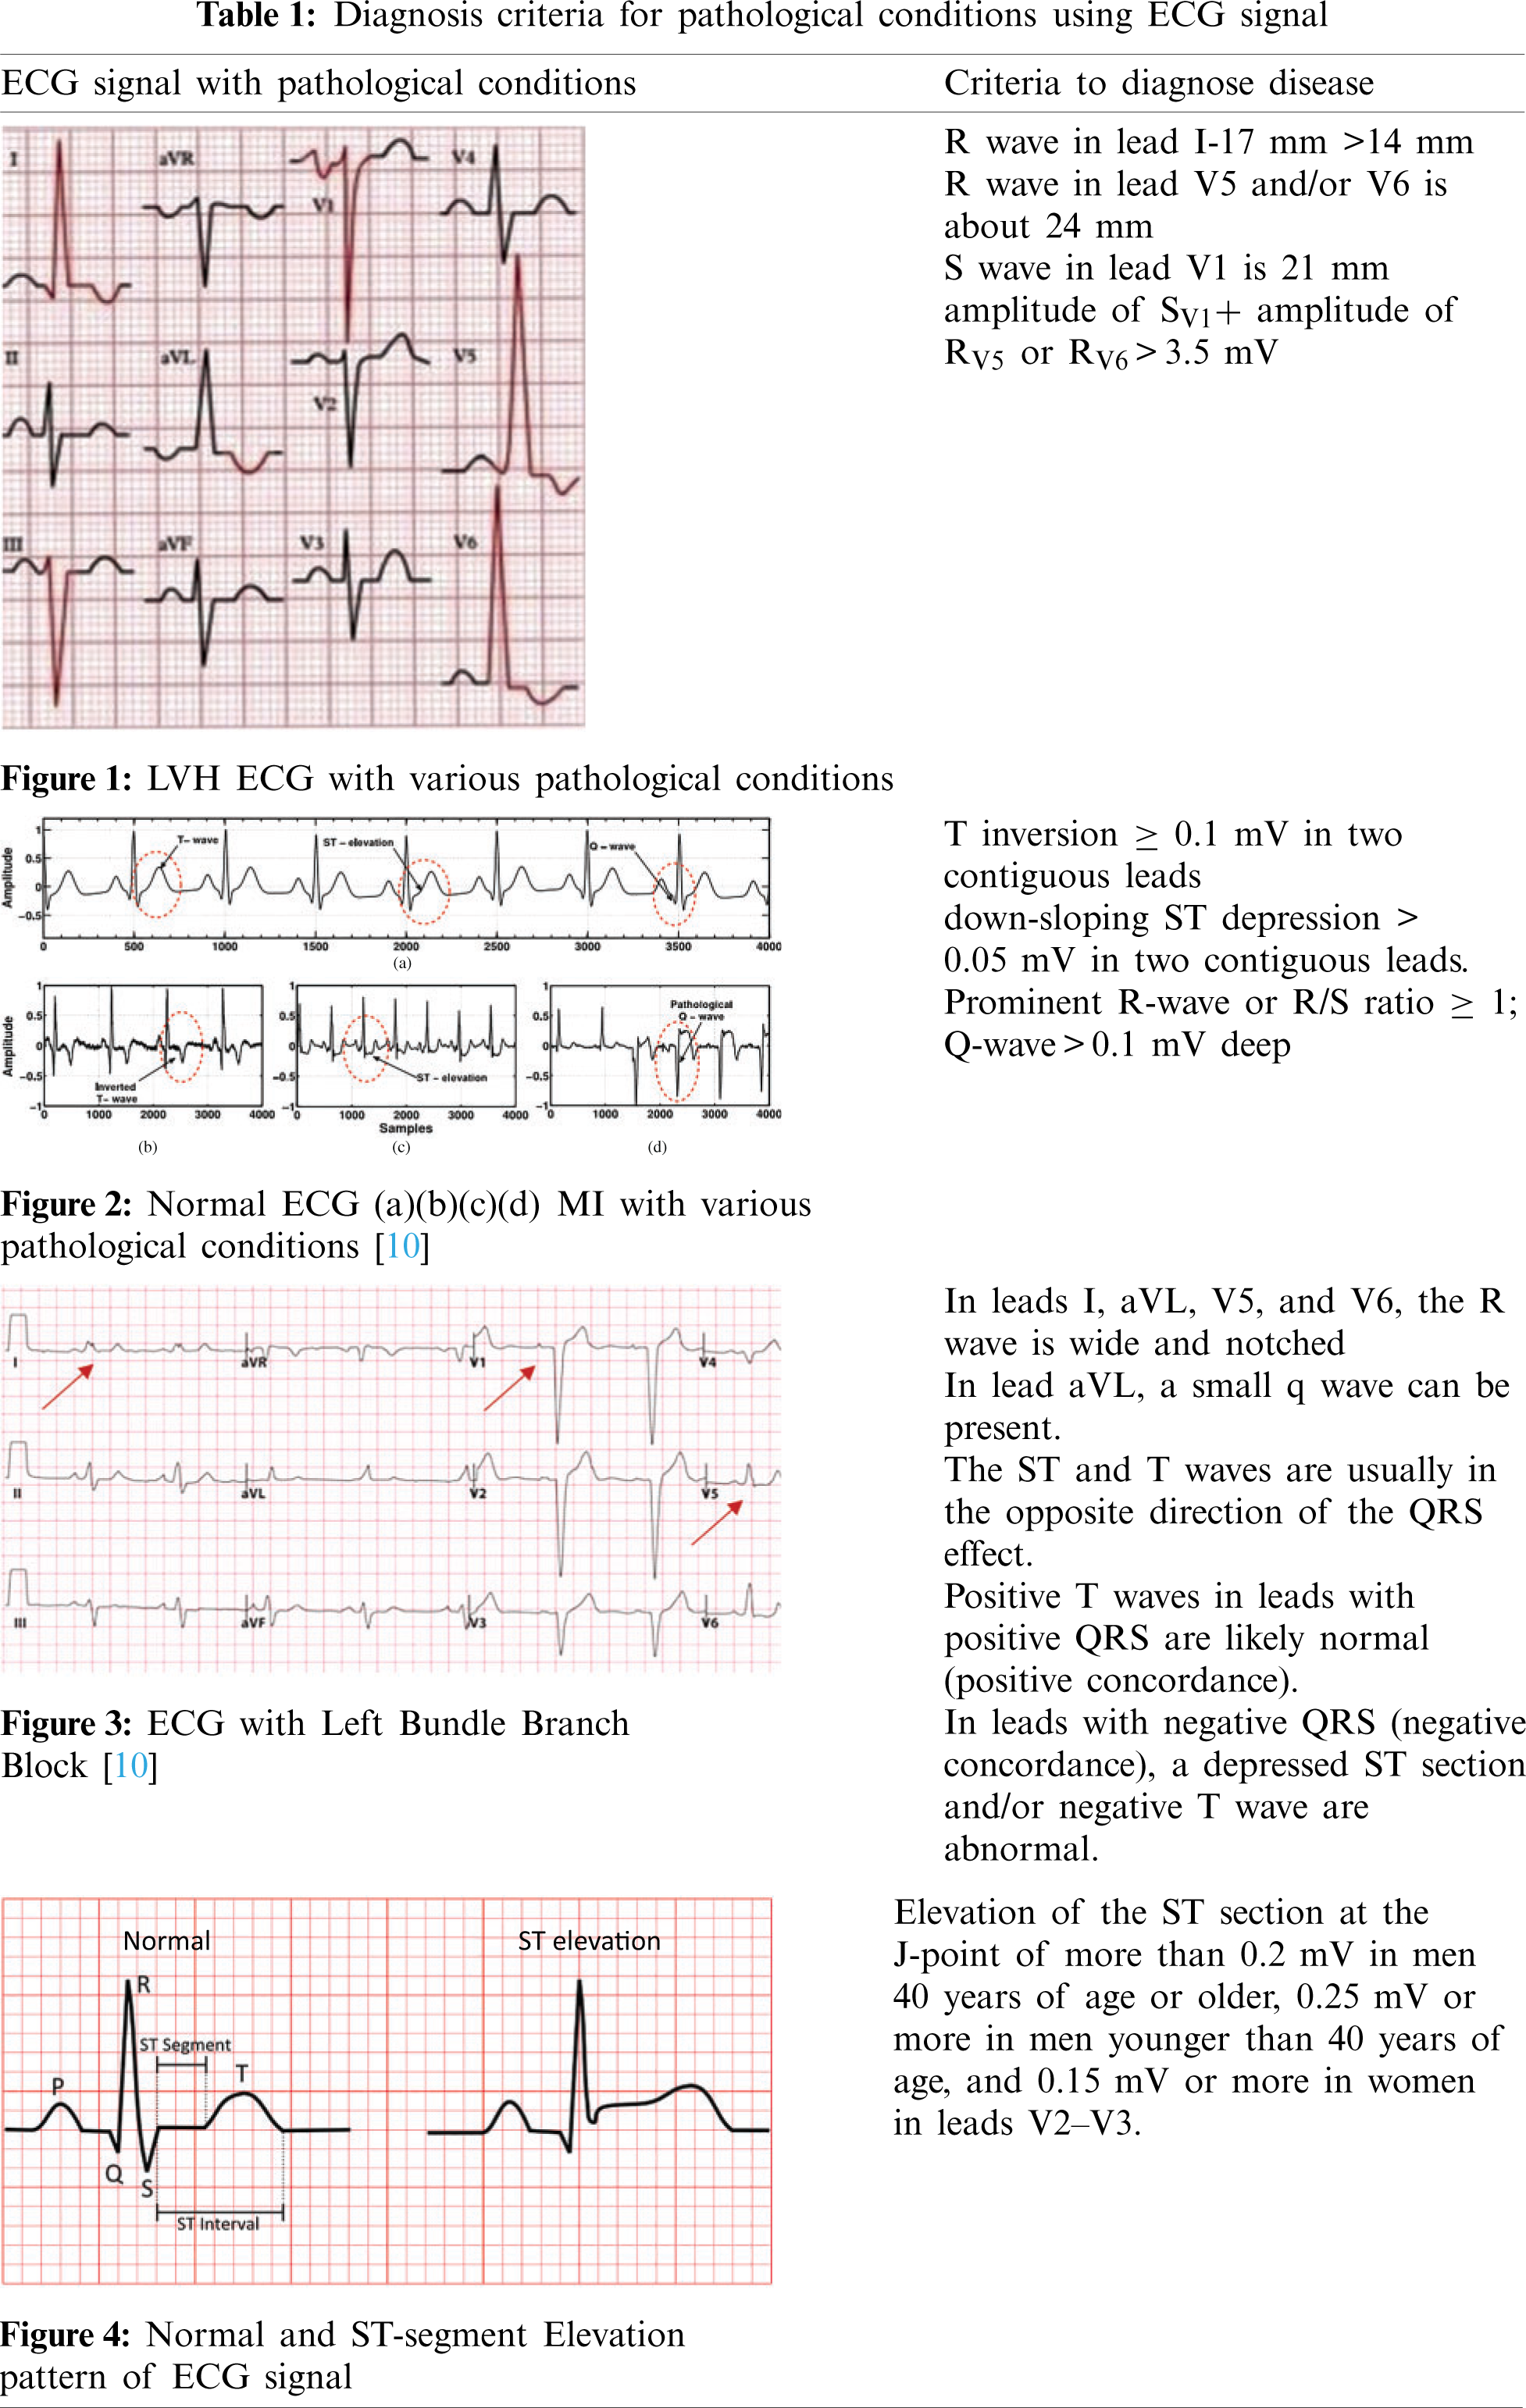
Myocardial Infarction (MI) is the origin of coronary artery disease. It is also known as a heart attack. This is because of the occlusion of any one of the above coronary arteries [9]. The ECG signal with Myocardial Infarction is shown in Fig. 2. It represents the normal ECG signal and the ECG signal with MI. The synthetic ECG [notice Fig. 2a] is only seen for wave morphologies comparison. In a clinical setting, all of the above modifications (Figs. 2b–2d) can be present during an infarction. This demonstrates the importance of evaluating a 12-lead ECG for MI identification and localization.
Another common observation in patients with the ECG signal associated with the LBBB and Myocardial Infarction is revealed that there is a discordance of the ST segment, QRS complex, and T waves. That is, the ECG signal shows ST-segment elevation with negative QRS complexes and depression in the ST segment along with negative T wave and positive QRS complexes [11]. The ECG with LBBB is shown in Fig. 3. Traditional methods to diagnose these diseases are cumbersome. The Electrocardiogram criteria for Left Bundle Branch Block, Left Ventricular Hypertrophy mimics the criteria for the diagnosis of acute Myocardial Infarction. This may lead to a wrong diagnostic and treatment procedure. Fig. 3 represents ECG with Left Bundle Branch Block. In leads I, aVL, V5, and V6, the R wave is wide and notched. The RS pattern can sometimes be shown in leads V5 and V6. In leads I, V5, and V6, there are no q waves. In lead aVL, a small q wave can be present. The ST and T waves are usually in the opposite direction of the QRS effect. Positive T waves in leads with positive QRS are likely normal (positive concordance). In leads with negative QRS (negative concordance), a depressed ST section and/or negative T wave are abnormal. As LBBB progresses, the mean QRS axis can move to the right or left.
The ST segment in the ECG signal pattern indicates the period that occurs between ventricular depolarization and repolarization. The ST segment is the isoelectric part of the ECG signal between the terminal point of the S wave and the starting point of the T wave. The elevation in the ST segment indicates heart abnormalities. Fig. 4 denotes the normal and abnormal ECG signal patterns. This section describes the research work which investigates the heart disease abnormalities that cause changes in the ST-segment pattern of the ECG signal. Tab. 1 indicates diagnosis criteria for pathological conditions using ECG signals.
Noriega et al. [12] evaluated whether the existence of multivessel coronary artery disease (CAD) varied the ST-segment of the ECG signal in patients with acute coronary artery occlusion. It was noticed that both the cases with a single or multivessel CAD had inverse depression in the ST-segment, which was due to the occlusion of the LAD artery. It could lead to a major infarction [12]. Rossello et al. [13] predicted whether QRS and QT duration differentiated between pericarditis and acute myocardial ischemia. It was observed that the elongation of the QRS complex and the reduction in QT interval in the ECG signal was noticed in patients who suffered from acute STEMI but not with pericarditis. A diffuse elevation of the ST segment and an upright divergence of the PR segment with ST-segment depression in lead aVR is common electrocardiogram (ECG) findings in patients with acute pericarditis [13]. Yildirim et al. [14] reported different clinical pieces of evidence that the ECG signal of myocarditis was similar to that of Myocardial Infarction (MI). The reciprocal of the ST-segment elevation was observed in the ECG signal for acute myocarditis cases. It can have a variety of clinical symptoms and can be interpreted as myocardial infarction (MI) because patients typically have chest pain and electrocardiographic changes that are similar to those seen in acute ST-elevation MI [14]. Willemsen et al. [15] analyzed three cases of chest pain. In all these cases, the clinical diagnosis for the general practitioner was unambiguous for conditions such as Acute Coronary Syndrome and light pain in the chest. A General Practioner’s ability to distinguish between ACS and less serious sources of chest pain remains a challenge [15]. Coppola et al. [16] reported on various conditions that induced changes in ST-segment Elevation Myocardial Infarction (STEMI). When septal hypertrophy is occurring, the ECG reveals R waves with a high voltage in the anterolateral leads and Q waves in the anterior and inferior leads. The T waves in V2 and V4 are always very deep and inverted, resembling a non-Q AMI [16]. Smith et al. [17] reported that the elevation in ST-segment caused difficulty in differentiating Myocardial infarction from early repolarization of ECG signal. For a variety of causes, it can be impossible to determine the two entities apart. First, although upward ST-segment concavity is typically associated with normal ECG findings, it is also present in 30% to 40% of anterior STEMI (due to occlusion of the left anterior descending artery), particularly early after the onset of symptoms. Furthermore, 30% to 40% of anterior STEMIs have borderline ST-segment elevation [17]. Dodd et al. [18] analyzed Left Bundle Branch Block ECG signal cases with and without Myocardial Infarction and identified variations in the amplitude of QRS complexes, the morphology of ST-segment, and the T waves of ECG signal, and he compared them with modified Sgarbossa criteria to find them perform well against other variations [18]. Pollak et al. [19] reported that the ECG pattern minimized an accurate diagnosis of acute coronary syndrome because of the mystifying ECG patterns of Left Ventricular Hypertrophy, ventricular paced rhythms, and Left Bundle Branch Block. The confound electrocardiographic patterns are those that minimize the electrocardiogram’s ability to detect modifications relative to ACS, not because the results resemble STEMI, but because the syndrome obscures the identification of ST-segment elevation [19]. Nable et al. [20] reported that the changes in ST-segment elevation in ECG signal were a key factor for the diagnosis of ST-segment elevation Myocardial Infarction (STEMI). Particularly, this change in ST-segment elevation pattern could also be perceived in the other diseases which included Takotsubo cardiomyopathy, left ventricular hypertrophy, left bundle branch block, and early repolarization [20].
Several efficient algorithms have been evolved for disease identification using the ECG signal. The morphologies of the ECG signal play a vital role in its analysis. Various Signal Processing techniques have been adopted to grasp information from the ECG signal. Various techniques have been investigated to identify the characteristics related to coronary artery disease. The detection of Q, R, S, and T wave amplitudes using signal processing techniques is an important indicator to identify heart diseases.
However, it is troublesome to perceive the differences in the ECG signal to indicate a specific type of heart disease. Hence, an automated heart disease diagnosis system has been devised in the medical field to find a solution to this problem. The data employed in this system are required to be processed and classified accurately. For this purpose, various techniques have been reported in the literature so far.
The statistical diagnostic strategies for predicting cardiac diseases based on ECG signals are summarized in this paper. The technique of ECG signal analysis based on machine learning is explored from preprocessing, feature extraction, feature selection, and classification. End-to-end models for ECG analysis based on deep learning algorithms have been summarized, removing the need for feature extraction using hand-crafted techniques from the analysis process.
This article describes the work reported in various pieces of literature for the diagnosis of cardiac diseases. The structure of the literature review is organized in this chapter as follows: ECG signal database, various pathological-condition-based ECG signals, ECG signal preprocessing, Feature Extraction techniques, and classification techniques. The advantages and disadvantages of various research works are also discussed in detail to identify the appropriate technique to diagnose and differentiate between various cardiac signals indicating heart diseases such as Myocardial Infarction, Bundle Branch Block, and Left Ventricular Hypertrophy. The flow of ECG signal processing technique to diagnose these diseases indicated in Fig. 5

Figure 5: The basic flow of ECG signal processing technique
The vast majority of research used computational approaches for Ischemic heart disease and myocardial infarction (MI) are detected automatically using publicly available datasets containing ECG waveforms to test the efficacy of their methods. The Physikalisch-Technische Bundesanstalt (PTB), The European ST-T (EST) and MIT-BIH arrhythmia Database as well as others, are all accessible via the Physionet data repository [21]. Fig. 6 indicates the database mainly used for the diagnosis of Myocardial Infarction, Bundle Branch Block, and Left Ventricular Hypertrophy.
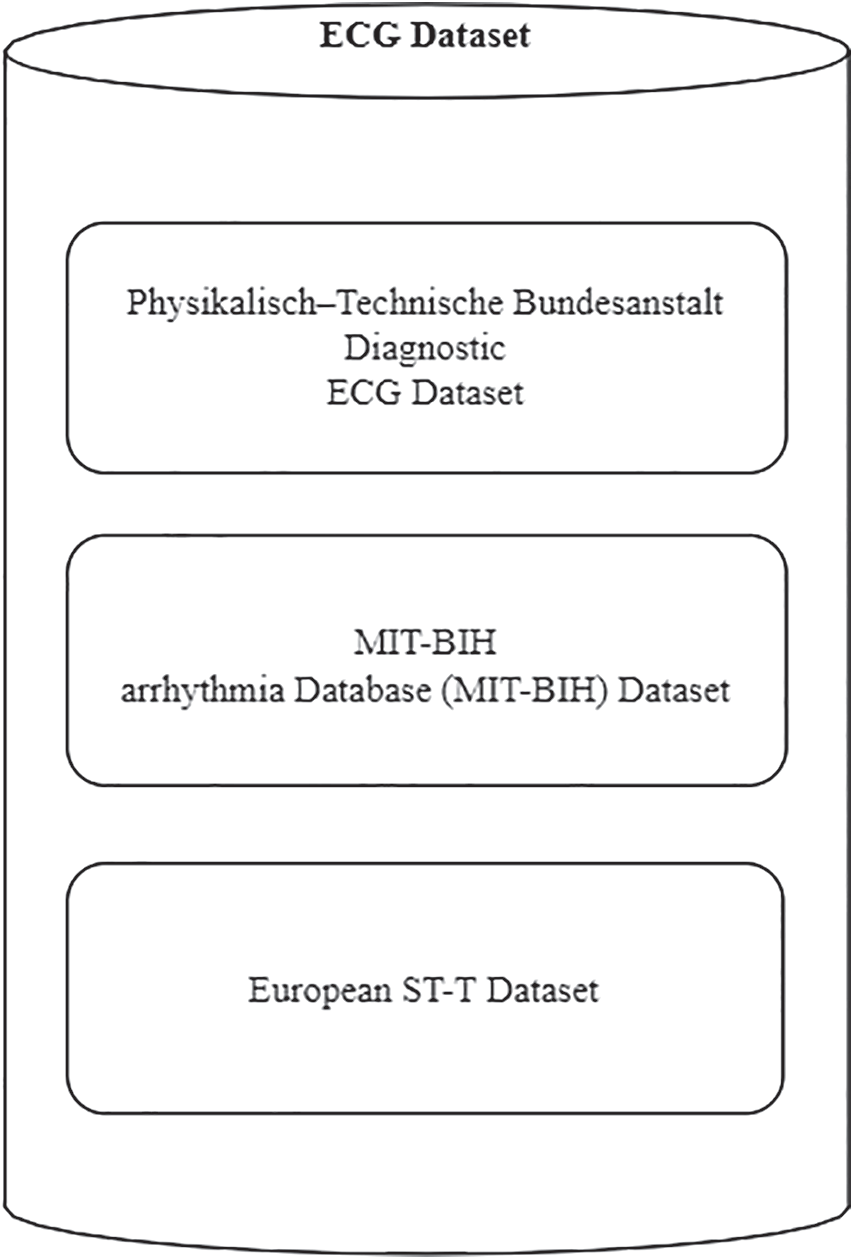
Figure 6: ECG dataset for the diagnosis of myocardial infarction, bundle branch block and left ventricular hypertrophy
2.1 The Physikalisch–Technische Bundesanstalt Diagnostic ECG Dataset
The 549 ECG documents in this dataset were compiled from 290 healthy volunteers and patients with multiple heart disorders. MI, cardiomyopathy/heart failure, bundle branch block (BBB), dysrhythmia, myocardial hypertrophy, valvular heart attack, and myocarditis are among the diseases represented in the dataset. There are 209 males and 81 females in the sample, with an average age of 57.2 years. MI has been annotated in 148 documents in the dataset [22].
2.2 MIT-BIH Arrhythmia Database (MIT-BIH) Dataset
This database is made up of 48 two-lead recordings, each lasting about a half-hour and sampled at 360 Hz. This database provides annotations for both beat class and timing detail, which has been confirmed by an independent expert. Representative beats to be used in the common training details can be found in the first 20 records (100–124). The diseased signal such as Junctional, ventricular, and supraventricular arrhythmias are included in the remaining 24 used documents (200–234) [23].
This dataset is designed to aid in the evaluation of ischemia detection algorithms by providing a standard dataset for reporting detection accuracy metrics and benchmarks. A total of 70 men and 8 women, ranging in age from 30 to 84, are included in the study. Of patient has myocardial ischemia, which was confirmed or assumed in the dataset, which includes 367 episodes of ST-segment changes and 401 episodes of T wave changes. Two of the most revealing ambulatory ECG leads, sampled at 250 Hz, are included in each record [24].
Preprocessing is the preliminary stage involved in the implementation of any proposed approach. ECG signals are commonly affected by noises such as muscle artifacts, electrode motion, powerline interference, and baseline wander [25]. Muscle artifacts are caused by muscle activity. The movement in the position of the electrode introduces an electrode motion [26,27]. Powerline Interference is generally present in the ECG signal that contains a 50/60 Hz sinusoidal signal and harmonics [28]. Baseline wander causes modifications in the baseline of the ECG signal during respiration. These noises could affect the P, Q, R, S, and T segments of the ECG signal, the frequency resolution, and signal quality, and generate amplitudes in the ECG signals that could mimic PQRST waveforms. It made the analysis of the ECG signal more difficult, often misdirecting the physician to make a false diagnosis [29,30]. Hence, the cancelation of these noises present in the ECG signal was an essential task for further processing.
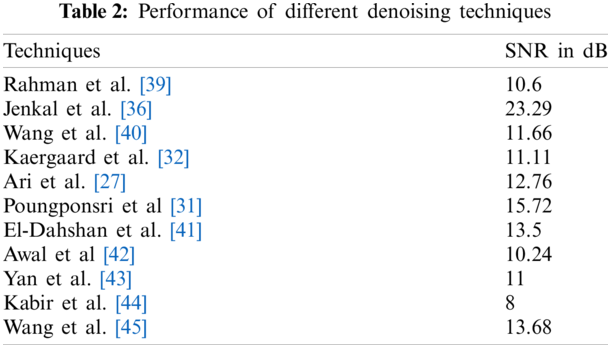
Different techniques have been presented in the literature for removing the noise present in the signal. The adaptive filtering technique based on discrete Wavelet Transform and artificial neural network is applied to the ECG signal, and it shows a significant improvement in Signals to Noise Ratio (SNR). But the disadvantage is that it is restricted to remove only certain types of noises. This technique reduces computational complexity [31]. The hybrid denoising techniques such as Ensemble Empirical Mode Decomposition (EMD) along with Block Least Mean square technique and Discrete Wavelet Transform (DWT) along with Neural Network were investigated and compared with DWT Thresholding method for eliminating the noise present in the signal. These techniques showed better performance than DWT thresholding did [32]. The presence of baseline wanders induced noise within 1 Hz which caused changes in the ST-segment. To reduce the noise Framelet Transform was applied and compared with DWT. The framelet transform showed better performance than DWT did [33]. The wavelet decomposition with level 2 was applied to the ECG signal and it showed that the approximation coefficient was similar to the low-frequency ECG signal. The higher-order decomposition coefficients emerged as the approximation coefficient with distorted ECG signals. So, it minimized the use of Non-Local Means (NLM). The effectiveness of both DWT and NLM was combined and found to be more efficient to remove the noise than other techniques were [34]. The ECG signal processing technique was applied based on Empirical Mode Decomposition (EMD) and the improved approximation envelope method. The Butterworth lowpass filter was implemented before applying it to EMD to eliminate high-frequency noise. This method eliminated the baseline wander and power line interference present in the ECG signal [35]. Jenkal et al. [36] proposed a method to denoise the ECG signal affected by various noises due to EMG signal, high frequency, and power line interferences. This technique depended on the DWT decomposition, and an Adaptive Dual Threshold Filter (ADTF). This technique produced a better result for the noise with higher density [36]. Sharma et al. [37] implemented a wavelet-based technique for the removal of the noise present in the electrocardiogram signal. This technique involved thresholding the coefficients of wavelets at various sub-bands. It was noticed that the utmost energy present in the signal existed in cD4, cD5, and cA5 sub-bands. The noise existed in the lower order sub-bands [37]. AlMahamdy et al. [38] presented various algorithms includes Savitzky-Golay filtering, adaptive filters, and discrete wavelet transform to remove the noise in the ECG signal. The NeighBlock wavelet method outperforms the other techniques. In some mid-range SNRs, however, the RLS and Savitzky-Golay filters work better [38]. Fig. 7 denotes the different methods with SNR improvement in decibel. Tab. 2 represents the different denoising techniques using ECG signals.
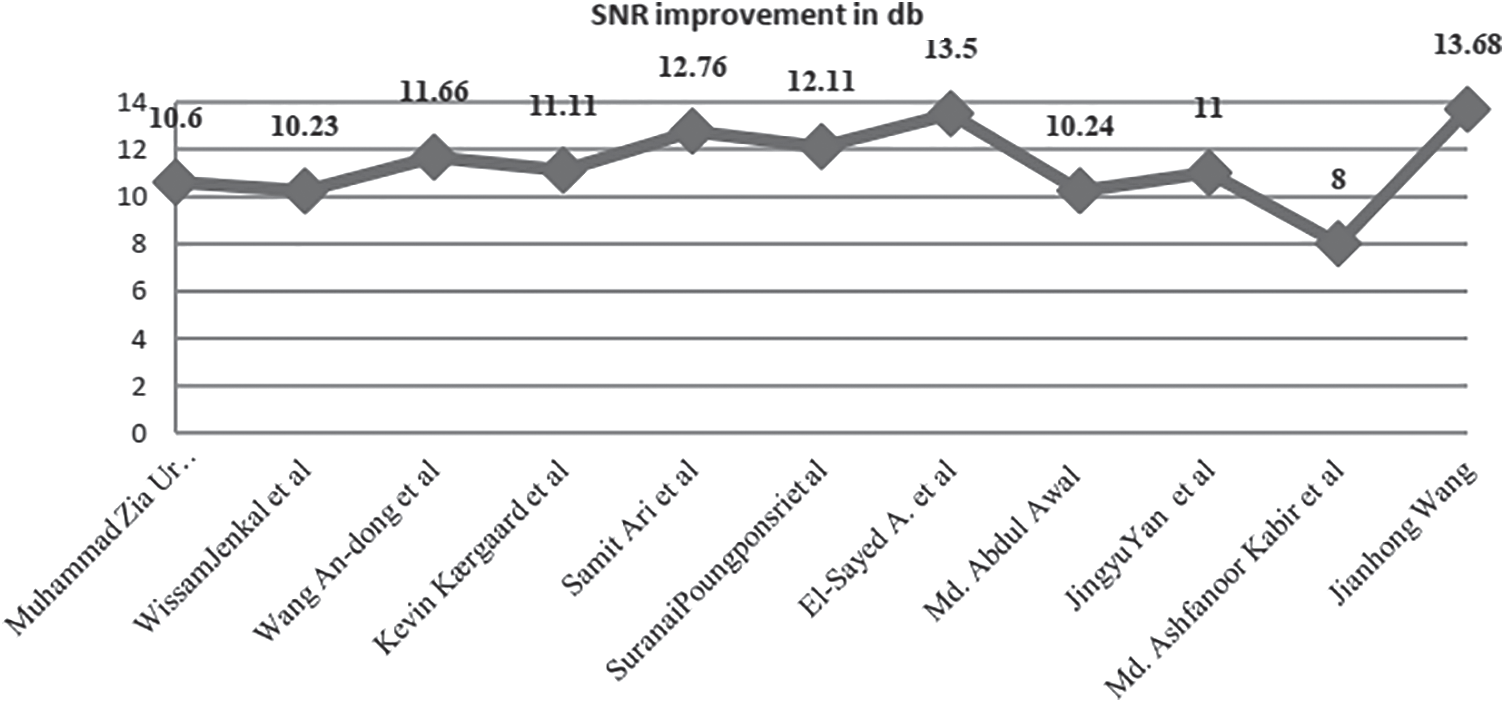
Figure 7: Several methods of SNR improvement in decibel
Feature extraction in the ECG signal is one of the essential processes for classification and different types of features are extracted to describe the ECG signal. The extracted features from ECG signals play a significant role in diagnosing most cardiac diseases, according to Sujan et al. [46] These features include temporal, statistical, and morphological features [47–50]. The feature extraction stage aims to find the simplest number of features that result in acceptable suitable classification rates [51]. It extracts valuable data from ECG signals [52]. Fig. 8 indicates various feature extraction techniques to diagnose MI, BBB, and LVH.
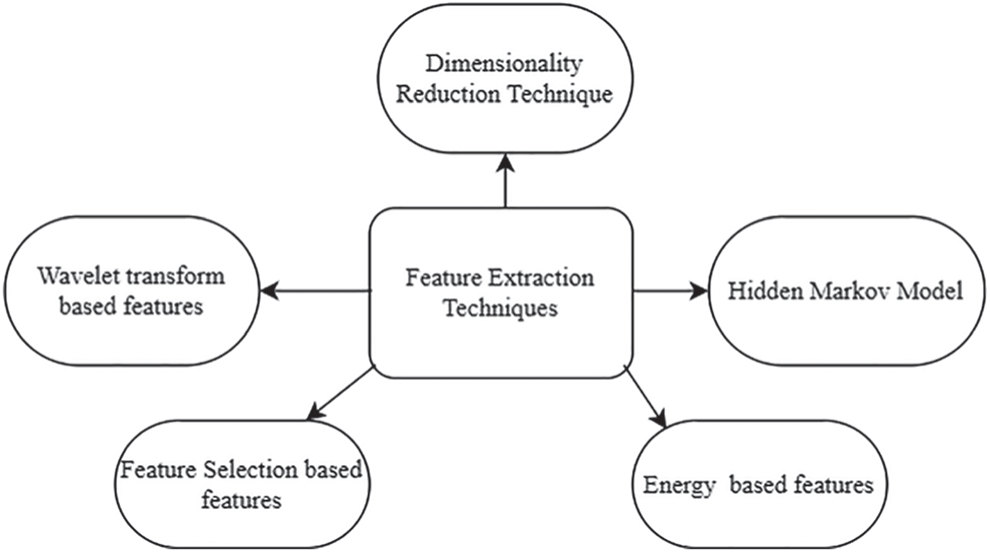
Figure 8: Various feature extraction techniques to diagnose MI, BBB and LVH
4.1 Wavelet Transform Based Features
In several techniques, the temporal features are obtained from the time domain signal. But certain hidden properties cannot be acquired in the time domain signal and do not provide adequate discrimination [53]. Statistical and morphological features can be obtained from both the time and frequency domains. The most popular used time-frequency approach is the wavelet transform [54–58]. This section reviews the wavelet-based research to Diagnose Myocardial Infarction, Bundle Branch Block, and Left Ventricular Hypertrophy.
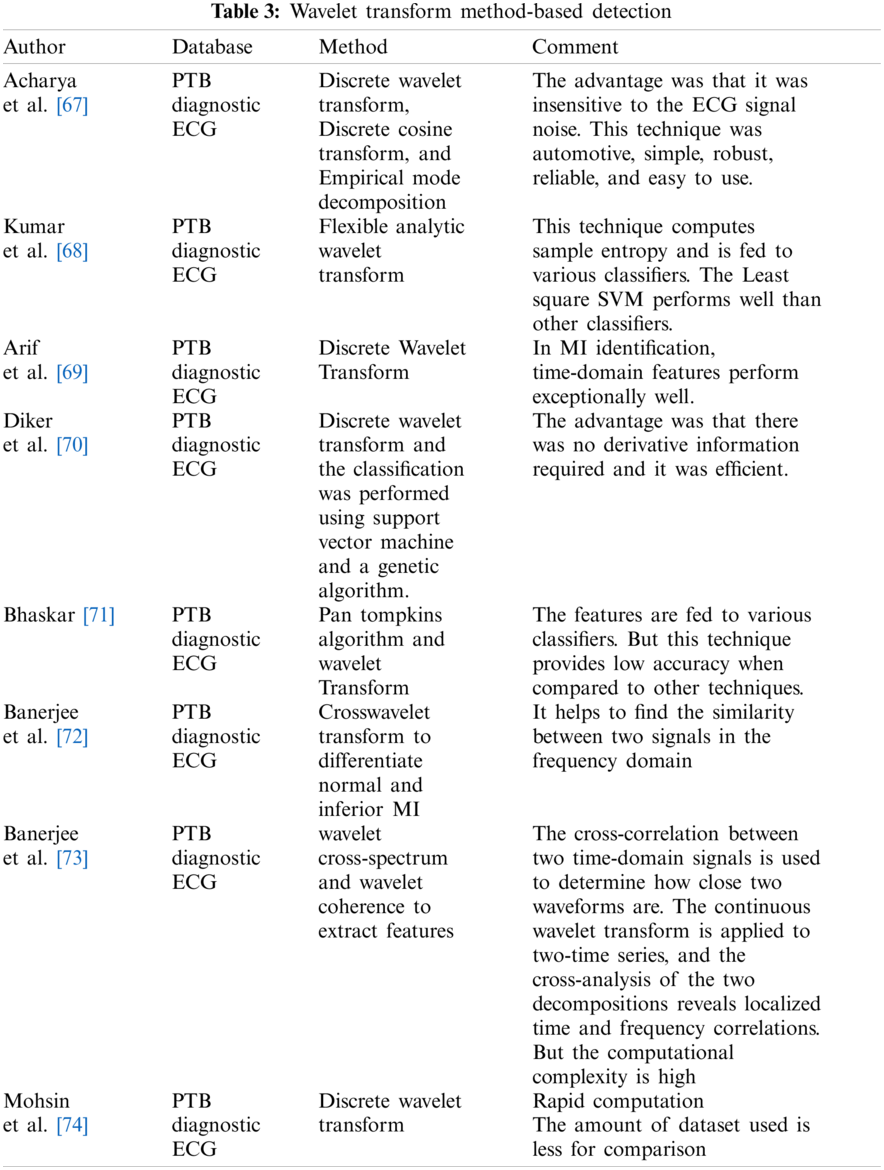
Non-stationary signals are easily analyzed with DWT [59–63]. The determined DWT coefficients have a compact representation of the signal’s energy distribution in time and frequency [64]. As a result, the feature vectors describing the signals were determined using the approximation and detail wavelet coefficients of the ECG signals. Jayachandran et al. [65] applied a Discrete Wavelet Transform to extract morphological features and calculated entropy. It was observed that more entropy value was obtained for normal signal than for MI-based signal. The classification accuracy obtained was 96.1% [65]. The feature extraction technique based on the Discrete Wavelet Transform (DWT) provides superior results [66]. For non-stationary ECG signals, DWT has acceptable scale values and shifting time [66]. Tab. 3 indicates some other papers based on the wavelet transform method.
4.2 Feature Selection Based Approaches
The dimension of the feature vector can increase the computational complexity. To overcome this issue, feature selection techniques help to select a feature set with good accuracy. Typically, the feature selection process is intended to provide a method for selecting the features that are suitable for classification optimization [75]. To identify features that are most descriptive for a specific type of disease, a feature selection process is needed [76]. It also helps to improve increase the process of disease detection. The papers which use feature selection techniques are reported in this section. Fig. 9 indicates various feature selection-based techniques to diagnose MI, BBB, and LVH.
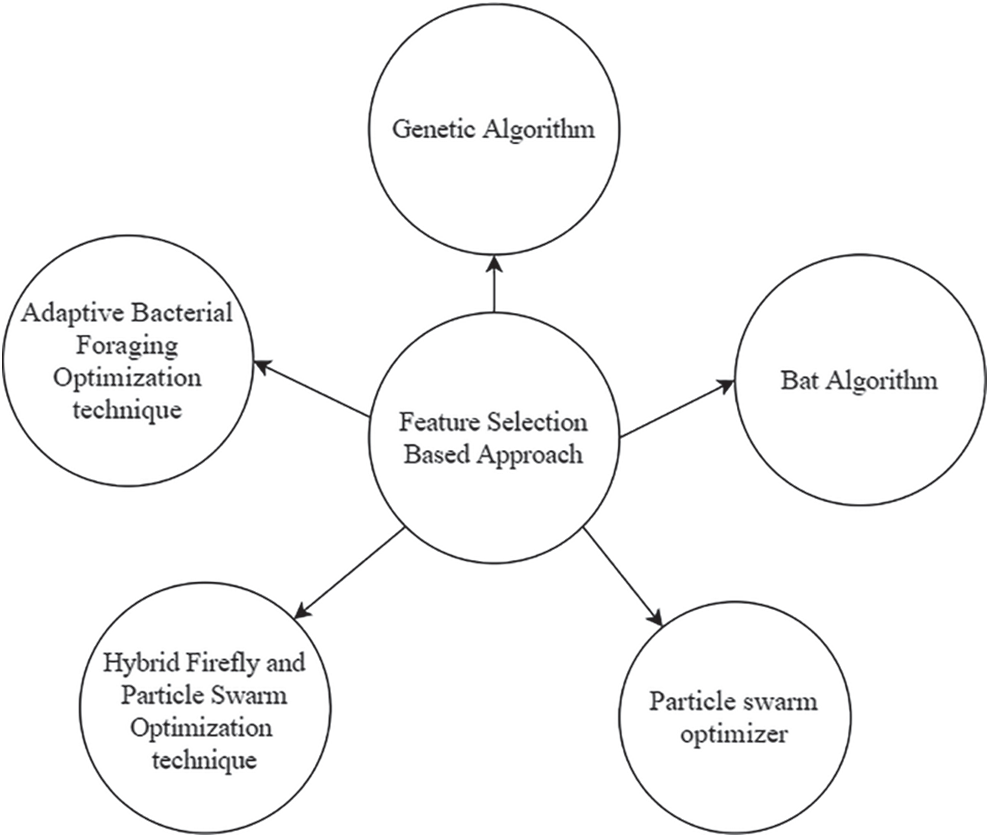
Figure 9: Various feature selection-based techniques to diagnose MI, BBB and LVH
4.2.1 Adaptive Bacterial Foraging Optimization (ABFO) Technique
Many techniques evolved based on the behavior manners of living organisms and have been implemented for finding solutions for real-world practical challenges. The bacterial Foraging optimization technique is one of the populations supported search approach [77–79]. The BFO is a non-gradient problem solved by using E. Coli microorganisms [80]. The operating steps are chemotaxis, Swarming, and reproduction. The movement of E. Coli is based on chemotaxis. This optimization technique helps to extract features from the ECG signal. It minimizes the features by eliminating unnecessary and noisy data. This method is helpful when the gradient of cost function unidentified. The mathematical computation complexity is less in the BFO technique. Bacterial Foraging Optimization with constant step size leads to two issues [81]. The larger step size leads to low precision even though the bacterium attains the optimum point quickly. For the smaller step size, it takes many chemotaxis steps to arrive at the optimal point. Hence, decrease in the convergence rate. Selecting a suitable step size is essential to increase convergence speed and reduce the error to achieve the final optimal value. The adaptive delta modulation helps to select the suitable step size [82]. The detection of BBB using ABFO is compared with the other algorithm which includes GA and BFO. The ABFO shows better result than other techniques.
4.2.2 Hybrid Firefly and Particle Swarm Optimization (FFPSO) Technique
A firefly optimization approach is a newly evolved technique based on the flashing process of fireflies [83]. The fitness function is implemented based on the fluorescence illumination manner of fireflies. Kora et al. [84] presented a Hybrid Bacterial Foraging along with a Particle Swarm Optimization algorithm for the diagnosis of Bundle Branch Block. The time-domain features were extracted from the MIT-BIH database to diagnose Bundle Branch Block. The feature selection approach is based on the combination of particle Swarm and Firefly optimization approach. In this hybrid approach, the position vector of the Firefly approach is adjusted based on the distance between the position of the firefly and the best velocity from previous and global best obtained from PSO. The distance was calculated based on cartesian distance. In this approach, every particle is randomly collected based on the global best in the overall population. The traditional Firefly Algorithm (FFA) has one drawback: it can get stuck in the local optimum. It is often impossible to get out of that situation. The parameters in the firefly algorithm are set, and there is no mechanism to remember each firefly’s previous best situation, so they shift regardless of the previous better solution [84].
Genetic algorithms are global search approaches that are based on the natural selection and genetics principle. The process starts with a population that is created at random and whose output is assessed using a fitness function [85]. It employs three basic operators known as selection, crossover, and mutation to find an optimized solution [86–88]. Kora et al. [89] implemented a genetic algorithm to obtain the best features. The features were fed to the LMNN classifier for the diagnosis of BBB. This technique achieved an accuracy of 98.9% [89]. Ragheed Allami et al. [90] implemented a Genetic algorithm along with Neural Network (GA-ANN) to extract 19 temporal and 3 morphological features to diagnose Bundle Branch Block. The results of this algorithm were compared with the principal component analysis along with the Neural Network technique. The GA-ANN techniques performed well showing an accuracy of 98% [90].
Bats are the most amazing group of birds [91]. Bats come in over 1200 different varieties [92]. Yang et al. [93] created the Bat Algorithm based on micro-bat behavior. They use echolocation to find their prey. The majority of bats have a highly developed sense of hearing. They make noises that are echoed back to them by insects or other things in their way. The bats can tell how far the insects or objects are from their current location by listening to the echoes. Within a fraction of a second, approximate the size of insects or particles [93]. As it gets closer to the prey, the bat’s pulse emission rate raises and loudness reduces. As a result, the Bat Algorithm’s optimal points can be chosen based on the bat’s pulse emission rate and loudness [94]. Kora et al. [95] presented an Improved Bat algorithm for extracting the best features and applied them as input to the neural network classifier. A good technique consists of high exploration and exploitation ability [94]. Much less exploration and too much exploitation can lead to premature convergence, while too much exploration but not enough exploitation can lead to difficulties in the algorithm’s convergence to optimal solutions [96]. But the bat algorithm provides feeble exploration. So, it leads to poor convergence towards global points. This can be overcome by balancing the pulse rate and loudness with the problem dimension. It was noticed that the bat algorithm along with LM NN performed better than other classifiers did to show an accuracy of 98.9% [92].
4.2.5 Particle Swarm Optimizer
Kennedy et al. [97,98] invented the particle swarm optimization method. This is based on the action of a bird [98]. Based on its own and other birds’ best flight experience, each particle reaches the optimum velocity. The fitness function is calculated using the inputs of particle coordinate positions as inputs. Sun et al. [99] implemented Multiple Instant Learning algorithms to diagnose Myocardial Ischemia without labeling heartbeats. In this technique, he applied a derivative-based technique and polynomial fitting function to extract features from R, S, T points, and ST segments. Particle Swarm Optimizer was used to cluster the features which were fed to the various classifiers. Its drawback was that the tuning of the input parameter was difficult. But it enhanced the quality of the classification in terms of sensitivity and specificity [99]. The demerits of the PSO technique are that it has been captured into local minima but convergence speed is high but in BFO the convergence speed is low but it’s not being captured into local minima.
Tang et al. [100] described a hidden Markov model (HMM) for the diagnosis of Myocardial Ischemia. In this work, the time domain signals were documented by the ECG before and during the event of ischemia. Then, the Hidden Markov model was applied for the ischemia diagnosis [100]. Chang et al. [101] extracted features from the ECG signal using the Hidden Markov model. It helps to detect ECG segmentation and a statistical feature called log-likelihood value. In the hidden Markov model, 16 states and 6 states were employed. The 16 states showed better results than the 6 states and the accuracy obtained was 82.5%. The advantage of the proposed system was that the hybrid technique showed better classification accuracy [101].
4.4 Dimensionality Reduction Technique
The ECG signal can be much more detailed if the feature vector has high dimensionality. The cost of computation increases as the volume of data increases. Due to the vast amount of redundant data, some of the features may be associated, resulting in a large number of irrelevant variables, which would have a substantial impact on computational performance [102]. As a result, it is important to eliminate some associated features while enhancing classification accuracy and performance. Data processing becomes much easier and faster as dimensionality is reduced, which improves the efficiency of clustering algorithms with fewer features [103]. PCA (Principal Component Analysis) and ICA (Independent Component Analysis) are dimensionality reduction algorithms. Even if dimensionality reduction is successful, the features extracted before dimensionality reduction are still valuable because they provide the details needed for dimensionality reduction [104]. The processing of principal components includes computing the data’s covariance matrix, decomposing it into eigenvalues, sorting the eigenvectors in decreasing order of eigenvalues, and eventually projecting the data into the latest principal component basis by taking the inner product of the actual signals and the sorted eigenvectors. This method reduces the computational complexity of a problem [105]. ICA is a nonlinear dimensionality reduction process to solve the weights. This method implies that the signal being targeted is composed of linearly mixed source components. In this, the data is centered on subtracting the mean and whitened by converting the data distribution into Gaussian. An iterative procedure is used to test the weights. The weight matrix, which contains the source signal weights, can be used to differentiate between ECG beat patterns [106]. This technique is widely used in ECG signal analysis.
Liu et al. [107] extracted features from ECG signals collected from the PTB database by fixing an ECG signal with a polynomial function of order 20. The fixed ECG curve was studied based on the Akaike information criterion (AIC), and to obtain a 94.4% accuracy in the diagnosis of Myocardial Infarction (MI) [107]. Sharma et al. [10] reported a technique to Diagnose Myocardial Infarction (MI) from a multi-lead electrocardiogram (ECG). The Multi-scale Energy and Eigenspace (MEES) method was implemented to extract only the relevant clinical components from ECG signal using Eigenvalues [10]. This technique comprises of wavelet transform of ECG signal. The clinical details of an ECG spread in various subbands are based on frequency content. These signals are recomposed with the eigenvalues. Multiscale matrices consist of segmented clinical components from the ECG signal. It helps to identify the MI pathologies [108]. The advantage of this technique was that it did not require the process of segmentation of ST-T complex and the history of the patient [108]. Kumar et al. [109] extracted statistical features which included kurtosis, form factor, and coefficient of variance for the diagnosis of ischemia. The bell curve was obtained from a normal distribution for various conditions of ST-segment which included normal, elevation, and depression episodes. The statistical features provide low computational complexity. The benefit of this method was that it eliminated noisy beats automatically. It efficiently filtered the desired signals to diagnose ischemia. It showed 97.83% average sensitivity and 97.56% specificity [109].
Kumar et al. [110] reported a technique for the diagnosis of ischemia using an isoelectric energy function that depended on the morphology of the ST segment. The isoelectric function helps to observe the samples that close to the isoelectric line. The value of the isoelectric function raises as an ST-segment exists near the isoelectric level and the value decreases as an ST-segment falls away from the isoelectric line. There were no complex calculations involved in this study. This method helped in the diagnosis of Myocardial Infarction without the knowledge of past references. The limitation of using the isoelectric energy function was that it was not suitable for examining T waves in the ECG signal. It showed 98.12% sensitivity and 98.16% specificity [110]. Sadhukhan et al. [111] extracted morphological and temporal features using the phase distribution pattern based on Fourier Harmonics. The logistic regression and Threshold-based classification rule were applied and obtained an accuracy of 95.6%. The advantage of this technique was that it reduced training time and computational complexity.
The performance of the classification is improved by extracting a combination of features mentioned in the previous section [112]. The major issue in the diagnosis of heart disease is that normal ECG signals vary from person to person, and the same disease induces various signs in the ECG signal for different patients. The diagnosis of heart disease using the ECG signal is difficult. Hence, the classification of the ECG signal plays a significant role in the diagnosis of various heart diseases. Many researchers implemented various types of conventional classifiers and artificial Neural Network classifiers for the diagnosis of heart diseases. Different feature extraction and classification techniques have been presented in the literature for obtaining better results from the ECG signal.
5.1 Support Vector Machine Based Classifier
SVM classifier is a supervised learning technique employed for classification or regression [113,114]. A classifier’s generalization is better as it minimizes training error while also increasing testing precision for uncertain testing datasets. Because of its generalization capacity, the SVM classifier for a single layer will supervise classification problems [114]. The kernel SVM is based on a statistical learning concept called a non-probabilistic binary-linear classifier [115–117]. In a high-dimensional feature space, this technique is used to formulate a computationally efficient way of learning good separating hyperplanes [118]. The merits of an SVM classifier are highly efficient along with greater accuracy [119]. The kernels are represented in mathematical function supported by kernel function selection [120,121]. The MEES-based extracted features were fed to SVM with linear and kernel function to diagnose Myocardial Infarction, yielding an accuracy of 87.69% and 99%. Han et al. [122] suggested a fusing energy entropy and morphological features diagnose MI. ECG signals are first disintegrated using the maximum overlap discrete wavelet packet transform (MODWPT), and then energy entropy is measured as global features using the decomposed coefficients. As local morphological features, the area, kurtosis coefficient, skewness coefficient, and standard deviation extracted from the QRS wave and ST-T segment of the ECG beat are computed. The best overall result is achieved by using a support vector machine (SVM) with radial basis kernel function and obtained an accuracy of 99.81%. Park et al. [123] implemented a discrete wavelet transform technique to diagnose ischemia. Three elements are extracted that can be used to distinguish ST episodes from regular episodes: 1) the region between the QRS onset and T-peak points, 2) the normalized and signed sum from the QRS offset to the active zero voltage level, and 3) the slope from the QRS onset to the offset point. These features fed to the SVM classifier and obtained an accuracy of 95.7%. de Lannoy et al. [124] implemented a Wavelet and Independent Component Analysis to extract features and fed to the SVM classifier and obtained an accuracy of 82.47%. Sharma et al. [125] segmented multi-lead electrocardiogram (ECG) signal was decomposed into separate sub-bands using the stationary wavelet transform. The features used are sample entropy, normalized sub-band capacity, log energy entropy, and median slope measured over chosen bands of multi-lead ECG. These features were fed into an SVM classifier, which yielded a 98.84% accuracy.
It is a non-parametric approach employed for regression or classification [126,127]. It is based on the instant learning principle [128]. One of the benefits of the KNN system for classifying objects is that it only involves tuning two parameters: K and the distance metric, to achieve high classification precision. The best choice of K and distance metric for calculating the nearest distance plays a key role in KNN-based implementations. Larger K values generally minimize the impact of noise on classification but leave class boundaries less distinct. The nearest neighbor algorithm is used when the class is estimated to be the class of the closest training sample (i.e., when K = 1). When solving binary classification problems, it’s best to make K an odd number to prevent tying votes [129]. When there are many elements in the training set, this classifier is useful in reducing the error of misclassification [130]. A group of “k” features from the training set that is close to the test features is chosen during classification. The distance between vectors was calculated using the Euclidean Distance. The class for the specific data is determined by the most commonly occurring group of the K nearest neighbors [131]. This technique minimizes overlearning and achieves the best results [132]. Don et al. [133] extracted features based on Higuchi’s fractal dimension. This method for calculating FD in a discrete-time series is very effective and is less noise-sensitive. The different features extracted in this analysis are FD, spectral entropy, QRS length, kurtosis, QRS amplitude, and mean of the power spectral density. These features were fed to the KNN and GMM classifiers to diagnose ischemia to obtain an accuracy of 99% and 98.24%, respectively [134]. Applied KNN classifier to diagnose MI and obtained an accuracy of 99.31%. The limitation of the KNN classifier was increased memory requirements to hold a training dataset. KNN is a memory-intensive algorithm that has already been labeled as instance-based or memory-based. KNN would take more time to scan all data points, and scanning all data points would necessitate more space for training data storage. This is because KNN is a lazy classifier that memorizes the entire training set without requiring any learning time. To minimize the storage space, Arif et al. [69] implemented a pruning algorithm. The obtained features were fed to the KNN classifier and obtaining 99.97% and 99.99% accuracy, respectively.
5.3 Neural Network-Based Classifier
An artificial neural network (ANN) is a mathematical model that is inspired by biological neurons’ establishment and functioning. It is a robust data processing platform that can capture and visualize dynamic input/output relationships [135]. Neural network-based systems [136] can diagnose ischemia diseases more accurately than other current systems, but they cannot provide an interpretation of a diagnosis. The ANN techniques most generally used for the diagnosis of MI, BBB and LVH are Levenberg–Marquardt Neural Network, scaled conjugate gradient method and Resilient Backpropagation Neural network. The best backpropagation network, the Levenberg–Marquardt Neural Network, is used. The Levenberg–Marquardt optimization method is used to change the weights and bias of this network. It is a simple method for approximating the function [135]. It reduces the nonlinear equation to a minimum and produces numerical performance. The scaled conjugate gradient approach is used to change the weights and biases. The analysis in this system is based on conjugate directions [136]. For each iteration, this approach determines the optimum distance [136,137]. The Resilient Backpropagation Neural network primarily shows the gradient’s orientation. It works in a similar way to a backpropagation network, but the weights are modified differently. The weights are determined by resilient propagation based on the sign of partial derivatives obtained in the current and previous iterations [138]. It reduces the influence of partial derivative magnitude. The gradients in the backpropagation network have small magnitudes, resulting in limited weight shifts. It is simple to choose the learning parameter, and it’s faster than a backpropagation network [139]. Hopkins et al. [140] designed a Backpropagation Neural Network to diagnose the presence of Left Ventricular Hypertrophy based on clinical information from ECG. This network showed an accuracy of 82%. Liu et al. [141] developed a Backpropagation Neural Network with PCA and without PCA to diagnose LVH. The BPN along with the PCA technique obtained an accuracy of 99.6% and BPN without PCA obtained an accuracy of 98.5%. The advantage of this technique was robust and more accurate production of either real-value or discrete value output. The disadvantages were that it was hard to understand the learning weights, the technique required more domain knowledge, and that it needed more training time [141]. Chaves et al. [142] developed a non-linear Sigmoidal Regression Blocks network which was a feedforward network to diagnose Left Ventricular Hypertrophy. This technique provided flexibility and robustness [142]. To diagnose BBB, a resilient backpropagation algorithm was implemented with 30 and 40 hidden node structures. The Levenberg-Marquardt algorithm was implemented with the 10 hidden nodes and achieved the best result when compared to the resilient backpropagation algorithm. The Polak-Ribiere conjugate gradient algorithm converges 11 times faster than the variable learning rate algorithm. This method lowers the computing complexity [143]. Signal features, rather than the raw signal, were used as the neural network’s input vector, which increased the suggested networks’ accuracy for both training and testing. Furthermore, by breaking down the classification process into various steps, using multi-stage ANN for ECG signal classification improved the classification process [144]. To diagnose BBB, the feature selection technique along with neural network performs well than conventional technique [144].
5.4 Deep Learning-Based Classification
This paper [145] suggests a novel deep learning-based method for the successful classification of ECG signals. The aim of deep learning, also known as feature learning [146] is to automatically learn a good feature representation from the input data [147–151]. Deep belief networks (DBNs), stacked autoencoder (SAE) [149], and convolutional neural networks (CNNs) [150] are examples of common deep learning architectures [152]. Deep learning has recently shown superior results in many implementations as opposed to shallow architectures [153]. The deep learning approach helps to find out an appropriate feature from the ECG signal. Deep learning has generated benefits in investigating features extracted using a deep neural network. The different layers in the network help to extracts the features from a deep neural network.
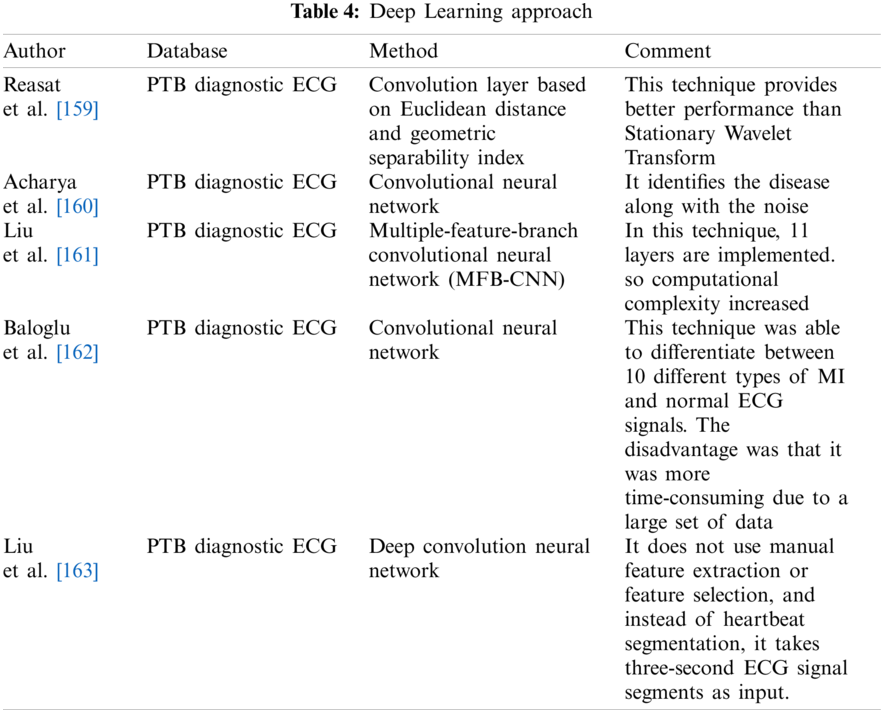
Shi et al. [154] reported Convolution Neural networks and long short-term memory Neural networks for the diagnosis of Bundle Branch Block. In this network, features extracted from three inputs using CNN and pooling layers were combined and fed to the LSTM network. A common recurrent neural network is the LSTM [155]. Since it remembers features from the early part of a series, an LSTM network can learn long-term dependencies [156]. The advantage of this technique was that the features were extracted automatically and combined with implicit features. The heartbeat regions were fully employed as various convolution strides. However, there was a disadvantage because the computational complexity was more and the performance of classes required improvement. It achieved an accuracy of 99.26% [154]. Hu et al. [157] extracted deep features which included Wavelet features, Linear Discriminant Analysis Features, Morphological Features, and statistical features using Deep Neural Network and Bidirectional long short-term memory networks from the multi-lead ECG signal for the diagnosis of Bundle Branch Block to obtain an accuracy of 99.96% [157]. Kwon et al. [158] implemented a Deep Neural Network with 5 hidden layers, Convolutional Neural Network, and an Ensemble Neural Network algorithm to diagnose LVH. The accuracy obtained by these neural networks was 85.2%, 85%, and 86.6% respectively. There were also a few disadvantages to this study. For example, a deep analysis of the characteristics of the P and T waves was required [158]. Tab. 4 indicates the diagnosis of MI based on the deep learning approach.
This study imparts details of various techniques that are associated with heart disease which induces changes in the ST segment. It describes the performance of each method and provides the scope for further development to explorers. Initially, various signal processing algorithms were implemented to diagnose various heart diseases. Later, different machine learning and deep learning approaches have been proposed to diagnose various diseases. These approaches provide a better result than the conventional techniques.
The various techniques implemented to diagnose Bundle Branch Block, Myocardial infarction, and Left Ventricular Hypertrophy. Most researchers implemented a hybrid technique that involves feature selection and a neural network approach. The feature selection technique along with neural network results shows that convergence speed is high. Generally, the performance of various feature selection and neural network classifiers to diagnose these diseases is nearly 98% accurate. For high-dimensional data, the computation complexity is high in machine learning classifiers. The deep learning approaches extract features implicitly and integrate them. The main disadvantage is higher computational complexity. The existence of a greater number of layers may increase computational time. Several factors may affect the performance of classifiers, which includes several data’s in the training set, and the existence of weights and biases in the neural network. Figs. 10–12 show the percentage of accuracy of feature selection, deep learning, and neural network techniques to diagnose. The figures represent that the neural network-based approach provides better results than the feature selection approach along with the conventional classifier.
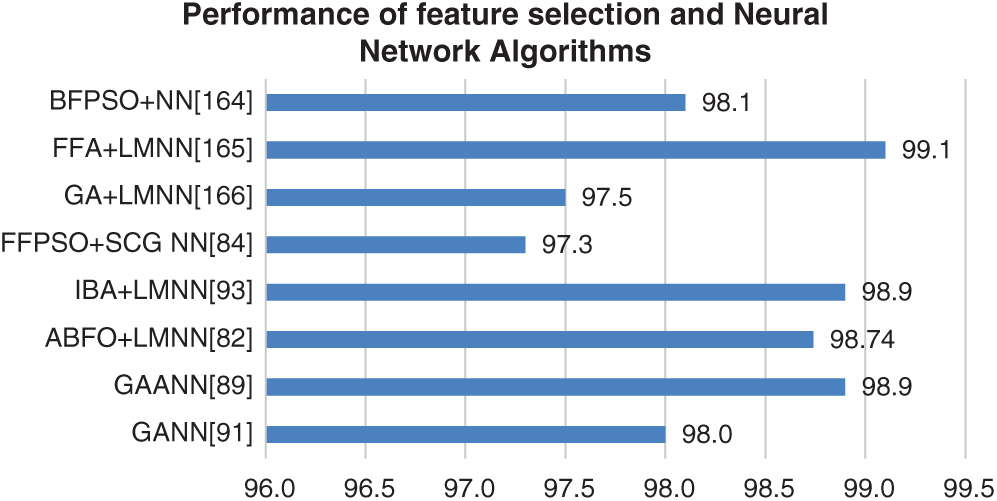
Figure 10: Performance of feature selection and neural network algorithms
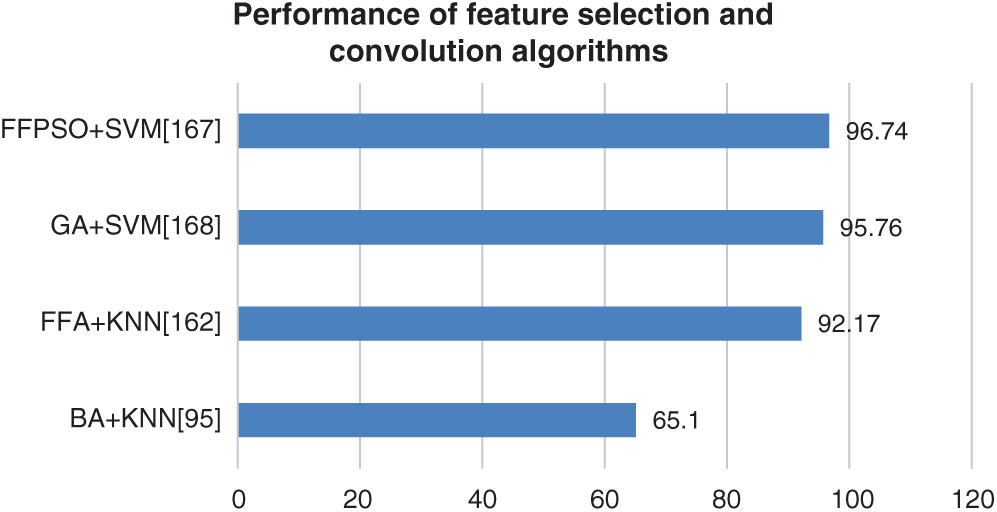
Figure 11: Performance of feature selection and conventional algorithm
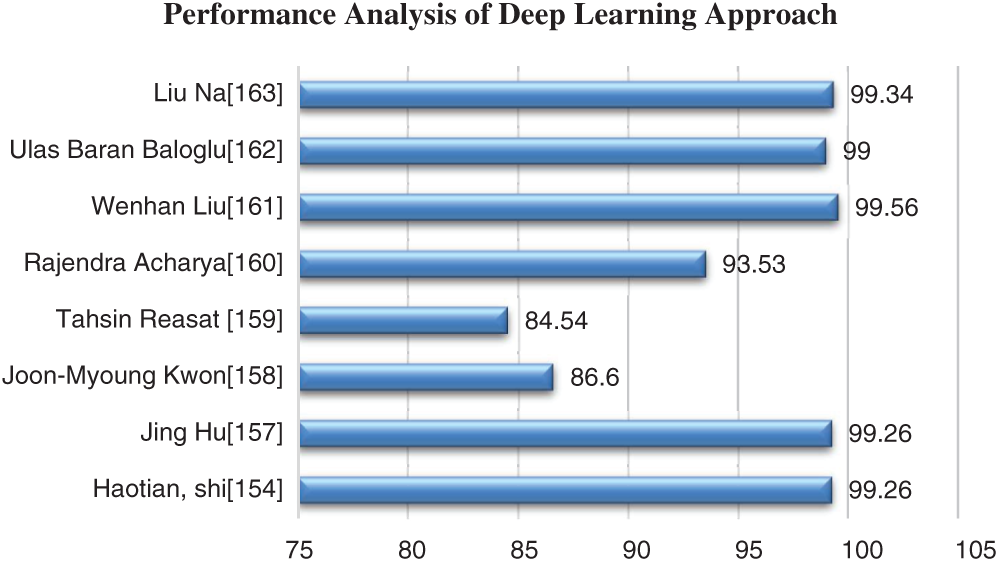
Figure 12: Performance analysis of Deep Learning approach
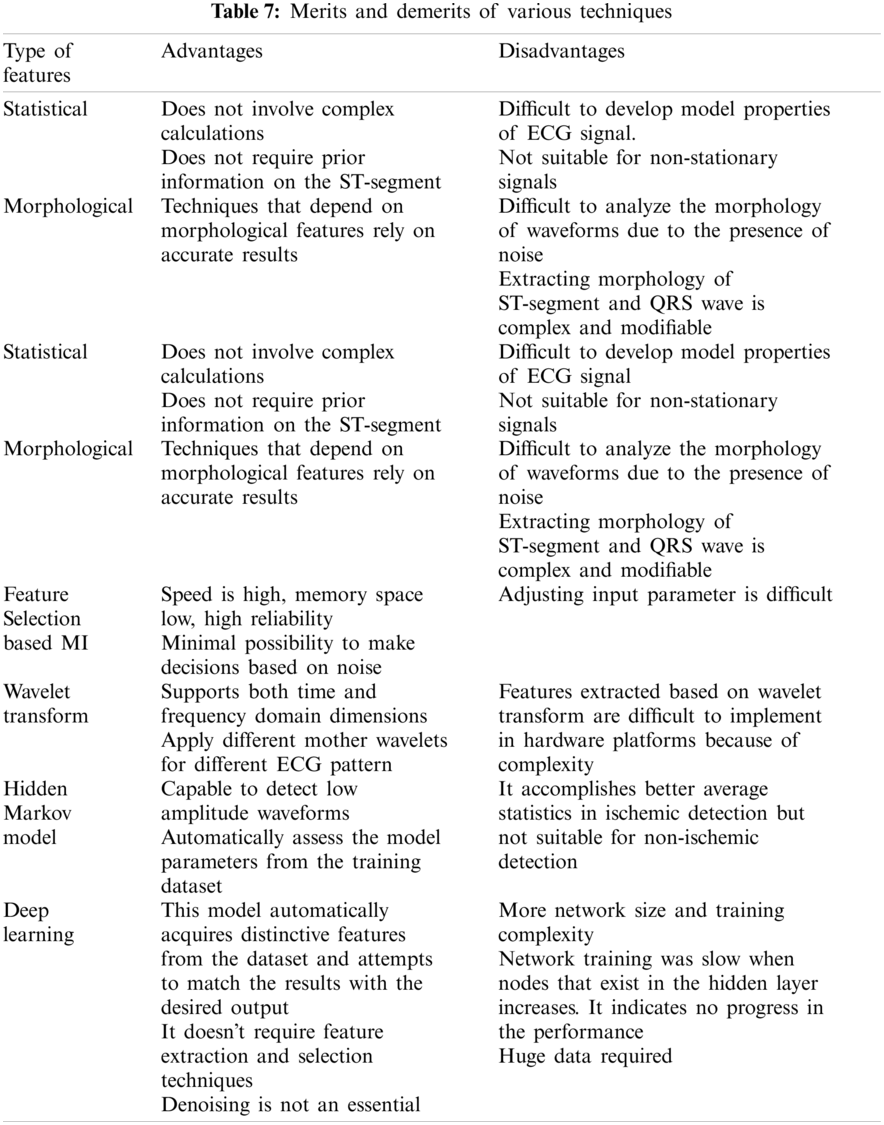
Previous research on the diagnosis of these heart diseases was based on statistical and morphological features, wavelet transform, neural networks, and deep learning approaches. The deep learning approach requires huge data for analysis. It leads to time consumption and computational complexity. Tab. 7 indicates the shortcomings and advantages of various features to diagnose these diseases. Only very few researches have been implemented in the diagnosis of LVH. Most researchers proposed neural network approaches to diagnose LVH [135]. The method does not necessitate any advanced knowledge of the ST section. The estimated features can be used for automated LVH labeling, reducing the need for manual annotation and allowing for faster LVH diagnosis. The limitations are that it requires more computational time.
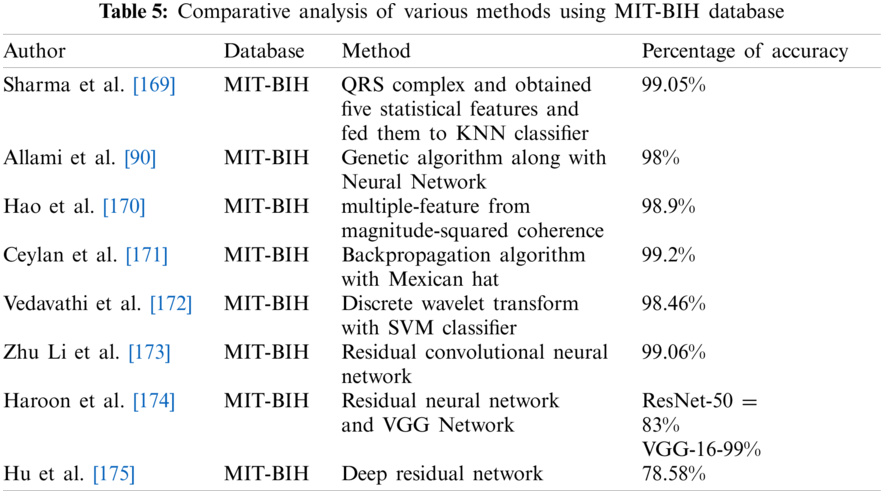
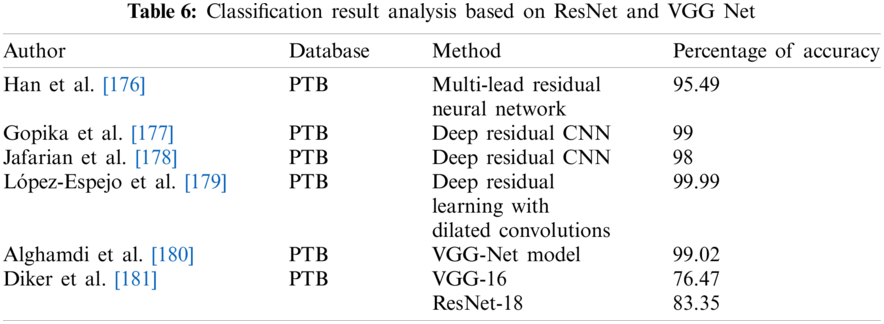
Tab. 5 indicates the performance analysis to diagnose these heart diseases using the MIT-BIH dataset. The PTB diagnostic database is used widely to diagnose Myocardial Infarction, Bundle Branch Block, and Left Ventricular Hypertrophy. Tab. 6 indicates the classification analysis of these heart diseases based on ResNet and VGGNet. This article benefits researchers to seek various hybrid approaches to differentiate these diseases.
This paper describes the overview of heart diseases that induce changes in the ST segment of the ECG signal. The process of analysis of ECG signal is reviewed in different sections which include diagnosis of Myocardial Infarction, Bundle Branch Block, and Left Ventricular Hypertrophy. Left Bundle Branch Block and Left Ventricular Hypertrophy are two similar conditions. Since patients normally complain of chest pain and the electrocardiographic changes mimic those seen in acute ST-elevation MI, it is called a myocardial infarction (MI). It has the potential to mislead the diagnostic process. A General Practitioner’s task is made more difficult by the fact that distinguishing between Acute Coronary Syndrome and less serious causes of chest pain. The majority of scientific work is focused on the automatic diagnosis of Myocardial Infarction using ECG signal, with a few works based on the automatic diagnosis of Left Ventricular Hypertrophy using ECG signal. Several issues with the automated classification of these diseases have been posed by researchers. The MIT-BIH and PTB diagnostic databases are used to present results in the literature. The limited number of databases available is a significant impediment to progress in research based on the fully automated classification of these diseases in ECG. To enhance the observed performance, some investigators used hybrid approaches. This is further described in various subsections such as different signal processing and classification techniques. Signal processing and classification techniques for the diagnosis of Myocardial infarctions in specific positions of coronary arteries in the heart, such as Left Anterior Descending Artery (Anterior position), Left Circumflex (Lateral position), and Right Coronary Artery (Inferior and Posterior position), can be investigated. Another essential direction is the investigation of these heart diseases using hybrid approaches.
Funding Statement: The authors received no specific funding for this study.
Conflicts of Interest: The authors declare that they have no conflicts of interest to report regarding the present study.
1. Lee, T. H., Goldman, L. (2000). Evaluation of the patient with acute chest pain. New England Journal of Medicine, 342(16), 1187–1195. DOI 10.1056/NEJM200004203421607. [Google Scholar] [CrossRef]
2. Brady, W. J., Chan, T. C., Pollack, M. (2000). Electrocardiographic manifestations: Patterns that confound the EKG diagnosis of acute myocardial infarction–-left bundle branch block, ventricular paced rhythm, and left ventricular hypertrophy. The Journal of Emergency Medicine, 18(1), 71–78. DOI 10.1016/S0736-4679(99)00178-X. [Google Scholar] [CrossRef]
3. Bacharova, L., Estes, E. H. (2017). Left ventricular hypertrophy by the surface ECG. Journal of Electrocardiology, 50(6), 906–908. DOI 10.1016/j.jelectrocard.2017.06.006. [Google Scholar] [CrossRef]
4. Gosse, P., Jan, E., Coulon, P., Cremer, A., Papaioannou, G. et al. (2012). ECG detection of left ventricular hypertrophy: The simpler, the better. Journal of Hypertension, 30(5), 990–996. DOI 10.1097/HJH.0b013e3283524961. [Google Scholar] [CrossRef]
5. de la Garza-Salazar, F., Romero-Ibarguengoitia, M. E., Rodriguez-Diaz, E. A., Azpiri-Lopez, J. R., Gonzalez-Cantu, A. (2020). Improvement of electrocardiographic diagnostic accuracy of left ventricular hypertrophy using a machine learning approach. PLoS One, 15(5), e0232657. DOI 10.1371/journal.pone.0232657. [Google Scholar] [CrossRef]
6. Aufderheide, T. P., Brady, W. J. (1994). Electrocardiography in the patient with myocardial ischemia or infarction. Emergency Cardiac Care, 51, 169–216. [Google Scholar]
7. Klein, R. C., Vera, Z., DeMaria, A. N., Mason, D. T. (1984). Electrocardiographic diagnosis of left ventricular hypertrophy in the presence of left bundle branch block. American Heart Journal, 108(3), 502–506. DOI 10.1016/0002-8703(84)90415-0. [Google Scholar] [CrossRef]
8. Sharkey, S. W., Berger, C. R., Brunette, D. D., Henry, T. D. (1994). Impact of the electrocardiogram on the delivery of thrombolytic therapy for acute myocardial infarction. The American Journal of Cardiology, 73(8), 550–553. DOI 10.1016/0002-9149(94)90331-X. [Google Scholar] [CrossRef]
9. Acharya, U. R., Kannathal, N., Hua, L. M., Yi, L. M. (2005). Study of heart rate variability signals at sitting and lying postures. Journal of Bodywork and Movement Therapies, 9(2), 134–141. DOI 10.1016/j.jbmt.2004.04.001. [Google Scholar] [CrossRef]
10. Sharma, L. N., Tripathy, R. K., Dandapat, S. (2015). Multiscale energy and eigenspace approach to detection and localization of myocardial infarction. IEEE Transactions on Biomedical Engineering, 62(7), 1827–1837. DOI 10.1109/TBME.2015.2405134. [Google Scholar] [CrossRef]
11. Tabas, J. A., Rodriguez, R. M., Seligman, H. K., Goldschlager, N. F. (2008). Electrocardiographic criteria for detecting acute myocardial infarction in patients with left bundle branch block: A meta-analysis. Annals of Emergency Medicine, 52(4), 329–336. DOI 10.1016/j.annemergmed.2007.12.006. [Google Scholar] [CrossRef]
12. Noriega, F. J., Vives-Borras, M., Sole-Gonzalez, E., García-Picart, J., Arzamendi, D. et al. (2014). Influence of the extent of coronary atherosclerotic disease on ST-segment changes induced by ST-elevation myocardial infarction. The American Journal of Cardiology, 113(5), 757–764. DOI 10.1016/j.amjcard.2013.11.034. [Google Scholar] [CrossRef]
13. Rossello, X., Wiegerinck, R. F., Alguersuari, J., Bardají, A., Worner, F. et al. (2014). New electrocardiographic criteria to differentiate acute pericarditis and myocardial infarction. The American Journal of Medicine, 127(3), 233–239. DOI 10.1016/j.amjmed.2013.11.006. [Google Scholar] [CrossRef]
14. Yildirim, E., Bugan, B., Koklu, M., Gormel, S., Celik, M. (2016). Acute myocarditis mimicking myocardial infarction can misdirect the diagnostic approach. International Journal of the Cardiovascular Academy, 2(1), 12–15. DOI 10.1016/j.ijcac.2016.01.005. [Google Scholar] [CrossRef]
15. Willemsen, R. T. A., Kietselaer, B. L. J. H., Kusters, R., Buntinx, F., Glatz, J. F. C. et al. (2015). Diagnosing acute coronary syndrome: A challenge for general practitioners and cardiologists. Emergency Medicine (Los Angel), 5(242), 2. DOI 10.4172/2165-7548.1000242. [Google Scholar] [CrossRef]
16. Coppola, G., Carità, P., Corrado, E., Borrelli, A., Rotolo, A. et al. (2013). ST segment elevations: Always a marker of acute myocardial infarction? Indian Heart Journal, 65(4), 412–423. DOI 10.1016/j.ihj.2013.06.013. [Google Scholar] [CrossRef]
17. Smith, S. W., Khalil, A., Henry, T. D., Rosas, M., Chang, R. J., Heller, K., Pearce, L. A. (2012). Electrocardiographic differentiation of early repolarization from subtle anterior ST-segment elevation myocardial infarction. Annals of Emergency Medicine, 60(1), 45–56. DOI 10.1016/j.annemergmed.2012.02.015. [Google Scholar] [CrossRef]
18. Dodd, K. W., Elm, K. D., Smith, S. W. (2016). Comparison of the QRS complex, ST-segment, and T-wave among patients with left bundle branch block with and without acute myocardial infarction. The Journal of Emergency Medicine, 51(1), 1–8. DOI 10.1016/j.jemermed.2016.02.029. [Google Scholar] [CrossRef]
19. Pollak, P., Brady, W. (2012). Electrocardiographic patterns mimicking ST-segment elevation myocardial infarction. Cardiology Clinics, 30(4), 601–615. DOI 10.1016/j.ccl.2012.07.012. [Google Scholar] [CrossRef]
20. Nable, J. V., Lawner, B. J. (2015). Chameleons: Electrocardiogram imitators of ST-segment elevation myocardial infarction. Emergency Medicine Clinics, 33(3), 529–537. DOI 10.1016/j.emc.2015.04.004. [Google Scholar] [CrossRef]
21. Goldberger, A. L., Amaral, L. A., Glass, L., Hausdorff, J. M., Ivanov, P. C. et al. (2000). Physiobank, physioToolkit, and physioNet: Components of a new research resource for complex physiologic signals. Circulation, 101(23), e215–e220. DOI 10.1161/01.CIR.101.23.e215. [Google Scholar] [CrossRef]
22. Ansari, S., Farzaneh, N., Duda, M., Horan, K., Andersson, H. B. et al. (2017). A review of automated methods for detection of myocardial ischemia and infarction using electrocardiogram and electronic health records. IEEE Reviews in Biomedical Engineering, 10, 264–298. DOI 10.1109/RBME.2017.2757953. [Google Scholar] [CrossRef]
23. Moody, G. B., Mark, R. G., Goldberger, A. L. (2001). Physionet: A web-based resource for the study of physiologic signals. IEEE Engineering in Medicine and Biology Magazine, 20(3), 70–75. DOI 10.1109/51.932728. [Google Scholar] [CrossRef]
24. Taddei, A., Distante, G., Emdin, M., Pisani, P., Moody, G. B. et al. (1992). The european ST-t database: Standard for evaluating systems for the analysis of ST-t changes in ambulatory electrocardiography. European Heart Journal, 13(9), 1164–1172. DOI 10.1093/oxfordjournals.eurheartj.a060332. [Google Scholar] [CrossRef]
25. Jenitta, J., Rajeswari, A. (2013). Denoising of ECG signal based on an improved adaptive filter with EMD and EEMD. 2013 IEEE Conference on Information & Communication Technologies, pp. 957–962. Thuckalay, India, IEEE. [Google Scholar]
26. Blanco-Velasco, M., Weng, B., Barner, K. E. (2008). ECG signal denoising and baseline wander correction based on the empirical mode decomposition. Computers in Biology and Medicine, 38(1), 1–13. DOI 10.1016/j.compbiomed.2007.06.003. [Google Scholar] [CrossRef]
27. Ari, S., Das, M. K., Chacko, A. (2013). ECG signal enhancement using S-transform. Computers in Biology and Medicine, 43(6), 649–660. DOI 10.1016/j.compbiomed.2013.02.015. [Google Scholar] [CrossRef]
28. Uchaipichat, N., Inban, S. (2010). Development of QRS detection using short-time Fourier transform-based technique. IJCA Journal, 8, 7–10. DOI 10.5120/ijca. [Google Scholar] [CrossRef]
29. Sahambi, J. S., Tandon, S. N., Bhatt, R. K. P., (1997). Quantitative analysis of errors due to power-line interference and base-line drift in detection of onsets and offsets in ECG using wavelets. Medical and Biological Engineering and Computing, 35(6), 747–751. DOI 10.1007/BF02510988. [Google Scholar] [CrossRef]
30. Cuomo, S., De Pietro, G., Farina, R., Galletti, A., Sannino, G. (2016). A revised scheme for real-time ECG signal denoising based on recursive filtering. Biomedical Signal Processing and Control, 27, 134–144. DOI 10.1016/j.bspc.2016.02.007. [Google Scholar] [CrossRef]
31. Poungponsri, S., Yu, X. H. (2013). An adaptive filtering approach for electrocardiogram (ECG) signal noise reduction using neural networks. Neurocomputing, 117, 206–213. DOI 10.1016/j.neucom.2013.02.010. [Google Scholar] [CrossRef]
32. Kaergaard, K., Søren, H., Soren Hjollund, J. (2015). ECG De-noising: A comparison between EEMD-bLMS and DWT-nN algorithms. 2015 37th Annual International Conference of the IEEE Engineering in Medicine and Biology Society, pp. 3811–3814. Milan, Italy, IEEE. [Google Scholar]
33. Sanyal, A., Baral, A., Lahiri, A. (2012). Application of framelet transform in filtering baseline drifts from ECG signals. Procedia Technology, 4, 862–866. DOI 10.1016/j.protcy.2012.05.141. [Google Scholar] [CrossRef]
34. Singh, P., Pradhan, G., Shahnawazuddin, S. (2017). Denoising of ECG signal by non-local estimation of approximation coefficients in DWT. Biocybernetics and Biomedical Engineering, 37(3), 599–610. DOI 10.1016/j.bbe.2017.06.001. [Google Scholar] [CrossRef]
35. Li, H., Yuan, D., Ma, X., Cui, D., Cao, L. (2017). Genetic algorithm for the optimization of features and neural networks in ECG signals classification. Scientific Reports, 7(1), 1–12. DOI 10.1038/srep41011. [Google Scholar] [CrossRef]
36. Jenkal, W., Latif, R., Toumanari, A., Dliou, A., El B’charri, O. et al. (2016). An efficient algorithm of ECG signal denoising using the adaptive dual threshold filter and the discrete wavelet transform. Biocybernetics and Biomedical Engineering, 36(3), 499–508. DOI 10.1016/j.bbe.2016.04.001. [Google Scholar] [CrossRef]
37. Sharma, L. N., Dandapat, S., Mahanta, A. (2010). ECG signal denoising using higher-order statistics in wavelet subbands. Biomedical Signal Processing and Control, 5(3), 214–222. DOI 10.1016/j.bspc.2010.03.003. [Google Scholar] [CrossRef]
38. AlMahamdy, M., Riley, H. B. (2014). Performance study of different denoising methods for ECG signals. Procedia Computer Science, 37, 325–332. DOI 10.1016/j.procs.2014.08.048. [Google Scholar] [CrossRef]
39. Rahman, M. Z. U., Shaik, R. A., Reddy, D. R. K. (2011). Efficient sign-based normalized adaptive filtering techniques for cancelation of artifacts in ECG signals: Application to wireless biotelemetry. Signal Processing, 91(2), 225–239. DOI 10.1016/j.sigpro.2010.07.002. [Google Scholar] [CrossRef]
40. Wang, A., Liu, L., Wei, Q. (2012). An adaptive morphologic filter applied to ECG de-noising and extraction of R peak at real-time. Masri Procedia, 1, 474–479. DOI 10.1016/j.aasri.2012.06.074. [Google Scholar] [CrossRef]
41. El-Dahshan, E. S. A. (2011). Genetic algorithm and wavelet hybrid scheme for ECG signal denoising. Telecommunication Systems, 46(3), 209–215. DOI 10.1007/s11235-010-9286-2. [Google Scholar] [CrossRef]
42. Awal, M. A., Mostafa, S. S., Ahmad, M., Rashid, M. A. (2014). An adaptive level-dependent wavelet thresholding for ECG denoising. Biocybernetics and Biomedical Engineering, 34(4), 238–249. DOI 10.1016/j.bbe.2014.03.002. [Google Scholar] [CrossRef]
43. Yan, J., Lu, Y., Liu, J., Wu, X., Xu, Y. (2010). Self-adaptive model-based ECG denoising using features extracted by mean shift algorithm. Biomedical Signal Processing and Control, 5(2), 103–113. DOI 10.1016/j.bspc.2010.01.003. [Google Scholar] [CrossRef]
44. Kabir, M. A., Shahnaz, C. (2012). Denoising of ECG signals based on noise reduction algorithms in EMD and wavelet domains. Biomedical Signal Processing and Control, 7(5), 481–489. DOI 10.1016/j.bspc.2011.11.003. [Google Scholar] [CrossRef]
45. Wang, J., Ye, Y., Pan, X., Gao, X. (2015). Parallel-type fractional zero-phase filtering for ECG signal denoising. Biomedical Signal Processing and Control, 18, 36–41. DOI 10.1016/j.bspc.2014.10.012. [Google Scholar] [CrossRef]
46. Sujan, K. S. S., Pridhvi, R. S., Priya, K. P., Ramana, R. V. (2015). Performance analysis for the feature extraction algorithm of an ECG signal. 2015 International Conference on Innovations in Information, Embedded and Communication Systems, pp. 1–5. Coimbatore, India, IEEE. [Google Scholar]
47. Mar, T., Zaunseder, S., Martínez, J. P., Llamedo, M., Poll, R. (2011). Optimization of ECG classification by means of feature selection. IEEE Transactions on Biomedical Engineering, 58(8), 2168–2177. DOI 10.1109/TBME.10. [Google Scholar] [CrossRef]
48. Fatemian, S. Z. (2009). A wavelet-based approach to electrocardiogram (ECG) and phonocardiogram (PCG) subject recognition (Ph.D. Thesis). University of Toronto, Canada. [Google Scholar]
49. Tsao, Y. T., Shen, T. W., Ko, T. F., Lin, T. H. (2007). The morphology of the electrocardiogram for evaluating ECG biometrics. 2007 9th International Conference on e-Health Networking, Application and Services, pp. 233–235. Taipei, Taiwan, IEEE. [Google Scholar]
50. Islam, M. S., Alajlan, N. (2013). A morphology alignment method for resampled heartbeat signals. Biomedical Signal Processing and Control, 8(3), 315–324. DOI 10.1016/j.bspc.2012.11.006. [Google Scholar] [CrossRef]
51. Acharya, U. R., Hagiwara, Y., Koh, J. E. W., Oh, S. L., Tan, J. H. et al. (2018). Entropies for automated detection of coronary artery disease using ECG signals: A review. Biocybernetics and Biomedical Engineering, 38(2), 373–384. DOI 10.1016/j.bbe.2018.03.001. [Google Scholar] [CrossRef]
52. Dewangan, N. K., Shukla, S. P. (2015). A survey on ECG signal feature extraction and analysis techniques. International Journal of Innovative Research in Electrical, Electronics, Instrumentation and Control Engineering, 3(6), 12–19. DOI 10.17148/IJIREEICE.2015.3603. [Google Scholar] [CrossRef]
53. Lin, C. H. (2008). Frequency-domain features for ECG beat discrimination using grey relational analysis-based classifier. Computers & Mathematics with Applications, 55(4), 680–690. DOI 10.1016/j.camwa.2007.04.035. [Google Scholar] [CrossRef]
54. Arif, M. (2008). Robust electrocardiogram (ECG) beat classification using discrete wavelet transform. Physiological Measurement, 29(5), 555. DOI 10.1088/0967-3334/29/5/003. [Google Scholar] [CrossRef]
55. Gramatikov, B., Georgiev, I. (1995). Wavelets as alternative to short-time Fourier transform in signal-averaged electrocardiography. Medical and Biological Engineering and Computing, 33(3), 482–487. DOI 10.1007/BF02510534. [Google Scholar] [CrossRef]
56. Li, C., Zheng, C., Tai, C. (1995). Detection of ECG characteristic points using wavelet transforms. IEEE Transactions on Biomedical Engineering, 42(1), 21–28. DOI 10.1109/10.362922. [Google Scholar] [CrossRef]
57. Zhao, Q., Zhang, L. (2005). ECG feature extraction and classification using wavelet transform and support vector machines. 2005 International Conference on Neural Networks and Brain, vol. 2, pp. 1089–1092, Beijing, China, IEEE. [Google Scholar]
58. Elhaj, F. A., Salim, N., Harris, A. R., Swee, T. T., Ahmed, T. (2016). Arrhythmia recognition and classification using combined linear and nonlinear features of ECG signals. Computer Methods and Programs in Biomedicine, 127, 52–63. DOI 10.1016/j.cmpb.2015.12.024. [Google Scholar] [CrossRef]
59. Fischer, R., Akay, M., Fractal Analysis of Heart Rate Variability. (1998). Time frequency and wavelets in biomedical signal processing. IEEE Press Series in Biomedical Engineering, pp. 719–728. [Google Scholar]
60. Sharma, M., Dhere, A., Pachori, R. B., Acharya, U. R. (2017). An automatic detection of focal EEG signals using new class of time–frequency localized orthogonal wavelet filter banks, knowl. Knowledge-Based Systems, 118, 217–227. DOI 10.1016/j.knosys.2016.11.024. [Google Scholar] [CrossRef]
61. Kalayci, T., Ozdamar, O. (1995). Wavelet preprocessing for automated neural network detection of EEG spikes. IEEE Engineering in Medicine and Biology Magazine, 14(2), 160–166. DOI 10.1109/51.376754. [Google Scholar] [CrossRef]
62. Zhi, K. Y., Faust, O., Yu, W. (2014). Wavelet based machine learning techniques for electrocardiogram signal analysis. Journal of Medical Imaging and Health Informatics, 4(5), 737–742. DOI 10.1166/jmihi.2014.1314. [Google Scholar] [CrossRef]
63. Lin, H. Y., Liang, S. Y., Ho, Y. L., Lin, Y. H., Ma, H. P. (2014). Discrete-wavelet-transform-based noise removal and feature extraction for ECG signals. Irbm, 35(6), 351–361. DOI 10.1016/j.irbm.2014.10.004. [Google Scholar] [CrossRef]
64. Mallat, S. (2009). Wavelet zoom. A wavelet tour of signal processing. Third Edition: The Sparse Way, 205–259. DOI 10.1016/B978-0-12-374370-1.00010-0. [Google Scholar] [CrossRef]
65. Jayachandran, E. S. (2010). Analysis of myocardial infarction using discrete wavelet transform. Journal of Medical Systems, 34(6), 985–992. DOI 10.1007/s10916-009-9314-5. [Google Scholar] [CrossRef]
66. Mahmoodabadi, S. Z., Ahmadian, A., Abolhasani, M. D. (2005). ECG feature extraction using daubechies wavelets. Proceedings of the Fifth IASTED International Conference on Visualization, Imaging and Image Processing, pp. 343–348. Benidorm, Spain. [Google Scholar]
67. Acharya, U. R., Fujita, H., Adam, M., Lih, O. S., Sudarshan, V. K. et al. (2017). Automated characterization and classification of coronary artery disease and myocardial infarction by decomposition of ECG signals: A comparative study. Information Sciences, 377, 17–29. DOI 10.1016/j.ins.2016.10.013. [Google Scholar] [CrossRef]
68. Kumar, M., Pachori, R. B., Acharya, U. R. (2017). Automated diagnosis of myocardial infarction ECG signals using sample entropy in flexible analytic wavelet transform framework. Entropy, 19(9), 488. DOI 10.3390/e19090488. [Google Scholar] [CrossRef]
69. Arif, M., Malagore, I. A., Afsar, F. A. (2012). Detection and localization of myocardial infarction using k-nearest neighbor classifier. Journal of Medical Systems, 36(1), 279–289. DOI 10.1007/s10916-010-9474-3. [Google Scholar] [CrossRef]
70. Diker, A., Cömert, Z., Avci, E., Velappan, S. (2018). Intelligent system based on genetic algorithm and support vector machine for detection of myocardial infarction from ECG signals. 2018 26th Signal Processing and Communications Applications Conference (SIUpp. 1–4. Izmir, Turkey, IEEE. DOI 10.1109/SIU.2018.8404299. [Google Scholar] [CrossRef]
71. Bhaskar, N. A. (2015). Performance analysis of support vector machine and neural networks in detection of myocardial infarction. Procedia Computer Science, 46, 20–30. DOI 10.1016/j.procs.2015.01.043. [Google Scholar] [CrossRef]
72. Banerjee, S., Mitra, M. (2012). Cross wavelet transform based analysis of electrocardiogram signals. International Journal of Electrical, Electronics and Computer Engineering, 1(2), 88–92. [Google Scholar]
73. Banerjee, S., Mitra, M. (2013). Classification of ST and Q type MI variant using thresholding and neighbourhood estimation method after cross wavelet-based analysis. arXiv preprint arXiv:1311.5639. [Google Scholar]
74. Mohsin, A., Faust, O. (2019). Automated characterization of cardiovascular diseases using wavelet transform features extracted from ECG signals. Journal of Mechanics in Medicine and Biology, 19(01), 1940009. DOI 10.1142/S0219519419400098. [Google Scholar] [CrossRef]
75. Jahankhani, P., Kodogiannis, V., Revett, K., (2006). EEG signal classification using wavelet feature extraction and neural networks. IEEE John Vincent Atanasoff 2006 International Symposium on Modern Computing, pp. 120–124. Sofia, Bulgaria, IEEE. [Google Scholar]
76. Kwak, N., Choi, C. H. (2002). Input feature selection for classification problems. IEEE Transactions on Neural Networks, 13(1), 143–159. DOI 10.1109/72.977291. [Google Scholar] [CrossRef]
77. Bakwad, K. M., Pattnaik, S. S., Sohi, B. S., Devi, S., Panigrahi, B. K. et al. (2010). Multimodal function optimization using synchronous bacterial foraging optimization technique. IETE Journal of Research, 56(2), 80–87. DOI 10.4103/0377-2063.63085. [Google Scholar] [CrossRef]
78. Ulagammai, M., Venkatesh, P., Kannan, P. S., Padhy, N. P. (2007). Application of bacterial foraging technique trained artificial and wavelet neural networks in load forecasting. Neurocomputing, 70(16–18), 2659–2667. DOI 10.1016/j.neucom.2006.05.020. [Google Scholar] [CrossRef]
79. Munoz, M. A., Lopez, J. A., Caicedo, E. (2007). Bacteria swarm foraging optimization for dynamical resource allocation in a multizone temperature experimentation platform. Analysis and Design of Intelligent Systems Using Soft Computing Techniques, pp. 427–435. Springer, Berlin, Heidelberg. [Google Scholar]
80. Biswas, A., Dasgupta, S., Das, S., Abraham, A. (2007). Synergy of PSO and bacterial foraging optimization–-A comparative study on numerical benchmarks. Innovations in Hybrid Intelligent Systems, pp. 255–263. Springer, Berlin, Heidelberg. [Google Scholar]
81. Nasir, A. N., Tokhi, M. O., Ghani, N. (2014). Novel adaptive bacteria foraging algorithms for global optimization. Applied Computational Intelligence and Soft Computing, DOI 10.1155/2014/494271. [Google Scholar] [CrossRef]
82. Kora, P., Kalva, S. R. K. (2017). Detection of bundle branch block using adaptive bacterial foraging optimization and neural network. Egyptian Informatics Journal, 18(1), 67–74. DOI 10.1016/j.eij.2016.04.004. [Google Scholar] [CrossRef]
83. Mishra, A., Agarwal, C., Sharma, A., Bedi, P. (2014). Optimized gray-scale image watermarking using DWT–SVD and firefly algorithm. Expert Systems with Applications, 41(17), 7858–7867. DOI 10.1016/j.eswa.2014.06.011. [Google Scholar] [CrossRef]
84. Kora, P., Krishna, K. S. R. (2016). Hybrid firefly and particle swarm optimization algorithm for the detection of bundle branch block. International Journal of the Cardiovascular Academy, 2(1), 44–48 DOI 10.1016/j.ijcac.2015.12.001. [Google Scholar] [CrossRef]
85. Sahu, R. K., Panda, S., Padhan, S. (2015). A hybrid firefly algorithm and pattern search technique for automatic generation control of multi area power systems. International Journal of Electrical Power & Energy Systems, 64, 9–23. DOI 10.1016/j.ijepes.2014.07.013. [Google Scholar] [CrossRef]
86. da Silva, A. R. F. (2005). Wavelet denoising with evolutionary algorithms. Digital Signal Processing, 15(4), 382–399. DOI 10.1016/j.dsp.2004.11.003. [Google Scholar] [CrossRef]
87. Huang, C. L., Wang, C. J. (2006). A GA-based feature selection and parameters optimization for support vector machines. Expert Systems with Applications, 31(2), 231–240. DOI 10.1016/j.eswa.2005.09.024. [Google Scholar] [CrossRef]
88. Khazaee, A., Ebrahimzadeh, A. (2010). Classification of electrocardiogram signals with support vector machines and genetic algorithms using power spectral features. Biomedical Signal Processing and Control, 5(4), 252–263. DOI 10.1016/j.bspc.2010.07.006. [Google Scholar] [CrossRef]
89. Kora, P., Krishna, K. S. R. (2016). Bundle block detection using genetic neural network. Information Systems Design and Intelligent Applications, 434, 309–317. DOI 10.1007/978-81-322-2752-6. [Google Scholar] [CrossRef]
90. Allami, R., Stranieri, A., Balasubramanian, V., Jelinek, H. F. (2016). A genetic algorithm-neural network wrapper approach for bundle branch block detection. 2016 Computing in Cardiology Conference, pp. 461–464. Vancouver, BC, Canada, IEEE. DOI 10.22489/CinC.2016.132-174. [Google Scholar] [CrossRef]
91. Yang, X. S., He, X. (2013). Bat algorithm: Literature review and applications. International Journal of Bio-Inspired Computation, 5(3), 141–149. DOI 10.1504/IJBIC.2013.055093. [Google Scholar] [CrossRef]
92. Fister, I. (2013). A comprehensive review of bat algorithms and their hybridization (Ph.D. Thesis). Univerza v Mariboru, Fakulteta za elektrotehniko, računalništvo in informatiko. [Google Scholar]
93. Yang, X. S. (2010). A new metaheuristic bat-inspired algorithm. Nature Inspired Cooperative Strategies for Optimization, pp. 65–74. Springer, Berlin, Heidelberg. [Google Scholar]
94. Yang, X. S., Deb, S. (2009). Cuckoo search via levy flights. 2009 World Congress on Nature & Biologically Inspired Computing, pp. 210–214. Coimbatore, India, IEEE. DOI 10.1109/NABIC.2009.5393690. [Google Scholar] [CrossRef]
95. Kora, P., Kalva, S. R. (2015). Improved Bat algorithm for the detection of myocardial infarction. SpringerPlus, 4(1), 1–18. DOI 10.1186/s40064-015-1379-7. [Google Scholar] [CrossRef]
96. Yılmaz, S., Kucuksille, E. U., Cengiz, Y. (2014). Modified bat algorithm. Elektronika ir Elektrotechnika, 20(2), 71–78. DOI 10.5755/j01.eee.20.2.4762. [Google Scholar] [CrossRef]
97. Kennedy, J., Eberhart, R. (1995). Particle swarm optimization. Proceedings of International Conference on Neural Networks, vol. 4, pp. 1942–1948. Perth, WA, Australia, IEEE. [Google Scholar]
98. Aydilek, I. B. (2018). A hybrid firefly and particle swarm optimization algorithm for computationally expensive numerical problems. Applied Soft Computing, 66, 232–249. DOI 10.1016/j.asoc.2018.02.025. [Google Scholar] [CrossRef]
99. Sun, L., Lu, Y., Yang, K., Li, S. (2012). ECG analysis using multiple instance learning for myocardial infarction detection. IEEE Transactions on Biomedical Engineering, 59(12), 3348–3356. DOI 10.1109/TBME.2012.2213597. [Google Scholar] [CrossRef]
100. Tang, X., Xia, L., Liu, W., Peng, Y., Gao, T. et al. (2012). An approach to determine myocardial ischemia by hidden markov models. Computer Methods in Biomechanics and Biomedical Engineering, 15(10), 1065–1070. DOI 10.1080/10255842.2011.570341. [Google Scholar] [CrossRef]
101. Chang, P. C., Lin, J. J., Hsieh, J. C., Weng, J. (2012). Myocardial infarction classification with multi-lead ECG using hidden markov models and Gaussian mixture models. Applied Soft Computing, 12(10), 3165–3175. DOI 10.1016/j.asoc.2012.06.004. [Google Scholar] [CrossRef]
102. Qin, Q., Li, J., Zhang, L., Yue, Y., Liu, C. (2017). Combining low-dimensional wavelet features and support vector machine for arrhythmia beat classification. Scientific Reports, 7(1), 1–12. DOI 10.1038/s41598-017-06596-z. [Google Scholar] [CrossRef]
103. Xie, L., Li, Z., Zhou, Y., He, Y., Zhu, J. (2020). Computational diagnostic techniques for electrocardiogram signal analysis. Sensors, 20(21), 6318. DOI 10.1038/s41598-017-06596-z. [Google Scholar] [CrossRef]
104. Liu, T., Si, Y., Wen, D., Zang, M., Lang, L. (2016). Dictionary learning for VQ feature extraction in ECG beats classification. Expert Systems with Applications, 53, 129–137. DOI 10.1016/j.eswa.2016.01.031. [Google Scholar] [CrossRef]
105. Martis, R. J., Acharya, U. R., Min, L. C. (2013). ECG beat classification using PCA, LDA, ICA and discrete wavelet transform. Biomedical Signal Processing and Control, 8(5), 437–448. DOI 10.1016/j.bspc.2013.01.005. [Google Scholar] [CrossRef]
106. Martis, R. J., Acharya, U. R., Adeli, H. (2014). Current methods in electrocardiogram characterization. Computers in Biology and Medicine, 48, 133–149. DOI 10.1016/j.compbiomed.2014.02.012. [Google Scholar] [CrossRef]
107. Liu, B., Liu, J., Wang, G., Huang, K., Li, F. et al. (2015). A novel electrocardiogram parameterization algorithm and its application in myocardial infarction detection. Computers in Biology and Medicine, 61, 178–184. DOI 10.1016/j.compbiomed.2014.08.010. [Google Scholar] [CrossRef]
108. Sharma, L. N., Dandapat, S., Mahanta, A. (2012). Multichannel ECG data compression based on multiscale principal component analysis. IEEE Transactions on Information Technology in Biomedicine, 16(4), 730–736. DOI 10.1109/TITB.2012.2195322. [Google Scholar] [CrossRef]
109. Kumar, A., Singh, M. (2016). Statistical analysis of ST segments for ischemia detection in application of deep convolutional neural network for automated detection of myocardial infarction using ECG signals electrocardiogram signals. Journal of Medical Imaging and Health Informatics, 6(2), 431–440. DOI 10.1166/jmihi.2016.1717. [Google Scholar] [CrossRef]
110. Kumar, A., Singh, M. (2016). Ischemia detection using isoelectric energy function. Computers in Biology and Medicine, 68, 76–83. DOI 10.1016/j.compbiomed.2015.11.002. [Google Scholar] [CrossRef]
111. Sadhukhan, D., Mitra, M. (2012). R-peak detection algorithm for ECG using double difference and RR interval processing. Procedia Technology, 4, 873–877. DOI 10.1016/j.protcy.2012.05.143. [Google Scholar] [CrossRef]
112. Ai, D., Duan, G., Han, X., Chen, Y. W. (2013). Generalized N-dimensional independent component analysis and its application to multiple feature selection and fusion for image classification. Neurocomputing, 103, 186–197. DOI 10.1016/j.neucom.2012.09.020. [Google Scholar] [CrossRef]
113. Cortes, C., Vapnik, V. (1995). Support-vector networks machine learning, vol. 20, pp. 237–297. Boston, MA: Kluwer Academic Publisher. [Google Scholar]
114. Sánchez, A. V. D. (2003). Advanced support vector machines and kernel methods. Neurocomputing, 55(1–2), 5–20. DOI 10.1016/S0925-2312(03)00373-4. [Google Scholar] [CrossRef]
115. Vapnik, V. (2013). The nature of statistical learning theory. Heidelberg, Germany: Springer Science & Business Media. [Google Scholar]
116. Zeng, W. (2015). Support vector machines application research in pattern classification. TELKOMNIKA Indonesian Journal of Electrical Engineering, 13(1). [Google Scholar]
117. Suykens, J. A., Vandewalle, J. (1999). Least squares support vector machine classifiers. Neural Processing Letters, 9(3), 293–300. DOI 10.1023/A:1018628609742. [Google Scholar] [CrossRef]
118. Amari, S. I., Wu, S. (1999). Improving support vector machine classifiers by modifying kernel functions. Neural Networks, 12(6), 783–789. DOI 10.1016/S0893-6080(99)00032-5. [Google Scholar] [CrossRef]
119. Hofmann, M. (2006). Support vector machines-kernels and the kernel trick. Notes, 26(3), 1–16. [Google Scholar]
120. Pan, W. T., Peng, Z. Q., Bo, C. L. (2014). Applying SVM for foot pressure pattern classification. TELKOMNIKA Indonesian Journal of Electrical Engineering, 12(4), 2753–2761. DOI 10.11591/telkomnika.v12i4.4277. [Google Scholar] [CrossRef]
121. Vedaldi, A., Gulshan, V., Varma, M., Zisserman, A. (2009). Multiple kernels for object detection. 2009 IEEE 12th International Conference on Computer Vision, pp. 606–613. Kyoto, Japan, IEEE. [Google Scholar]
122. Han, C., Shi, L. (2019). Automated interpretable detection of myocardial infarction fusing energy entropy and morphological features. Computer Methods and Programs in Biomedicine, 175, 9–23. DOI 10.1016/j.cmpb.2019.03.012. [Google Scholar] [CrossRef]
123. Park, J., Pedrycz, W., Jeon, M. (2012). Ischemia episode detection in ECG using kernel density estimation, support vector machine and feature selection. Biomedical Engineering Online, 11(1), 30. DOI 10.1186/1475-925X-11-30. [Google Scholar] [CrossRef]
124. de Lannoy, G., François, D., Delbeke, J., Verleysen, M. (2012). Weighted conditional random fields for supervised interpatient heartbeat classification. IEEE Transactions on Biomedical Engineering, 59(1), 241–247. DOI 10.1109/TBME.2011.2171037. [Google Scholar] [CrossRef]
125. Sharma, L. D., Sunkaria, R. K. (2018). Inferior myocardial infarction detection using stationary wavelet transform and machine learning approach. Signal, Image and Video Processing, 12(2), 199–206. DOI 10.1007/s11760-017-1146-z. [Google Scholar] [CrossRef]
126. He, R., Wang, K., Li, Q., Yuan, Y., Zhao, N. et al. (2017). A novel method for the detection of R-peaks in ECG based on K-nearest neighbors and particle swarm optimization. EURASIP Journal on Advances in Signal Processing, 2017(1), 1–14. DOI 10.1186/s13634-017-0519-3. [Google Scholar] [CrossRef]
127. Saini, I., Singh, D., Khosla, A. (2013). QRS detection using K-nearest neighbor algorithm (KNN) and evaluation on standard ECG databases. Journal of Advanced Research, 4(4), 331–344. DOI 10.1016/j.jare.2012.05.007. [Google Scholar] [CrossRef]
128. Karimifard, S., Ahmadian, A., Khoshnevisan, M., Nambakhsh, M. S. (2006). Morphological heart arrhythmia detection using hermitian basis functions and kNN classifier. 2006 International Conference of the IEEE Engineering in Medicine and Biology Society, pp. 1367–1370. New York, NY, USA: IEEE. [Google Scholar]
129. Thirumuruganathan, S. (2010). A detailed introduction to K-nearest neighbor (KNN) algorithm. Retrieved March, 20, 2012. [Google Scholar]
130. Liao, Y., Vemuri, V. R. (2002). Use of k-nearest neighbor classifier for intrusion detection. Computers & Security, 21(5), 439–448. DOI 10.1016/S0167-4048(02)00514-X. [Google Scholar] [CrossRef]
131. Acharya, U. R., Fujita, H., Sudarshan, V. K., Sree, V. S., Eugene, L. W. J. et al. (2015). An integrated index for detection of sudden cardiac death using discrete wavelet transform and nonlinear features. Knowledge-Based Systems, 83, 149–158. DOI 10.1016/j.knosys.2015.03.015. [Google Scholar] [CrossRef]
132. Li, Y., Cui, W. (2019). Identifying the mislabeled training samples of ECG signals using machine learning. Biomedical Signal Processing and Control, 47, 168–176. DOI 10.1016/j.bspc.2018.08.026. [Google Scholar] [CrossRef]
133. Don, S., Chung, D., Min, D., Choi, E. (2013). Analysis of electrocardiogram signals of arrhythmia and ischemia using fractal and statistical features. Journal of Mechanics in Medicine and Biology, 13(1), 1350008. DOI 10.1142/S0219519413500085. [Google Scholar] [CrossRef]
134. Damodara, V. D., Alphones, A., Chen, D. H., Lou, H. H., Martin, C. et al. (2020). Flare performance modeling and set point determination using artificial neural networks. International Journal of Energy and Environmental Engineering, 11(1), 91–109. DOI 10.1007/s40095-019-00314-3. [Google Scholar] [CrossRef]
135. Papaloukas, C., Fotiadis, D. I., Likas, A., Michalis, L. K. (2002). An expert system for ischemia detection based on parametric modeling and artificial neural networks. Proceedings of the European Medical and Biological English Conference, pp. 742–743. [Google Scholar]
136. Nayak, S., Kumar, N., Choudhury, B. B. (2017). Scaled conjugate gradient backpropagation algorithm for selection of industrial robots. International Journal of Computer Application, 7(6),2250–1797. DOI 10.26808/rs.ca.i7v6.12. [Google Scholar] [CrossRef]
137. Jothiramalingam, R., Jude, A., Patan, R., Ramachandran, M., Duraisamy, J. H. et al. (2020). Machine learning-based left ventricular hypertrophy detection using multi-lead ECG signal. Neural Computing and Applications, 33, 1–11. DOI 10.1007/s00521-020-05238-2. [Google Scholar] [CrossRef]
138. Prasad, N., Rajeshni, S., Sunil, P. L. (2013). Comparison of back propagation and resilient propagation algorithm for spam, neural computing and applications classification. 2013 Fifth International Conference on Computational Intelligence, Modelling and Simulation, vol. 33, pp. 29–34. [Google Scholar]
139. Govindarajan, P., Soundarapandian, R., Gandomi, A. H., Patan, R., Jayaraman, P. et al. (2020). Classification of stroke disease using machine learning algorithms. Neural Comput. Appl., 32(3),817–828. DOI 10.1007/s00521-019-04041-y. [Google Scholar] [CrossRef]
140. Hopkins, C. B., Suleman, J., Cook, C. (2000). An artificial neural network for the electrocardiographic diagnosis of left ventricular hypertrophy. Critical Review in Biomedical Engineering, 28(3&4), DOI 10.1615/CritRevBiomedEng.v28.i34.140. [Google Scholar] [CrossRef]
141. Liu, G., Song, M. (2009). Application of a BP network based on PCA in ECG diagnosis of the LVH. 2009 3rd International Conference on Bioinformatics and Biomedical Engineering, pp. 1–3. Beijing, China, IEEE. [Google Scholar]
142. Chaves, H. C., Valença, M. J. S., de Souza, F. M. C. (2005). A constructive neural network for detecting left ventricular hypertrophy. Fifth International Conference on Hybrid Intelligent Systems, pp. 6. Rio de Janeiro, Brazil, IEEE. [Google Scholar]
143. Ali, M. M., Jahidin, A. H., Norali, A. N. (2012). Hybrid multilayered perceptron network for classification of bundle branch blocks. 2012 International Conference on Biomedical Engineering, pp. 149–154. Penang, Malaysia, IEEE. [Google Scholar]
144. Hosseini, H. G., Luo, D., Reynolds, K. J. (2006). The comparison of different feed forward neural network architectures for ECG signal diagnosis. Medical Engineering & Physics, 28(4), 372–378. DOI 10.1016/j.medengphy.2005.06.006. [Google Scholar] [CrossRef]
145. Al Rahhal, M. M., Bazi, Y., AlHichri, H., Alajlan, N., Melgani, F. et al. (2016). Deep learning approach for active classification of electrocardiogram signals. Information Sciences, 345, 340–354. DOI 10.1016/j.ins.2016.01.082. [Google Scholar] [CrossRef]
146. Hinton, G. E., Salakhutdinov, R. R. (2006). Reducing the dimensionality of data with neural networks. Science, 313(5786), 504–507. DOI 10.1126/science.1127647. [Google Scholar] [CrossRef]
147. Hinton, G. E., Osindero, S., Teh, Y. W. (2006). A fast learning algorithm for deep belief nets. Neural Computation, 18(7), 1527–1554. DOI 10.1162/neco.2006.18.7.1527. [Google Scholar] [CrossRef]
148. Vincent, P., Larochelle, H., Bengio, Y., Manzagol, P. A. (2008). Extracting and composing robust features with denoising autoencoders. Proceedings of the 25th International Conference on Machine Learning, pp. 1096–1103. Helsinki Finland. [Google Scholar]
149. Swietojanski, P., Ghoshal, A., Renals, S. (2014). Convolutional neural networks for distant speech recognition. IEEE Signal Processing Letters, 21(9), 1120–1124. DOI 10.1109/LSP.97. [Google Scholar] [CrossRef]
150. Li, J. C., Ng, W. W., Yeung, D. S., Chan, P. P. (2014). Bi-firing deep neural networks. International Journal of Machine Learning and Cybernetics, 5(1), 73–83. DOI 10.1007/s13042-013-0198-9. [Google Scholar] [CrossRef]
151. Zhang, J., Ding, S., Zhang, N., Shi, Z. (2016). Incremental extreme learning machine based on deep feature embedded. International Journal of Machine Learning and Cybernetics, 7(1), 111–120. DOI 10.1007/s13042-015-0419-5. [Google Scholar] [CrossRef]
152. Bengio, Y., Courville, A., Vincent, P. (2013). Representation learning: A review and new perspectives. IEEE Transactions on Pattern Analysis and Machine Intelligence, 35(8), 1798–1828. DOI 10.1109/TPAMI.2013.50. [Google Scholar] [CrossRef]
153. Strodthoff, N., Wagner, P., Schaeffter, T., Samek, W. (2020). Deep learning for ECG analysis: Benchmarks and insights from PTB-xL. arXiv preprint arXiv:2004.13701. [Google Scholar]
154. Shi, H., Qin, C., Xiao, D., Zhao, L., Liu, C. (2020). Automated heartbeat classification based on deep neural network with multiple input layers. Knowledge-Based Systems, 188, 105036. DOI 10.1016/j.knosys.2019.105036. [Google Scholar] [CrossRef]
155. Hochreiter, S., Schmidhuber, J. (1997). Long short-term memory. Neural Computation, 9(8), 1735–1780. DOI 10.1162/neco.1997.9.8.1735. [Google Scholar] [CrossRef]
156. Andersen, R. S., Peimankar, A., Puthusserypady, S. (2019). A deep learning approach for real-time detection of atrial fibrillation. Expert Systems with Applications, 115, 465–473. DOI 10.1016/j.eswa.2018.08.011. [Google Scholar] [CrossRef]
157. Hu, J., Zhao, W., Jia, D., Yan, C., Wang, H. et al. (2019). A novel detection method of bundle branch block from multi-lead ECG. 2019 41st Annual International Conference of the IEEE Engineering in Medicine and Biology Society, pp. 79–82, IEEE. [Google Scholar]
158. Kwon, J. M., Jeon, K. H., Kim, H. M., Kim, M. J., Lim, S. M. et al. (2020). Comparing the performance of artificial intelligence and conventional diagnosis criteria for detecting left ventricular hypertrophy using electrocardiography. EP Europace, 22(3), 412–419. DOI 10.1093/europace/euz324. [Google Scholar] [CrossRef]
159. Reasat, T., Shahnaz, C. (2017). Detection of inferior myocardial infarction using shallow convolutional neural networks. 2017 IEEE Region 10 Humanitarian Technology Conference, pp. 718–721. Dhaka, Bangladesh, IEEE. DOI 10.1109/R10-HTC.2017.8289058. [Google Scholar] [CrossRef]
160. Acharya, U. R., Fujita, H., Oh, S. L., Hagiwara, Y., Tan, J. H. et al. (2017). Application of deep convolutional neural network for automated detection of myocardial infarction using ECG signals. Information Sciences, 415, 190–198. DOI 10.1016/j.ins.2017.06.027. [Google Scholar] [CrossRef]
161. Liu, W., Huang, Q., Chang, S., Wang, H., He, J. (2018). Multiple-feature-branch convolutional neural network for myocardial infarction diagnosis using electrocardiogram. Biomedical Signal Processing and Control, 45, 22–32. DOI 10.1016/j.bspc.2018.05.013. [Google Scholar] [CrossRef]
162. Baloglu, U. B., Talo, M., Yildirim, O., San Tan, R., Acharya, U. R. (2019). Classification of myocardial infarction with multi-lead ECG signals and deep CNN. Pattern Recognition Letters, 122, 23–30. DOI 10.1016/j.patrec.2019.02.016. [Google Scholar] [CrossRef]
163. Liu, N., Wang, L., Chang, Q., Xing, Y., Zhou, X. (2018). A simple and effective method for detecting myocardial infarction based on deep convolutional neural network. Journal of Medical Imaging and Health Informatics, 8(7), 1508–1512. DOI 10.1166/jmihi.2018.2463. [Google Scholar] [CrossRef]
164. Kora, P., Kalva, S. R. (2015). Hybrid bacterial foraging and particle swarm optimization for detecting bundle branch block. SpringerPlus, 4(1), 1–19. DOI 10.1186/s40064-015-1240-z. [Google Scholar] [CrossRef]
165. Kora, P., Kumari, C. U., Meenakshi, K. (2018). Heart arrhythmia detection using wavelet coherence and firefly algorithm. International Journal of Computer Applications, 975, 8887. DOI 10.5120/ijca2018916539. [Google Scholar] [CrossRef]
166. Revathi, J., Anitha, J., Hemanth, D. J. (2020). Training feedforward neural network using genetic algorithm to diagnose left ventricular hypertrophy. Telkomnika, 18(3), 1285–1291. DOI 10.12928/telkomnika.v18i3. [Google Scholar]
167. Kora, P. (2017). ECG based myocardial infarction detection using hybrid firefly algorithm. Computer Methods and Programs in Biomedicine, 152, 141–148. DOI 10.1016/j.cmpb.2017.09.015. [Google Scholar] [CrossRef]
168. Hamidi, H., Daraei, A. (2016). Analysis and evaluation of techniques for myocardial infarction based on genetic algorithm and weight by SVM. Journal of Information Systems and Telecommunication, 4(2), 85–91. DOI 10.7508/jist.2016.02.003. [Google Scholar] [CrossRef]
169. Sharma, L. D., Sunkaria, R. K., Kumar, A. (2017). Bundle branch block detection using statistical features of qrs-complex and k-nearest neighbors. 2017 Conference on Information and Communication Technology, pp. 1–4. Gwalior, India, IEEE. DOI 10.1109/INFOCOMTECH.2017.8340585. [Google Scholar] [CrossRef]
170. Hao, C., Sivanesan, S., Majmudar, M., Rajput, K. S. (2018). Combinational feature based random forest classification for enhanced bundle branch block beat detection. 2018 IEEE EMBS International Conference on Biomedical & Health Informatics, pp. 319–322. Las Vegas, NV, USA, IEEE. DOI 10.1109/BHI.2018.8333433. [Google Scholar] [CrossRef]
171. Ceylan, R., Özbay, Y. (2011). Wavelet neural network for classification of bundle branch blocks. Proceedings of the World Congress on Engineering, vol. 2, no. 4, pp. 1–5. London, UK. [Google Scholar]
172. Vedavathi, G. R., Prasad, D. S. (2017). Robust method for the classification of the arrhythmia with DNN classifier in the diverse ECG signal. International Journal of Computer Engineering & Technology, 8(5), 107–119. [Google Scholar]
173. Li, Z., Zhou, D., Wan, L., Li, J., Mou, W. (2020). Heartbeat classification using deep residual convolutional neural network from 2-lead electrocardiogram. Journal of Electrocardiology, 58, 105–112. DOI 10.1016/j.jelectrocard.2019.11.046. [Google Scholar] [CrossRef]
174. Haroon, M. A. (2020). ECG Arrhythmia classification using deep convolution neural networks in transfer learning. Metropolia University of Applied Sciences, UAS Master of Engineering Information Technology Master’s Thesis. [Google Scholar]
175. Hu, J., Zhao, W., Jia, D., Yan, C., Wang, H. et al. (2020). Deep multi-instance networks for bundle branch block detection from multi-lead ECG. 2020 42nd Annual International Conference of the IEEE Engineering in Medicine & Biology Society, pp. 353–356. Montreal, QC, Canada, IEEE. DOI 10.1109/EMBC44109.2020.9175909. [Google Scholar] [CrossRef]
176. Han, C., Shi, L. (2020). ML–ResNet: A novel network to detect and locate myocardial infarction using 12 leads ECG. Computer Methods and Programs in Biomedicine, 185, 105138. DOI 10.1016/j.cmpb.2019.105138. [Google Scholar] [CrossRef]
177. Gopika, P., Sowmya, V., Gopalakrishnan, E. A., Soman, K. P. (2019). Performance improvement of residual skip convolutional neural network for myocardial disease classification. International Conference on Intelligent Computing and Communication Technologies, pp. 226–234, Springer, Singapore. [Google Scholar]
178. Jafarian, K., Vahdat, V., Salehi, S., Mobin, M. (2020). Automating detection and localization of myocardial infarction using shallow and end-to-end deep neural networks. Applied Soft Computing, 93, 106383. DOI 10.1016/j.asoc.2020.106383. [Google Scholar] [CrossRef]
179. López-Espejo, I. (2019). End-to-end deep residual learning with dilated convolutions for myocardial infarction detection and localization. arXiv preprint arXiv:1909.12923. [Google Scholar]
180. Alghamdi, A., Hammad, M., Ugail, H., Abdel-Raheem, A., Muhammad, K. et al. (2020). Detection of myocardial infarction based on novel deep transfer learning methods for urban healthcare in smart cities. Multimedia Tools and Applications, 79, 1–22. DOI 10.1007/s11042-020-08769-x. [Google Scholar] [CrossRef]
181. Diker, A., Cömert, Z., Avcı, E., Toğaçar, M., Ergen, B. (2019). A novel application based on spectrogram and convolutional neural network for ECG classification. 2019 1st International Informatics and Software Engineering Conference, pp. 1–6. Ankara, Turkey, IEEE. DOI 10.1007/s11042-020-08769-x. [Google Scholar] [CrossRef]
 | This work is licensed under a Creative Commons Attribution 4.0 International License, which permits unrestricted use, distribution, and reproduction in any medium, provided the original work is properly cited. |