| Computer Modeling in Engineering & Sciences |
DOI: 10.32604/cmes.2021.016772
ARTICLE
The New Neutrosophic Double and Triple Exponentially Weighted Moving Average Control Charts
1Department of Statistics and Financial Mathematics, School of Science, Nanjing University of Science and Technology, Nanjing, 210094, China
2Department of Statistics, University of Sargodha, Sargodha, 40100, Pakistan
3Department of Statistics, Faculty of Science, King Abdulaziz University, Jeddah, 21551, Saudi Arabia
4Department of Industrial Engineering, Faculty of Engineering-Rabigh, King Abdulaziz University, Jeddah, 21589, Saudi Arabia
5Goverment Ambala Muslim Graduate College, Sargodha, 40100, Pakistan
*Corresponding Author: Muhammad Aslam. Email: aslam_ravia@hotmail.com
Received: 25 March 2021; Accepted: 23 June 2021
Abstract: The concept of neutrosophic statistics is applied to propose two monitoring schemes which are an improvement of the neutrosophic exponentially weighted moving average (NEWMA) chart. In this study, two control charts are designed under the uncertain environment or neutrosophic statistical interval system, when all observations are undermined, imprecise or fuzzy. These are termed neutrosophic double and triple exponentially weighted moving average (NDEWMA and NTEWMA) control charts. For the proficiency of the proposed chart, Monte Carlo simulations are used to calculate the run-length characteristics (such as average run length (ARL), standard deviation of the run length (SDRL), percentiles (P25, P50, P75)) of the proposed charts. The structures of the proposed control charts are more effective in detecting small shifts while these are comparable with the other existing charts in detecting moderate and large shifts. The simulation study and real-life implementations of the proposed charts show that the proposed NDEWMA and NTEWMA charts perform better in monitoring the process of road traffic crashes and electric engineering data as compared to the existing control charts. Therefore, the proposed charts will be helpful in minimizing the road accident and minimizing the defective products. Furthermore, the proposed charts are more acceptable and actual to apply in uncertain environment.
Keywords: Exponentially weighted moving average (EWMA); double EWMA; triple EWMA; neutrosophic control chart; run-length
Nomenclature
| EWMA | Exponentially weighted moving average |
| NDEWMA | Neutrosophic double exponentially weighted moving average |
| NTEWMA | Neutrosophic triple exponentially weighted moving average |
| DEWMA | Double exponentially weighted moving average |
| TEWMA | Triple exponentially weighted moving average |
| CUSUM | Cumulative sum |
| SPC | Statistical process control |
| OOC | Out-of-control |
| IC | In-control |
| NARL | Neutrosophic average run length |
| NSDRL | Neutrosophic standard deviation run length |
| NP | Neutrosophic percentile |
| ARL | Average run length |
| ARL0 | IC average run length |
| ARL1 | OOC average run length |
Control charts play a vital role in monitoring processes and are used to remove assignable causes that are responsible for substandard products (or services), wastes, reworks, and high production or manufacturing costs. Shewhart [1] introduced control charting techniques in the 1920 and showed that these can be applied in different industries. Shewhart-type control charts are very famous for monitoring processes in different areas of productions due to their easy implementation and high speed in detecting large shifts. They are usually referred to as memoryless charts because they only use the current information. Since Shewhart-type charts are efficient in detecting large shifts, researchers have designed new control charting techniques to efficiently detect small-to-moderate process shifts as quickly as possible, including large shifts. These are referred to as memory-type control charts as they use the current and past information to compute the charting statistics, which makes them more sensitive in identifying small–to-moderate shifts. More specifically, Page [2] and Roberts [3] designed the cumulative sum (CUSUM) and the exponentially weighted moving average (EWMA) control charts, respectively. The properties of EWMA control chart have been studied by many researchers in the statistical process control (SPC) area. A lot of modifications to the EWMA chart have been introduced in the literature to enhance its performance in detecting small-to-moderate shifts. References [4,5] proposed the double EWMA (DEWMA) chart with asymptotic control limits. Later on, a lot of researchers worked on DEWMA control with different techniques. Shafqat et al. [6] proposed the DEWMA chart with asymptotic control limits based on linear prediction. Capizzi et al. [7] presented the adaptive EWMA control chart to detect instantaneously small-to-large magnitudes of shifts. Zhang et al. [8] studied DEWMA under time-varying control limits with different values for the smoothing parameters. More basic information about the control charts can be found in [9–12].
The traditional Shewhart control charts cannot be implemented when uncertainty is expected in the data, for more details on this, readers are referred to Aslam et al. [13] introduced the neutrosophic EWMA (NEWMA)
Recently, Alevizakos et al. [27,28] introduced a triple EWMA (TEWMA) control chart for normally and exponentially distributed data to enhance the performance of the EWMA chart with asymptotic and time-varying control limits. Letshedi et al. [29] proposed a distribution-free TEWMA control chart using Wilcoxon rank-sum statistics to improve the detection ability in the process location parameter with fast initial response features.
After exploring the literature, there is no work on the DEWMA and TEWMA control charts under neutrosophic statistics for normally distributed data (or, for any other distribution). In this study, the neutrosophic DEWMA, and TEWMA (labeled as; NDEWMA and NTEWMA) charts are proposed. In this paper, asymptotic control limits are used to examine the neutrosophic statistical performance of the NDEWMA and NTEWMA charts. The NDEWMA and NTEWMA control charts are compared with the classical and neutrosophic EWMA charts as well as the classical DEWMA and TEWMA control charts.
The rest of the manuscript is as follows: In the next Section, the design structures of the proposed control charts are discussed. In Section 3, the run-length characteristics via neutrosophic Monte Carlo simulations are theoretical and empirically provided. A comprehensive comparison of the proposed studies has been made with existing control charts in Section 3. In Section 4, two illustrative examples of the practical application of the proposed charts are given using simulation and real-life datasets. Concluding remarks are provided in Section 5.
2 The Design Structure of the Neutrosophic Control Charts Structure
In this section, the neutrosophic-based memory-type control charts (DEWMA and TEWMA) structures are presented. These are used for monitoring the process with small-to-moderate and moderate-to-large shifts under the neutrosophic environment. Neutrosophic environment is the environment when we have indeterminacy interval in the random variable.
2.1 The Design Structure of the Proposed NDEWMA Chart
Let Xi be a quality characteristic of a process whose distribution is normal with mean
In this study, we are interested in the detection of shifts in the process mean from its IC value
where
and
Therefore, the asymptotic control limits become:
where
2.2 The Design Structure of the Proposed NTEWMA Chart
The NTEWMA chart is based on current and past observations with the NEWMA smoothing procedure utilizes sampled information three times which can be mathematically defined as:
where
and
The asymptotic control limits become:
where
3 Neutrosophic Run-Length Performance of the Proposed Charts
Equations and mathematical expressions must be inserted into the main text. Two different types of styles can be used for equations and mathematical expressions. They are: in-line style, and display style.
3.1 Run-Length Distribution of the Proposed Neutrosophic Charts
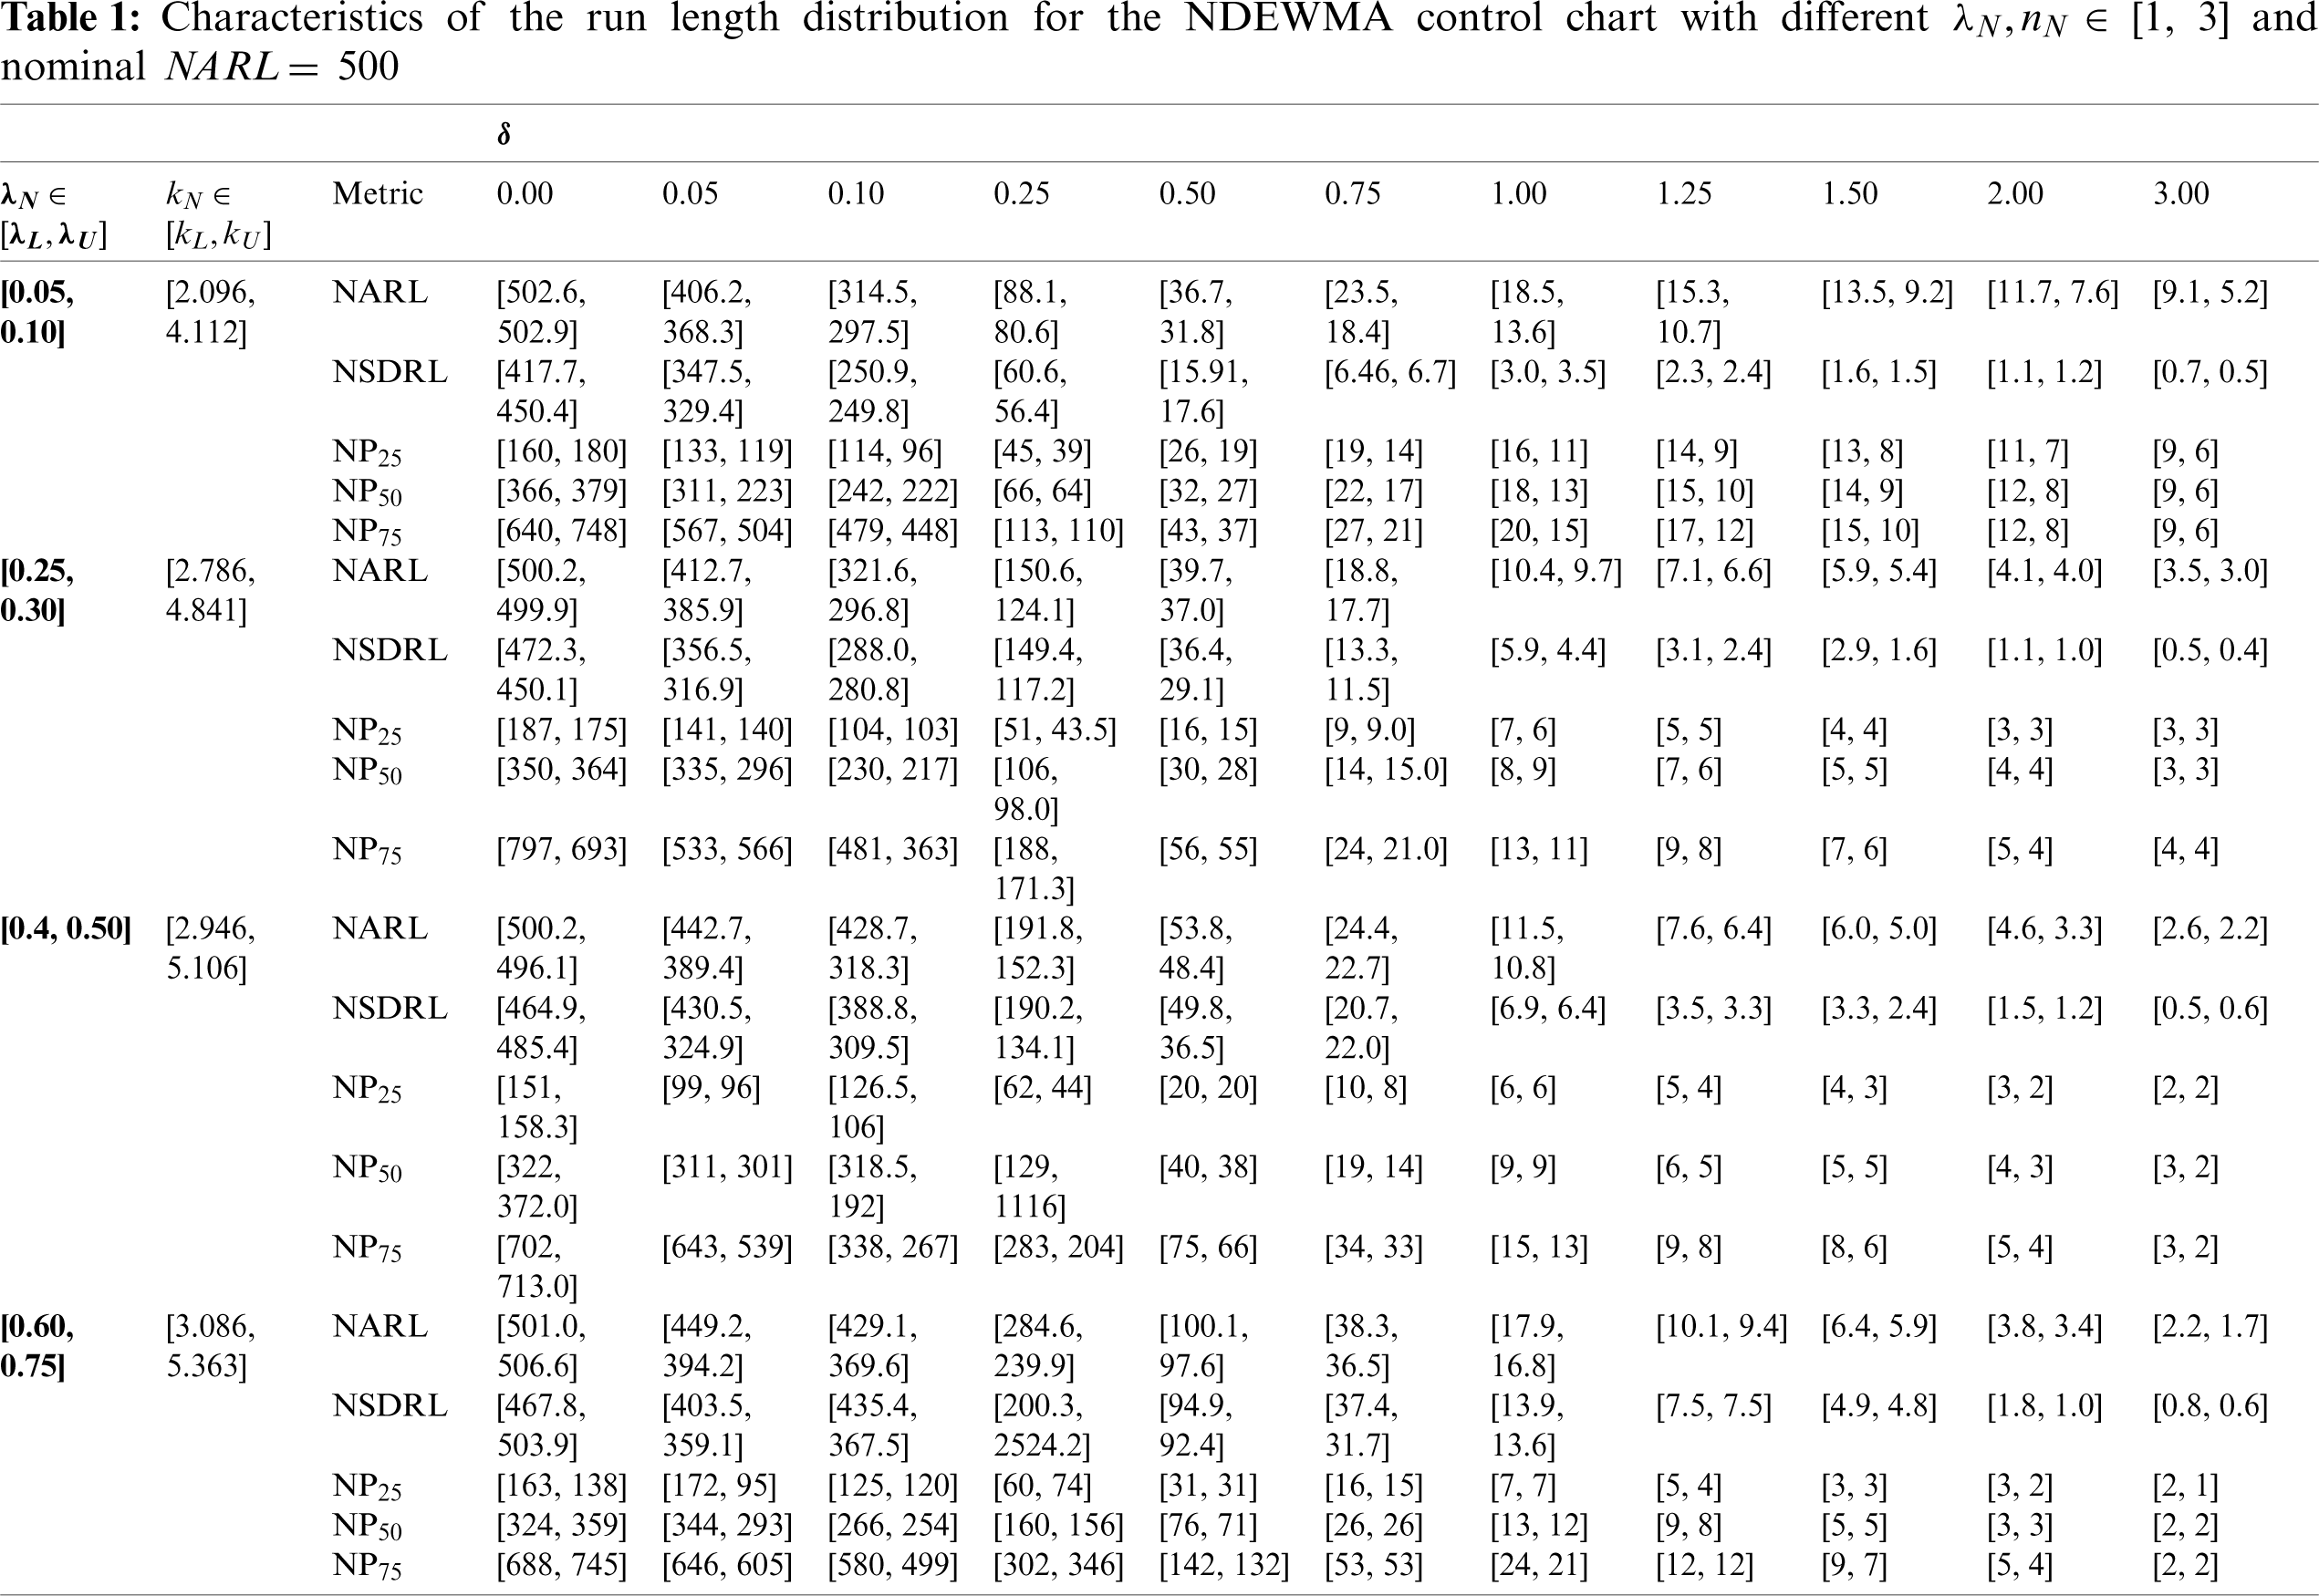
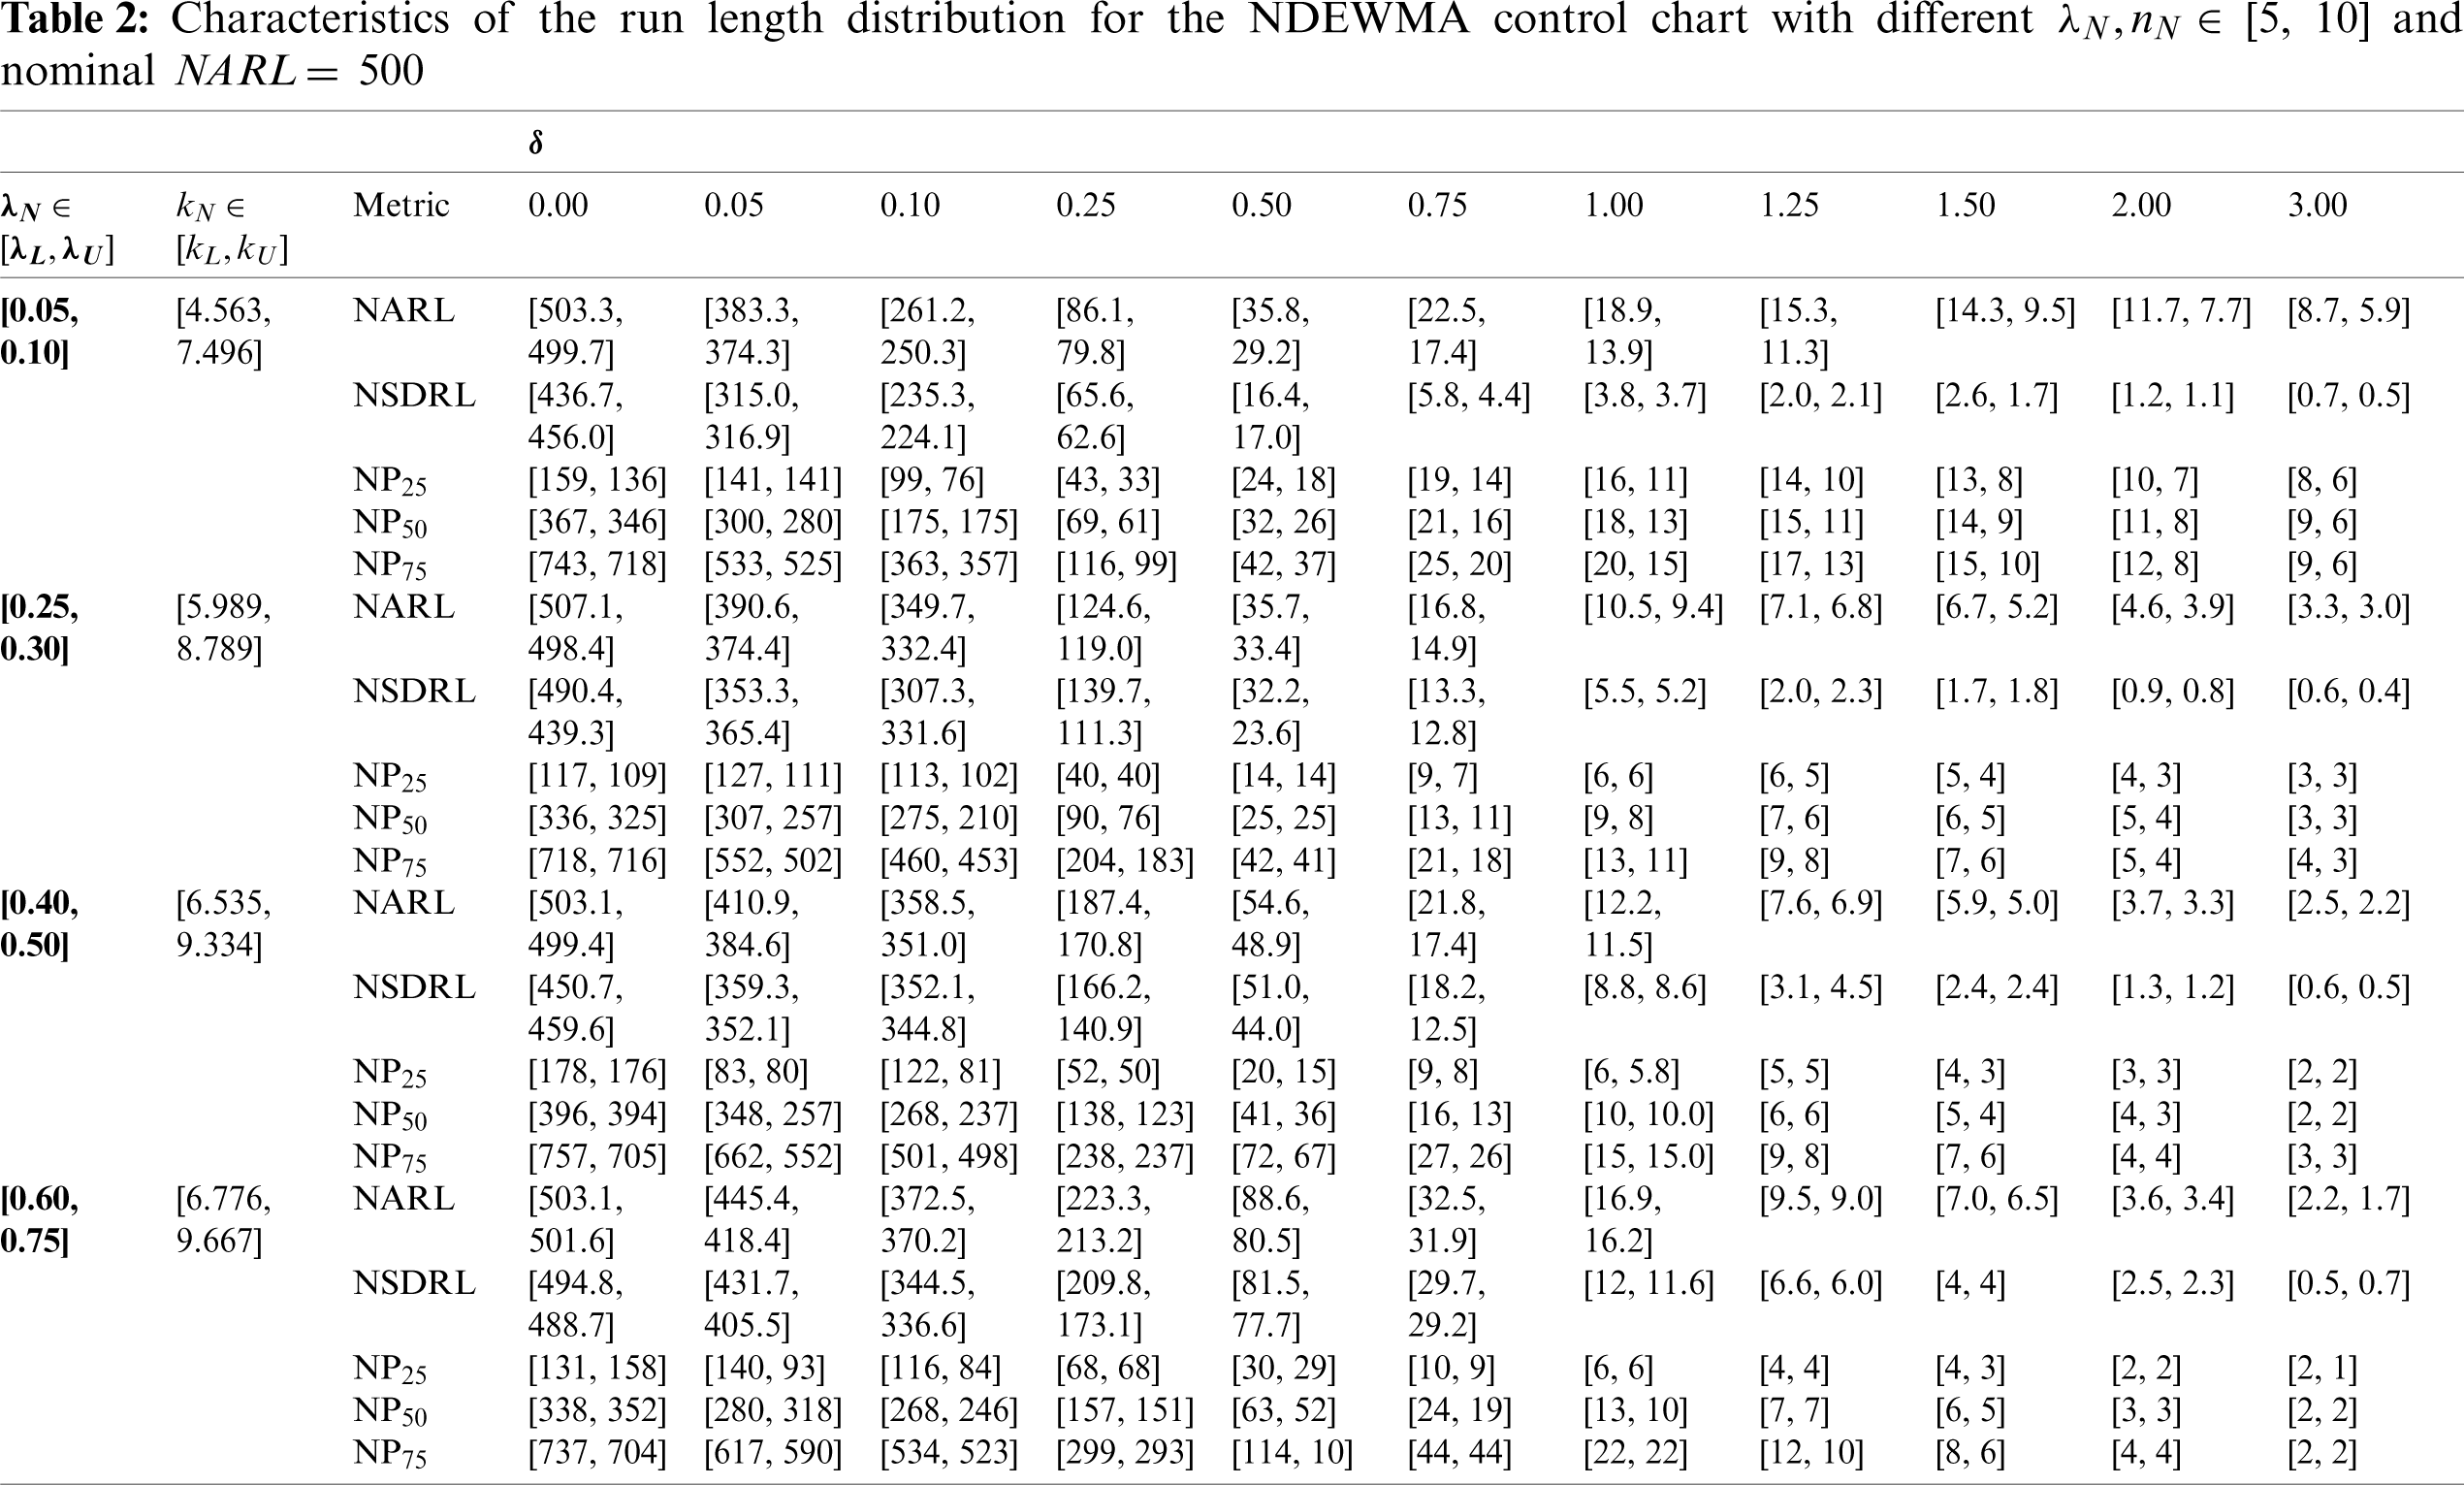
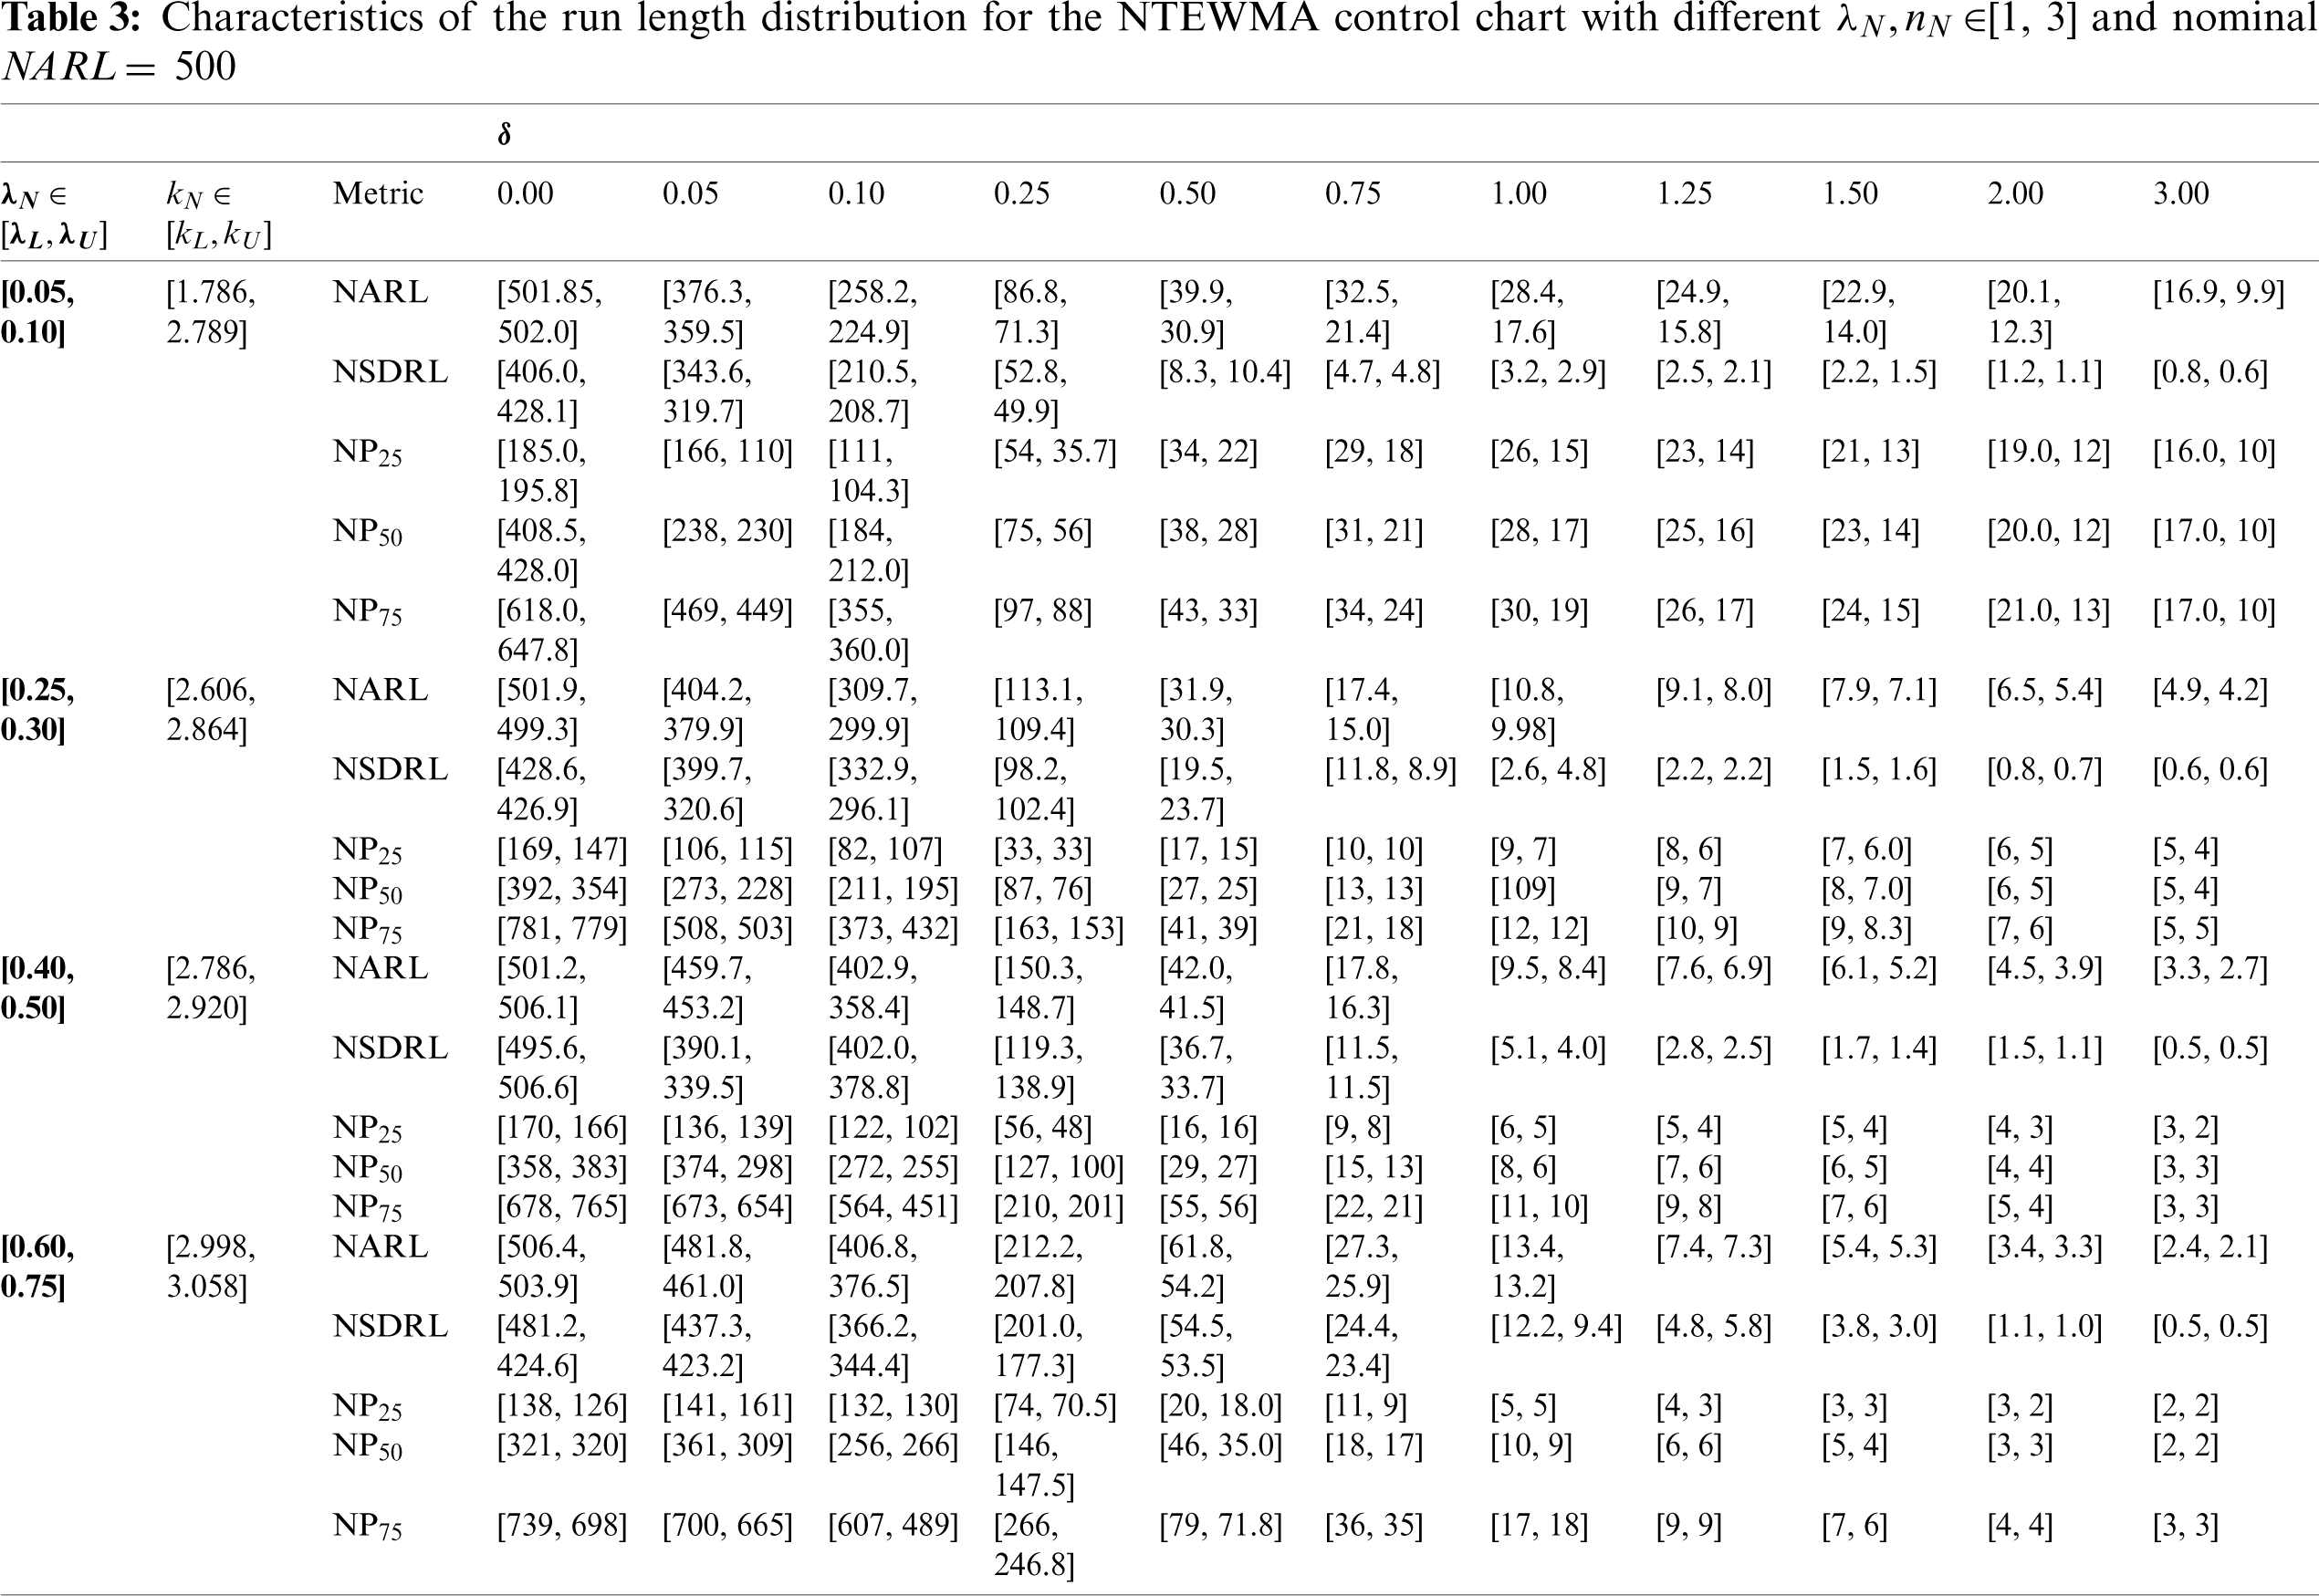
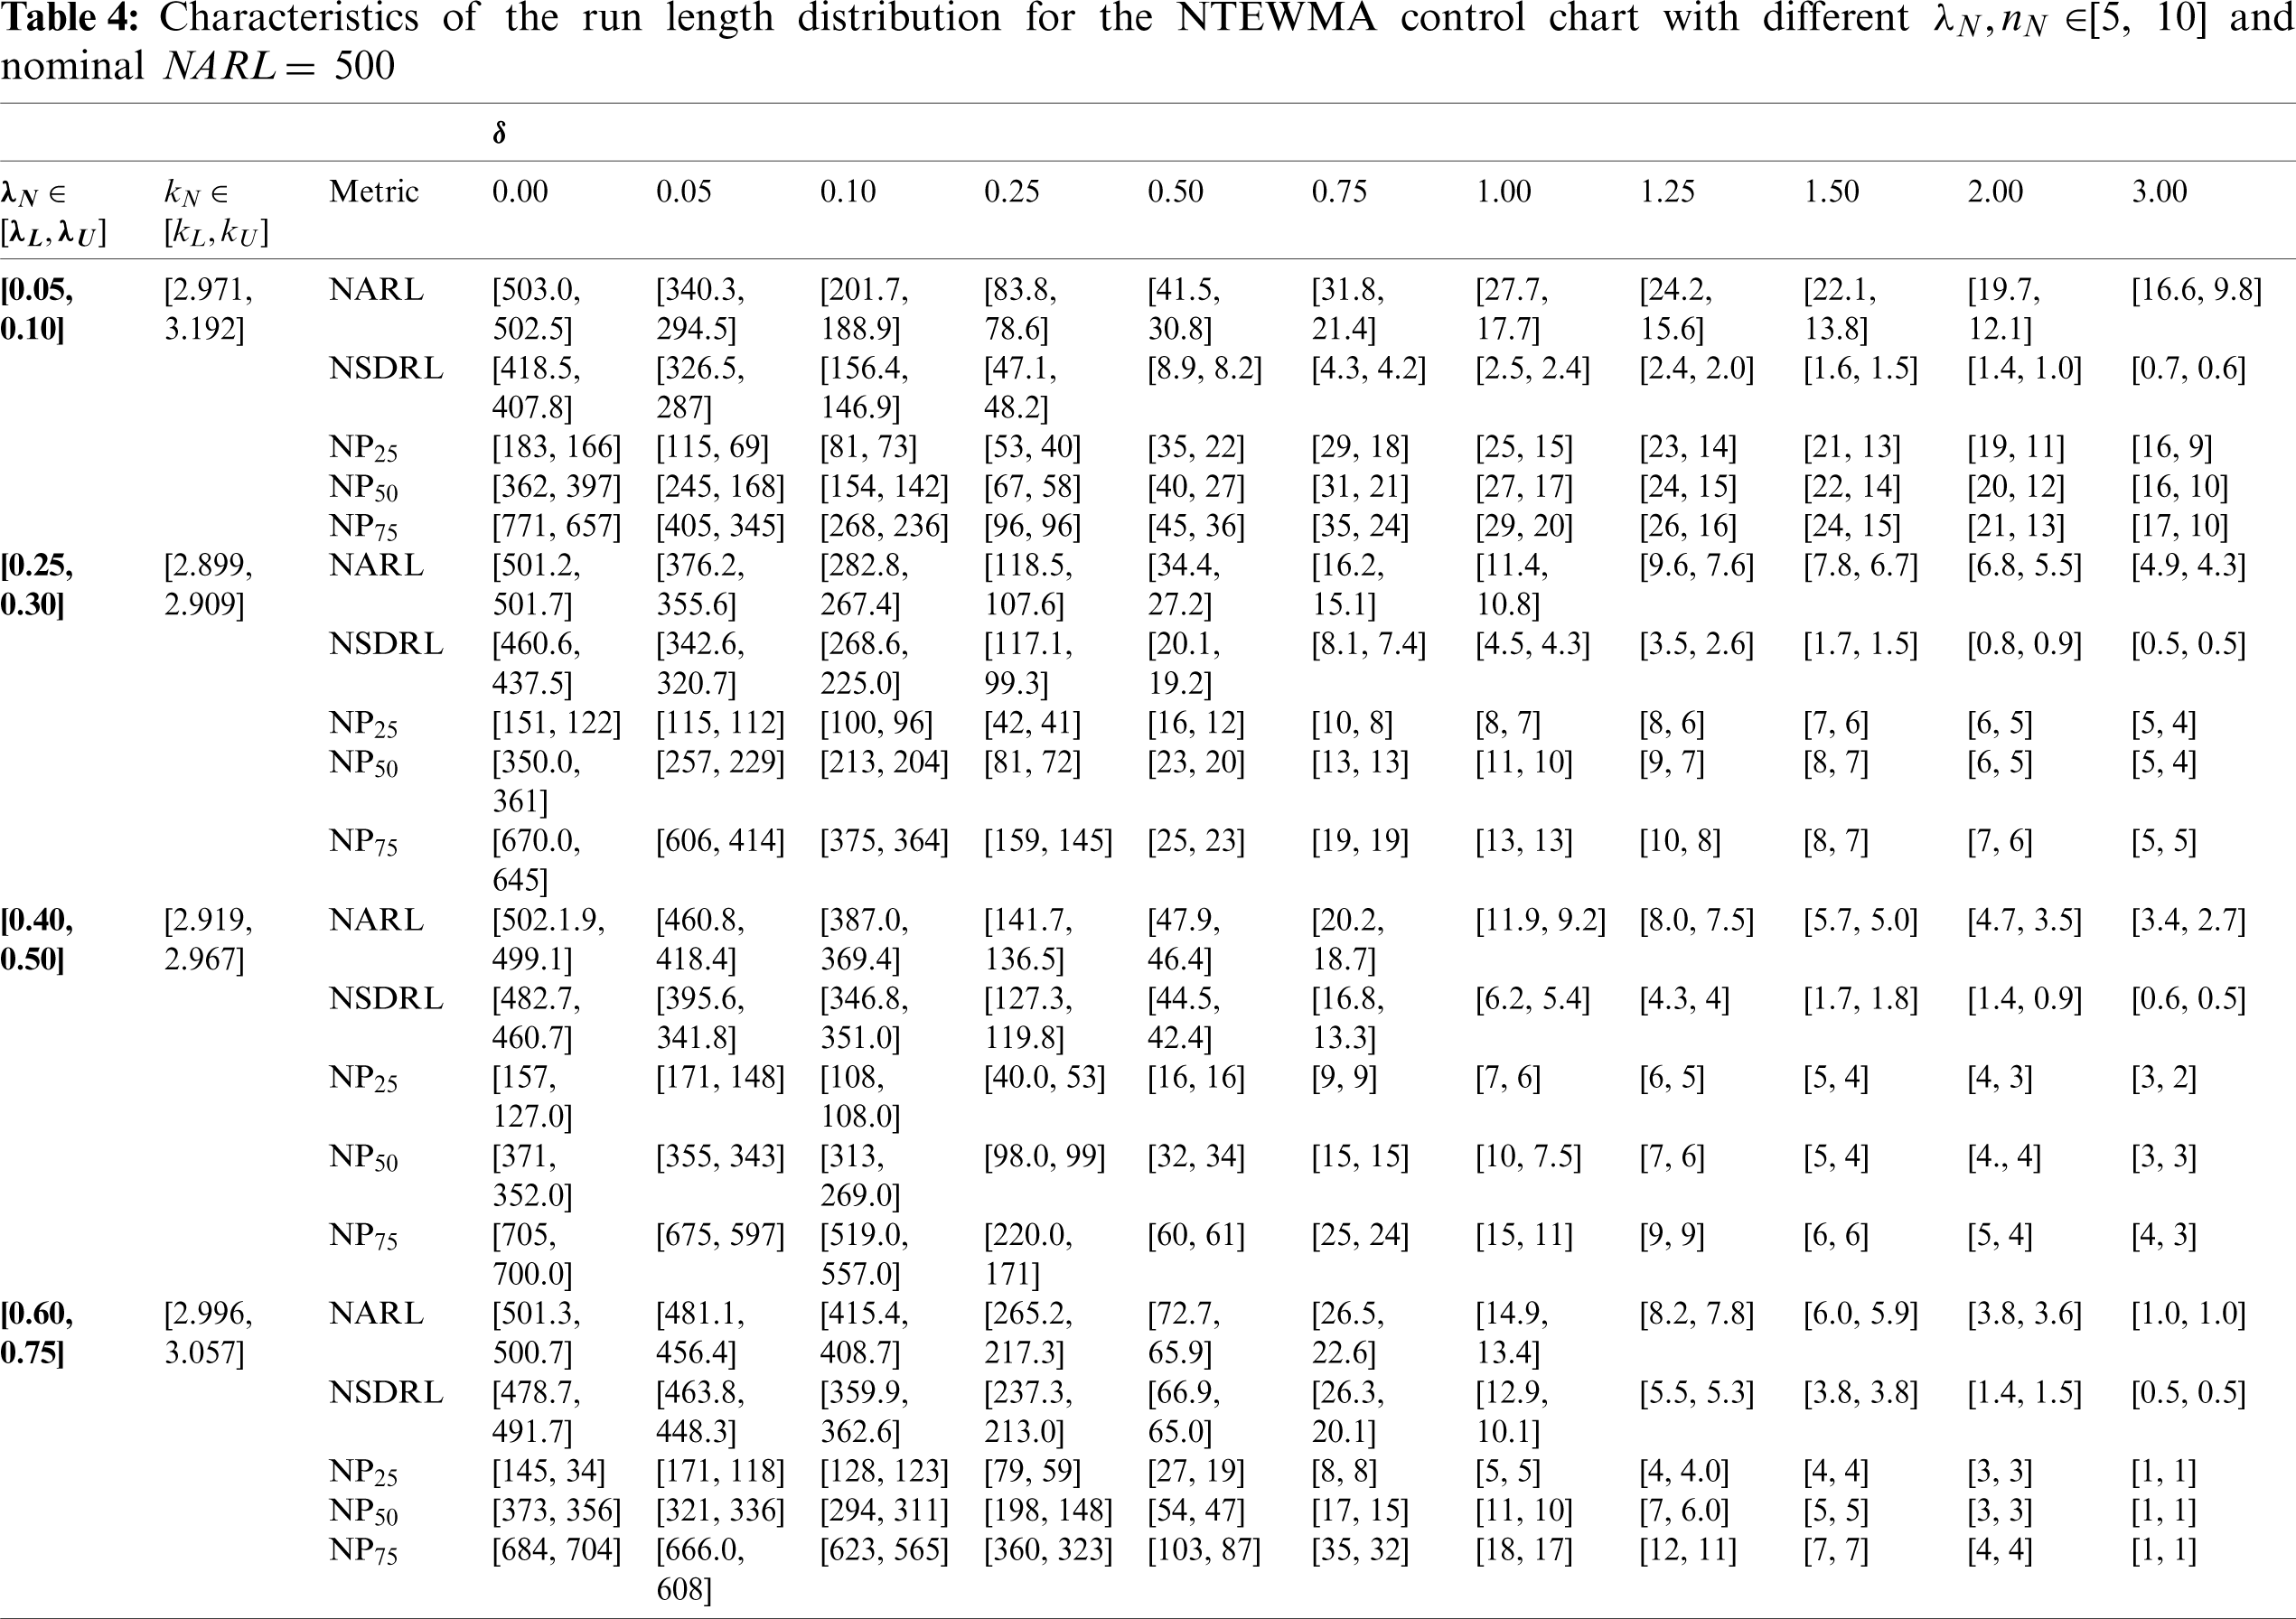
Generally, the performance of a control chart is determined using average run length (ARL) that is a characteristic of the run length use for measuring the superiority of the proposed chart. The IC process performance under ARL is denoted by ARL0 and the OOC process performance is denoted by ARL1. The comparative performance of the proposed charts is made under the neutrosophic simple random sampling scheme based on out-of-control values of run-length characteristics to detect shifts in a process. The neutrosophic run-length characteristics used in this paper are neutrosophic ARL (NARL), the neutrosophic standard deviation of the run-length (NSDRL), and neutrosophic percentile run-length (i.e., the 25
1. Specify the values of the smoothing parameter and parameters of the distribution (say,
2. Calculate the variance of plotting statistics using Eqs. (4) and (8), then calculate the control limits (
3. Calculate the plotting statistics ZNi and WNi for each random sample using Eqs. (2) and (6).
4. Compare the plotting statistics calculated in Step 3 to their respective control limits found in Step 2. Proceed until a point plots for the first time beyond the control limits and record the number of rational subgroups as one value of run length.
5. Steps 1 to 4 are repeated N times (say, N = 104) to obtain the IC run-length characteristics in each instance.
6. Calculate the neutrosophic mean, the standard deviation of the run-length (RL) and the percentiles of the RL obtained in Step 5 to get the NARL, NSDRL,
7. Next, generate random samples and use the optimal design parameters and control limits to evaluate the OOC characteristics of the run-length using Steps 3 to 6 by introducing a shift (
Note that the design parameters (
3.2 Performance Evaluation of the NDEWMA and NTEWMA Charts
The control chart is the fundamental method of the SPC for checking the technical analysis of any industrial process monitoring. The performance of the control chart is evaluated using the run-length distribution, which is the most famous method used to check the control chart’s ability to identify the exact value of the run-length characteristics at each
3.3 Comparison of the Proposed Control Charts with the Existing Control Charts
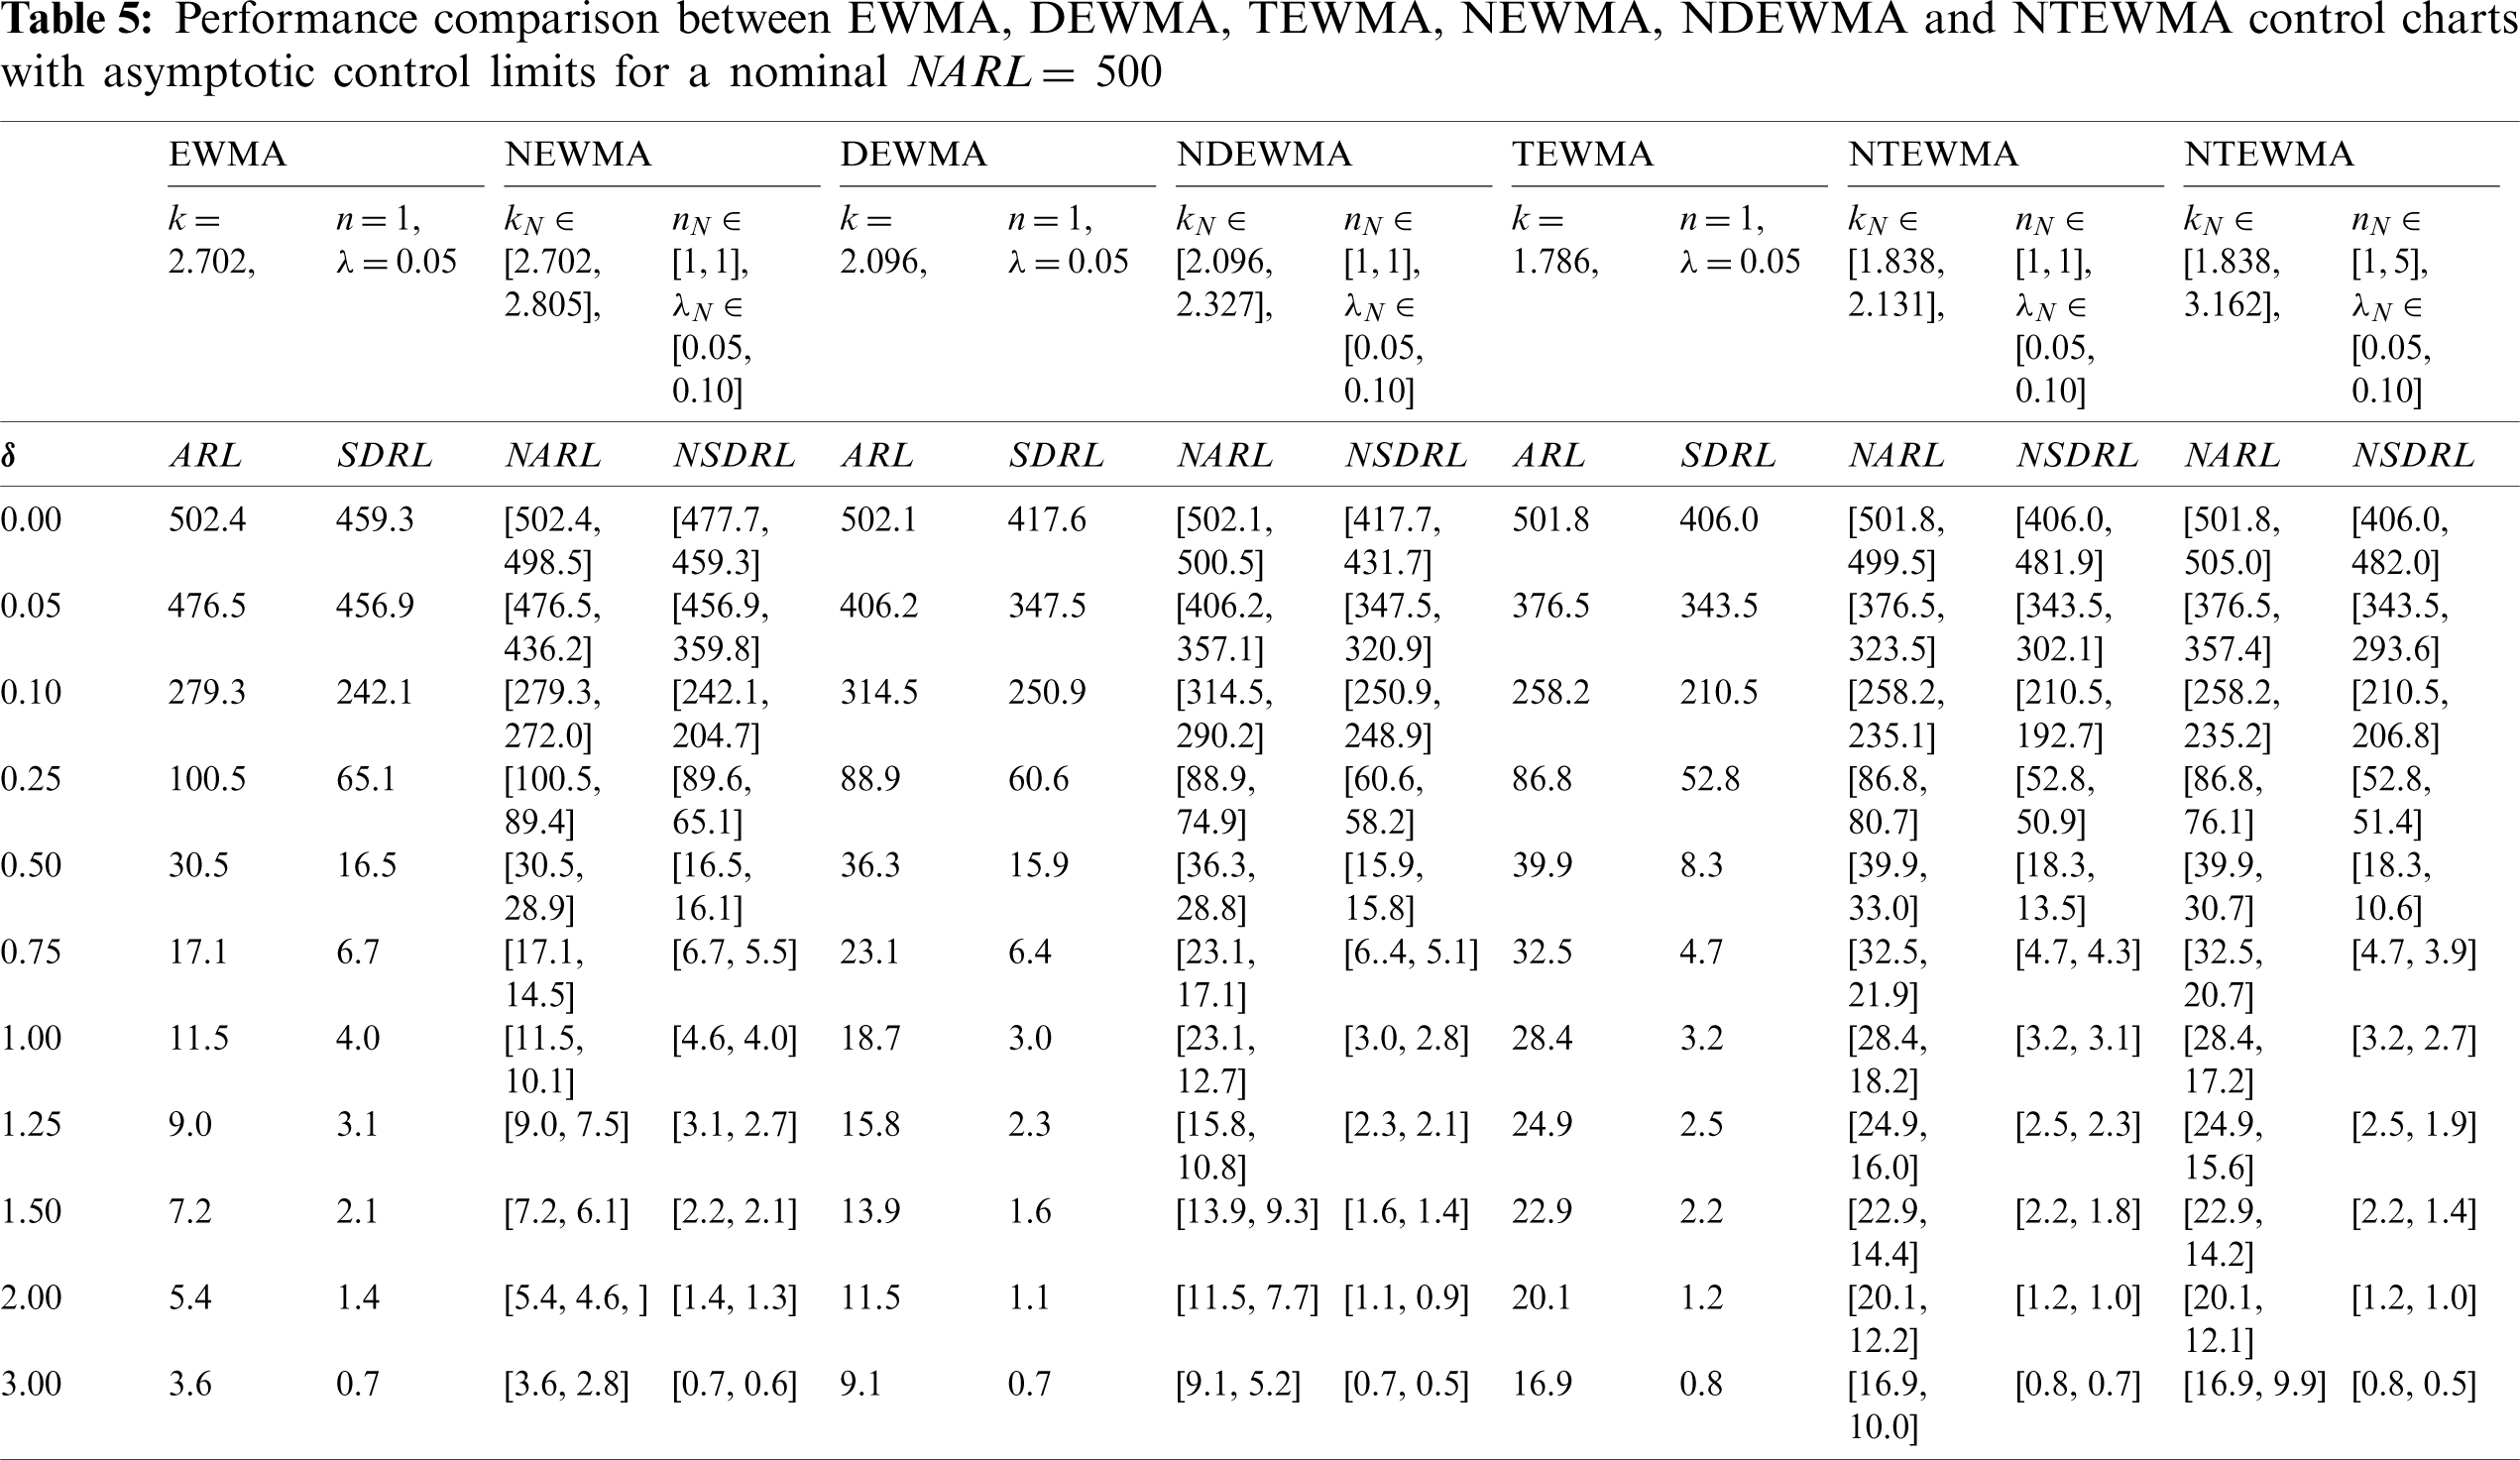
In this section, the comparisons between the two proposed control charts (i.e., NDEWMA and NTEWMA) and the existing NEWMA chart (presented by Aslam et al. [30]) are presented. In addition, the traditional EWMA, DEWMA and TEWMA control charts under classical statistics are also compared with their neutrosophic counterparts. In classical statistics, it is known that a control chart having smaller determined run-length values is said to be efficient in detecting the shift in the process. In neutrosophic theory, a method is said to be efficient if it provides the parameter in the indeterminacy interval rather than the determined values in uncertainty. A chart under the neutrosophic statistics is said to be more efficient if it has smaller values of neutrosophic run-length values than the competing charts. The comparison of the abovementioned control charts are presented in Tab. 5 when n = 1, with
3.3.1 Comparison Performance between NTEWMA and DEWMA Control Charts
In this section, we show the comparison between the implementation of the NTEWMA control chart over the proposed NDEWMA control chart. For the neutrosophic value of
3.3.2 Comparison Performance between NTEWMA, NDEWMA and NEWMA Control Charts
The proposed NTEWMA and NDEWMA control charts seem to have the better performance for small to moderate shifts; however, the existing NEWMA chart (by Aslam et al. [13]) has the better large shift performance, see Tab. 5. From Tab. 5, when
Perform better than the NEWMA chart for small to moderate shifts. Note though, the NEWMA chart has the best performance for large shifts as compared to the NDEWMA and NTEWMA charts.
3.3.3 Comparison Performance between Neutrosophic Charts and Classical Control Charts
It is observed from Tab. 5 that the NEWMA, NDEWMA and NTEWMA charts under neutrosophic statistics have smaller NARL values as compared to the existing EWMA, DEWMA and TEWMA charts under classical statistics, respectively. For example, when
For the simulated data, we suppose that
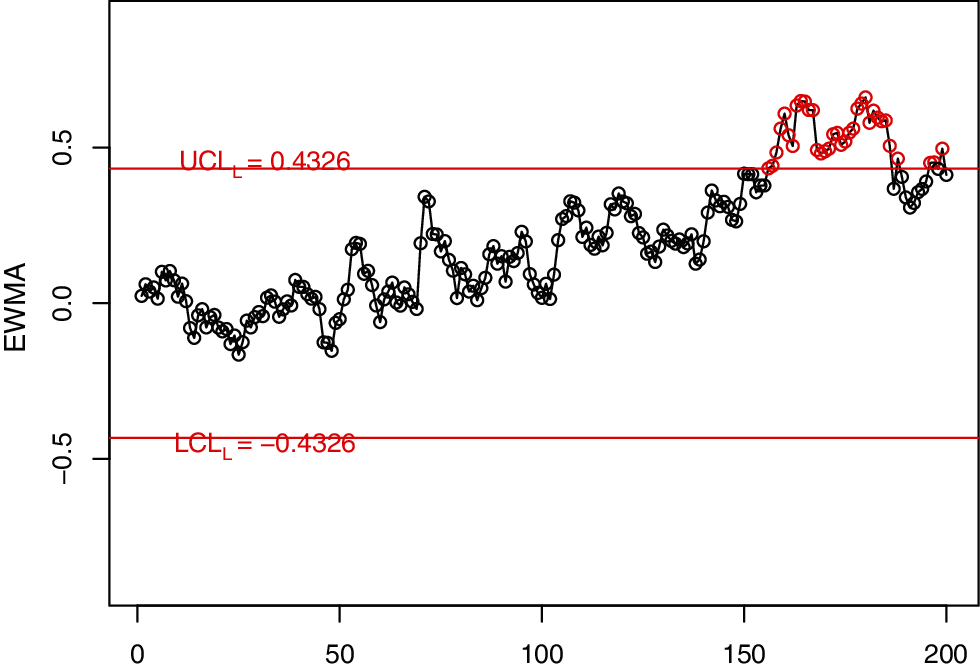
Figure 1: The EWMA control charts for simulated data
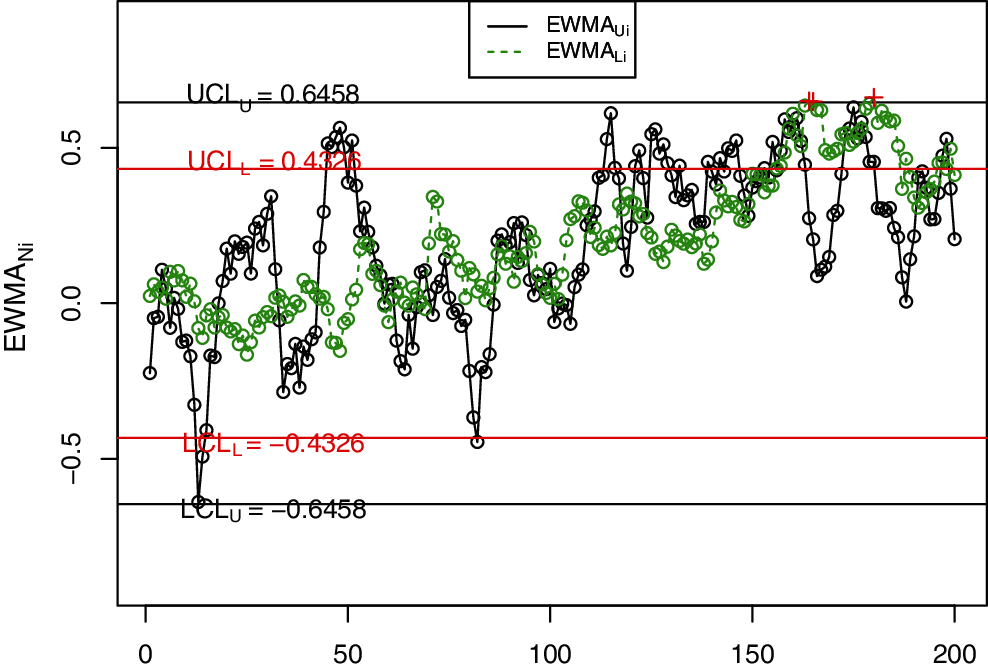
Figure 2: The NEWMA control charts for simulated data
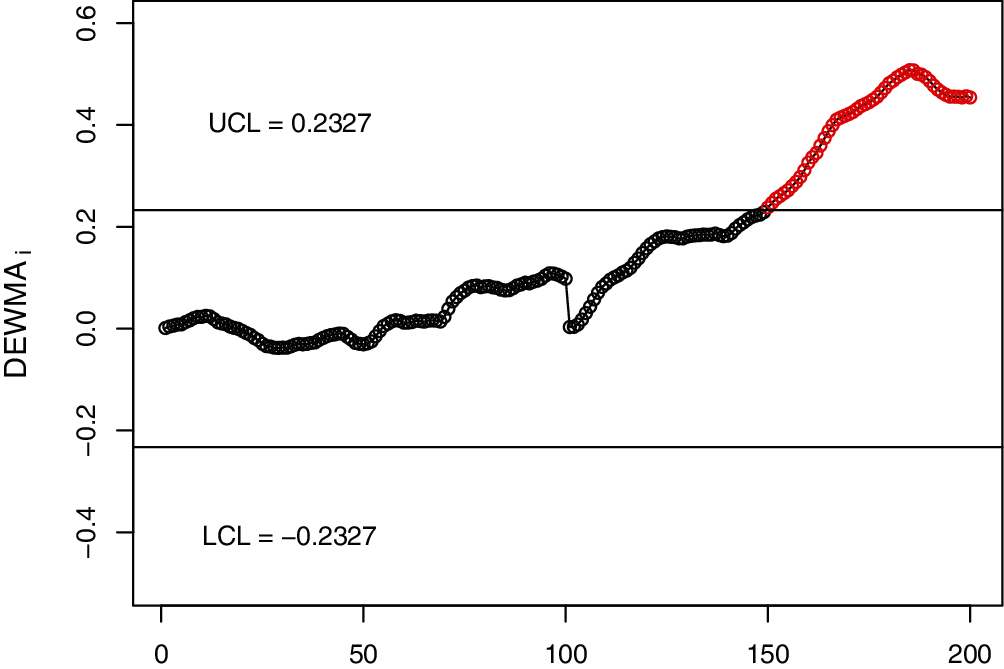
Figure 3: The DEWMA control charts for simulated data
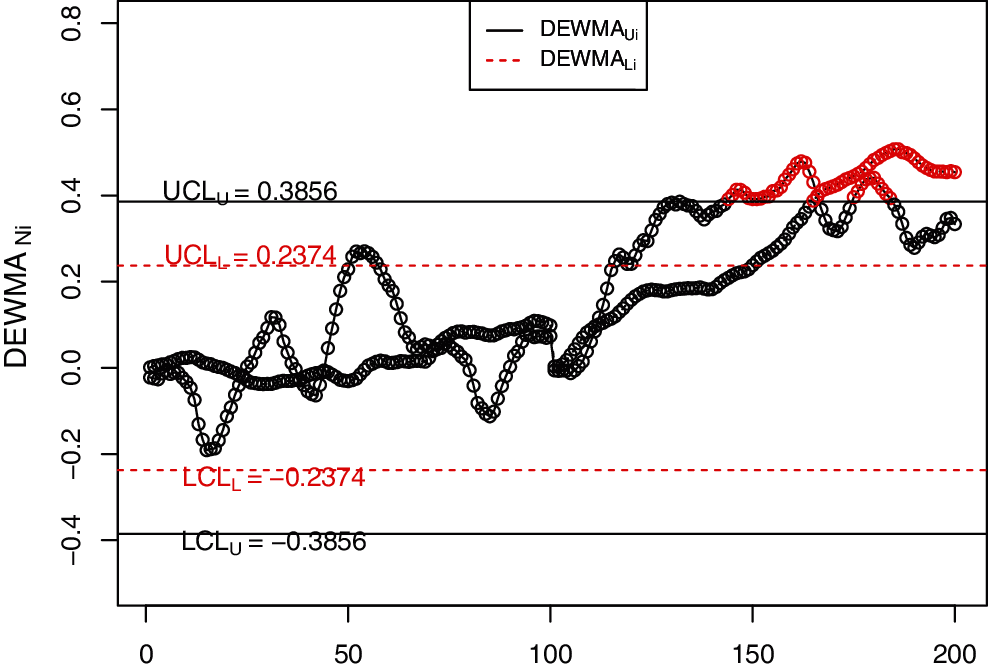
Figure 4: The NDEWMA control charts for simulated data
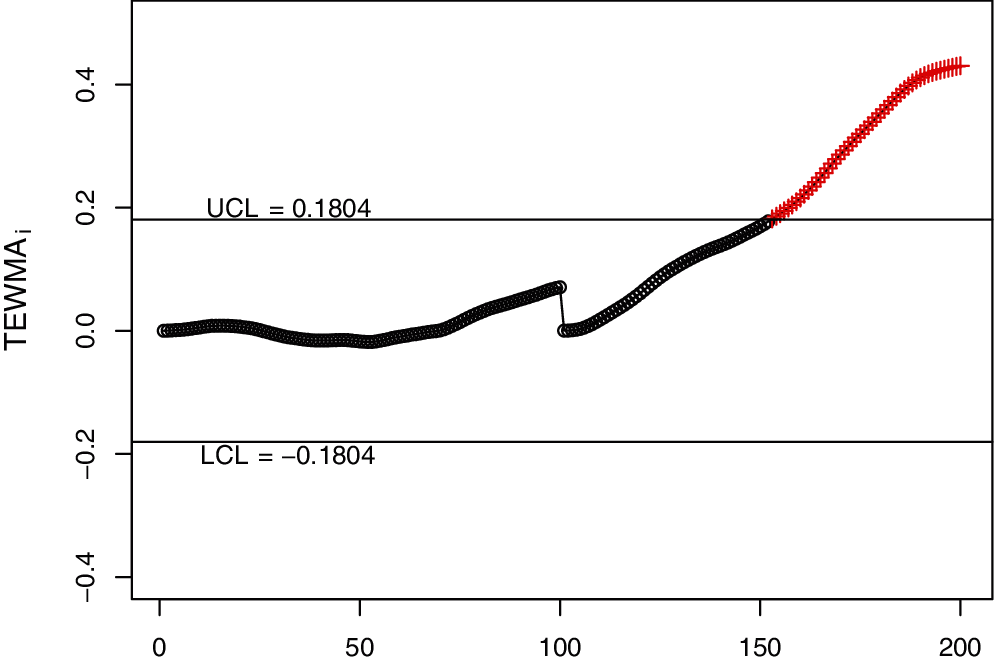
Figure 5: The TEWMA control charts for simulated data
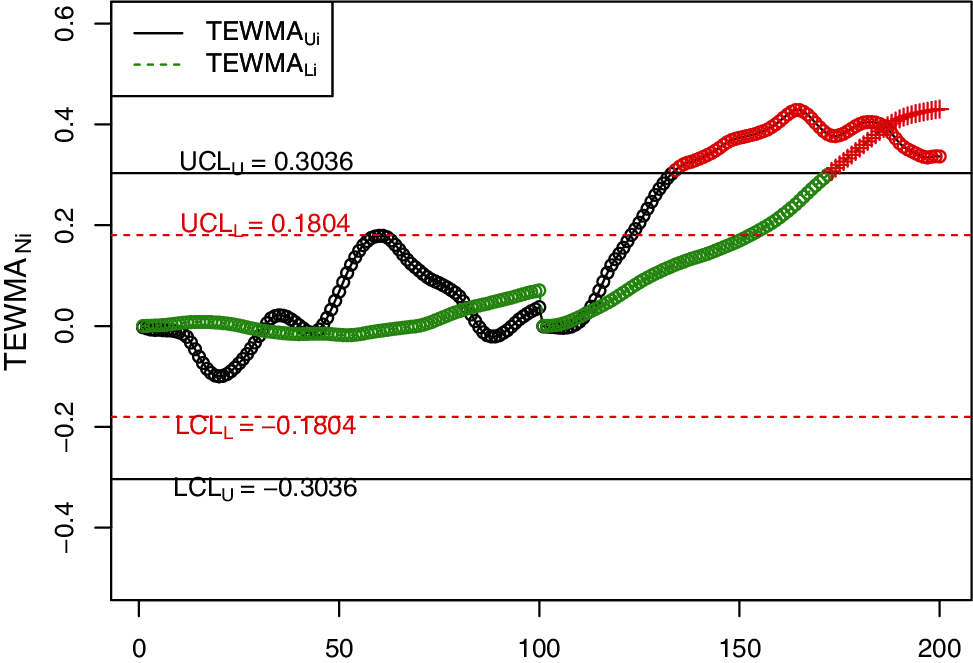
Figure 6: The proposed NTEWMA control charts for simulated data
In order to visually display the implementation of the NDEWMA and NTEWMA charts against the existing EWMA, DEWMA and TEWMA charts, Figs. 1–6 is constructed. The proposed NTEWMA chart detects the shift after the 130
In this section, we use a real-life application discussed by Faisal et al. [31] to illustrate the application of the NDEWMA and NTEWMA charts. The dataset (i.e., The real life application example results dataset can be obtained from authors on request) is based on the voltage on the fixed capacitance level and contains 200 observations. The first 100 observations are obtained by applying a capacitance (C) of
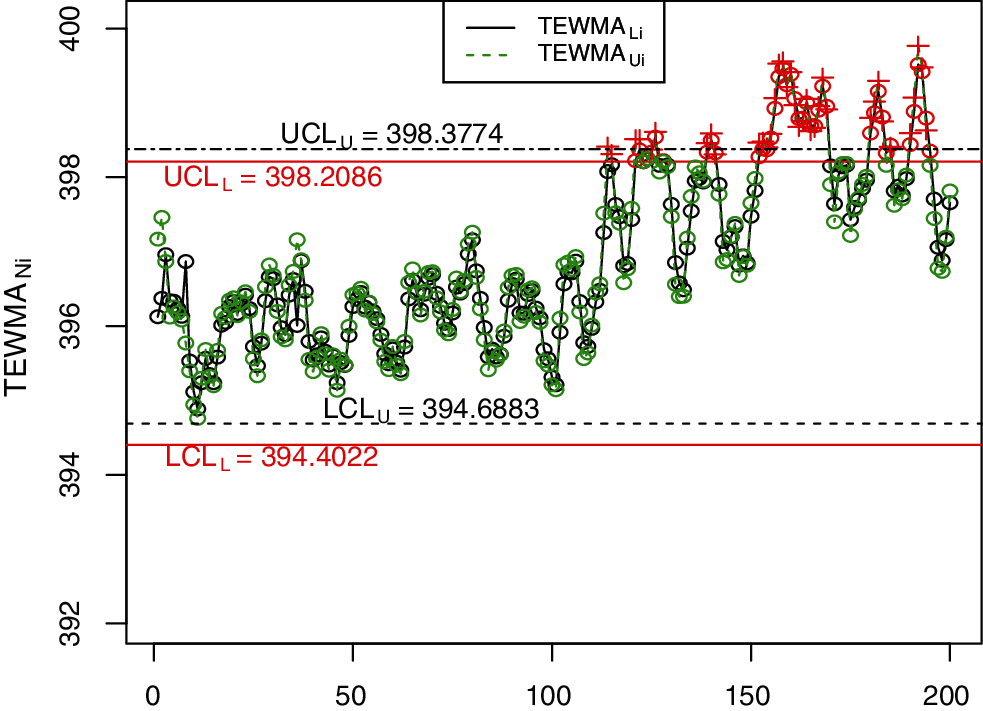
Figure 7: The proposed NTEWMA control chart for real life data
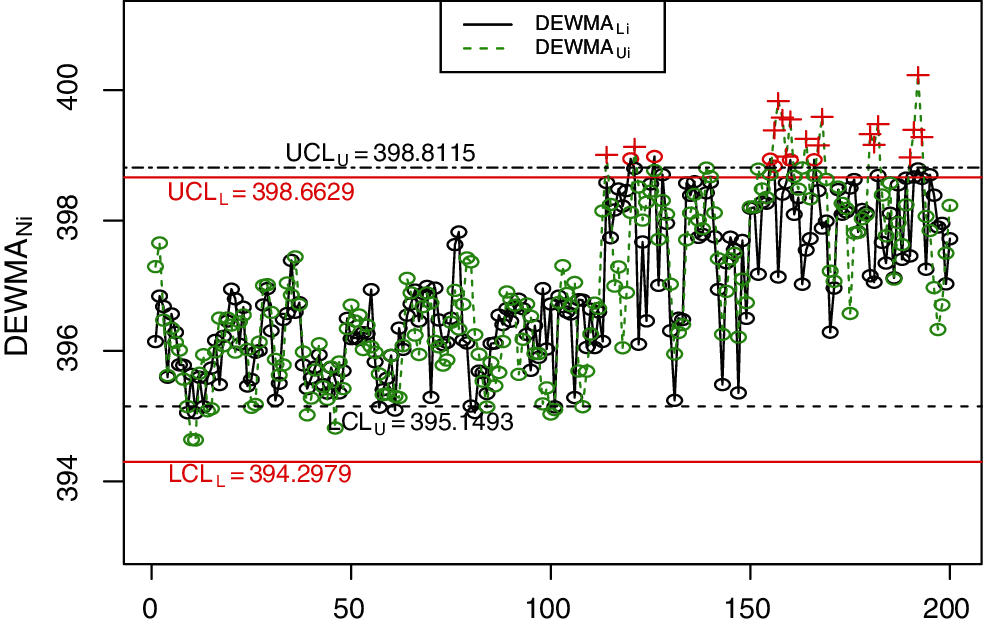
Figure 8: The proposed NDEWMA control chart for real-life data
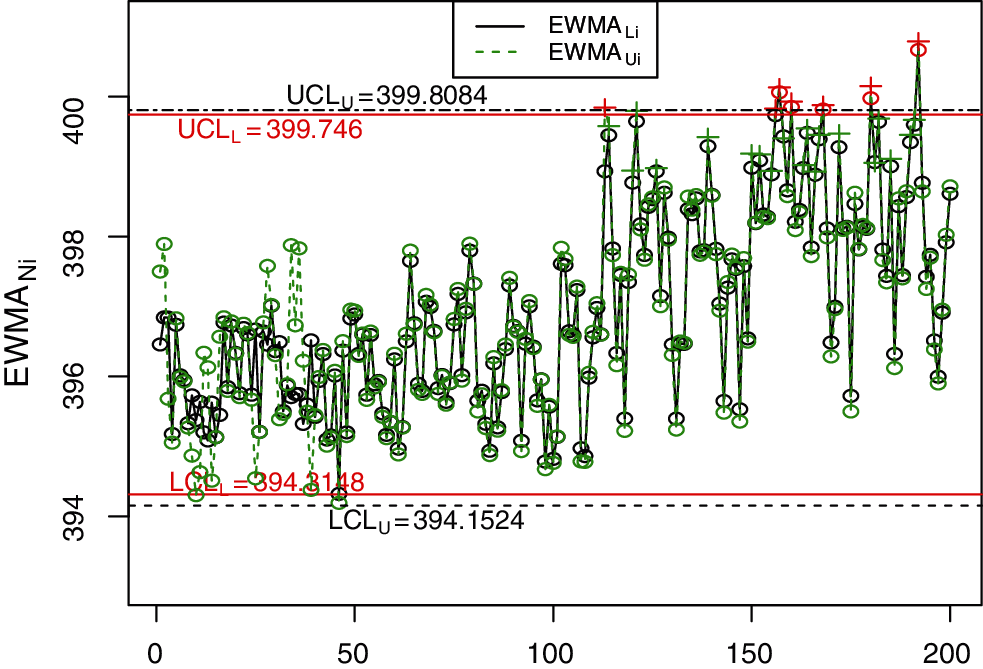
Figure 9: The NEWMA control chart for real-life data
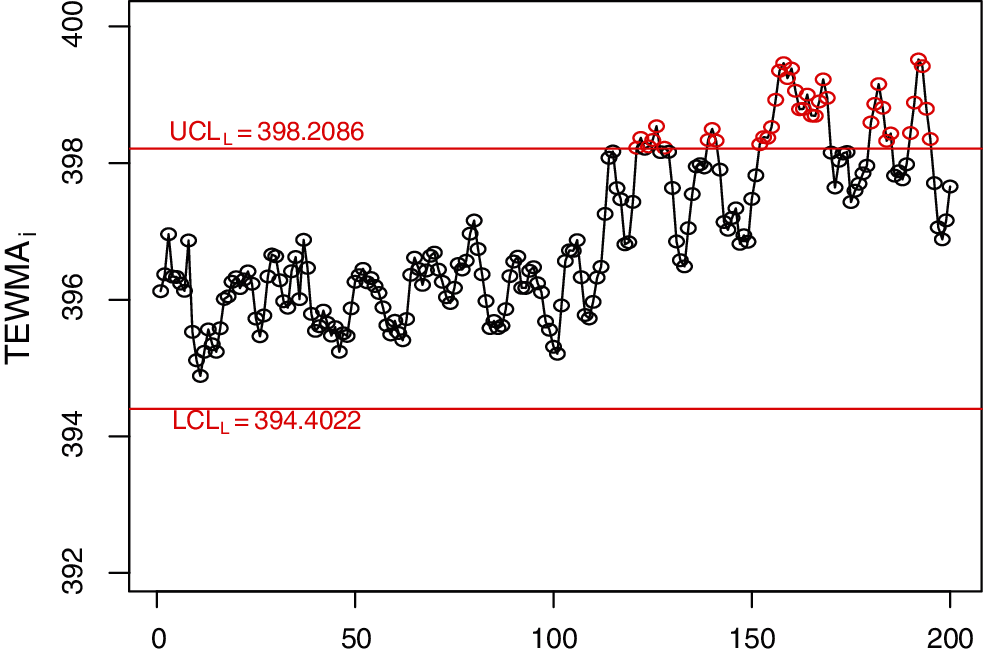
Figure 10: The classical TEWMA control chart for real-life data
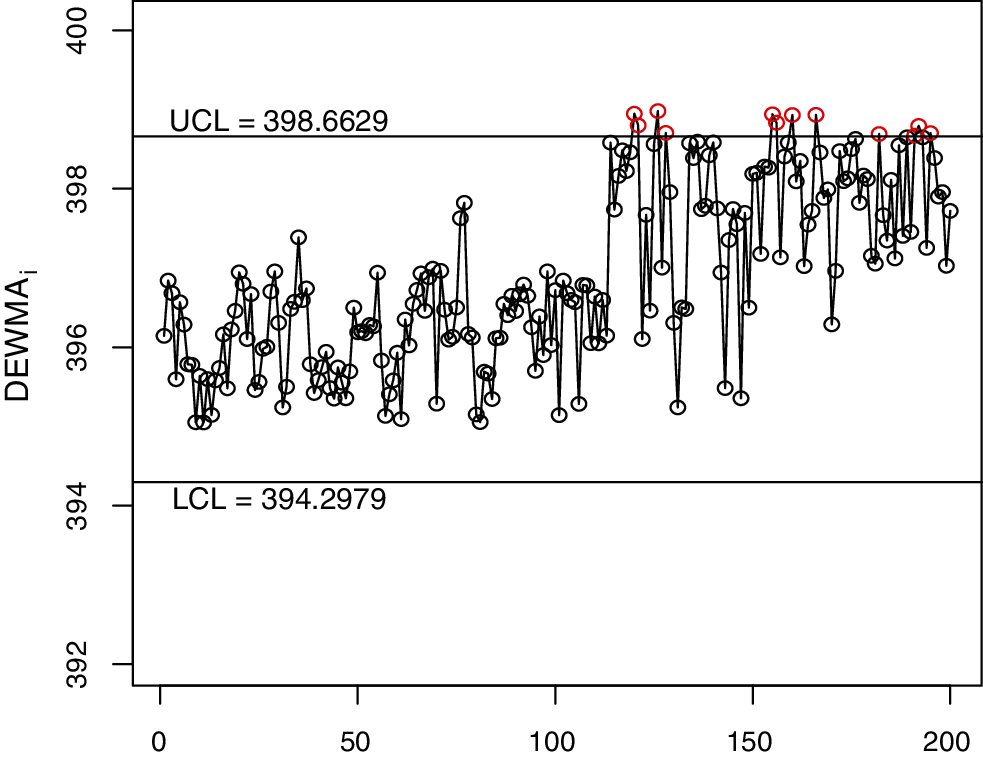
Figure 11: The classical DEWMA control chart for real-life data
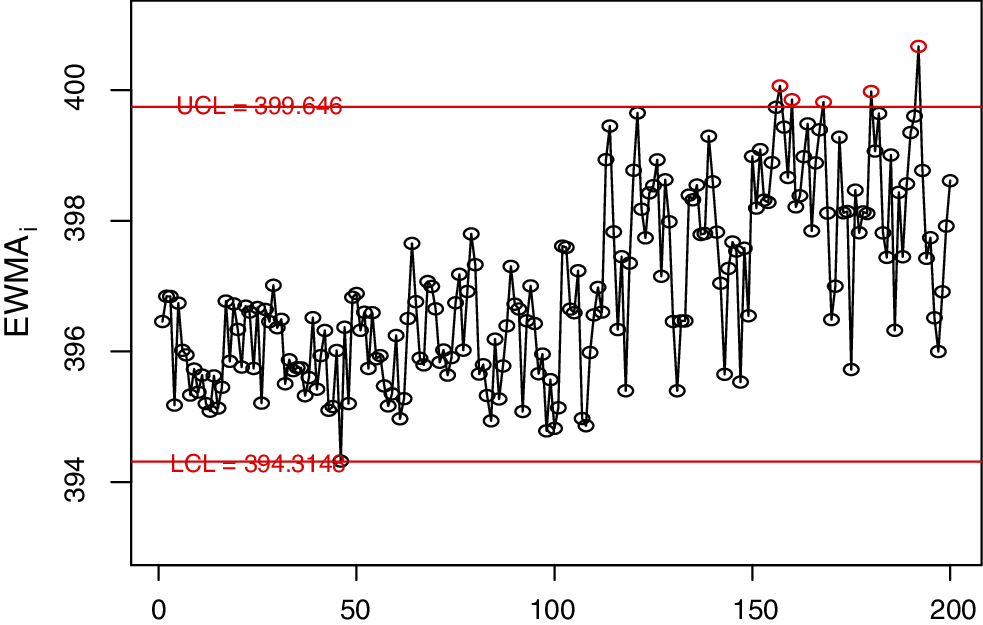
Figure 12: The classical EWMA control chart for real-life data
The traditional Shewhart chart is the most preferred monitoring scheme in detecting large shifts more quickly; however, for small-to-moderate shift detection, the EWMA, DEWMA, and TEWMA control charts have been shown to have better performance. In this paper, we proposed new NDEWMA and NTEWMA control charts under an uncertainty environment, and these are shown to outperform the existing NEWMA chart for small shifts detection. We studied its run-length performance using the asymptotic control limits under neutrosophic environments with neutrosophic Monte Carlo simulations in R software. The NTEWMA chart is more efficient in a wider range of shifts as the value of the smoothing parameter increases. The results showed that the NTEWMA chart is very efficient in small shift detection when the smoothing constants are small. Finally, we applied the NTEWMA and NDEWMA charts as well as the EWMA, NEWMA, DEWMA, and TEWMA charts to simulated data and data from an electrical engineering process, where the results confirmed the findings.
The proposed charts using other sampling schemes can be studied as future research. The proposed control charts can be extended as future research to monitor process dispersion and joint monitoring for univariate and multivariate setup under a complex system or under an uncertainty. Moreover, the proposed charts using some non-normal distribution can be considered as future research.
Funding Statement: This work was funded by the Deanship of Scientific Research (DSR), King Abdulaziz University, Jeddah. The authors, therefore, gratefully acknowledge the DSR technical and financial support.
Conflicts of Interest: The authors declare that they have no conflicts of interest to report regarding the present study.
1. Shewhart, W. A. (1926). Quality control charts. The Bell System Technical Journal, 5(4), 593–603. DOI 10.1002/j.1538-7305.1926.tb00125.x. [Google Scholar] [CrossRef]
2. Page, E. S. (1954). Continuous inspection schemes. Biometrika, 41(1/2), 100–115. DOI 10.2307/2333009. [Google Scholar] [CrossRef]
3. Roberts, S. W. (2000). Control chart tests based on geometric moving averages. Technometrics, 42(1), 97–101. DOI 10.1080/00401706.2000.10485986. [Google Scholar] [CrossRef]
4. Shamma, S. E., Amin, R. W., Shamma, A. K. (1991). A double exponentially weigiited moving average control procedure with variable sampling intervals. Communications in Statistics-Simulation and Computation, 20(2–3), 511–528. DOI 10.1080/03610919108812969. [Google Scholar] [CrossRef]
5. Shamma, S. E., Shamma, A. K. (1992). Development and evaluation of control charts using double exponentially weighted moving averages. International Journal of Quality & Reliability Management, 9(6), 18–25. DOI 10.1108/02656719210018570. [Google Scholar] [CrossRef]
6. Shafqat, A., Huang, Z., Aslam, M., Nawaz, M. S. (2020). A nonparametric repetitive sampling DEWMA control chart based on linear prediction. IEEE Access, 8, 74977–74990. DOI 10.1109/ACCESS.2020.2989132. [Google Scholar] [CrossRef]
7. Capizzi, G., Masarotto, G. (2003). An adaptive exponentially weighted moving average control chart. Technometrics, 45(3), 199–207. DOI 10.1198/004017003000000023. [Google Scholar] [CrossRef]
8. Zhang, L., Chen, G. (2005). An extended EWMA mean chart. Quality Technology and Quantitative Management, 2(1), 39–52. DOI 10.1080/16843703.2005.11673088. [Google Scholar] [CrossRef]
9. Hunter, J. S. (1986). The exponentially weighted moving average. Journal of Quality Technology, 18(4), 203–210. DOI 10.1080/00224065.1986.11979014. [Google Scholar] [CrossRef]
10. Lucas, J. M., Saccucci, M. S. (1990). Exponentially weighted moving average control schemes: Properties and enhancements. Technometrics, 32(1), 1–12. DOI 10.1080/00401706.1990.10484583. [Google Scholar] [CrossRef]
11. Zaman, B., Lee, M. H., Riaz, M., Abujiya, M. A. R. (2017). An adaptive EWMA scheme-based CUSUM accumulation error for efficient monitoring of process location. Quality and Reliability Engineering International, 33(8), 2463–2482. DOI 10.1002/qre.2203. [Google Scholar] [CrossRef]
12. Reynolds Jr, M. R., Stoumbos, Z. G. (2006). Comparisons of some exponentially weighted moving average control charts for monitoring the process mean and variance. Technometrics, 48(4), 550–567. DOI 10.1198/004017006000000255. [Google Scholar] [CrossRef]
13. Aslam, M., Khan, N., Jun, C. H. (2015). A new S2 control chart using repetitive sampling. Journal of Applied Statistics, 42(11), 2485–2496. DOI 10.1080/02664763.2015.1043861. [Google Scholar] [CrossRef]
14. Faraz, A., Moghadam, M. B. (2007). Fuzzy control chart a better alternative for Shewhart average chart. Quality & Quantity, 41(3), 375–385. DOI 10.1007/s11135-006-9007-9. [Google Scholar] [CrossRef]
15. FazalZarandi, M. H., Alaeddini, A., Turksen, I. B. (2008). A hybrid fuzzy adaptive sampling–-Run rules for Shewhart control chart. Information Sciences, 178(4), 1152–1170. DOI 10.1016/j.ins.2007.09.028. [Google Scholar] [CrossRef]
16. Faraz, A., Kazemzadeh, R. B., Moghadam, M. B., Bazdar, A. (2010). Constructing a fuzzy Shewhart control chart for variables when uncertainty and randomness are combined. Quality & Quantity, 44(5), 905–914. DOI 10.1007/s11135-009-9244-9. [Google Scholar] [CrossRef]
17. Wang, D., Hryniewicz, O. (2015). A fuzzy nonparametric Shewhart chart based on the bootstrap approach. International Journal of Applied Mathematics and Computer Science, 25(2), 389–401. DOI 10.1515/amcs-2015-0030. [Google Scholar] [CrossRef]
18. Kahraman, C., Gülbay, M., Boltürk, E. (2016). Fuzzy shewhart control charts. Cham: Springer. [Google Scholar]
19. Khan, M. Z., Khan, M. F., Aslam, M., Niaki, S. T. A., Mughal, A. R. (2018). A fuzzy EWMA attribute control chart to monitor process mean. Information, 9(12), 312. DOI 10.3390/info9120312. [Google Scholar] [CrossRef]
20. Aslam, M., Shafqat, A., Albassam, M., Malela-Majika, J. C., Shongwe, S. C. (2021). A new CUSUM control chart under uncertainty with applications in petroleum and meteorology. PLoS One, 16(2), e0246185. DOI 10.1371/journal.pone.0246185. [Google Scholar] [CrossRef]
21. Smarandache, F. (2014). Introduction to neutrosophic statistics. USA: Sitech and Education Publishing. [Google Scholar]
22. Chen, J., Ye, J., Du, S. (2017). Scale effect and anisotropy analyzed for neutrosophic numbers of rock joint roughness coefficient based on neutrosophic statistics. Symmetry, 9(10), 208. DOI 10.3390/sym9100208. [Google Scholar] [CrossRef]
23. Chen, J., Ye, J., Du, S., Yong, R. (2017). Expressions of rock joint roughness coefficient using neutrosophic interval statistical numbers. Symmetry, 9(7), 123. DOI 10.3390/sym9070123. [Google Scholar] [CrossRef]
24. Aslam, M. (2018). A new sampling plan using neutrosophic process loss consideration. Symmetry, 10(5), 132. DOI 10.3390/sym10050132. [Google Scholar] [CrossRef]
25. Aslam, M., Bantan, R. A., Khan, N. (2019). Design of a new attribute control chart under neutrosophic statistics. International Journal of Fuzzy Systems, 21(2), 433–440. DOI 10.1007/s40815-018-0577-1. [Google Scholar] [CrossRef]
26. Aslam, M., Bantan, R. A., Khan, N. (2019). Monitoring the process based on belief statistic for neutrosophic gamma distributed product. Processes, 7(4), 209. DOI 10.3390/pr7040209. [Google Scholar] [CrossRef]
27. Alevizakos, V., Chatterjee, K., Koukouvinos, C. (2021). The triple exponentially weighted moving average control chart. Quality Technology & Quantitative Management, 18(3), 326–354. DOI 10.1080/16843703.2020.1809063. [Google Scholar] [CrossRef]
28. Riaz, M., Abbas, Z., Nazir, H. Z., Abid, M. (2021). On the development of triple homogeneously weighted moving average control chart. Symmetry, 13(2), 360. DOI 10.3390/sym13020360. [Google Scholar] [CrossRef]
29. Letshedi, T. I., Malela-Majika, J. C., Castagliola, P., Shongwe, S. C. (2021). Distribution-free triple EWMA control chart for monitoring the process location using the Wilcoxon rank-sum statistic with fast initial response feature. Quality and Reliability Engineering International, 1–18. DOI 10.1002/qre.2842. [Google Scholar] [CrossRef]
30. Aslam, M., AL-Marshadi, A. H., Khan, N. (2019). A new X-bar control chart for using neutrosophic exponentially weighted moving average. Mathematics, 7(10), 957. DOI 10.3390/math7100957. [Google Scholar] [CrossRef]
31. Faisal, M., Zafar, R. F., Abbas, N., Riaz, M., Mahmood, T. (2018). A modified CUSUM control chart for monitoring industrial processes. Quality and Reliability Engineering International, 34(6), 1045–1058. DOI 10.1002/qre.2307. [Google Scholar] [CrossRef]
 | This work is licensed under a Creative Commons Attribution 4.0 International License, which permits unrestricted use, distribution, and reproduction in any medium, provided the original work is properly cited. |