| Computer Modeling in Engineering & Sciences |
DOI: 10.32604/cmes.2021.017213
ARTICLE
Combinatorial Method with Static Analysis for Source Code Security in Web Applications
1Escuela Superior de Ingeniería y Tecnología, Universidad Internacional de La Rioja, Logroño, La Rioja, 26006, Spain
2Computer Science Department, University of Alcala, Madrid, 28801, Spain
3Department of Computing and Technology, Cameron University, Lawton, 73505, Oklahoma, USA
4Universidad de la Rioja, Logroño, La Rioja, 26006, Spain
*Corresponding Author: Á. Alberto Magreñán. Email: angel-alberto.magrenan@unirioja.es
Received: 15 April 2021; Accepted: 06 July 2021
Abstract: Security weaknesses in web applications deployed in cloud architectures can seriously affect its data confidentiality and integrity. The construction of the procedure utilized in the static analysis tools of source code security differs and therefore each tool finds a different number of each weakness type for which it is designed. To utilize the possible synergies different static analysis tools may process, this work uses a new method to combine several source codes aiming to investigate how to increase the performance of security weakness detection while reducing the number of false positives. Specifically, five static analysis tools will be combined with the designed method to study their behavior using an updated benchmark for OWASP Top Ten Security Weaknesses (OWASP TTSW). The method selects specific metrics to rank the tools for different criticality levels of web applications considering different weights in the ratios. The findings show that simply including more tools in a combination is not synonymous with better results; it depends on the specific tools included in the combination due to their different designs and techniques.
Keywords: Weakness; benchmark; security testing analysis; comparative methodology; tools combination; web application
Nowadays organizations and companies use Web Applications (WA) in cloud infrastructures to manage their handle data from anywhere, Internet, Intranets et al. WA can be accessed from anywhere and can also be attacked, which means that it is vital to focus on the implementation of their security. A WA can include security weaknesses in source code that can affect not only the application but also the server that hosts it, the operating system and even the cloud infrastructure itself. Therefore, developing new methods to investigate how to preventively eliminate as many weaknesses as possible in WA source code from the beginning of the development of the WA is a priority.
OWASP Top Ten Project (OWASP TTP) [1] is the most know standard that addresses the main security weaknesses in WA source code. The security weaknesses in WA source code require a security analyst to develop the optimum selecting the best Static Analysis Security Testing Tools (SASTT). Numerous investigations [2–4] show that the WA are failing the OWASP TTP. SQL injection (SQLI) and Cross Site Scripting (XSS) weaknesses are the most frequent and dangerous weaknesses in source code.
Many studies indicate very good ratios of True Positives (TP) and False Positives (FP) may be determined by SASTT [5–8]. The work of Yoon et al. [9] shows how static tools can decrease FP (found weaknesses that may not appear) and False Negatives (FN) (real weaknesses not detected). FP are not a weakness and may be discarded by the investigator, but a FN is more challenging to detect by a security analyst it has not been detected. Therefore, it is dangerous. It is concluded that is required to verify each security weakness appearing in a SASTT report. Related works deal with how several static tools that work together to take advantage of any synergies between SASTT to achieve a better performance finding more weaknesses [10,11]. Also, there are several works that have investigated how combine static and dynamic analysis [12,13].
We list some concerns to analyze:
• The n-SASTT effectiveness finding OWASP TTSW in combination.
• The n-SASTT combinations average effectiveness finding OWASP TTSW taken into account different metrics.
• The SASTT effectiveness finding OWASP TTSW for each n-tools combination and taken into account different metrics.
• The optimum way to study the security of WA at various degrees.
• OWASP Top Ten Benchmark (OWASP TTB) suitability for relating SASTT.
The main motivation for this work is the idea that the combination of different SASTTs can be very beneficial in improving the security of the source code of a web application. A proper combination of SASTTs can find more security vulnerabilities or TPs while yielding fewer false alarms or FPs. Therefore, it is necessary to reference comparative work on SASTT combinations so that auditors and analysts can select the best combinations. Besides, auditors and analysts need to choose the best SASTT combinations taking into account which combinations are more adequate having into account different criticality levels. To formalize the use of SASTT determining the maximum number of weaknesses and later being able to patch them efficiently, it is necessary to introduce a Software Development Life Cycle (SSDLC) given by Vicente et al. in [14].
Next, we present out innovations. The first objective is to find out the behaviour of the combination of commercial n-SASTT (Coverity, Klocwork, Fortify SCA and Xanitizer) and one open-source tool (FindSecurityBugs) using a new specific methodology. Combining several tools can improve the overall results but choosing the optimum tools to analyze the security of a WA is not a simple task. This study has investigated how to determine a repeatable method to combine several SASTT to achieve more optimal results in terms of true positive (TPR) and false positive (FPR) ratios. The way of combining tools proposed by the method is novel and uses a testbed application (with 669 test cases for TP and FP) specifically designed for the weakness classes of the OWASP TTP widely accepted by the community. The method examines the effectiveness in combination of 4 relevant commercial SASTT, plus an open source one. It also makes it possible to evaluate how they perform against a wide range of weaknesses in OWASP TTSW not covered by other works. We investigate specifically how is the performance choosing proper metrics.
The second aim in this work is to pick the more proper relations of tools taking into account various levels of security criticality. As mentioned above, a security analysis with a SASTT must necessarily include a criticising the results to eliminate possible FP, but sometimes auditors do not have enough time. In the most critical applications, it is necessary to find the highest number of TP and it does not matter the number of FP because there is time to eliminate the FP. In less critical applications there is not as much time to eliminate FP and tools are needed that yield fewer FP with good results in the TPR. The metrics used allow to distinguish which combinations of tools are more suitable for auditing the security of WA at various levels.
The tools are used against a new benchmark updated from its first use [15,16] and adapted to OWASP TTP [1] to obtain the results of n-tools combination effectiveness. We get a strict rank of combination tools selecting a well established metrics applied to the execution conclusions. Finally, to fix the effectiveness utilizing the tools in combination, the study gives some practical recommendations.
Hence, the findings of the work are:
• A specific approach using a concrete benchmark relying on OWASP TTSW [15,16] to evaluate the effectiveness of n-SASTT combinations detecting weaknesses in WA.
• Categorizing results by SASTT in combination utilizing a method to categorize them based on various degree levels of WA significance and criticality.
• A study of leading commercial SASTT results in combination to permit researchers to pick the best tools to accomplish an audit of a WA.
The structure of this work is: Section 2 gives a background in web technologies security with emphasis in weaknesses, SASTT and related work. Section 3 provides the step of the assessment approach proposal designed with the steps followed to rank the SASTT in combination using the selected benchmark. Moreover, Section 4 collects the finding and Section 5 proposes future research.
A background is given on web technologies security, benchmarking initiatives, SASTT.
The advancement of WA for companies and business related via the Internet and Intranets implies that there is a need to accomplish some kind of business and simultaneously be a precious target of attack by exploiting construction, implementation or operation security weaknesses that WA have to get some kind of privileged information, financial advantage, extortion, denial, etc.
.NET framework with languages such as C# or iOS, PHP, Visual Basic, NodeJs and Java are the most chosen today. Java is the most used language, according to several studies [17,18]. Other publications address the security problems of the new generation of WA: WA use HTML5 or flash technologies, asynchronous JavaScript and Xml (AJAX) [19–22] and JavaScript libraries such as Angular, Bootstrap, Jquery, React, Vaadin, Vue, and other.
One form of security prevention in relation to the development of WA source code is for practitioners to have knowledge in secure source code development [23]. The using of secure languages typing and memory length verifications at compile time is another form of prevention. C#, C-dialects such as Ccure and Cyclone, and Java are some of these languages [24].
The OWASP TTP puts together the most interesting security weakness classes and there are several studies that show that WA tested failed the OWASP TTP [2–4]. SANS Top 25 [25] is another weakness project for software in general including 25 CWE specific weaknesses. OWASP TTP is related to weakness classes and each of them includes different specific weaknesses related to WA.
2.2 Testing: Static Analysis Security
A sound technique to prevent security weaknesses in source code is avoidance [26]. Weaknesses are avoided, if practitioners are qualified in source code design to prevent “mistakes” leading to security weaknesses [23]. Clearly, avoidance prevents some of the weaknesses, but programming errors can exist although the preventive measures of employing secure best practices and other related security analysis techniques are in place once the source code is structured. These approaches contain the use of SASTT, dynamic analysis security tools (DAST) or interactive real-time analysis tools (IAST). Manual static analysis demands highly trained staff and time. To make an analysis of WA security, by some technique, it is important to deal with the entire attack surface taking into account all pieces and layers of application and utilizing devices for automating security analysis. To achieve better results, some tools of similar king may combine [11] or various types of tools [27].
SASTTs are a type of security tools that analyze the entire source code of a web application in several steps. First, they compile the source code and from the parse tree they transform it into a model that is checked against the specific rules or models of each security weakness. In summary, SASTT successively performs lexical, syntactic, semantic, intra-procedural, local analysis of each function and inter-procedural analysis between the different functions of the source code. SASTT provide a clear security analysis, and they analyze both source code and object code, as necessary. SASTT initiate with a problem because of the act of finding out, if a design attains its final state, or not [28]. Although, security code analysis can aid to reduce the analysis time and to improve the effectiveness of results [29]. SASTT are thought one of the most important security activities inside a SSDLC [14,30]. SASTT cover all attack surface, also they can audit the configuration files of the WA.
A final audit of each weakness included in a SASTT report is needed to reduce the FP and locate the FN (more difficult). Security auditors are required to improve how to recognize all types of weaknesses in the source code for a particular programming language [31]. In [5] tools such as Fortify SCA, Coverity, Checkmarx or Klocwork are excellent cases of tools that give way for reducing FP. SASTT has distinct possibilities in terms of the error trace facilities to audit a security weakness.
The works [6,32], evaluates SASTT vs. DAST tools against web services benchmarks. SASTT provide better TPR and worse FPR than DAST tools. For this reason, static analysis specially requires a manual revision of the results to discard the FP. But several works verify that different SAST tools use distinct algorithm designs as Abstract Interpretation [33–35], Taint Analysis [36], Theorem Provers [37], SAT Solvers [38] or Model Checking [39,40]. Therefore, combining SASTT can detect distinct types of weaknesses and obtain a better result in combination [10,11]. Also, [6,32] verify that SAST and DAST may detect different types of weaknesses and both types of analysis can improve the TPR and FPR by correlating their results. Other studies combine SASTT with IAST tools to monitor attacks in runtime with the information of static analysis [41,42]. Other approximations combine static analysis with machine learning procedures for finding of security weaknesses in WA decreasing the number of FP [43,44].
Nguyen et al. [45] investigate desirable features for SASTT, how derive new SASTT criteria with assisting components for warnings analysis and fix. Moreover, they enhanced the research in static analysis using collaborative user interfaces in a continuous integration environment.
Muske et al. [46] study how to eliminate the number of FP that a SASTT generates. They propose the using of a model checker to automatically eliminate FP and show experimental results using several applications for array index out of bounds or arithmetic overflow weaknesses.
A comparison of 9 SASTT for C language is determined categorizing them by appropriate metrics using SAMATE tests suites for C language. This comparison includes several leaders´ commercial tools which it is important for the security analyst to select the best tool to audit source code security [5].
The work of Ye et al. [47] conducts a comparative research of commercial (Fortify SCA and Checkmarx) and open-source (Splint) SASTT focused on the analysis of one of the most exploited weaknesses, Buffer Overflow. In particular they give a relation of these devices, giving 63 open-source projects including 100 bugs of this type. Their work includes various tools two to two, where they try to make the comparison of tools working by themselves, or by combining them.
Another study shows a conceptual, performance-based ranking framework that prioritizes the output of several SASTT, to enhance the tool effectiveness and usefulness [48]. The framework weights the performance of SASTT per defect type and cross-validates the results between different SASTT reports. The proposed framework shows the potential benefits in an initial validation.
Another paper [10] is based on data that came from the use of five distinct SASTT to find SQL Injections (SQLi) and Cross-Site Scripting (XSS), in 132 WordPress Content Management System (CMS) plugins. This can be extended using a benchmark with more weakness classes and including leader commercial tools.
Ferrara et al. [49] study how taint analyses and backward slicing techniques might be combined to generate improved security analysis for GDPR compliance.
The work of Flynn et al. [50] uses the tool SCALe for aggregating and evaluating static analysis weaknesses findings from several static tools. The goal is to help in the auditing process of the merged SASTT weakness reports. The security weaknesses of the merged report are inspected by auditors to determine whether they are TP or FP. Audit determinations, along with source code metrics, were processed into a training dataset. Training data from all software projects was put together to use diverse classification techniques to create models to classify alarms as expected-true-positive (e-TP), expected-false-positive (e-FP), or indeterminate (I).
The work of Vasallo et al. [51] explores in which development contexts practitioners use SASTT; How developers configure SASTT in distinct development contexts and if developers pay attention to the same warnings in distinct development contexts. An important reason to merge several SASTT is that they cover different rulesets or security weaknesses.
In the work [11], diverse SASTT are combined to enhance the detection of weaknesses in WA, taking into account 4 cases of different criticality levels. It tested five SASTT against two benchmarks, one with real WordPress plugins and another with synthetic test cases. This research can improve using test benchmarks with increased weakness classes than SQLI and XSS and containing leaders’ commercial tools.
In the work [6] the authors work in a benchmarking technique to study the appropriateness of security tools in Web Services environments. This technique provided two solid benchmarks for SQL Injection weakness analysis tools. But it could greatly improve its representativeness with respect to the inclusion of security weaknesses for other security weaknesses besides SQLI.
Nunes et al. [8] design another benchmarking approach to choose sufficient SASTT for weakness detection in WA. They suggested a technique for evaluating such SASTT considering distinct levels of criticality. The results show that the metrics could be better to balance TPR and FPR. But it could better their representative with respect to security weaknesses coverage for others besides SQLI and XSS.
The main related work conclusions are that the existing comparatives do not include an adequate number of leading commercial tools and the benchmarks used are not representatives with respect to OWASP TTP. It is very important that the benchmark includes the security weaknesses more frequent and dangerous in each weakness class, However, given the significant cost of commercial tools, it can be examined a study that deals with seven static tools (five commercial tools) by a new approach proposal with a new representative benchmark constructed for weakness classes included in the OWASP TTP [15,16].
3 A Way to Compare SASTT in Combination
It is developed a repeatable approach to relate and rank the SASTT.
• Choose the OWASP TTB constructed.
• Choose the SASTT. We select five commercial and open-source SASTT according to the analysis of the corresponding works in Section 2.3 and official lists of SASTT and run the selected SASTT against the OWASP TTB designed in [16] with the default configuration for each tool.
• Choose appropriate metrics to scrutinize results based on three different levels of WA criticality.
• Metrics calculation.
• Discussion, analysis and ranking of the results.
Fig. 1 presents the proposed method in graphic form:

Figure 1: Method proposal for analyzing analysis security testing SASTT combinations
A proper bench test must be portable, credible, representative, require minimum modifications, easy to implement and run and the tools execution must be under the same conditions [6]. We have investigated several security benchmarks for WA as Wavsep used in the comparisons of [52,53]; Securebench Micro Project using in the works of [54,55]; Software Assurance Metrics And Tool Evaluation (SAMATE) project of National Institute of Standards and Technology (NIST) used in several works [5,8,56–59]; OWASP benchmark project [60]; Delta-bench by [61] and OWASP TTB [15,16] adapted for OWASP Top Ten 2013 and 2017 weakness classes projects. It has been used in [15].
Taking into account statistics of security weaknesses reported by several works [2–4], the benchmark chosen [16] meets these properties and it is designed for the most frequent and dangerous security weaknesses of WA according to OWASP TTP 2013, 2017. It has been updated from its first use in [15] to this work. The benchmarking solution chooses the most appropriate test cases for the main weakness classes of OWASP TTP 2013 and 2017 from SAMATE Juliet benchmark. The result is a set of weakness classes (for example Cross Site Scripting) each one with a set of weakness types (for example XSS, XSS error message, XSS attrubute, etc.) with a number of test cases to OWASP Top Ten test SASTT behavior and effectiveness with respect to security weaknesses classes. The benchmark is representative according to OWASP TTP, it does not need modifications with any tool and it is easily portable as a java project.
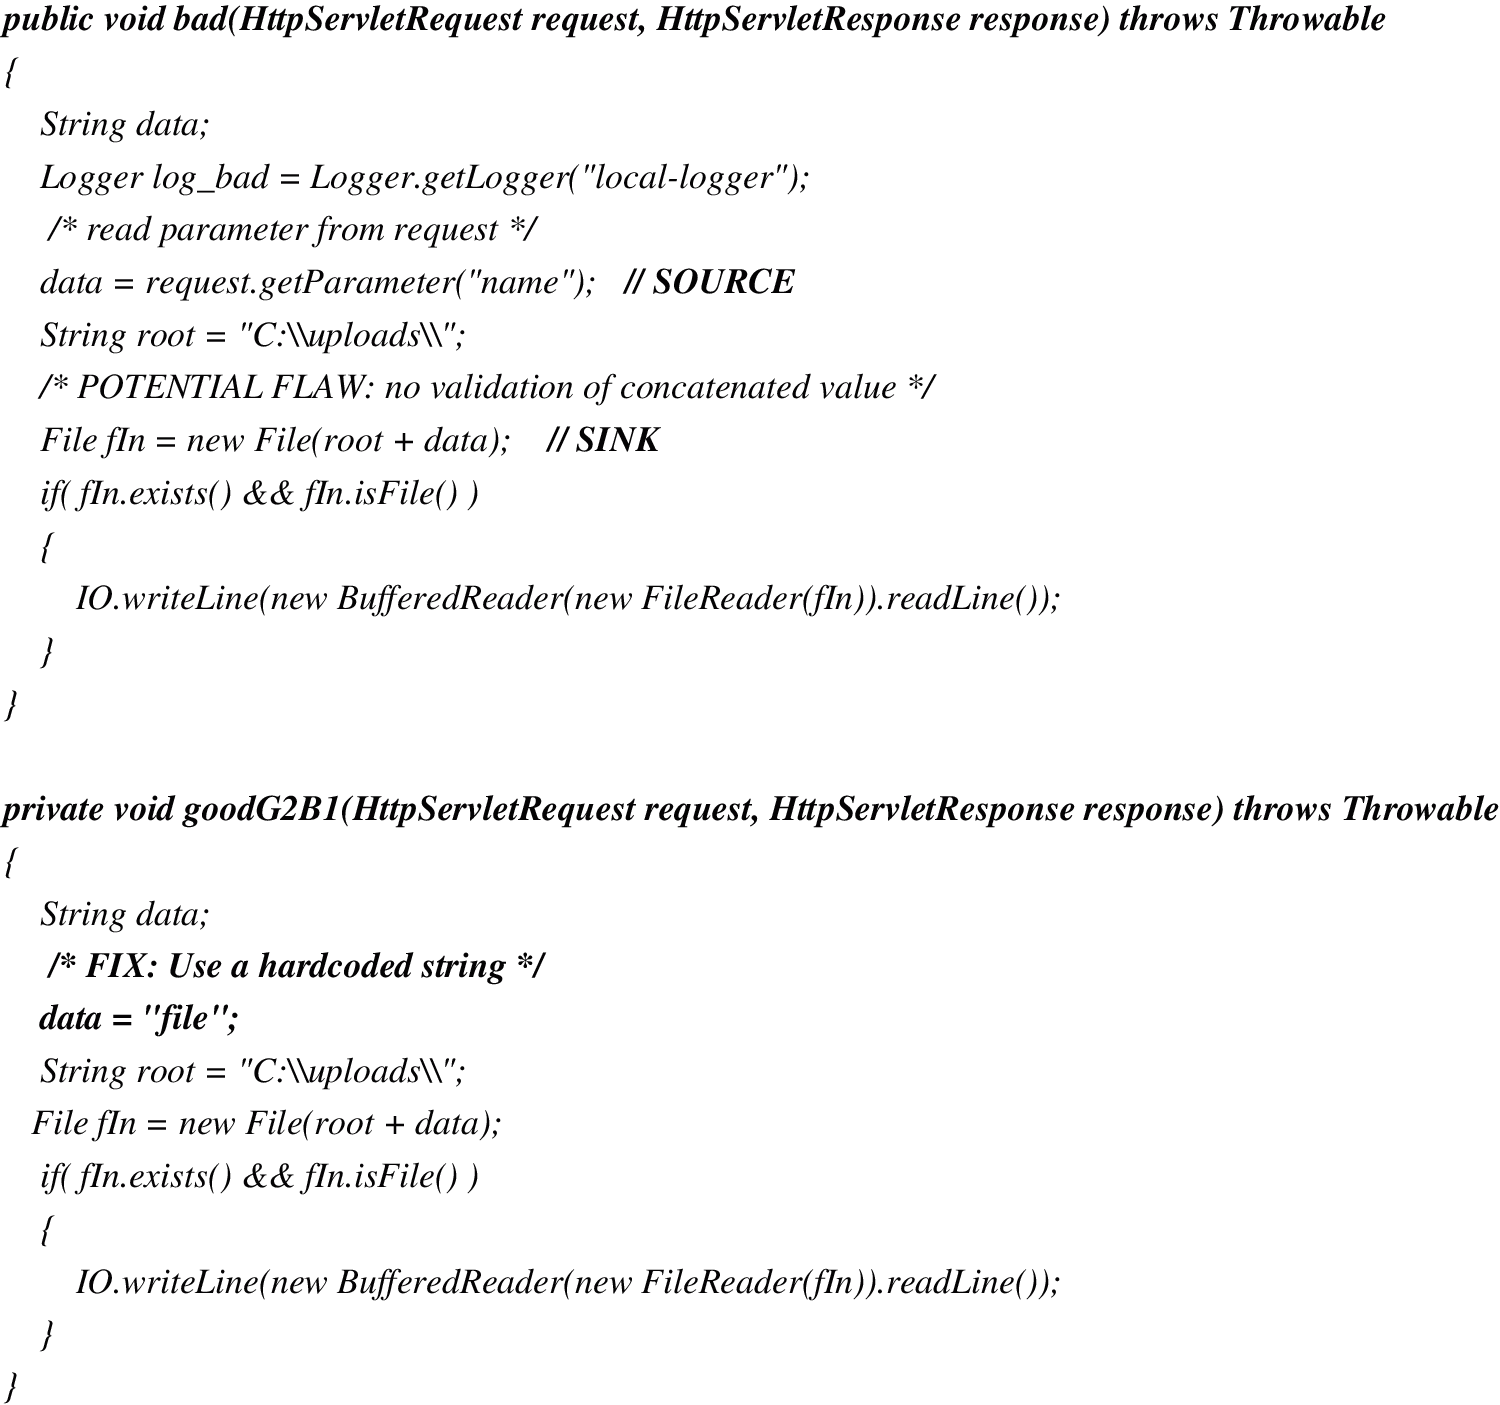
Figure 2: CWE23_Relative_Path_Traversal__getParameterServlet_07 test case
Each case includes a function named bad () designed with a concrete weakness having an input source that is not justified or verified (badsource) and a code line not verified where the weakness appends (badsink). See Fig. 2 with a reduced version of a Relative Path Traversal security weakness. Each test case has distinct variants in code complexity, flow complexity and different input sources to the application as forms, database, console, etc. The final structure of OWASP TTB contains 207 test cases with bad functions for determinating the TPR and 462 test cases with good functions for determining the FPR. Each test case includes bad function, but a test case can have various versions of good functions of the bad function (from 1, 2, 3 or 4 depending on each test case) with nice source input, (goodsource), or nice sink (goodsink). Tab. 1 shows the test cases distribution by weakness classes.
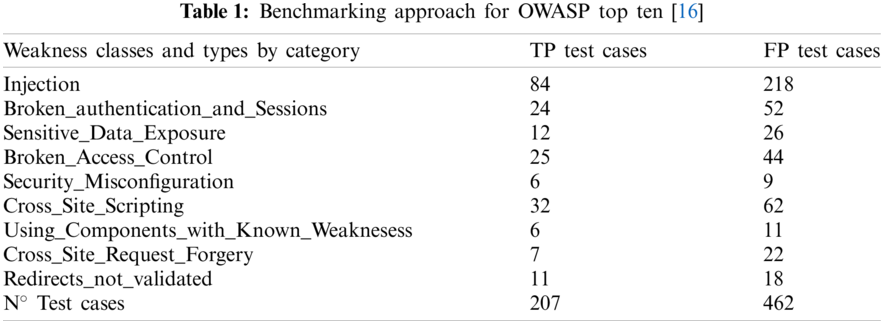
Injection weakness class includes weakness types such as SQL Injection, LDAP Injection, Access Through SQL Primary, Command Injection, HTTP Response Splitting and Unsafe Treatment XPath Input. Broken Authentication and Sessions weakness class includes weakness types such as Hard Coded Passwords, Plaintext Storage in a Cookie, Using Referer Field for Authentication, Insufficient Session Expiration and other. Sensitive Data Exposure weakness class includes weakness types such as Information Leak error, Leftover Debug Code, Info Leak by Comment and other. Broken Access Control weakness class includes weakness types such as Relative Path Traversal, Absolute Path Traversal, Unsynchronized Shared Data TOCTOU and other. Security Misconfiguration weakness class includes weakness types such as Reversible One Way Hash, Insufficiently Random Values and Same Seed in PRNG. Using Components with Known Vulnerabilities includes weakness types such as Use Broken Crypto, Weak PRNG and Predictable Salt One Way Hash.
SASTT are chosen with respect to J2EE, one the most popular technology in web advancing, the programming language utilized by J2EE, Java, is one of the considered as more secure [24] Next, is the picking of four (4) commercial and one (1) open-source static analysis tool for source code to find weaknesses in WA constructed using the J2EE specification. Under these comparations and investigating the availability of commercial and open-source tools are chosen four commercial and one open-source relevant tools. Chosen tools:
• Fortify SCA (Commercial) includes 18 different languages, the most known OS platforms and provides SaaS (Software as a service) and it finds more than 479 weaknesses.
• Coverity (Commercial) provides numerous languages, as Javascript, HTML5, C/C++, Java, C#, Typescript and others.
• Xanitizer (Commercial) includes only Java language, but it provides to auditors of sanitizing the inputs variables in source code.
• FindSecurityBugs. (Open source). Plugins are provided for IntelliJ, Android Studio, SonarQube, Eclipse, and NetBeans. Command line integration is possible with Ant and Maven.
• Klocwork (Commercial) supports C, C++, C#, and Java languages. It has it has compliance with OWASP Top Ten project and others.
3.3 Metrics Selected to Analyze Results
The metrics have been selected taking into account the related works of the state of the art investigated [5,6,8,15,32,59,62,63]. It is essential to select the appropriate metrics that relate the base metrics: TP, FP, true negatives (TN) and false negatives (FN) according to the safety analysis objective to be achieved: Find the highest number of false TP, obtain the lowest number of FP, obtain the best balance between TP and FP or give more weight to finding a higher number of TP vs. FP or give more weight to finding a lower number of FP vs. having a higher TP ratio. These different security analysis objectives relate to different levels of security required in the analyzed web applications. In Section 3.4 all the selected metrics are calculated and in Section 3.5 of Analysis and discussion the selected metrics are studied according to the different objectives. The summary of metrics used is:
• Precision (1). Proportion of the total TP findings penalized by number or FP:
• True positive rate/Recall (2). Ratio of detected weaknesses to the number that really appears in the code:
• False positive rate (3). Ratio of false alarms for weaknesses that not really appear in the code:
• F-measure (4) is harmonic mean of precision and recall:
• Fβ-score (6) is a particular F-measure metric for favor to recall or precision. For example, a value for β of 0,5 gives more weight to precision metric. But a value or 1, 5 gives more weight to recall precision:
Once SASTT and metrics have been chosen, SASTT are executed against the OWASP TTB, we get the TP and FP results for each kind of weakness. Next, the metrics chosen in Section 3.3 are used to find adequate explanation of the results and to obtain the conclusions.
To determine all metrics a program in C language is developed to process the results of each tool. After executing each tool against OWASP TTB the findings are carefully analyzed and formatted in a file that the C program process to get the chosen metrics.
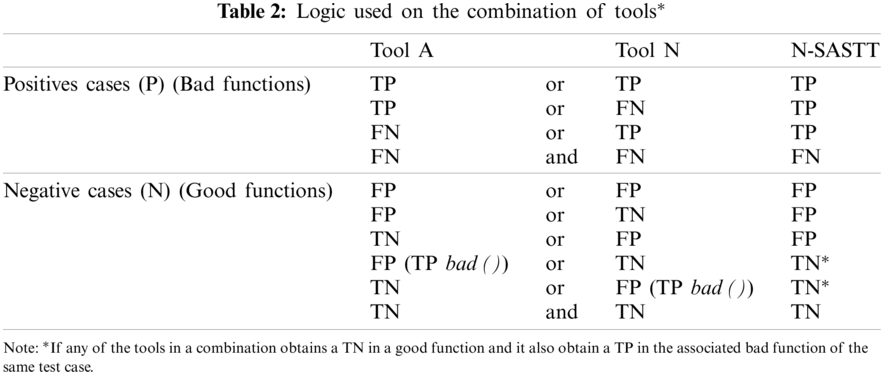
The strategy of 1-out-of-N (1ooN) is used for merging the findings of the SASTT. The technique suggested to obtain the merged results for two or more tools depends on several automated steps. 1ooN in SASTT combinations for TP detection: Any TP detection (alarm) from any of the n-SASTT in a bad function of a test case will lead to an alarm for a 1ooN system. 1ooN in SASTT combination for FP detection: Any TN (non-alarm) from any of the n-SASTT in a good function of a test case would go to a TN in a 1ooN system if the same tool detected a TP in the bad function of the same test case. If the same tool did not detect a TP means that it not properly detect this weakness, or it is not designed to detect it (see Tab. 2).
The number of found weaknesses (TP) is accounted in Tab. 3 XSS error message, XSS attribute. The total of TP test cases was 207. Also, Tab. 4 gives results in the total of 462 FP test cases.
The test cases weaknesses vary in a weakness classification. To normalize findings in each class of weakness (e.g., Cross Site Scripting) we compute the TPR for each type of weakness (XSS error message, XSS attribute, etc.) included in a particular category (for example Injection). Following the arithmetic mean of TPR of all types of weaknesses is computed for each weakness category. Finally, last file of Tab. 3 proves also the arithmetic mean of TPR for all classes of weaknesses for each tool. To normalize the finding of FP results in each weakness category (for example Cross Site Scripting) we calculate the FPR for each type of weakness (XSS error message, XSS attribute, etc.) included in a concrete category (for example Injection). According to the arithmetic mean of TPR of all types of weaknesses is computed for each weakness case. Finally, last file of Tab. 4 gives the arithmetic mean of TPR for all classes of weaknesses for each tool.
The execution of tools vs. the benchmark is achieved computing the metrics selected in Section 3.3, TPR, FPR, Precision, F-measure, F1,5-score and F0,5-score.
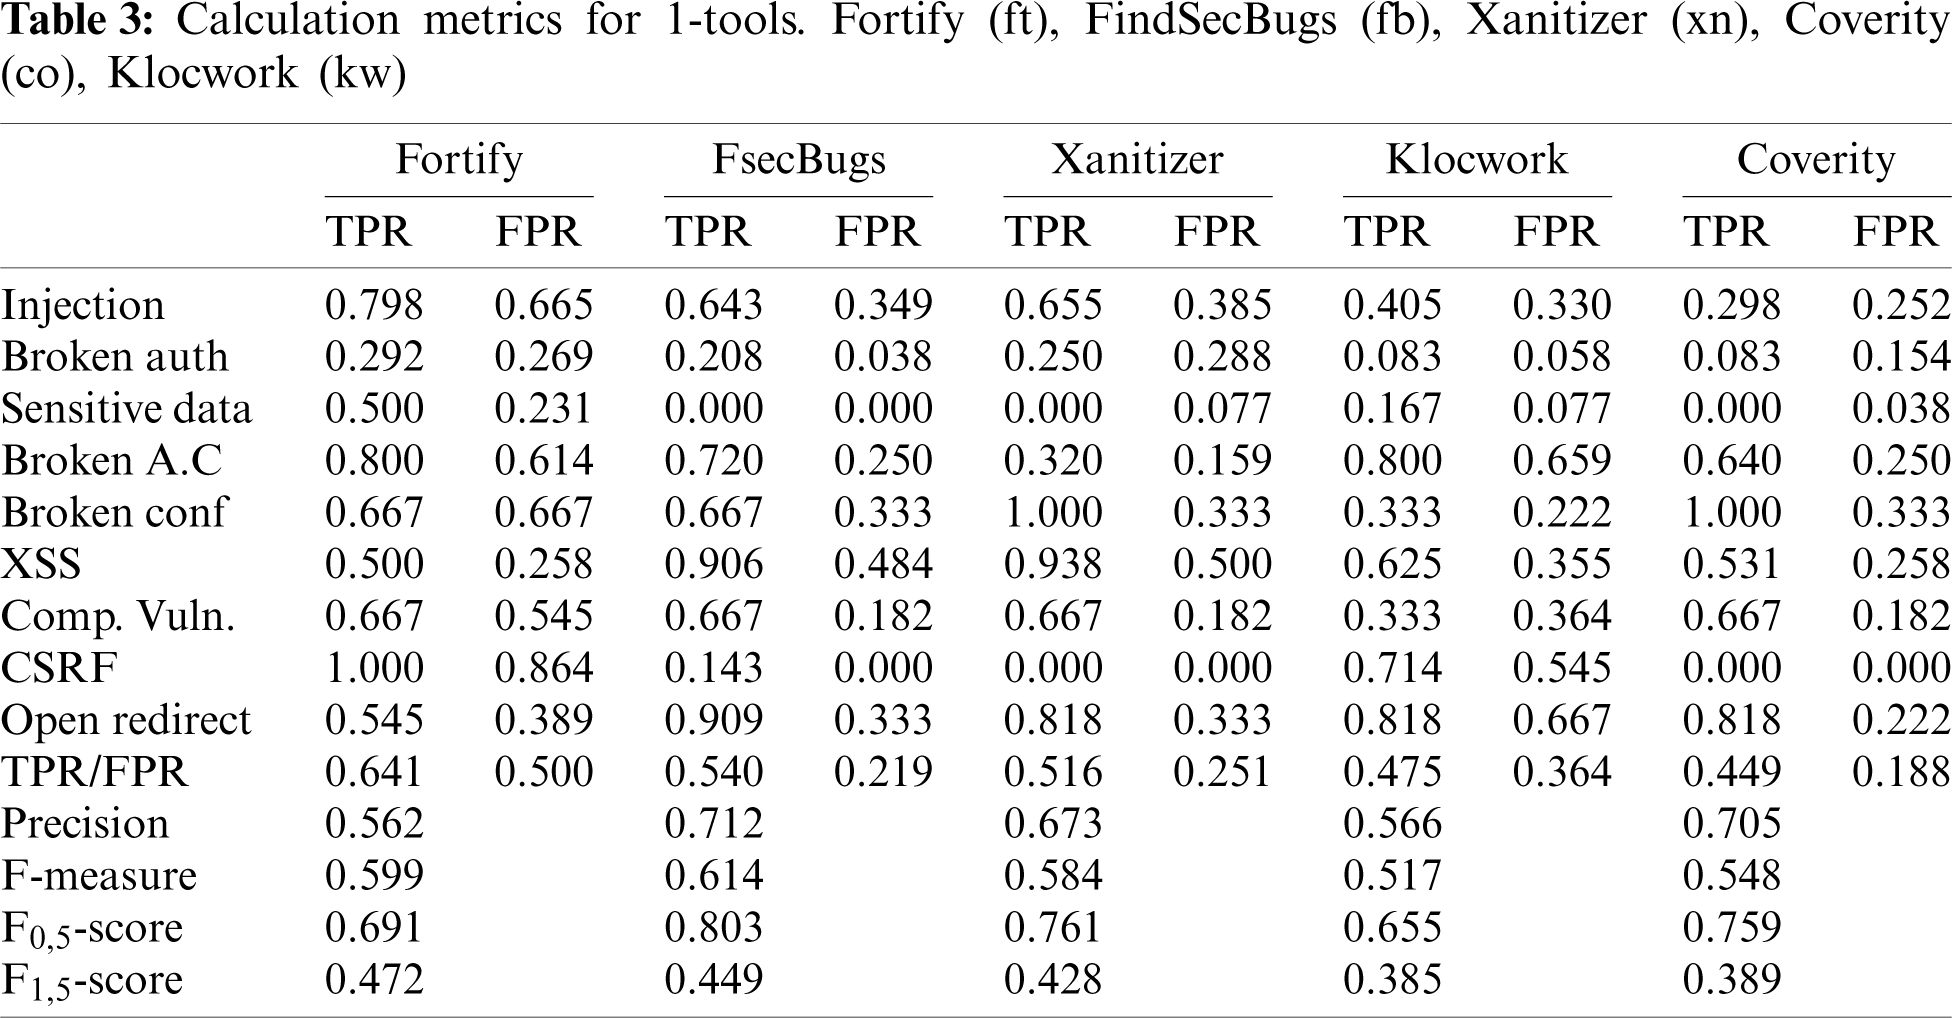
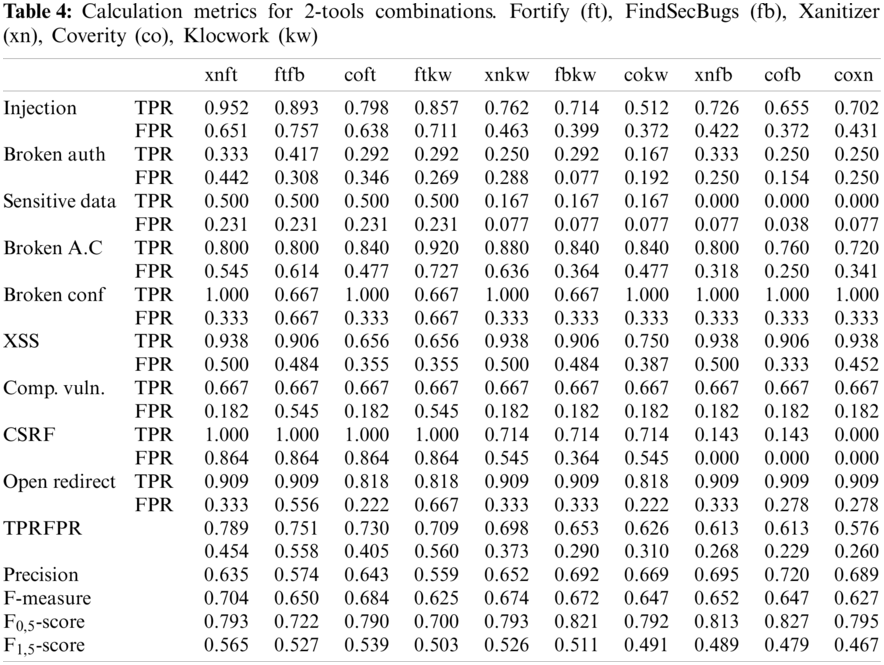
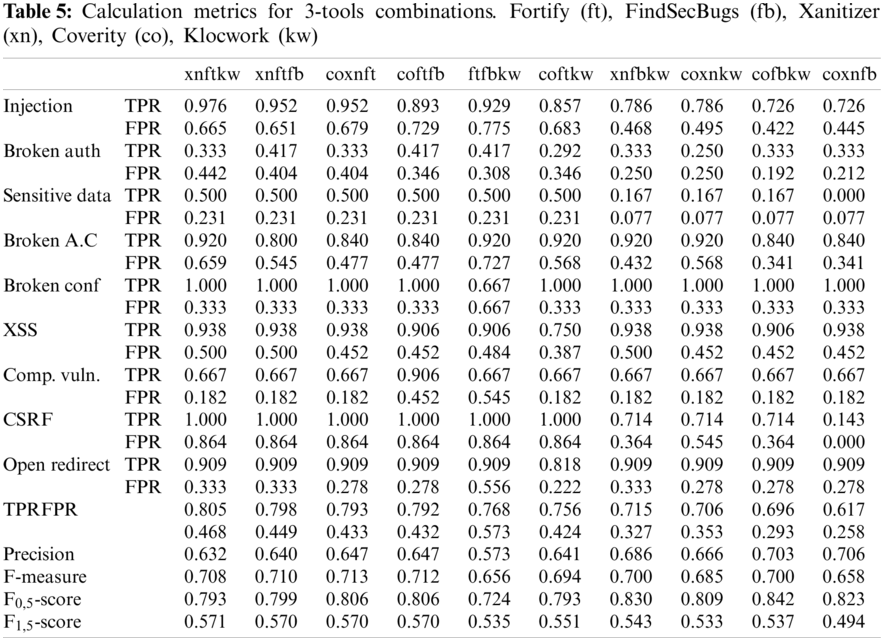
Tab. 3 shows a first categorization for TPR score going from left to right for 1-tool, Tab. 4 for 2-tools combinations and Tab. 5 for 3-tools and Tab. 6 for 4 and 5-tools combinations. The abbreviations used for the tools are: Fortify (ft), FindSecBugs (fb), Xanitizer (xn), Coverity (co).
We elaborate on the research concerns enumerated in Section 1 based on the proposed method with the relevant technique, giving the findings.
3.5.1 n-SASTT Effectiveness in Combination
Fig. 3 shows five graphics (a–e) to show how is the behavior of the distinct n-tool combinations with the data obtained from the TPR and FPR averages of two-tool, three-tool, four-tool and five-tool combinations vs. the use of only one tool. Comparing graphic (a) for TPR and FPR results of tools in isolation with graphic (b) for TPR and FPR results of two tools in combination it can be observed that the all TPR averages for each weakness are higher for 2-tool combinations. On the other side, having into account FPR average for each weakness category in 2-tool combination is slightly higher for Injection, Broken Authentication, Sensitive Data, XSS and CSRF, but it is lower for Components with Known Weaknesses, Broken Configurations, and Open Redirect. Another clear conclusion is that the difference between TPR and FPR averages of 2-tool combinations (b) is higher than the difference between TPR and FPR averages of tools executed in isolation (a) except for Broken Authentication weakness category. This means that there is a clear improvement in detection efficiency by combining two tools as opposed to using only one tool. Comparing graphic (b) 2-tool combinations with graphic (c) 3-tool combinations TPR and FPR average results for each weakness category, all TPR average are slightly higher for the 3-tool combinations. All FPR average are slightly higher for the 3-tool combinations except for Broken Configurations and Components with Known Weaknesses. This means that there is a slightly improvement in detection efficiency by combining three tools as opposed to combining two tools. Comparing graphic (c) 3-tool combinations with graphic (d) 4-tool combinations TPR and FPR average results for each weakness category, only TPR average for Sensitive Data and CSRF are slightly higher for the 4-tool combinations. The improvement in the combination of 5 tools with respect to 4 tools is not very significant, All FPR average are similar for the 4-tool combinations except for Injection, Sensitive Data and CSRF that are higher than for the 3-tools combinations. This means that there is a very slightly improvement in detection efficiency by combining four tools as opposed to combining three tools. Also, the improvement in the 5-tool combination over the 4-tool combination is not very significant, some better scores for TP are offset by some worse FP scores.
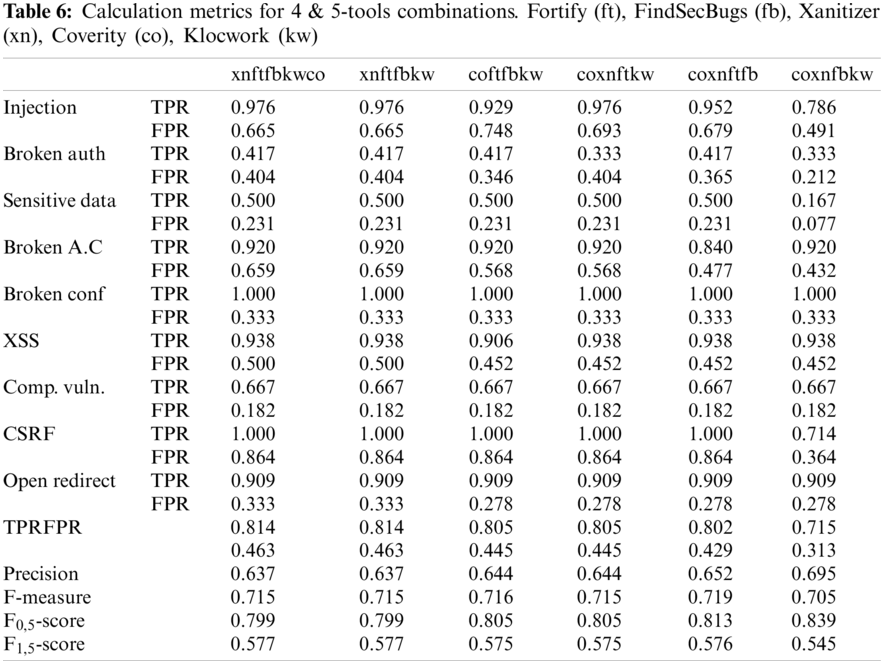
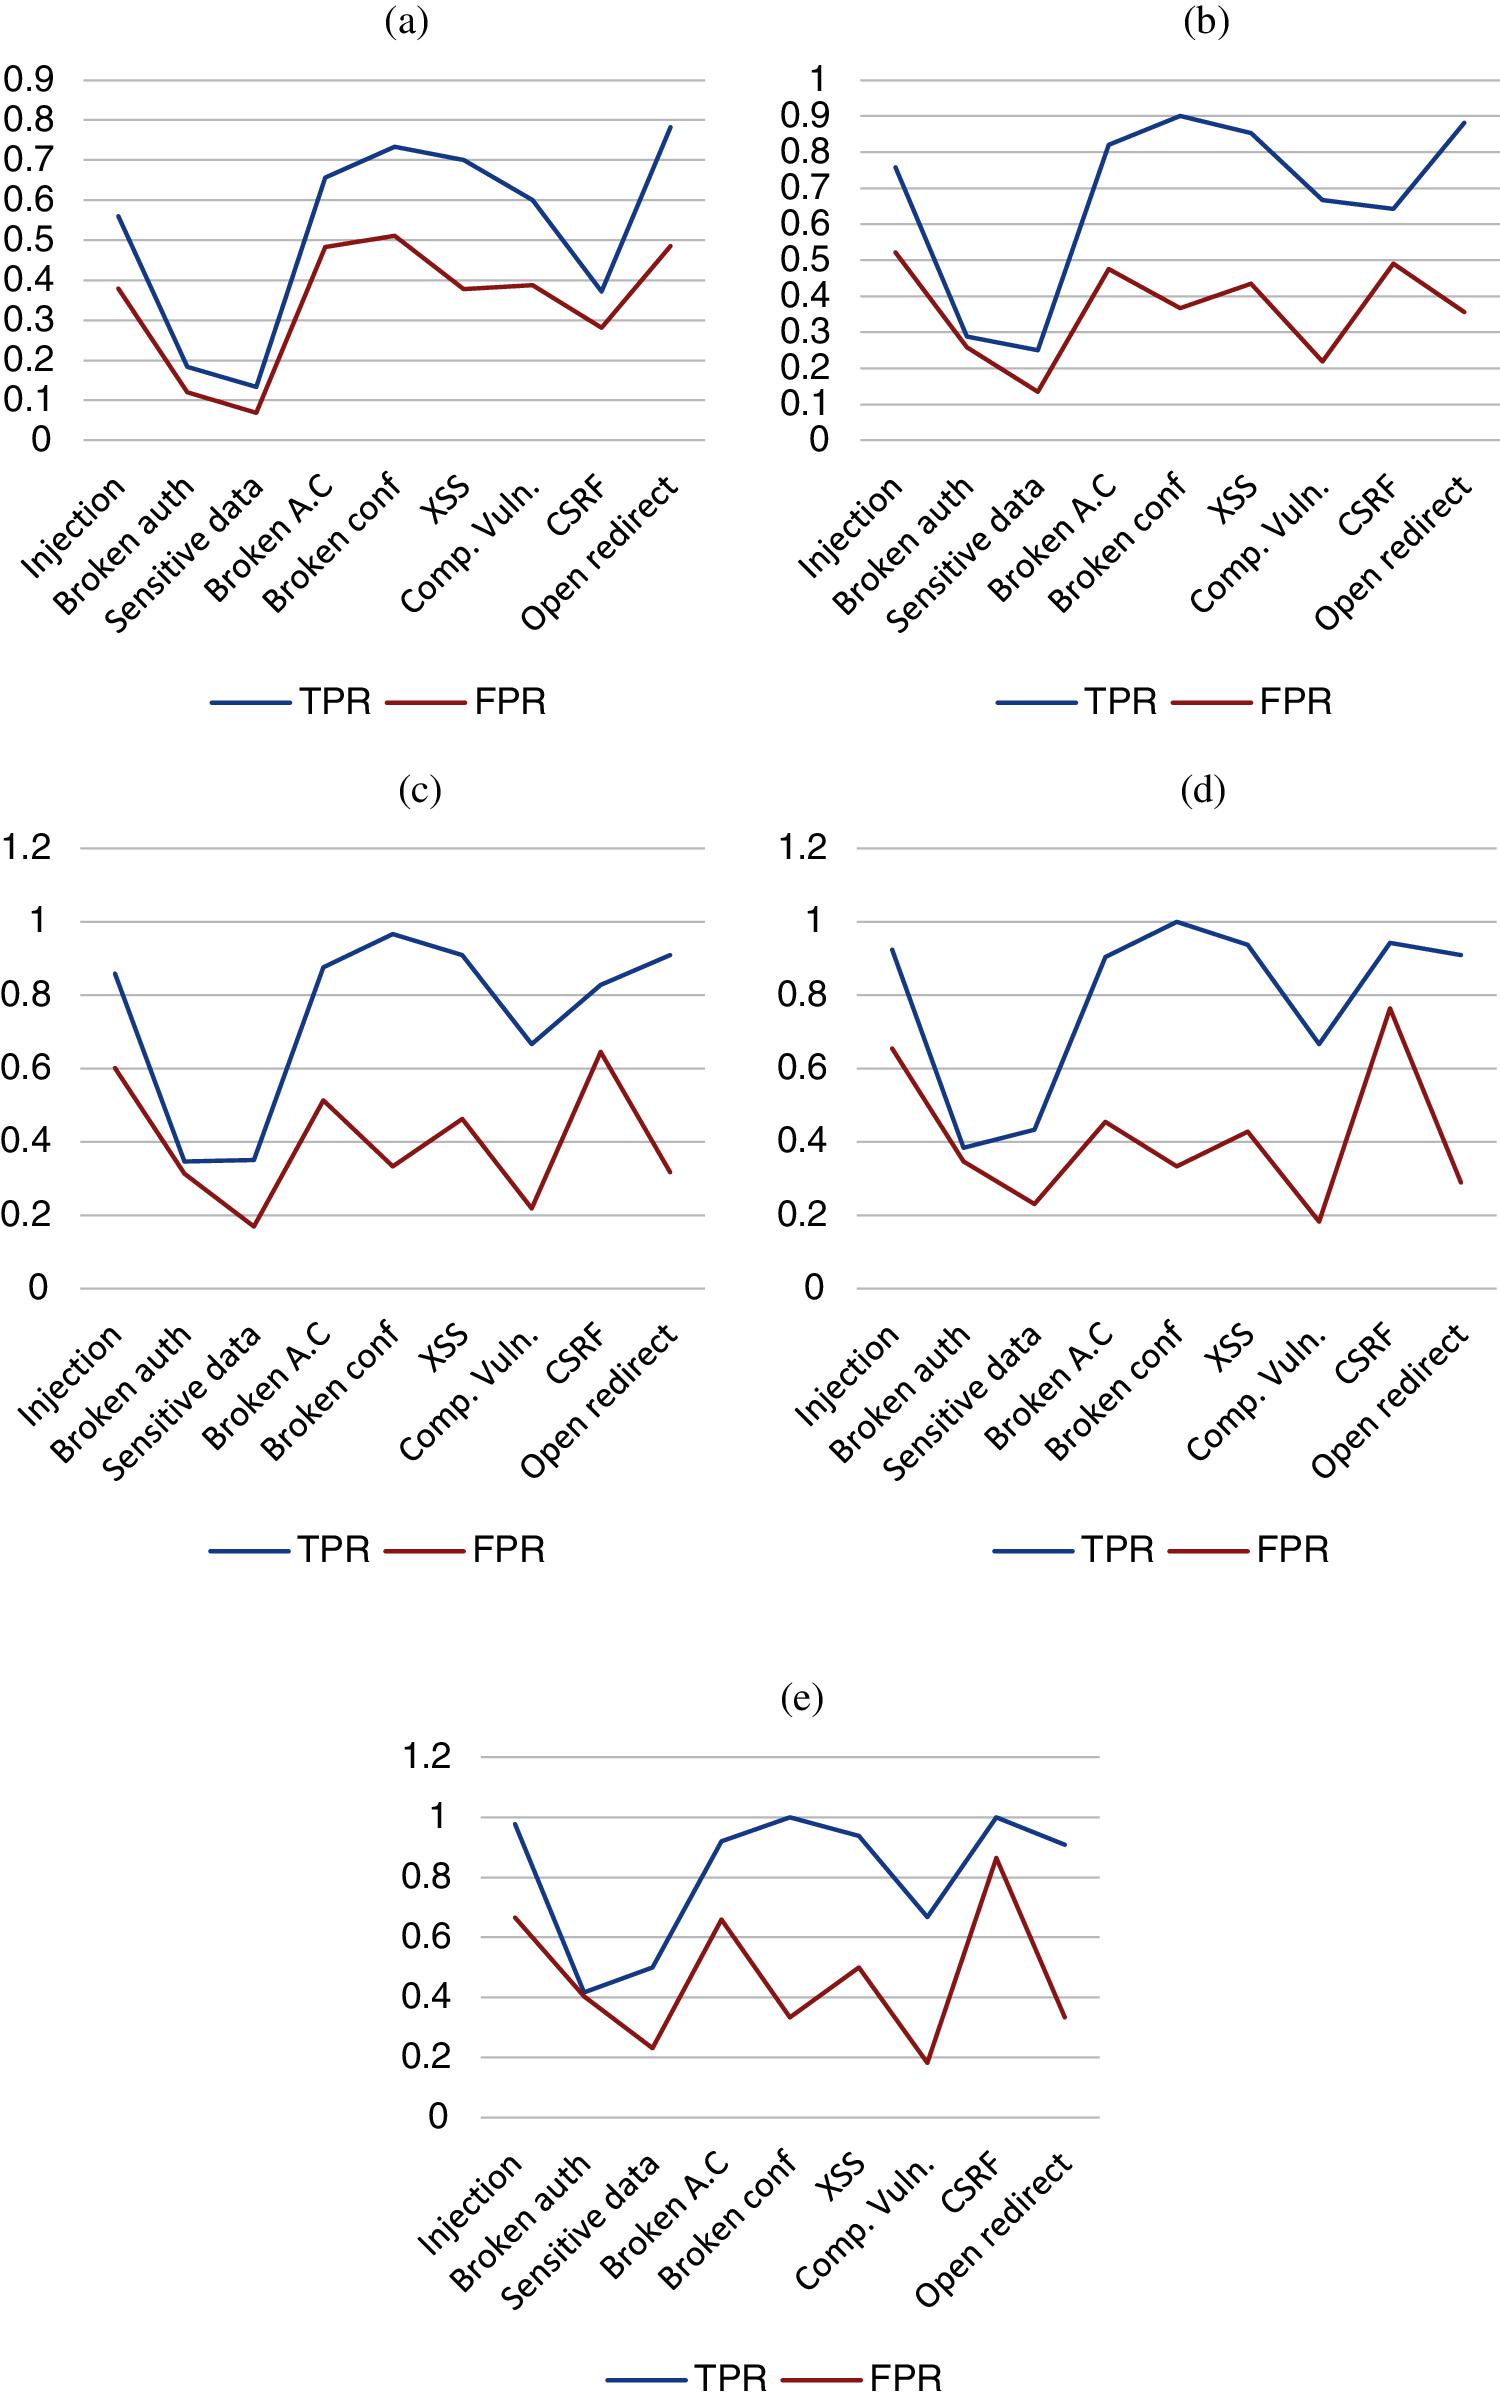
Figure 3: TPR and FPR results obtained by n-tools and weakness classes (a) 1-tools by vulnerablities (b) 2-tools by weaknesses (c) 3-tools by weaknesses (d) 4-tools by weaknesses and (e) 5-tools by weaknesses
In summary, the graphs in Figs. 3 and 4 show how the number of tools included in a combination influences the TPR and FPR ratios. There is always a degree of improvement when a tool is added to a combination, although this degree of improvement in the TPR and FPR ratios is a function of each weakness category and is generally decreasing as a tool is added to the combination. Fig. 2 shows that depending on each security weakness category, the degree of improvement obtained is lower up to combinations of three tools a significant incremental improvement is obtained, but with more than three tools the improvement is generally less significant.
3.5.2 n-SASTT Combinations Average Effectiveness Computing Metrics
Fig. 4 provides a comparative considering the calculation of metric averages for all combinations with a given number of tools: 1-tool, 2-tools, 3-tools, 4-tools and 5-tools. Having int account the average metric precision for n-tools combinations, adding one more tool to the combination fails to improve the balance between TP and FP. However, TPR, FPR, F-measure, F0,5-score and F1,5-score average metrics increase their value in a directly proportional way the higher the number of tools in the combination. By each addition of one more tool to the combination the overall average improvement in detection effectiveness is lower than in (n − 1) and so on for (n + 2) combination, where overall average improvement in detection effectiveness is lower than in (n + 1) with respect to (n).
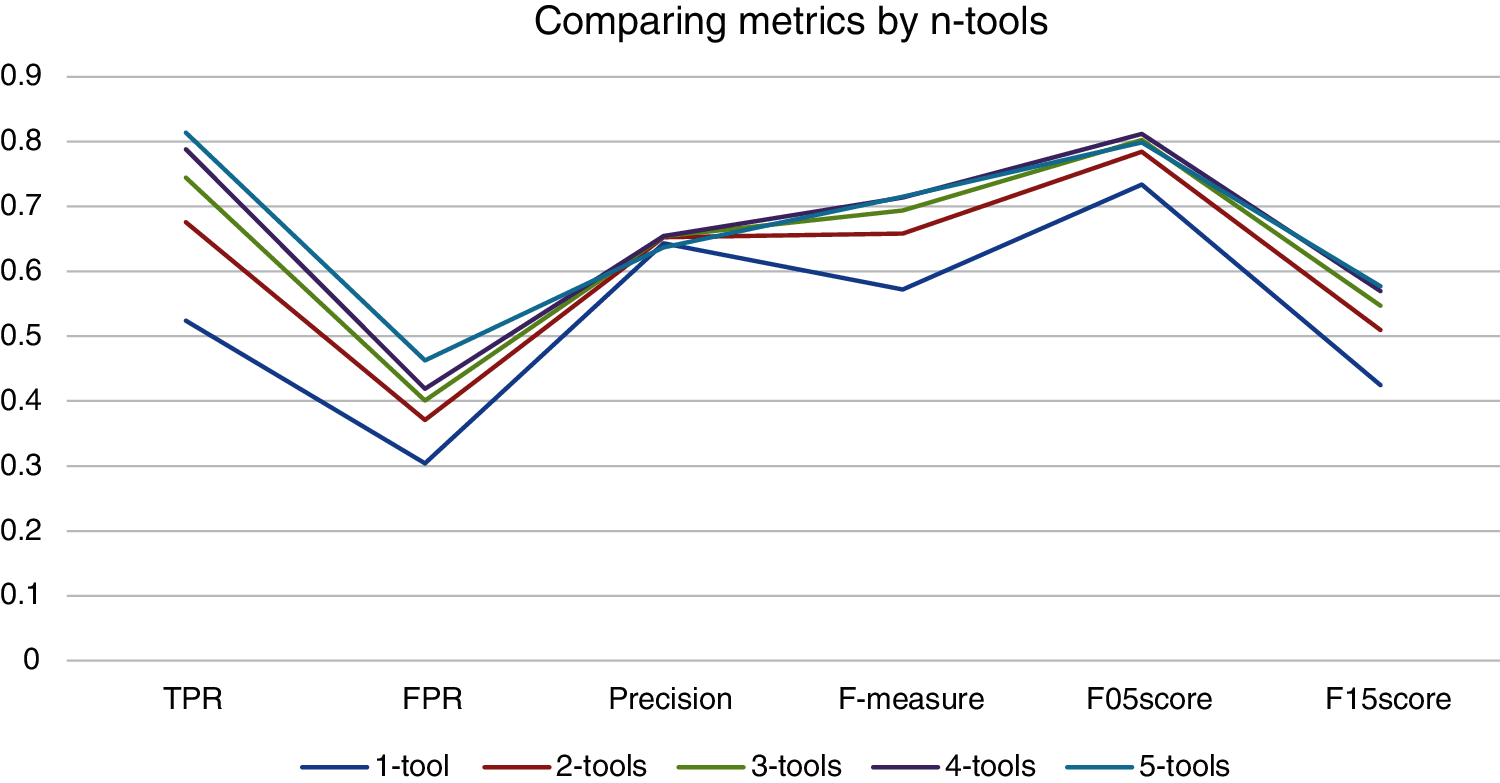
Figure 4: Comparing metrics obtained by n-tools combinations
3.5.3 SASTT Effectiveness for Each n-Tools Combination
Figs. 5–8 give the calculation metrics for tools executed in isolation, 2-toos, 3-tools and 4-tools combinations ordered from left to right by TPR metric having into account each concrete combination. Each metric has a different objective when classifying tools as explained in the Section 4.4. For example, TPR or F1,5-score are more adequate to classify the tools combinations for analyzing high critical applications supposing that there is enough time to discard FP. F-measure is the more appropriate metric for heightened-critical applications because it chooses the tool that finds a high number of weaknesses while providing a low number of FP for an optimum effort. F0,5-score metric rewards on precision and is an appropriate metric for non-critical applications where the construction way be shorter as it permits to favor the tools with better precision. F0,5score and precision are more sufficient for non-critical applications with lesser time to discard FP.
Fig. 5 shows that Fortify has the best TPR but also the worst FPR, also it has the best F1,5-score result. Coverity has the best FPR but the worst TPR. The results of FPR are about 0,200 on average except Fortify that obtains 0,500. The average result of TPR of the four tools is 0,536. FindSecurityBugs has the best precision, F-measure and F0,5-score results because it has good results for TPR and FPR. Fortify has the best F1,5-score result. The order obtained by the tools is similar for TPR and F1,5-score because F1,5-score rewards on TPR metric. The order obtained by the tools is the same for TPR and F1,5-score because F1,5-score rewards on TPR metric. The order obtained by the tools is similar for precision and F0,5-score because F1,5-score rewards on precision metric.
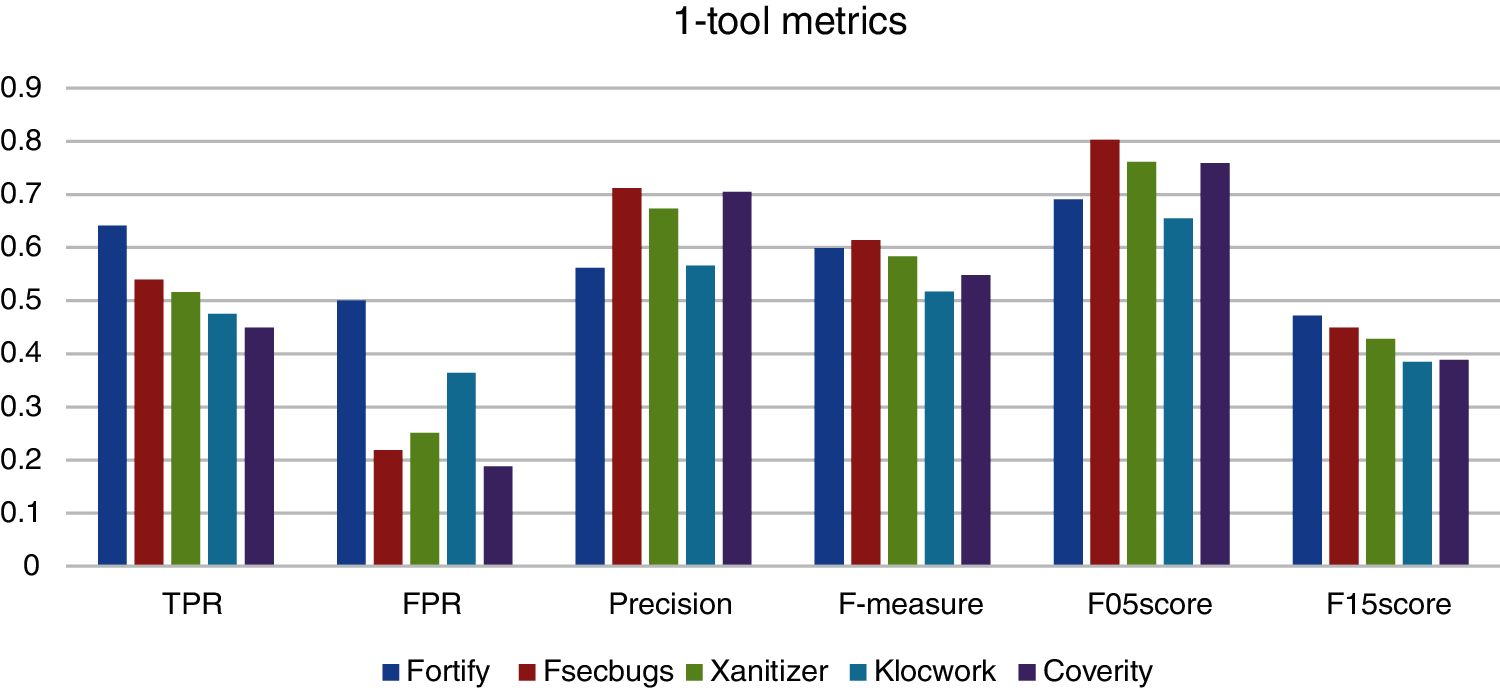
Figure 5: Comparing metrics obtained by tools executed in isolation
It can be seen that each metric obtains a different ranking for each tool. Each of the metrics will be associated to a different security analysis objective that will be analyzed later in Section 3.5.4 according to different levels of criticality of the web applications.
Fig. 6 shows that the combination Xanitizer-Fortify has the best TPR, F-measure and F1,5-score results. The combination Coverity-FindSecurityBugs has the best precision and F0,5-score results. The combination Coverity-Xanitizer has the best FPR result but the worst TPR result. Comparing the metric results of the 1-tools combinations and 2-tools combinations it can be observed the TPR improve between one and two tenths and the FPR results are in the same band.
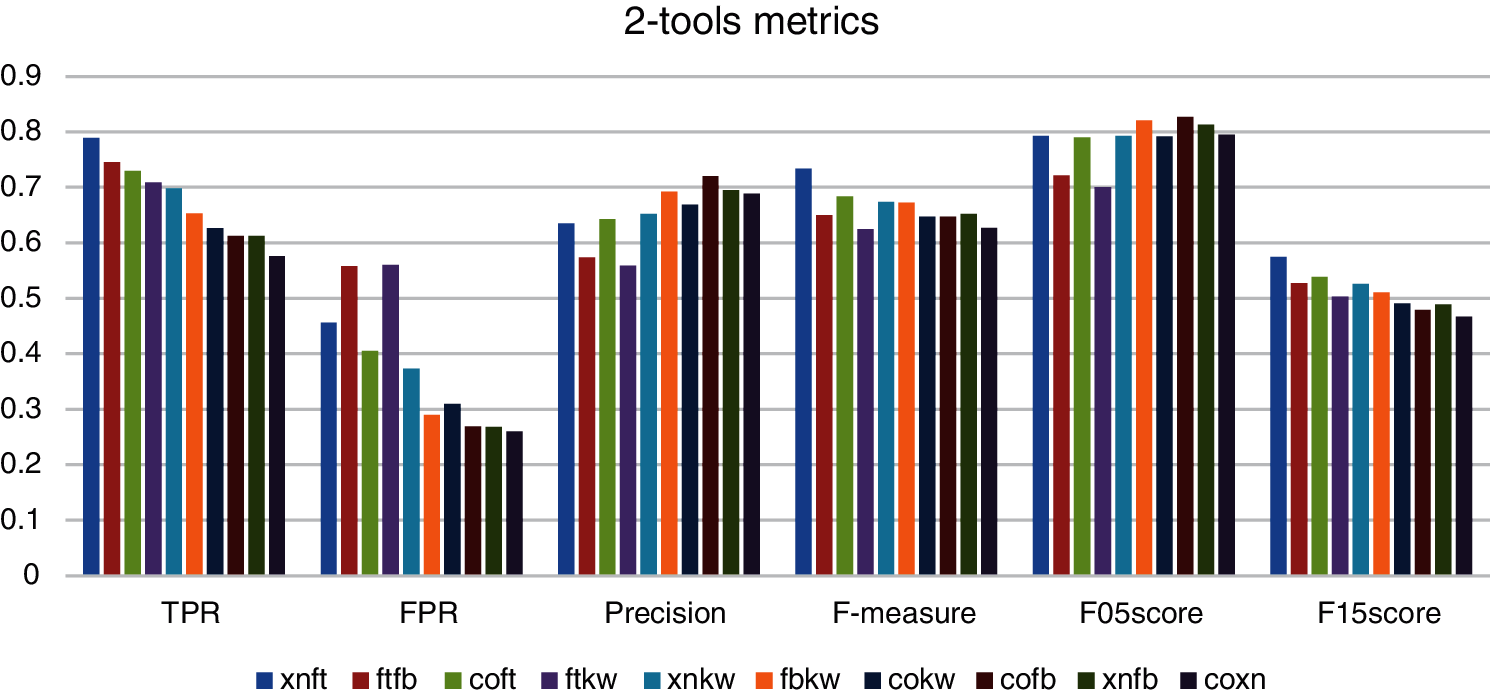
Figure 6: Comparing metrics obtained by 2-tools combinations. Fortify (ft), FindSecBugs (fb), Xanitizer (xn), Coverity (co), Klocwork (kw)
In summary, Fig. 6 that 2-tools combinations generally improve all results metrics except for FPR that are slightly higher than the results of the tools in isolation, which is worse because it yields a higher number of false positives, i.e., there is a small penalty with respect to FPR.
Fig. 7 shows that by combining four and three tools there is hardly any difference when comparing the metrics of the results obtained, only the Coverity-Xanitizer-FindSecurityBugs combination obtains a significantly worse result than those obtained by the other combinations. The results of TPR are better with respect to the one obtained by 2-tools combinations, there are four combinations that almost reach 0,800 score of TPR.
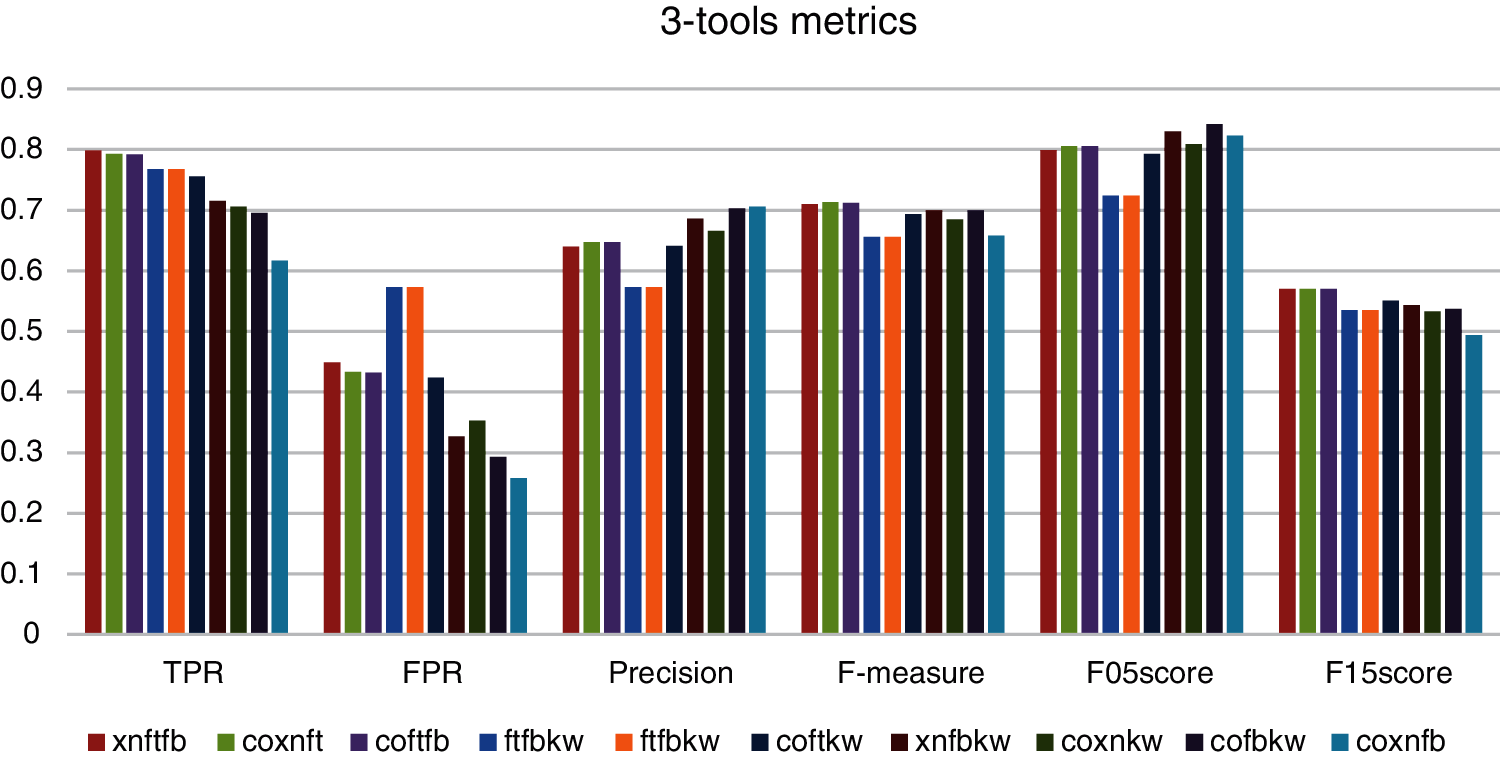
Figure 7: Comparing metrics obtained by 3-tools combinations. Fortify (ft), FindSecBugs (fb), Xanitizer (xn), Coverity (co), Klocwork (kw)
Fig. 8 shows that four combinations reach 0,800. The Coverity-Xanitizer-FindSecurityBugs-Klocwork combination has the best precision and makes it a candidate for evaluating less critical applications where less time is available to audit and eliminate FP. The Coverity-Xanitizer-FindSecurityBugs-Klocwork combination has the best precision and makes it a candidate for evaluating less critical applications where less time is available to audit and eliminate FP. The rest of the combinations yield similar results by combining 4 or 5 tools.
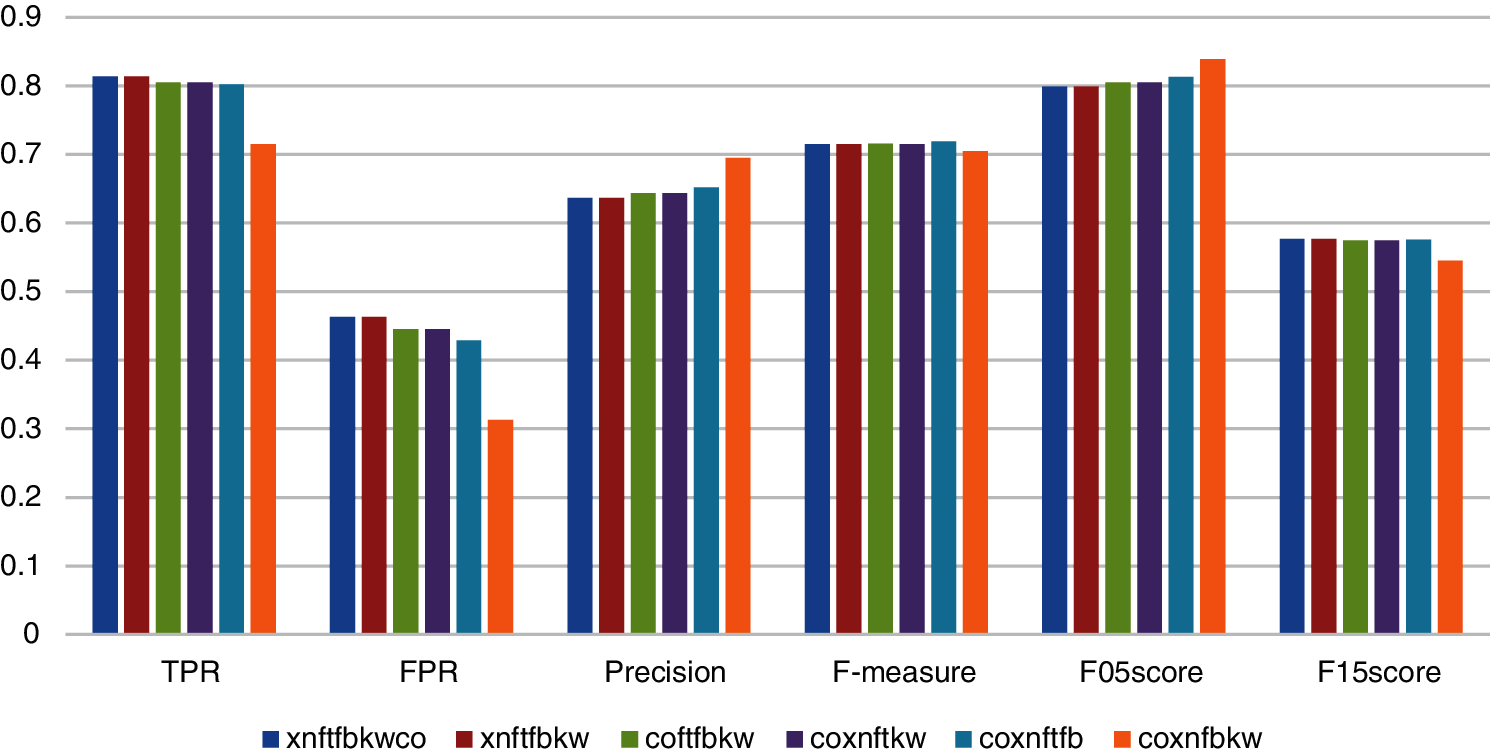
Figure 8: Comparing metrics obtained by 5-tools and 4-tools combinations. Fortify (ft), FindSecBugs (fb), Xanitizer (xn), Coverity (co), Klocwork (kw)
3.5.4 Ranking of n-Tools Combinations by Different Metrics
We develop three cases of the n-tool effectiveness related to F-measure, F0,5-score and Recall metrics and having into account all n-tools combinations. Each metric permits to classify SASTT combinations according to distinct levels of criticality. the Tab. 7 gives the ranking of SASTT combinations by F-measure, TPR and F0,5-score metrics.
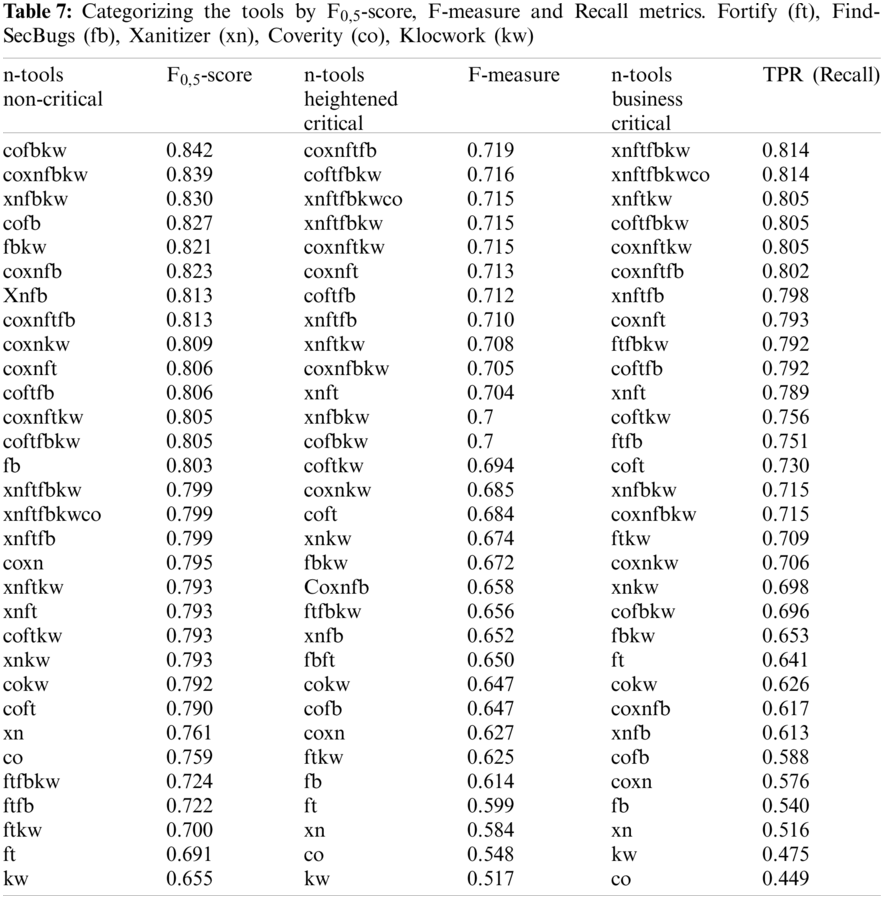
Recall (TPR) metric considers applications categorized as critical. since it shows the capability of a SASTT to find the largest number of weaknesses. Recall (TPR) is the most appropriate metric for crucial applications. since it permits to pick tools with the optimum TP ratio. As alternative to recall. F1,5-score metric can be used as it rewards the tools with better gain than precision metric. The combinations Xanitizer-Fortify-FindsecBugs-Klocwork. Xanitizer-Fortify-FindsecBugs-Klocwork-Coverity and Xanitizer-Fortify-Klocwork have the best results. Xanitizer-Fortify is the best 2-tool combination and Fortify the best tool in isolation. Fig. 9 shows a visualization graphic of the n-tool combinations ranking by Recall metric.
F-measure metric (Tab. 7) has been chosen for heightened-critical WA. This case represents the building and evaluation of not critical application with smaller importance having time constraints to market or may have a conservative budget. F-measure stands for the optimum effort and it indicates that the goal for fewer important WA is to find a large number of TPs with the least the smallest number of FPs. The combinations Coverity-Xanitizer-Fortify-FindsecBugs. Coverity-Fortify-FindsecBugs-Klocwork and Coverity-Fortify-FindsecBugs have the best results. Xanitizer-Fortify is the best 2-tool combination and FindSecBugs the best tool in isolation. Fig. 10 shows a visualization graphic of the n-tool combinations ranking by F-Measure metric.
This case provides for non-critical applications the building and evaluation of applications without relevant information and/or are not exhibited to threats. F0,5-score metric rewards on precision and is appropriate for non-critical applications where the time of development may be shorter. since it permits to favor the tools with better precision. That leads to tools with high precision to get better results. Precision metric can be used as alternative to F0,5-score. The combinations Coverity-FindsecBugs-Klocwork. Coverity-Xanitizer-FindSecBugs-Klocwork and Xanitizer-FindsecBugs-klocwork have the best results. FindSecBugs the best tool in isolation. Fig. 11 shows a visualization graphic of the n-tool combinations ranking by F0,5-score metric.
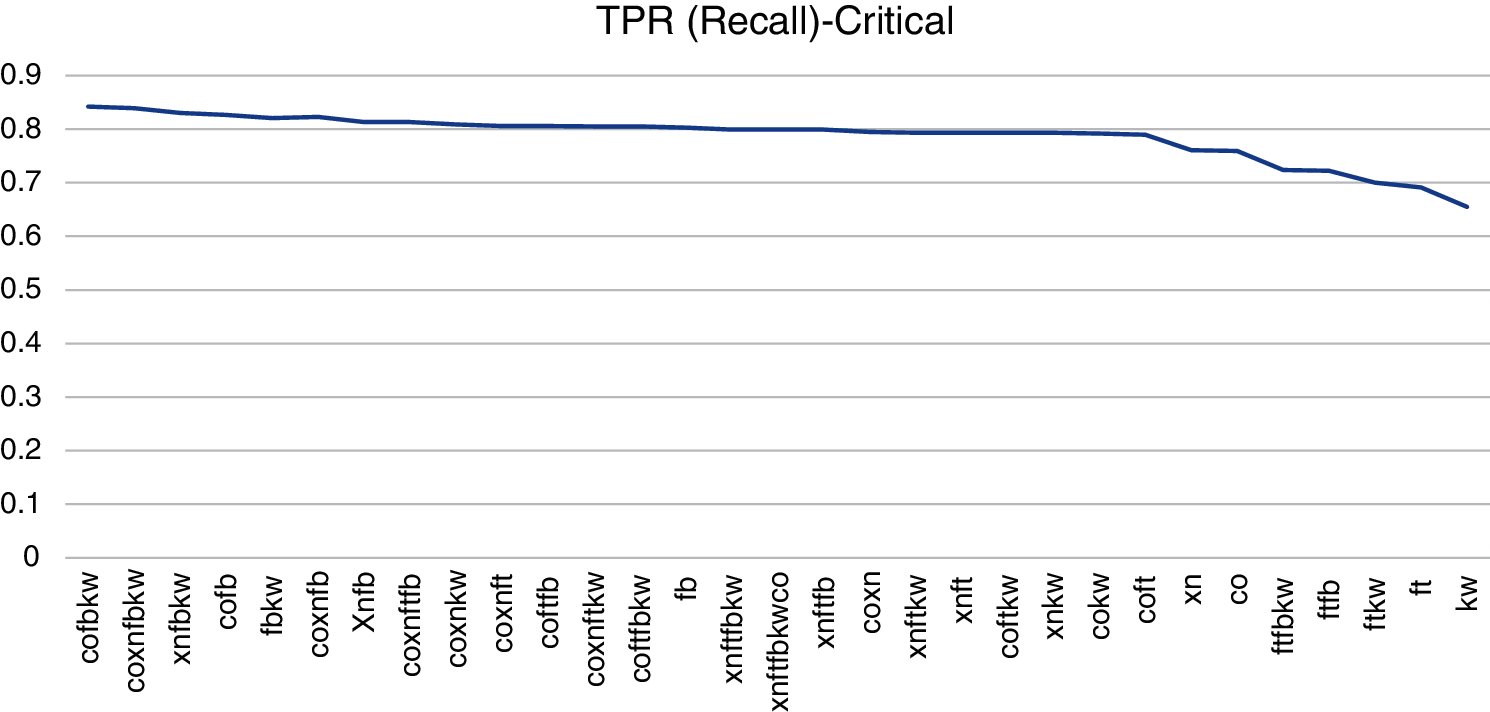
Figure 9: Ranking by TPR (Recall) metric. Fortify (ft). FindSecBugs (fb). Xanitizer (xn). Coverity (co). Klocwork (kw)
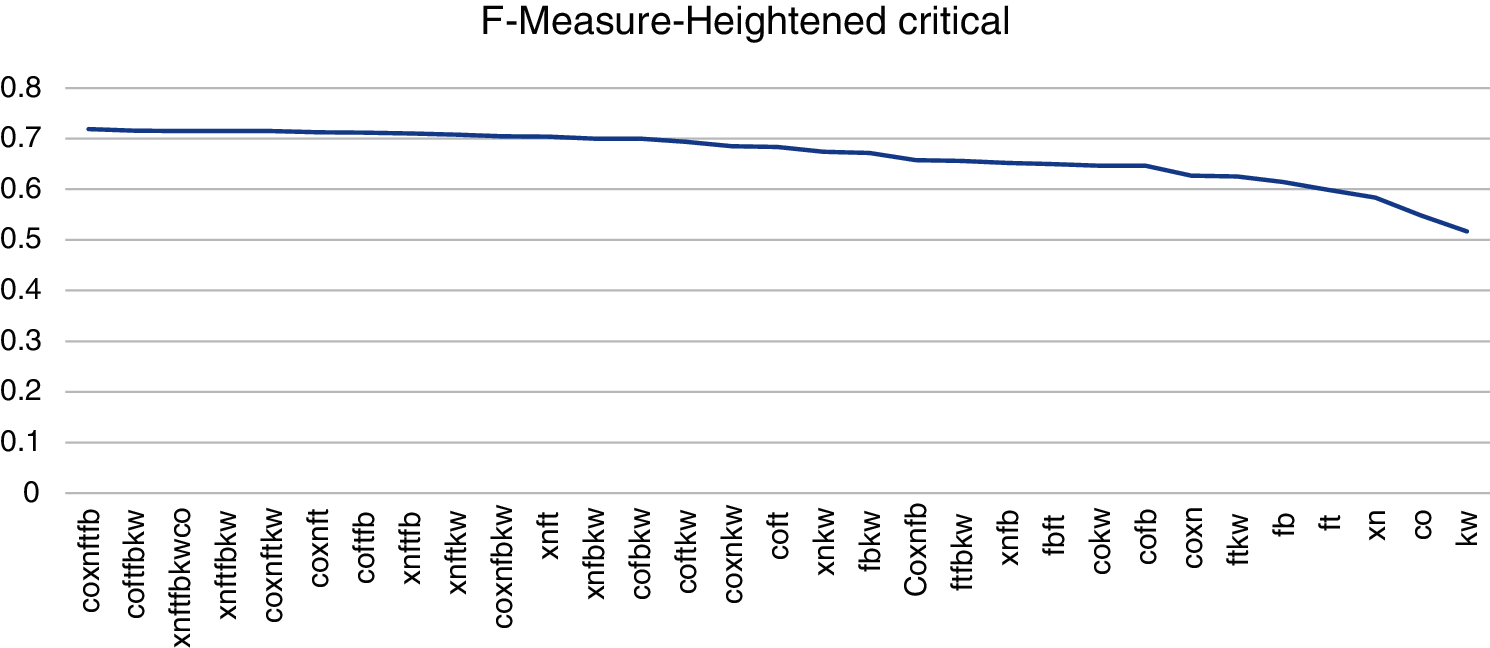
Figure 10: Ranking by F-Measure metric. Fortify (ft). FindSecBugs (fb). Xanitizer (xn). Coverity (co). Klocwork (kw)
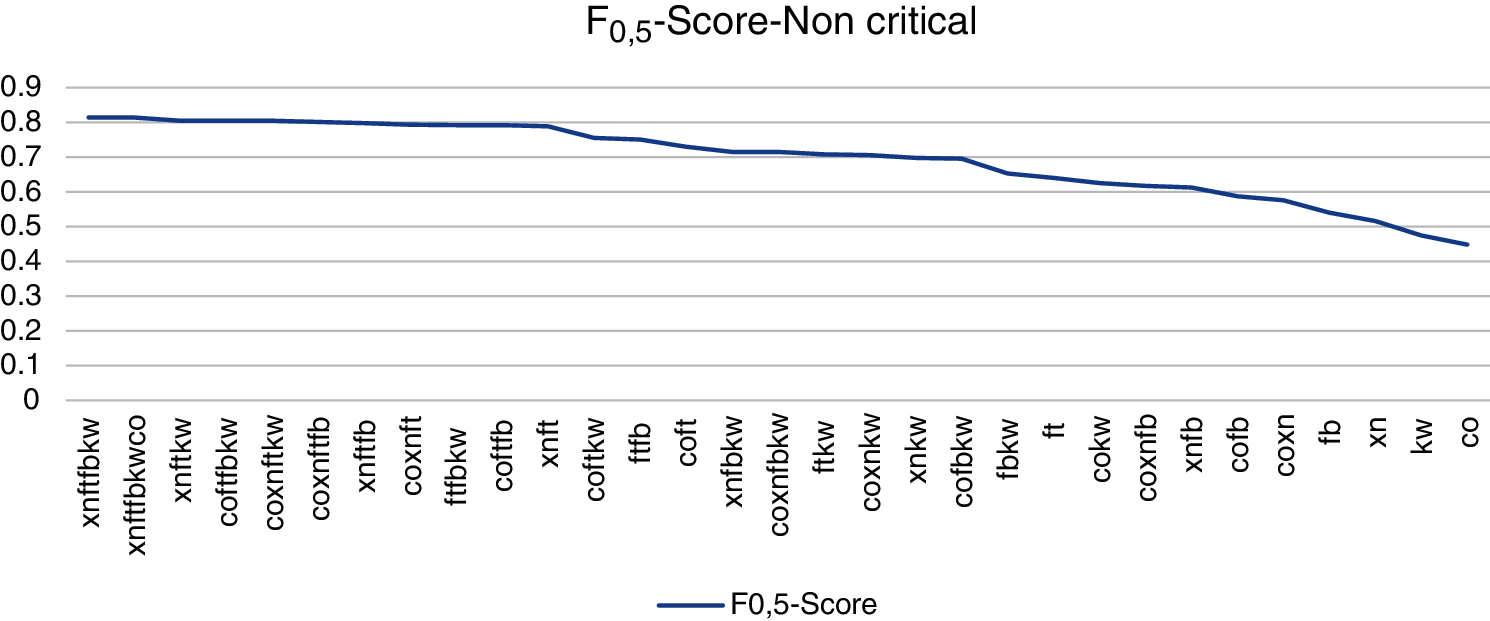
Figure 11: Ranking by F0,5-score metric. Fortify (ft). FindSecBugs (fb). Xanitizer (xn). Coverity (co). Klocwork (kw)
The results show that simply adding more tools in a possible combination is not synonymous with obtaining better results in any of the three classifications. There are combinations with fewer tools. even of a single tool that outperforms combinations with more tools.
3.5.5 OWASP Top Ten Benchmark Suitability
This benchmark provides representativeness of security weaknesses for WA depending on the OWASP TTP and relies on realistic code including distinct source inputs and flow complexity. Besides. it permits to increase number of classes and types of weaknesses making them expandable. It has been updated from its first use in [15]. The benchmark gives similar findings when executing more than once with the same tool. The benchmark is straight forward use even utilizing default tool arrangements giving short run times with the SASTT and is portable to any operative systems containing 4 Gigabytes of RAM memory.
An analysis has been made of how SASTT behaves in combination to improve weakness detection efficiency results when using a single tool. To compare the distinct n-SASTT combinations, we have used an OWASP Top Ten weaknesses benchmarking technique recently constructed for the evaluation of the security performance of SASTT containing a complete of distinct weakness types of test cases in each weakness OWASP Top Ten class. The evaluation uses a new and repeatable approach for assessment and classifying the n-SASTT combinations.
In general, it is better to include more than one tool in combination to obtain better results with respect to the selected metrics. Although this is not always the case according to the results obtained for each metric and combination. Their different designs make it necessary to study how each combination behaves. TPR results of over 0.800 are achieved in combination. The FPR results of the combinations never exceed the worst result obtained by a tool included in the combination in an isolated way without combining. It is necessary an audit phase of the weakness findings performed by a trained user or team for the used WA languages and for a security weakness for each language.
The analysis of the results shows that simply adding more tools in a possible combination is not synonymous with obtaining better results in a classification for the selected metrics. There are combinations with fewer tools, even of a single tool, that outperforms combinations with more tools. The results depend on each concrete combination and the synergies between the SASTT included in a combination.
The evaluation process gives a strict classification of n-SASTT combinations taking into account appropriate and widely acceptable metrics applied to the findings of tools execution vs. chosen benchmark. Besides, the approach ranks the n-tools combinations according to three different metrics for various levels of importance for WA. Four leaders commercial SASTT have been contained in the assessment and ranked giving their findings vs. the new benchmarking technique.
In general, the weakness detections in the classes of weaknesses related to Disclosure of Information in WA source code and Broken Authentication and Sessions are improving for all tools. Changes in WA technologies make necessary alterations in the weakness classes over time. It needs a continuous study to update and adapt the tools to determine the most usual and interesting weakness classes. Hence, OWASP Top Ten must be updated frequently.
This work has evaluated four commercial and one open-source SASTT in combination. It is essential to analyze the behavior of commercial tools in combination with open-source tools to establish differences between then detecting weaknesses in combination and be able to reduce the economic costs when you can include a free tool like FindSecurityBugs which obtains excellent results.
It is important to build new benchmarks for all classes of weaknesses and for mores languages to perform new comparative that assist practitioners and companies choose the optimum SASTT.
We currently study ways to improve SASTT results with machine learning techniques to discover security weaknesses in source code of WA and reducing the false positive ratio. To reach this objective it is necessary to develop a labeled dataset with source code test cases to be trained with diverse machine learning algorithms.
Author Contributions: All authors have equally contributed to this work. All authors read and approved the final manuscript.
Funding Statement: The authors received no specific funding for this study.
Conflicts of Interest: The authors declare that they have no conflicts of interest to report regarding the present study.
1. OWASP Foundation (2017). OWASP top ten 2017. https://www.owasp.org/index.php/Top_10_2017-Top_10. [Google Scholar]
2. Homaei, H., Shahriari, H. R. (2017). Seven years of software weaknesses: The EBB and flow. IEEE Security & Privacy, 15(1), 58–65. DOI 10.1109/MSP.2017.15. [Google Scholar] [CrossRef]
3. Mishra, S., Sharma, S. K., Alowaidi, M. A. (2021). Analysis of security issues of cloud-based web applications. Journal of Ambient Intelligence and Humanized Computing, 12(1), 7051–7062. DOI 10.1007/s12652-020-02370-8. [Google Scholar] [CrossRef]
4. Sołtysik-Piorunkiewicz, A., Krysiak, M. (2020). The cyber threats analysis for web applications security in industry 4.0. In: Hernes, M., Rot, A., Jelonek, D. (Eds.Towards industry 4.0-current challenges in information systems, pp. 127–141. Switzerland: Springer. [Google Scholar]
5. Díaz, G., Bermejo, J. R. (2013). Static analysis of source code security: Assessment of tools against SAMATE tests. Information and Software Technology, 55(8), 1462–1476. DOI 10.1016/j.infsof.2013.02.005. [Google Scholar] [CrossRef]
6. Antunes, N., Vieira, M. (2015). Assessing and comparing weakness detection tools for web services: Benchmarking approach and examples. IEEE Transactions on Services Computing, 8(2), 269–283. DOI 10.1109/TSC.2014.2310221. [Google Scholar] [CrossRef]
7. Shrestha, J. (2013). Static program analysis (Ph.D. Thesis). Uppsala University, Sweden. [Google Scholar]
8. Nunes, P., Medeiros, I., Fonseca, J. C., Neves, N., Correia, M. et al. (2018). Benchmarking static analysis tools for web security. IEEE Transactions on Reliability, 67(3), 1159–1175. DOI 10.1109/TR.2018.2839339. [Google Scholar] [CrossRef]
9. Yoon, J., Jin, M., Jung, Y. (2014). Reducing false alarms from an industrial-strength static analyzer by SVM. Proceedings of the 21st Asia-Pacific Software Engineering Conference, vol. 2, pp. 3–6. DOI 10.1109/APSEC.2014.81. [Google Scholar] [CrossRef]
10. Algaith, A., Nunes, P., Fonseca, J., Gashi, I., Viera, M. (2018). Finding SQL injection and cross site scripting weaknesses with diverse static analysis tools. 14th European Dependable Computing Conference. Iasi, Romania. [Google Scholar]
11. Nunes, P., Medeiros, I., Fonseca, J. C., Neves, N., Correia, M. et al. (2019). An empirical study on combining diverse static analysis tools for web security weaknesses based on development scenarios. Computing, 101(2), 161–185. DOI 10.1007/s00607-018-0664-z. [Google Scholar] [CrossRef]
12. Monga, M., Paleari, R., Passerini, E. (2009). A hybrid analysis framework for detecting web application weaknesses. Proceedings of the 5th International Workshop on Software Engineering for Secure Systems, pp. 25–32. Washington, USA. [Google Scholar]
13. Bermejo, J., Abad, C., Bermejo, J. R., Sicilia, M. A., Sicilia, J. A. (2020). The application of a new secure software Systematic approach to malware analysis (SAMA). Applied Sciences, 10(4), 1360. DOI 10.3390/app10041360. [Google Scholar] [CrossRef]
14. Vicente, J., Bermejo, J., Bermejo, J. R., Sicilia, J. A. (2019). Development life cycle (S-SDLC) with agile methodologies. Electronics, 8(11), 1218. DOI 10.3390/electronics8111218. [Google Scholar] [CrossRef]
15. Bermejo, J. R., Bermejo, J., Sicilia, J. A., Cubo, J., Nombela, J. J. (2020). Benchmarking approach to compare web applications static analysis tools detecting OWASP top ten security weaknesses. Computers, Materials & Continua, 64(3), 1555–1577. DOI 10.32604/cmc.2020.010885. [Google Scholar] [CrossRef]
16. Bermejo, J. R. (2020). OWASP Top Ten-benchmark. https://github.com/jrbermh/OWASP-Top-Ten-Benchmark. [Google Scholar]
17. Nanz, S., Furia, C. A. (2015). A comparative study of programming languages in rosetta code. Proceedings of the 37th International Conference on Software Engineering, pp. 778–788. Florence, Italy. [Google Scholar]
18. Arouba, S. B., Fernández-Villaverde, J. (2015). A comparison of programming languages in macroeconomics. Journal of Economic Dynamics and Control, 58(10), 265–273. DOI 10.1016/j.jedc.2015.05.009. [Google Scholar] [CrossRef]
19. Cannings, R., Dwivedi, H., Lackey, Z. (2008). Hacking exposed web applications: Web 2.0 security secrets and solutions. USA: McGraw Hill. [Google Scholar]
20. Scambray, J., Liu, V., Sima, C. (2010). Hacking exposed web applications, vol. 3. USA: McGraw-Hill. [Google Scholar]
21. Sema, M. (2012). Hacking web apps detecting and preventing web application security problems. Netherlands: Elsevier. [Google Scholar]
22. Moeller, J. P. (2016). Security for web developers: Using Javascript. HTML and CSS. Sebastopol, Russia: O’Reilly Media. [Google Scholar]
23. Al-Amin, S., Ajmeri, N., Du, H., Berglund, E. Z., Singh, M. P. (2018). Toward effective adoption of secure software development practices. Simulation Modelling Practice and Theory, 85(2), 33–46. DOI 10.1016/j.simpat.2018.03.006. [Google Scholar] [CrossRef]
24. Long, F., Mohindra, D., Seacord, R. C., Sutherland, D. F., Svoboda, D. (2014). JavaTM coding guidelines: 75 recommendations for reliable and secure programs. Boston, USA: Pearson Education. [Google Scholar]
25. Huth, M., Nielsen, F. (2019). Static analysis for proactive security. Computing and software science, pp. 374–392. Switzerland: Springer. [Google Scholar]
26. Li, J. (2020). Weaknesses mapping based on OWASP-SANS: A survey for static application security testing (SAST). Annals of Emerging Technologies in Computing, 4(3), 1–8. DOI 10.33166/AETiC.2017.10.01. [Google Scholar] [CrossRef]
27. Felderer, M., Büchler, M., Johns, M., Brucker, A. D., Breu, R. et al. (2016). Security testing: A survey. Advances in computers. Cambridge, USA: Elsevier. [Google Scholar]
28. Sipser, M. (2006). Introduction to the theory of computation. Second edition. Boston, USA: Thomson Course Technology. [Google Scholar]
29. Balachandran, V. (2013). Reducing human effort and improving quality in peer code reviews using automatic static analysis and reviewer recommendation. Proceedings of the 2013 International Conference on Software Engineering, pp. 931–940. San Francisco, USA. [Google Scholar]
30. Duclervil, S. R., Liou, J. C. (2019). The study of the effectiveness of the secure software development life-cycle models in IT project management. 16th International Conference on Information Technology-New Generations, pp. 91–96. Las Vegas, USA. [Google Scholar]
31. Yang, J., Tan, L., Peyton, J., Duer, K. A. (2019). Towards better utilizing static application security testing. Proceedings of the 41st International Conference on Software Engineering: Software Engineering in Practice, pp. 51–60. Montreal, Canada. [Google Scholar]
32. Antunes, N., Vieira, M. (2010). Benchmarking weakness detection tools for web services. Proceeding of the 2010 IEEE International Conference on Web Service, pp. 203–210. Miami, USA. [Google Scholar]
33. Fromherz, A., Ouadjaout, A., Miné, A. (2018). Static value analysis of python programs by abstract interpretation. In: Dutle, A., Muñoz, C., Narkawicz, A. (Eds.NASA formal methods, pp. 185–202. Switzerland: Springer. [Google Scholar]
34. Urban, C., Ueltschi, S., Müller, P. (2018). Abstract interpretation of CTL properties. Static Analysis Symposium, vol. 11002, pp. 402–422. DOI 10.1007/978-3-319-99725-4. [Google Scholar] [CrossRef]
35. Oortwijn, W., Gurov, D., Huisman, M. (2020). An abstraction technique for verifying shared-memory concurrency. Applied Sciences, 10(11), 3928. DOI 10.3390/app10113928. [Google Scholar] [CrossRef]
36. Ferrara, P., Olivieri, L., Spoto, F. (2020). BackFlow: Backward context-sensitive flow reconstruction of taint analysis results. In: Beyer, D., Zufferey, D. (Eds.Verification, model checking, and abstract interpretation, pp. 23–43. Switzerland: Springer. [Google Scholar]
37. Khan, W., Kamran, M., Ahmad, A., Khan, F. A., Derhab, A. (2019). A formal analysis of language-based android security using theorem proving approach. IEEE Access, 7, 16550–16560. DOI 10.1109/ACCESS.2019.2895261. [Google Scholar] [CrossRef]
38. Biere, A., Kröning, D. (2018). SAT-based model checking. In: Henzinger, E., Veith, T., Bloem, H., (Eds.Handbook of model checking, pp. 277–303. Switzerland: Springer. [Google Scholar]
39. Beyer, D., Gulwani, S., Schmidt, D. A. (2018). Combining model checking and data-flow analysis. In: Clarke, E., Henzinger, T., Veith, H., Bloem, R. (Eds.Handbook of model checking, pp. 493–540. Switzerland: Springer. [Google Scholar]
40. Nielson, F., Nielson, H. R., Zhang, F. (2019). Multi-valued logic for static analysis and model checking. In: Margaria, T., Graf, S., Larsen, K. (Eds.Models, mindsets, meta: The what, the how, and the why not? pp. 89–109. Switzerland: Springer. [Google Scholar]
41. Mongiovi, M., Giannone, G., Fornaia, A., Pappalardo, G., Tramontana, E. (2015). Combining static and dynamic data flow analysis: A hybrid approach for detecting data leaks in Java applications. Proceedings of the 30th Annual ACM Symposium on Applied Computing, pp. 1573–1579. New York, USA. [Google Scholar]
42. Loch, F. D., Johns, M., Hecker, M., Mohr, M., Snelting, G. (2020). Hybrid taint analysis for java EE. Proceedings of the 35th Annual ACM Symposium on Applied Computing, pp. 1716–1725. New York, USA. [Google Scholar]
43. Pistoia, M., Tripp, O., Lubensky, D. (2018). Combining static code analysis and machine learning for automatic detection of security weaknesses in mobile apps. Application Development and Design: Concepts, Methodologies, Tools and Applications, 1, 68–94. DOI 10.4018/978-1-5225-0945-5.ch004. [Google Scholar] [CrossRef]
44. Pereira, J. D., Campos, J. R., Vieira, M. (2019). An exploratory study on machine learning to combine security weakness alerts from static analysis tools. 9th Latin-American Symposium on Dependable Computing, pp. 1–10. Natal, Brazil. [Google Scholar]
45. Nguyen, L., Quang, Do., Wright, J., Ali, K. (2020). Why do software developers use static analysis tools? A user-centered study of developer needs and motivations. IEEE Transactions on Software Engineering, 1, 1–2. DOI 10.1109/TSE.2020.3004525. [Google Scholar] [CrossRef]
46. Muske, T., Serebrenik, A. (2020). Techniques for efficient automated elimination of false positives. IEEE 20th International Working Conference on Source Code Analysis and Manipulation, pp. 259–263. Adelaide, Australia. [Google Scholar]
47. Ye, T., Zhang, L., Wang, L., Li, X. (2016). An empirical study on detecting and fixing buffer overflow bugs. IEEE International Conference on Software Testing, Verification and Validation, pp. 91–101. Chicago, USA. [Google Scholar]
48. Xypolytos, A., Xu, H., Vieira, B., Ali-Eldin, A. (2017). A framework for combining and ranking static analysis tool findings based on tool performance statistics. Software Quality, Reliability and Security Companion, 1, 595–596. DOI 10.1109/QRS-C.2017.110. [Google Scholar] [CrossRef]
49. Ferrara, P., Spoto, F. (2018). Static analysis for GDPR compliance. Proceedings of the Second Italian Conference on Cyber Security, pp. 1–10. Milan, Italy. [Google Scholar]
50. Flynn, L., Snavely, W., Svoboda, D., VanHoudnos, N., Qin, R. et al. (2018). Prioritizing alerts from multiple static analysis tools. using classification models. Proceedings of the 1st International Workshop on Software Qualities and Their Dependencies, pp. 13–20. Gothenburg, Sweden. [Google Scholar]
51. Vassallo, C., Panichella, S., Palomba, F., Proksch, S., Zaidman, A. et al. (2018). Context is king: The developer perspective on the usage of static analysis tools. IEEE 25th International Conference on Software Analysis, pp. 38–49. Campobasso, Italy. [Google Scholar]
52. Alavi, S., Bessler, N., Massoth, M. (2018). A comparative evaluation of automated weakness scans vs. manual penetration tests on false-negative errors. The Third International Conference on Cyber-Technologies and Cyber-Systems, pp. 1–6, Athens, Greece. [Google Scholar]
53. Idrissi, S. E., Berbiche, N., Sbihi, M. (2017). Performance evaluation of web application security scanners for prevention and protection against weaknesses. International Journal of Applied Engineering Research, 12(21), 11068–11076. https://www.ripublication.com/ijaer17/ijaerv12n21_76.pdf. [Google Scholar]
54. Livshits, B. V., Lam, M. S. (2005). Finding security weaknesses in java applications with static analysis. Proceedings of the 14th Conference on USENIX Security Symposium, pp. 18–36. Berkeley, USA. [Google Scholar]
55. Martin, B., Livshits, B., Lam, M. S. (2005). Finding application errors and security flaws using PQL: A program query language. 20th Annual ACM Conference on Object-Oriented Programming, Systems, Languages and Applications, pp. 365–383. California, USA. [Google Scholar]
56. Krishnan, M., Nadworny, N., Bharill, N. (2008). Static analysis tools for security checking in code at motorola. ACM SIGAda Ada Letters, 28(1), 76–82. DOI 10.1145/1387830.1387833. [Google Scholar] [CrossRef]
57. Cifuentes, C., Scholz, B. (2008). Parfait-designing a scalable bug checker. Proceedings of the 2008 Workshop on Static Analysis. pp. 4–11, New York, USA. [Google Scholar]
58. Correa, R. A., Ramón, J., Higuera, J. B., Antonio, J., Rubio, M. S. et al. (2021). Hybrid security assessment methodology for web applications. Computer Modeling in Engineering & Sciences, 126(1), 89–124. [Google Scholar]
59. Goseva-Popstojanova, K., Perhinschi, A. (2015). On the capability of static code analysis to detect security weaknesses. Information and Software Technology, 68(1), 18–33. DOI 10.1016/j.infsof.2015.08.002. [Google Scholar] [CrossRef]
60. OWASP Foundation (2020). OWASP benchmark project. https://www.owasp.org/index.php/Benchmark. [Google Scholar]
61. Pashchenko, I., Dashevskyi, S., Massacci, F. (2017). Delta-bench: Differential benchmark for static analysis security testing tools. Proceedings of the 11th ACM/IEEE International Symposium on Empirical Software Engineering and Measurement, pp. 163–168. Toronto, Canada. [Google Scholar]
62. Heckman, S., Williams, L. (2011). A systematic literature review of actionable alert identification techniques for automated static code analysis. Information and Software Technology, 53(4), 363–387. DOI 10.1016/j.infsof.2010.12.007. [Google Scholar] [CrossRef]
63. Antunes, N., Vieira, M. (2015). On the metrics for benchmarking weakness detection tools. 45th Annual IEEE/IFIP International Conference on Dependable Systems and Networks, pp. 505–516. Brazil: Rio de Janeiro. [Google Scholar]
 | This work is licensed under a Creative Commons Attribution 4.0 International License, which permits unrestricted use, distribution, and reproduction in any medium, provided the original work is properly cited. |