| Computer Modeling in Engineering & Sciences |
DOI: 10.32604/cmes.2021.017360
ARTICLE
Empirical Thermal Investigation of Oil–Immersed Distribution Transformer under Various Loading Conditions
School of Electrical Engineering, Xi'an Jiaotong University, Xi'an, 710049, China
*Corresponding Author: Syed Ali Raza. Email: razasyedali@stu.xjtu.edu.cn
Received: 06 May 2021; Accepted: 06 July 2021
Abstract: The distribution transformer is the mainstay of the power system. Its internal temperature study is desirable for its safe operation in the power system. The purpose of the present study is to determine direct comprehensive thermal distribution in the distribution transformers for different loading conditions. To achieve this goal, the temperature distribution in the oil, core, and windings are studied at each loading. An experimental study is performed with a 10/0.38 kV, 10 kVA oil–immersed transformer equipped with forty–two PT100 sensors (PTs) for temperature measurement installed inside during its manufacturing process. All possible locations for the hottest spot temperature (HST) are considered that made by finite element analysis (FEA) simulation and losses calculations. A resistive load is made to achieve 80% to 120% loading of the test transformer for this experiment. Working temperature is measured in each part of the transformer at all provided loading conditions. It is observed that temperature varies with loading throughout the transformer, and a detailed map of temperature is obtained in the whole test transformer. From these results, the HST stays in the critical section of the primary winding at all loading conditions. This work is helpful to understand the complete internal temperature layout and the location of the HST in distribution transformers.
Keywords: Distribution transformer; direct temperature measurement; sensor location; loading conditions; hottest spot temperature; thermal distribution
The communal area has its dedicated distribution transformer. Failure of the distribution transformer may lead to an outage of electricity [1,2]. The distribution transformer is the most important component of the secondary distribution system, thus, its reliability is essential for the continuous supply of electricity to the consumers [3]. The distribution transformers face variable loading conditions and sometimes undergo high emergency loading conditions to meet supply demand during their operational life [4]. Its breakdown due to fatigue might lead to power cuts and may also cause environmental risks along with revenue loss [5]. The major effect of over–loadings on the distribution transformer is the rise in its operating temperature and it is more likely to bring a fault that can damage the transformer [6,7]. Moreover, every 6°C rise in temperature above the safe HST value would reduce its life by half [8]. Therefore, it is very significant to predict the temperature distribution and the location of the HST in the distribution transformers [9].
Direct measurement is a pronounced scheme to find out the real thermal distribution [10]. Direct methods utilize either sensor systems or thermography [11]. Optical fiber sensors and PT100 (PTs) were two commonly used sensors installed inside the transformers to measure online temperature. In [12], the temperature was monitored online at few points with optical fiber sensors that were placed in the bottom–oil, top–oil, and windings. Similar work had been done to monitor the temperature of the windings with only two optical fiber sensors with modifications on the existing probes, making a ruggedized design [13]. In another study [14], the number of optical fiber sensors was increased up to 24, out of which 18 were placed in the windings and 8 in the oil to examine the temperature changes with respect to loading conditions. However, the optical fiber sensors are not suitable for the distribution transformers because they are expensive and fragile [15]. In [16], the temperature distribution and the HST variations in the transformer were studied by using PTs. The PTs have been used in the distribution transformer applications either as a reference sensor or for validation purposes [17–20]. Various researchers have utilized PTs with special insulation coatings for temperature measurement in the power equipment [21–23]. In the past studies, sensor locations were identical but the only difference lied in the number of installed sensors [24]. In an experimental study, it was found that the energized core temperature played a significant role in condition monitoring of the electrical equipment [25]. Therefore, For the purpose of obtaining a full image of thermal distribution, all the possible locations in the oil, core, and windings of the distribution transformer should be considered for the prediction of HST [26].
Although sensors are not a part of the transformer design yet the selection of appropriate locations and insulation of the sensors are key factors at the designing stage [27]. Some studies dealt with electric field stresses on the insulation materials for their breakdown under impulse voltage inside the distribution transformers using electromagnetic simulation [28–30]. To counter insulation failure, sensors should be compatible with the distribution transformer with respect to their insulation.
The main focus of this study is to examine the direct temperature distribution of a 10 kVA oil–immersed distribution transformer at different loading conditions by a direct measurement scheme. PTs with Teflon–epoxy nano–composite coatings are selected in the present study because of their good surface insulation performance. Detailed experiments have been performed by using the test transformer equipped with the PTs at different loading conditions. Based on the data collected from PTs, this study presents a strategy to investigate the comprehensive real–time temperature distribution in the oil, core and windings. The HST has been found in the test transformer at each loading condition and FEA simulations are carried out to verify the experimental data. This paper provides a firm ground for further studies on direct thermal investigation of HST using a minimum number of sensors. This research also leads towards the customizability of the PTs to make them applicable with safe insulation and shielding compatibility in all kinds of distribution transformers.
2 Design of Experimental Setup and Procedures
The primary aim of this work is to measure the temperature directly in the distribution transformer at different loading conditions. A special–purpose transformer equipped with forty–two PTs is designed for this study. PTs are installed inside the test transformer at the locations determined by the FEA simulation. A variable resistive load bank is made to achieve different loading levels. The following subsections describe the details on FEA thermal simulations, test transformer design, and the positions to install the PTs.
2.1 Experimental Test Transformer
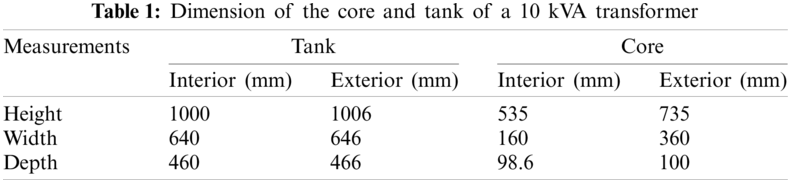
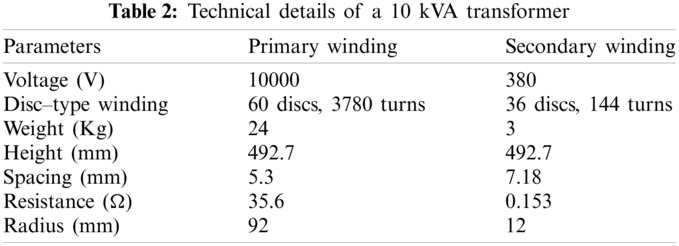
A 10 kVA single–phase disc–type 10/0.38 kV oil–immersed transformer is designed for this empirical analysis. The dimensions of the experimental transformer are the same as that of the model used for the FEA simulations. In total, 42 PT100 (23 PTs for windings, 10 PTs on core surface and 9 PTs are distributed in oil from top to bottom) are installed in the test transformer for online temperature monitoring. The transformer has a hole at the top for the passage of PTs wires to connect them to the device XSL–8000. The device XSL–8000 shows the digital temperature across each sensor. The dimensions of the core and tank are given in Tab. 1, while specifications of the test transformer are provided in Tab. 2.
2.2 Electromagnetic Fields and Thermal Analysis
The FEA simulations have been performed to compute the B and E fields. Core losses are calculated by B field model in transient solution type. The E field is calculated in the electric–transient solution type. Maxwell's equations are solved to calculate electric field for electric–transient solutions and magnetic field for transient solution problems using FEA simulation in ANSYS Maxwell. The set of Maxwell's equations is given below:
where t is the time, ρ is the electric charge density, E is the electric field intensity, B is magnetic flux density, H is magnetic field intensity, J is the electric current density, and D is the electric flux density or electric displacement. In the above equations D, B and J are defined as:
where
where Vp and Vs are primary and secondary voltages, respectively; f is frequency (50 Hz) and t is time.
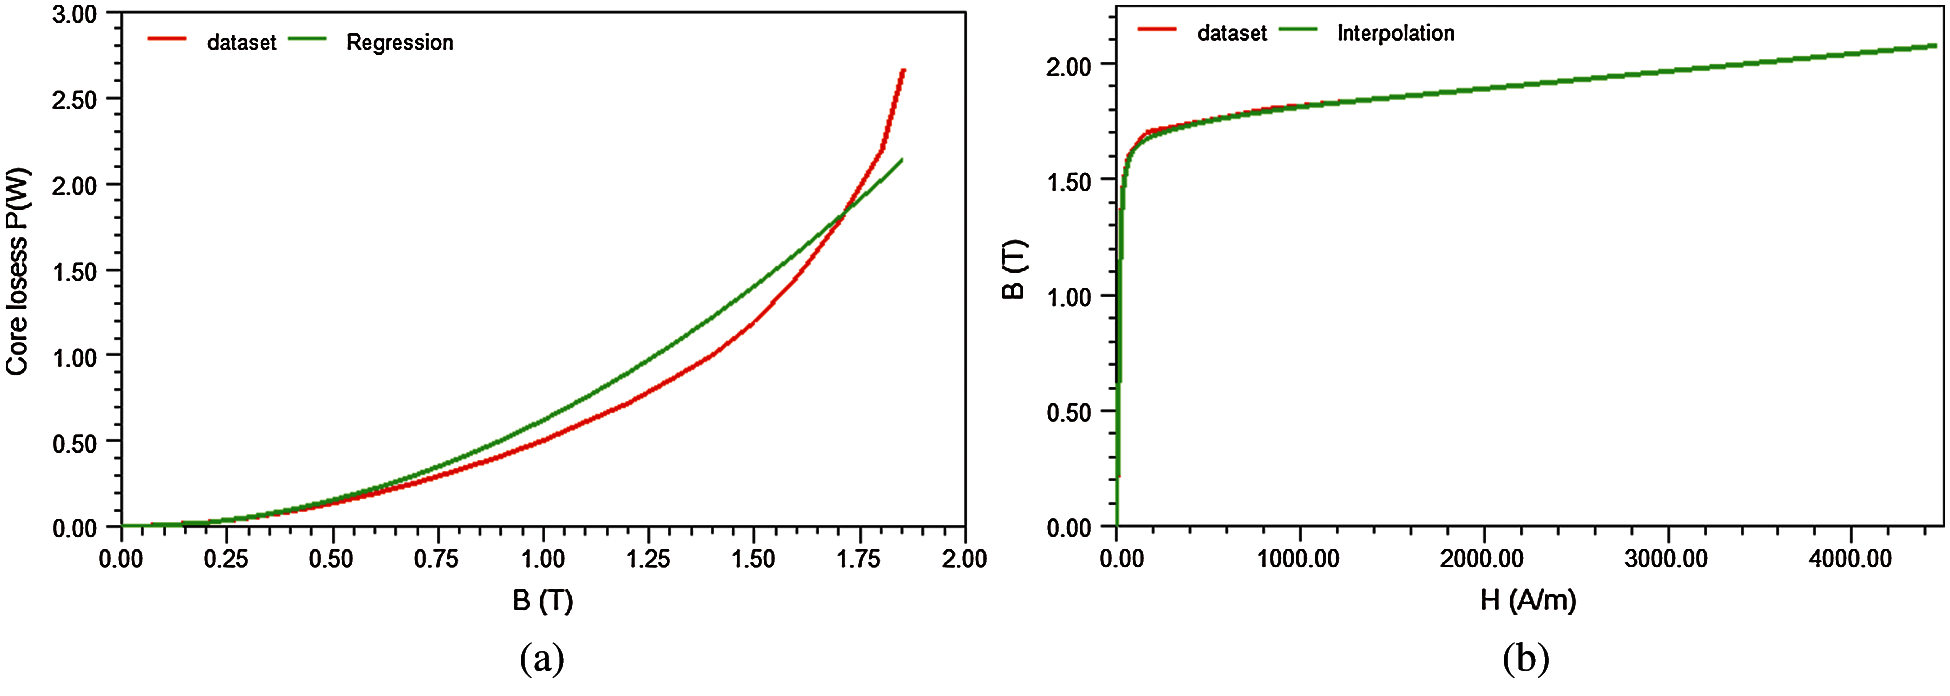
Figure 1: (a) Electrical steel BP curve at 50 Hz (b) BH curve of user define material
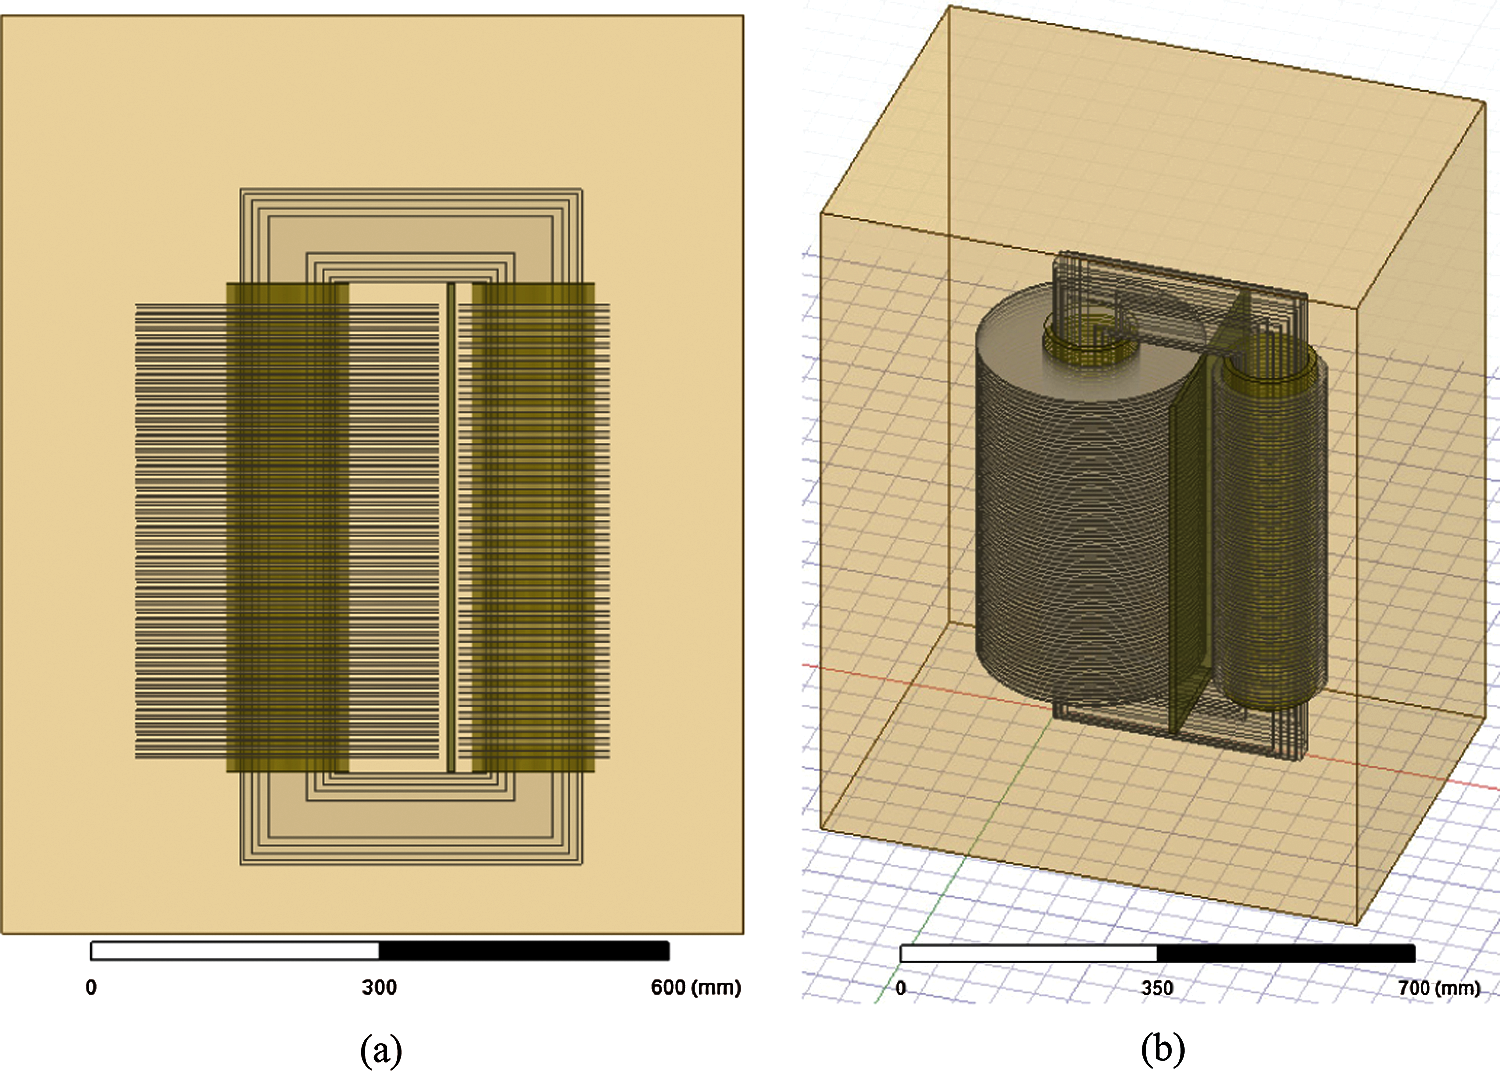
Figure 2: (a) Front view of model (b) 3D view of test transformer design model
Based on the described physics, the magnitude of magnetic flux was computed for a time interval of 0.08–0.1 s. For better precision, a small time–step size of 500 μs is selected. For smoothness of transitions and higher accuracy, the core has 10,000 meshing elements inside length while windings have 5,000 meshing elements as shown in Figs. 3a and 3b.
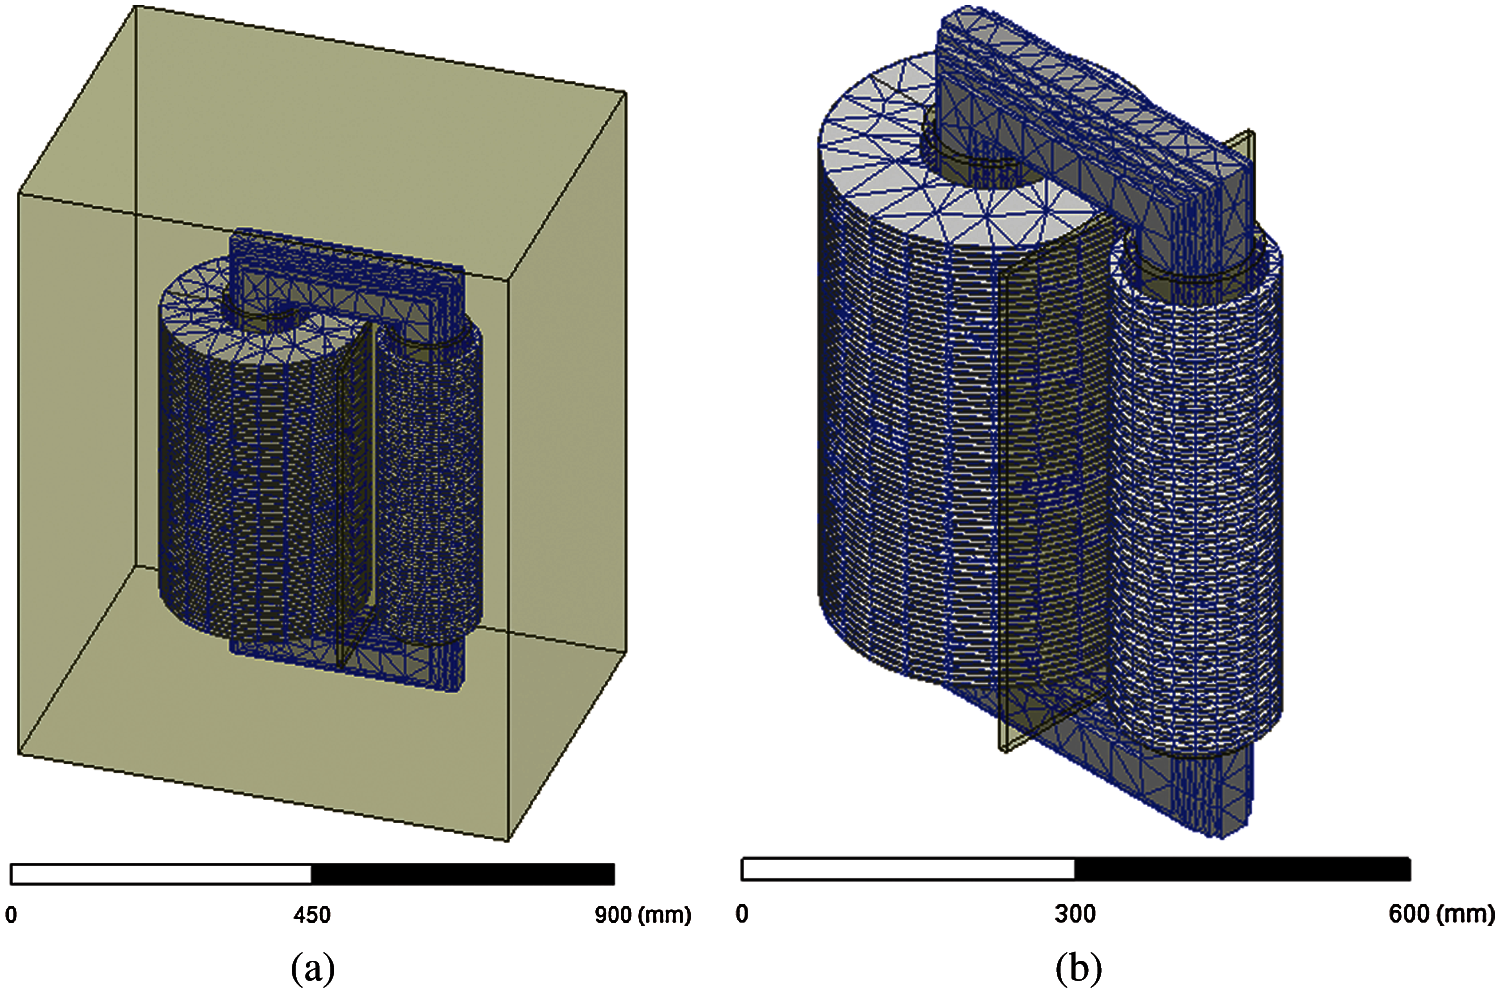
Figure 3: (a) Trimetric view of meshing (b) Isometric view of meshing
The boundary region is shown in Fig. 4 where surface current is zero and interface conditions of Maxwell's equations are fulfilled as given below:
For the solution of A, the tangential element of the magnetic potential is always continuous thus the first boundary condition is automatically fulfilled. The second part is referred to as the natural boundary condition hence is also fulfilled except the surface current is explicitly applied.
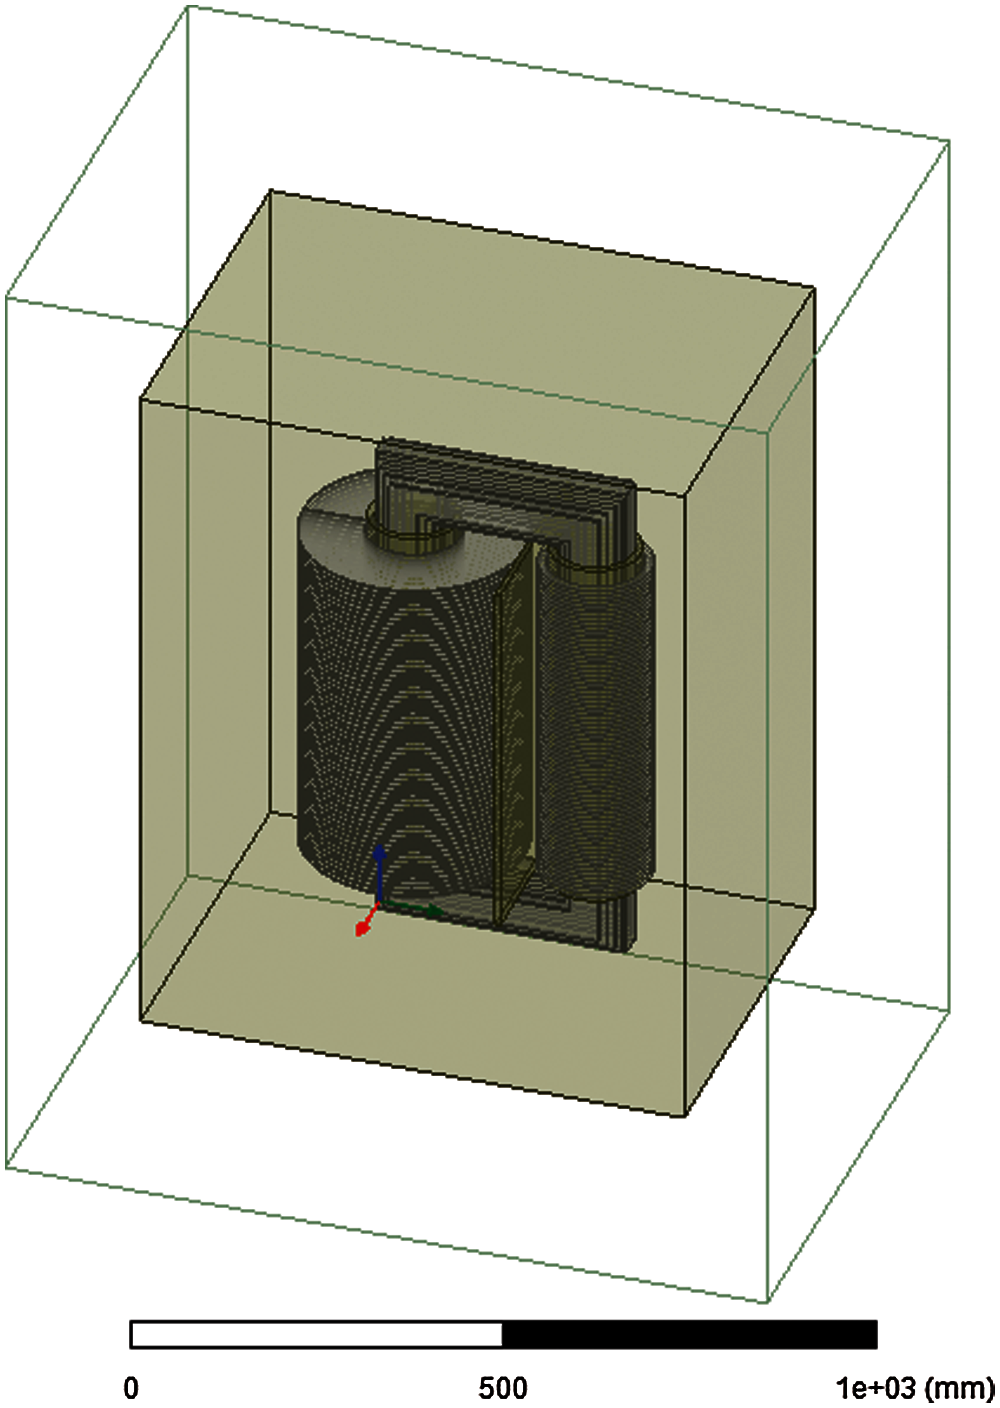
Figure 4: Boundary region around the model
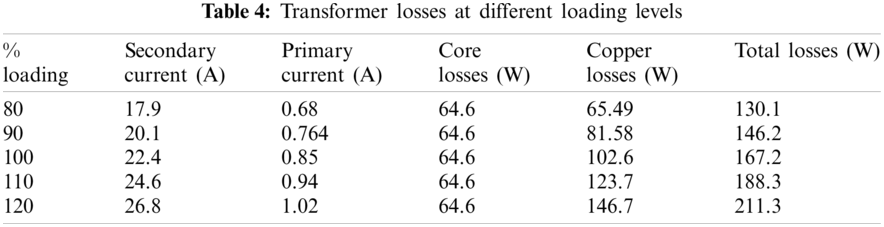
Fig. 5 shows the magnetic flux density contours obtained from the FEA simulations. It is observed that B is higher around primary winding than secondary winding, and its maximum value appears at core edges because these field lines try to follow the path at corners. A similar phenomenon for minimum value of B is observed at top and a lower side in core. Moreover, magnetic field route produces stresses in the core that result in the heat losses in core. Copper losses are the ohmic heat losses of the windings. Transformer losses due to copper loss and core loss at each loading are given in Tab. 4.
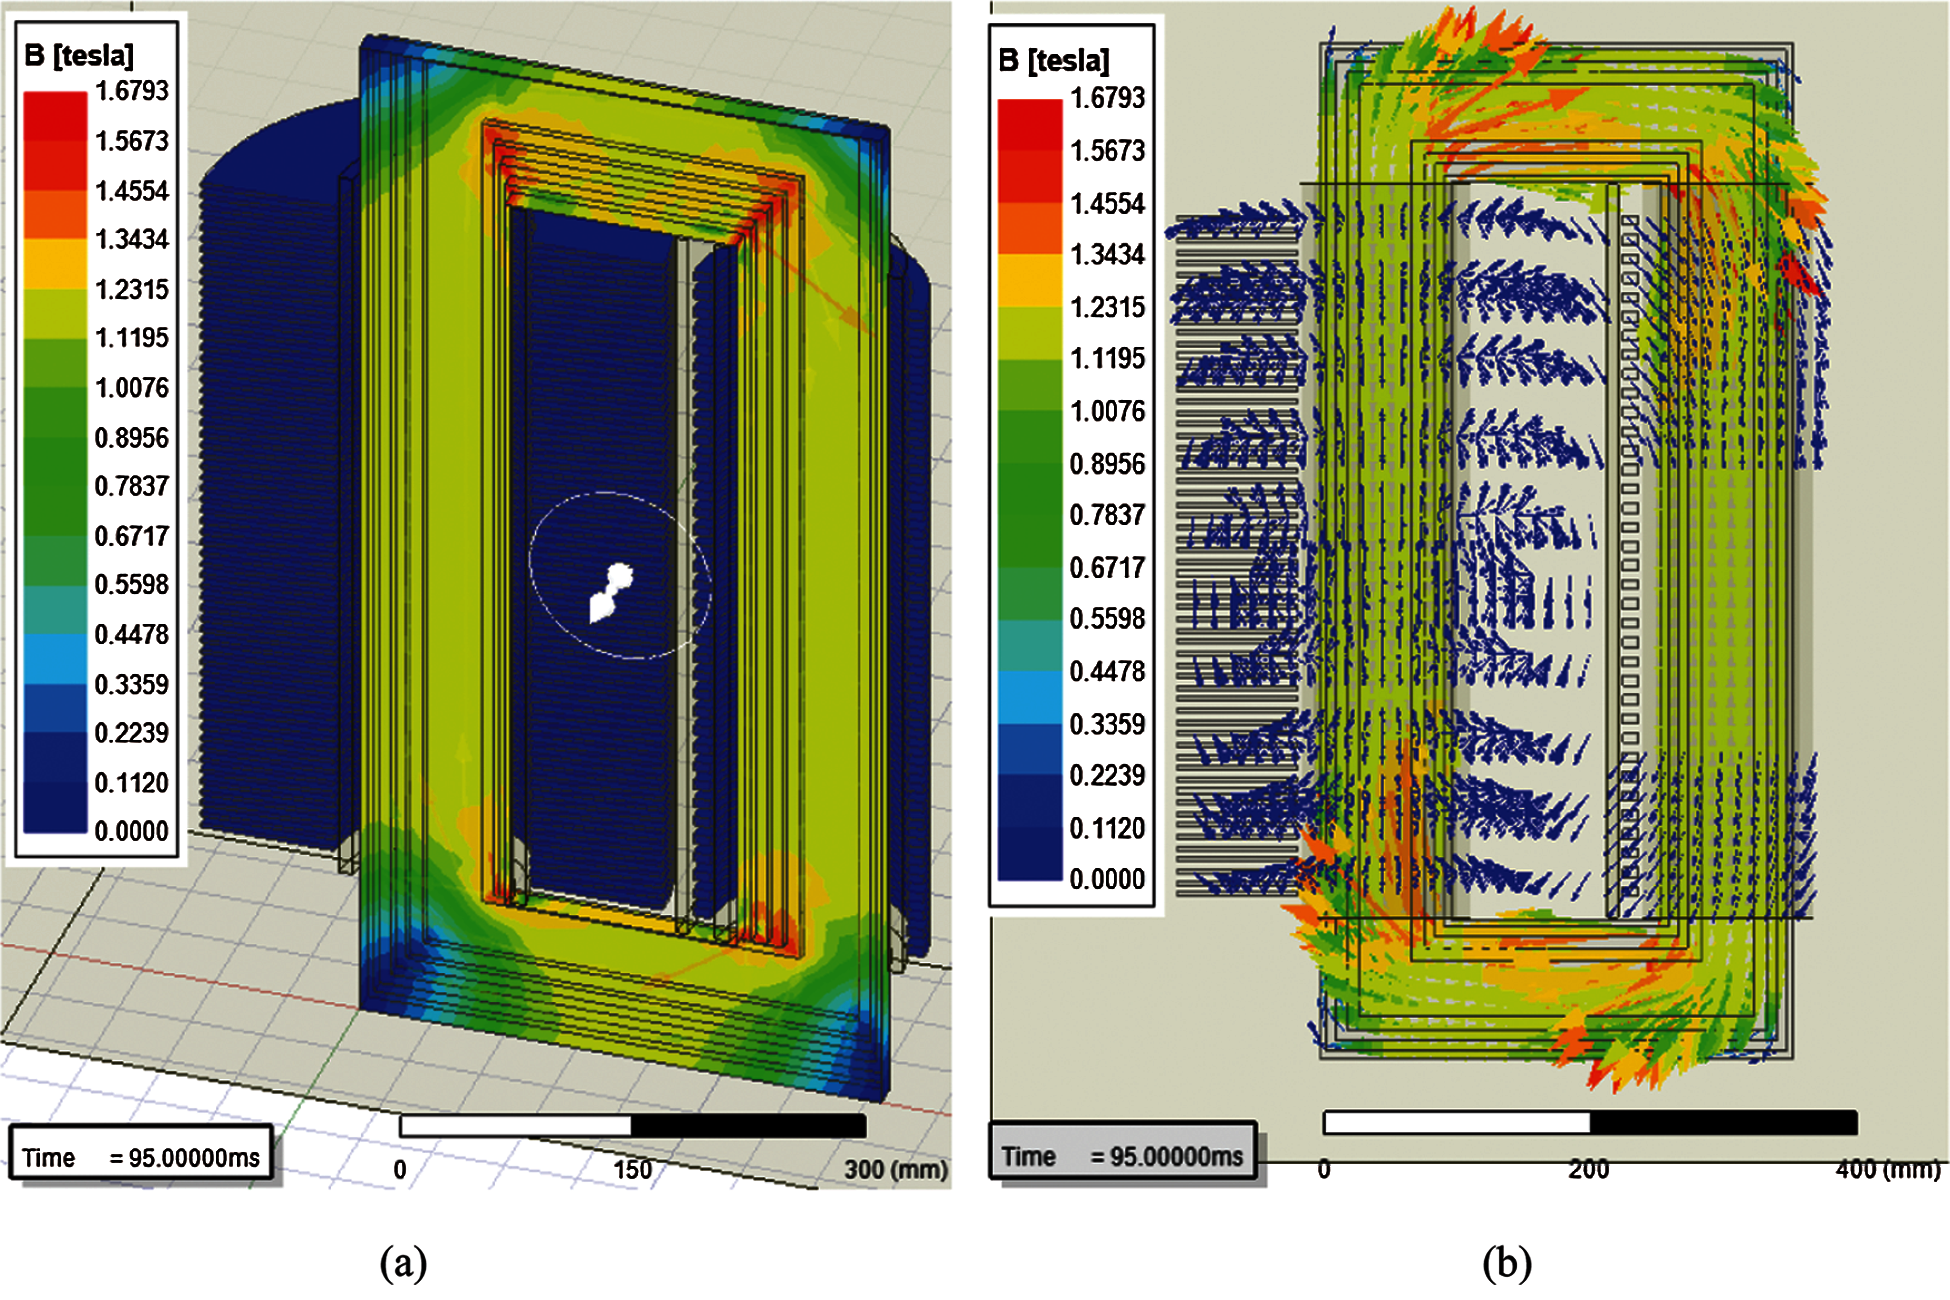
Figure 5: (a) Magnitude of magnetic field density (b) Vector plot of B
In Workbench of the ANSYS, the Maxwell is coupled with steady state thermal. Temperature inside the core of the distribution transformer is computed by using the steady state Fourier–Kirchhoff's law which is given below:
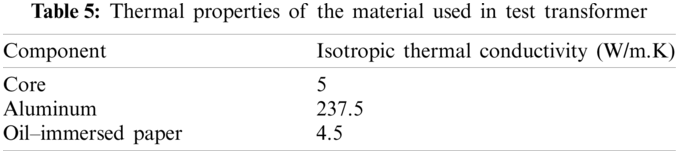
where k is the thermal conductivity, T is the temperature, Qv is the heat generation in the core, ρ is the density of the core material (7650 kg/m3), c is the specific heat of the core material, and W represents the velocity vector of the material. Thermal properties of the components are given in Tab. 5. Test transformer is using oil natural–air natural (ONAN) cooling method. Steady state thermal simulation is carried out for this experimental study with heat transfer co–efficient h of 23 W/m
2.3 Location and Installation of PT100 Sensors
The regions with higher electric field require more insulation for the sensors. According to the FEA simulations as shown in Fig. 3, the critical regions for heat losses can be overserved by B (tesla) which also comes about the 1/5th of winding height near the upper vicinity [33–35]. As core and copper losses contribute to the main heat loss as given in Tab. 4, it is necessary to install sensors at various locations along with their height. Special purpose PTs with 5 m long wire encapsulated in Teflon tube are used. Head of PTs has extra Teflon–epoxy nano–composite coatings.
The labels and locations of ten PTs installed on the core surface are given in Fig. 6. As shown in Fig. 7, 7 PTs have been placed in the oil. Two PTs (BO1 and BO7) are positioned horizontally in the bottom–oil at the same height and three PTs (LO3, MO4 and UM5), two PTs (UW5 and UW11) are fixed in top–oil horizontally.
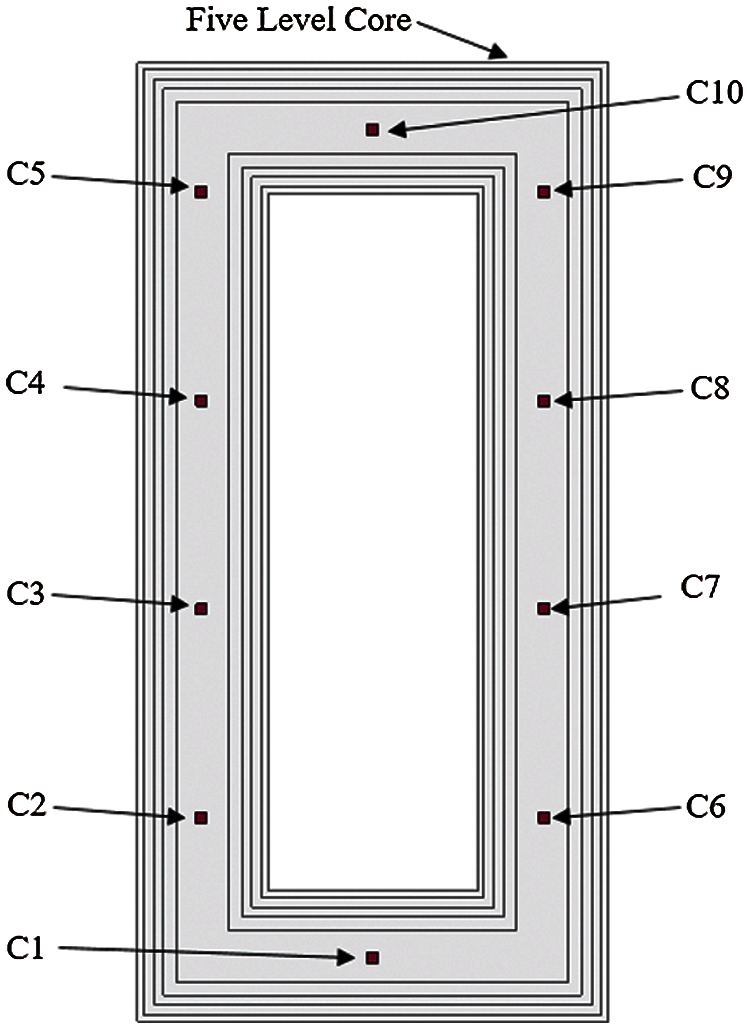
Figure 6: Sensors position and labels on core
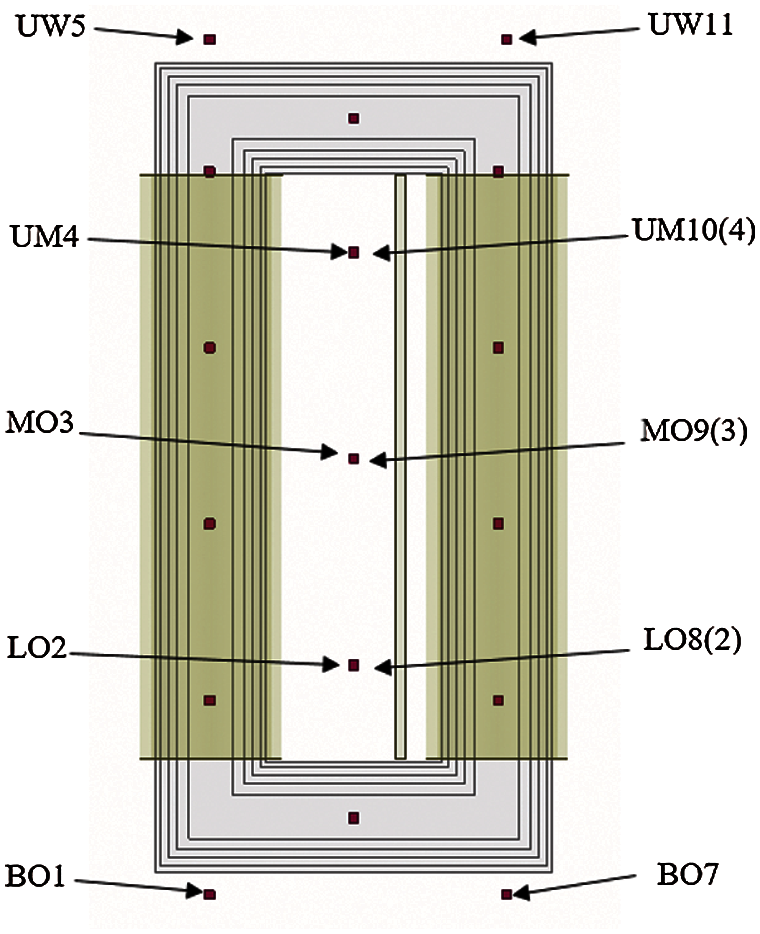
Figure 7: Sensors position and label in oil
Finally, 13 PTs are placed between the discs of primary winding, while 10 for the secondary winding as shown in Fig. 8. These locations are nearer to each other in upper part of both windings than lower part so that entire critical region for temperature can be covered adequately. There are two more PTs placed on the both LV and HV bushings. One of them is labeled as LVB12 placed at secondary winding bushing while the other is labeled as HVB6 placed at primary winding bushing are shown in Fig. 9. It is taken care that PTs do not obstruct the operation of test transformer after it is settled.
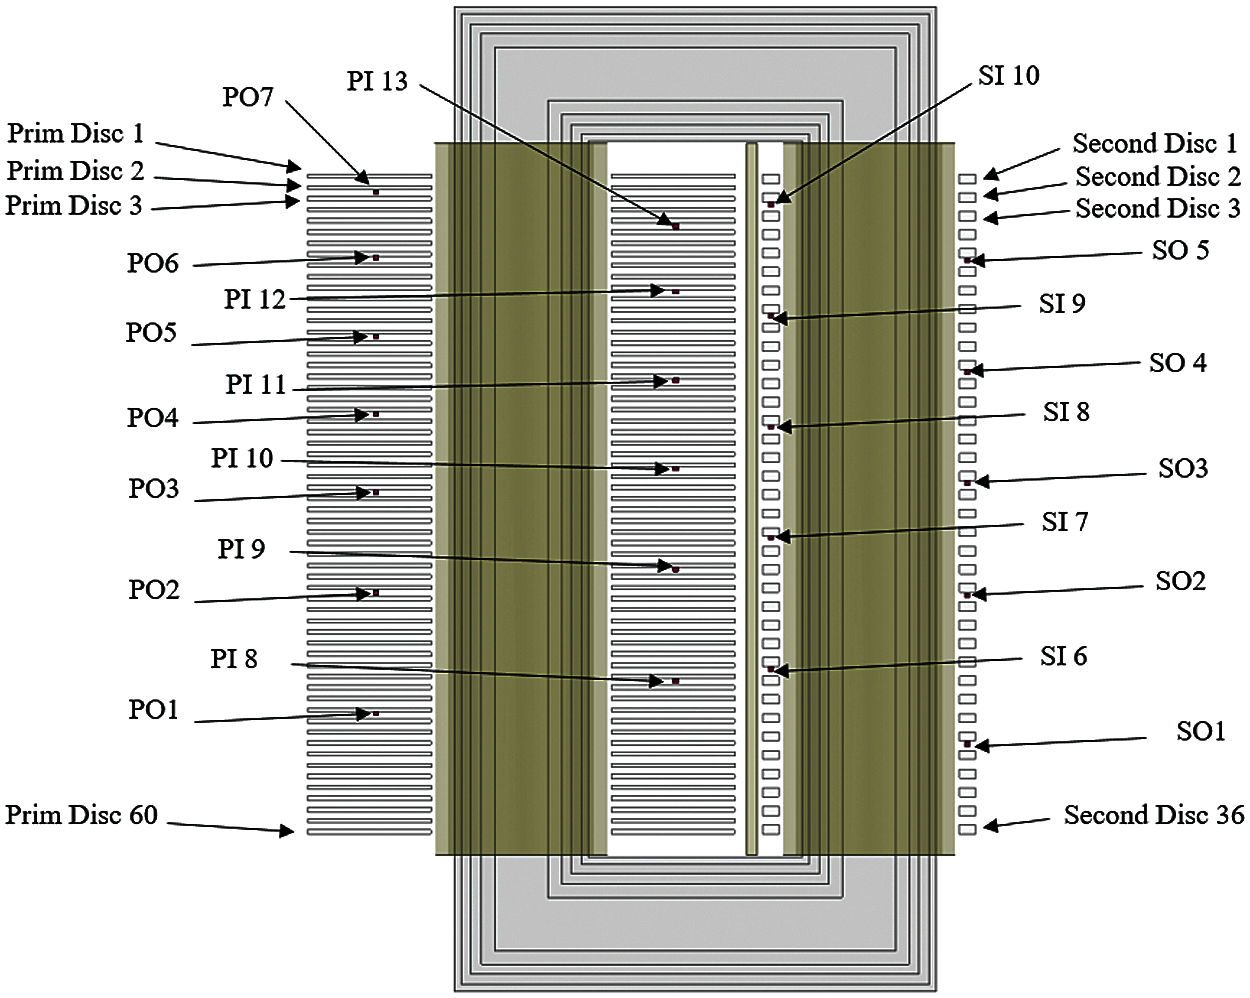
Figure 8: Sensors position and label numbers in secondary and primary windings
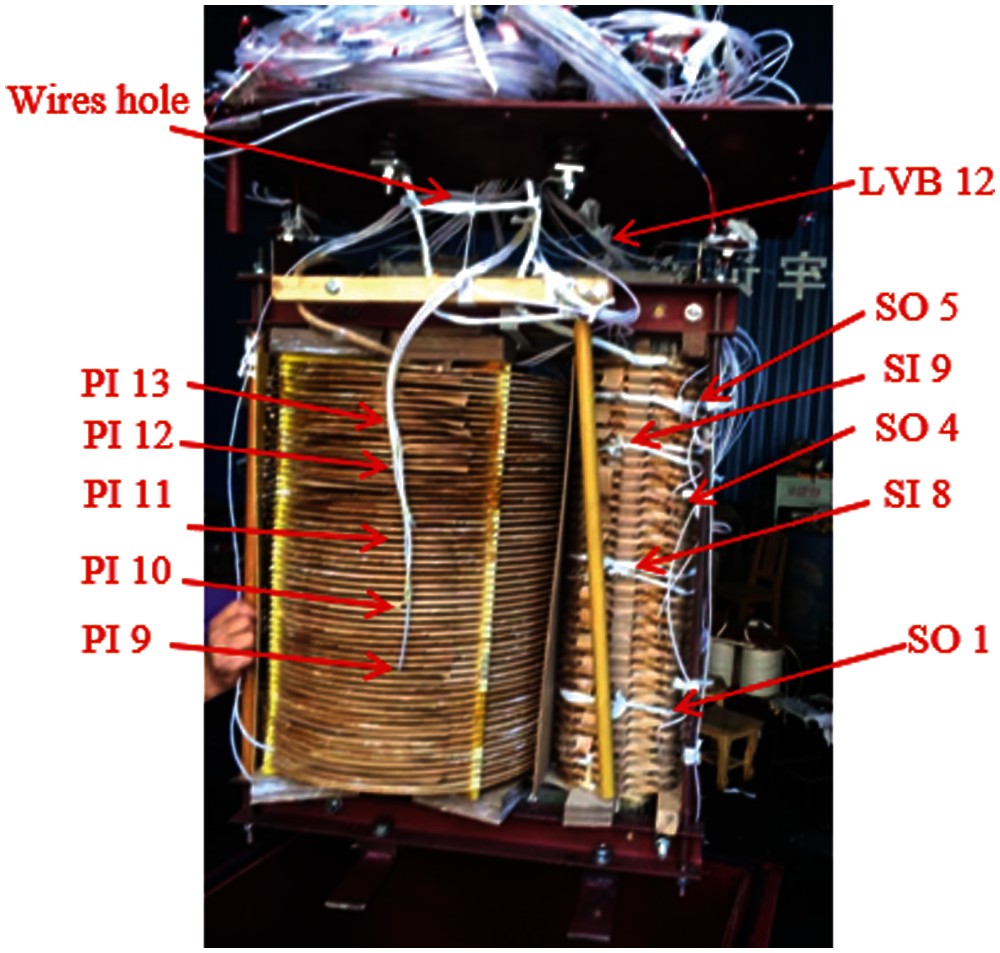
Figure 9: Inner part of the test transformer with installed sensors
2.4 Variable Resistive Load Bank
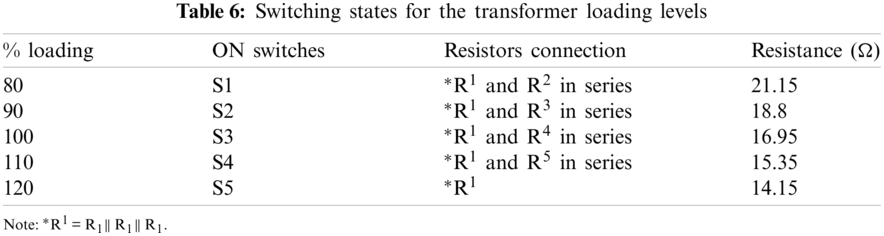
A variable resistive load bank has been made to achieve the loading conditions for this research. Loading conditions were designed following the IEC 60076 standards. The load bank is a combination of seven resistors connected in series and parallel. The specification of the different levels of loading conditions are described in Tab. 6.
3 Troubleshooting and Experimentation
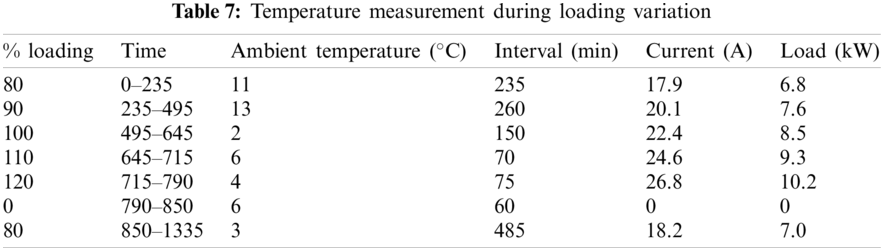
For the troubleshooting of the test transformer, standard tests include short–circuit and open–circuit tests have been performed. Besides the commissioning tests, tests for temperature measurement are conducted according to details mentioned in Tab. 7. To reproduce the actual operation scenario of the transformers, loading conditions have been achieved by variable resistive load bank.
4 Experimental Results and Discussion
This section presents the results attained from these experiments. Real–time temperature measurements from PTs in the oil, core and windings at each loading condition are presented below.
The measured temperature in different oil regions with different loadings is plotted in Fig. 10. In Fig. 10, right side temperature curves are near to the primary winding whereas left side plots are close to the secondary winding. A subtle variation in temperature at the middle section for both sides can be observed, while considerable temperature changes are detected at the top–oil and bottom–oil levels. Temperature near to the primary winding is higher than secondary winding in the top–oil or bottom–oil above and below the windings.
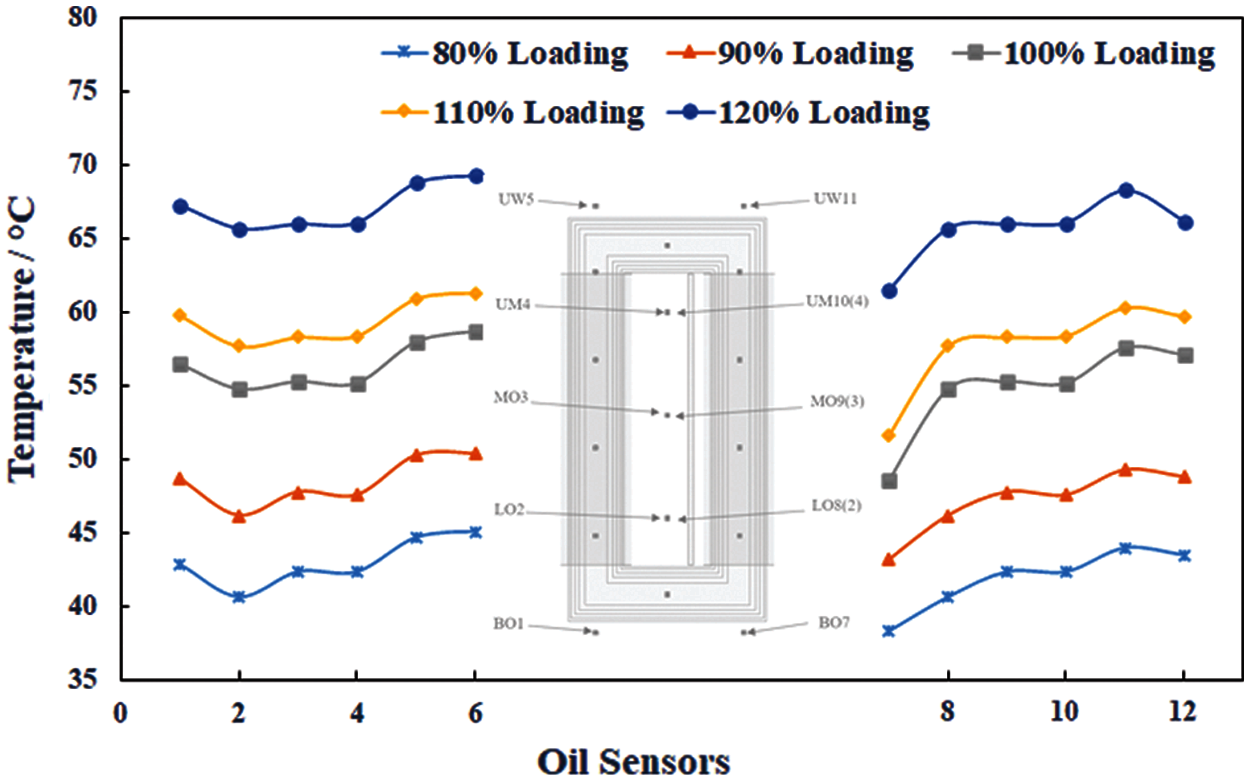
Figure 10: Temperature variation near to the primary winding and secondary winding along the height in the oil at each loading
Fig. 11 shows the temperature from sensors installed along the height on both legs of the core. The right side in the Fig. 11 shows temperature across right limb of the core side under the primary winding whereas left side shows temperature on the left limb of the core under secondary winding. A gradual increase in temperature can be observed from bottom to the top. The temperature in right limb is slightly higher than the left limb because right limb is under primary winding which has more copper loss than secondary winding. Since the flux through all the legs of core is same, the difference between its maximum and minimum temperatures is very small.
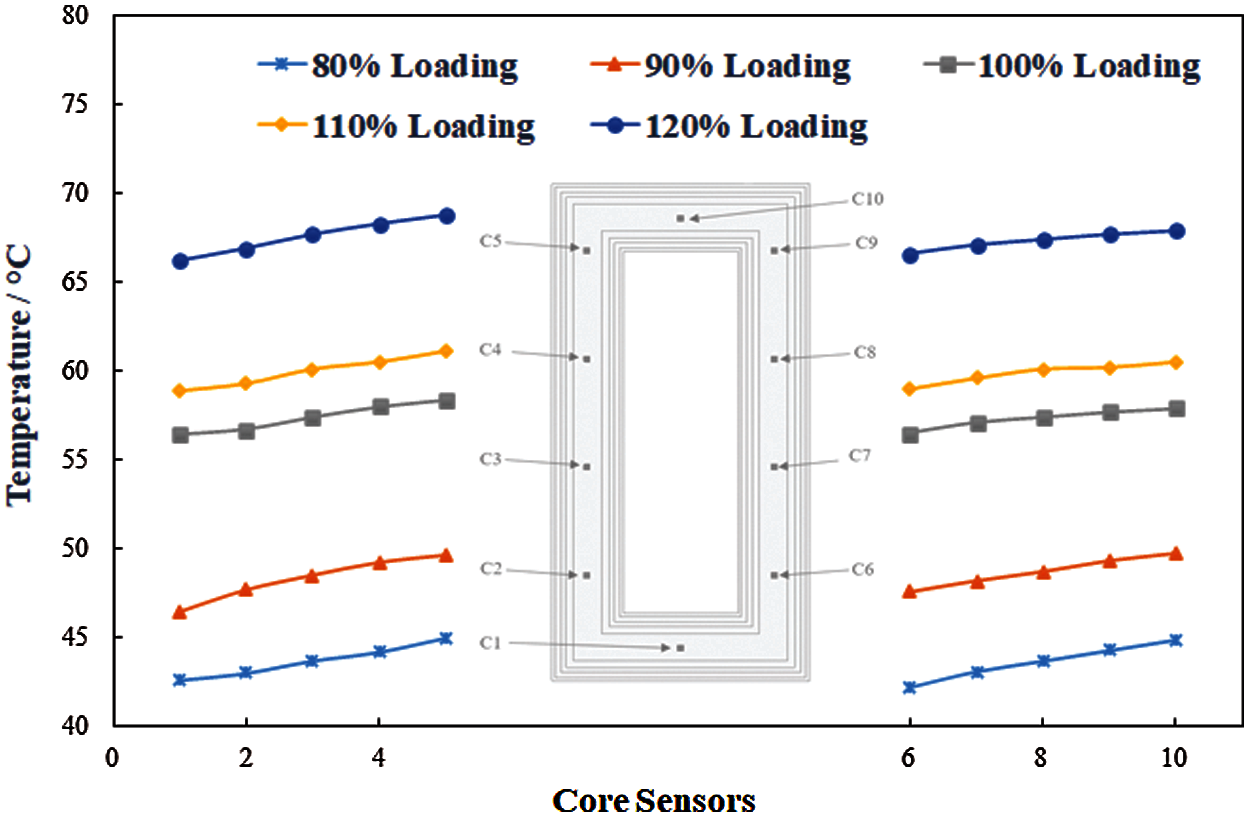
Figure 11: Temperature distribution from bottom to top in both limbs according to their corresponding positions on core surface
In both windings, the maximum temperature values are observed to be in the top 1/3th section. From there on, this temperature continuously increases with the ascending height, justifying the installation of more sensors in the top–half of each winding. Figs. 12 and 13 tacit this trend. In both Figs. 12 and 13, left side temperature plot shows temperature measured by the sensors placed at the outer sides of both windings and right–side temperature curves are for the inner side of both the windings in the core window. The upper portion of both windings inside the core window is found critical for the hottest spot temperature (HST) location as shown in Figs. 12 and 13. The HST is found in upper part of primary winding in the core window.
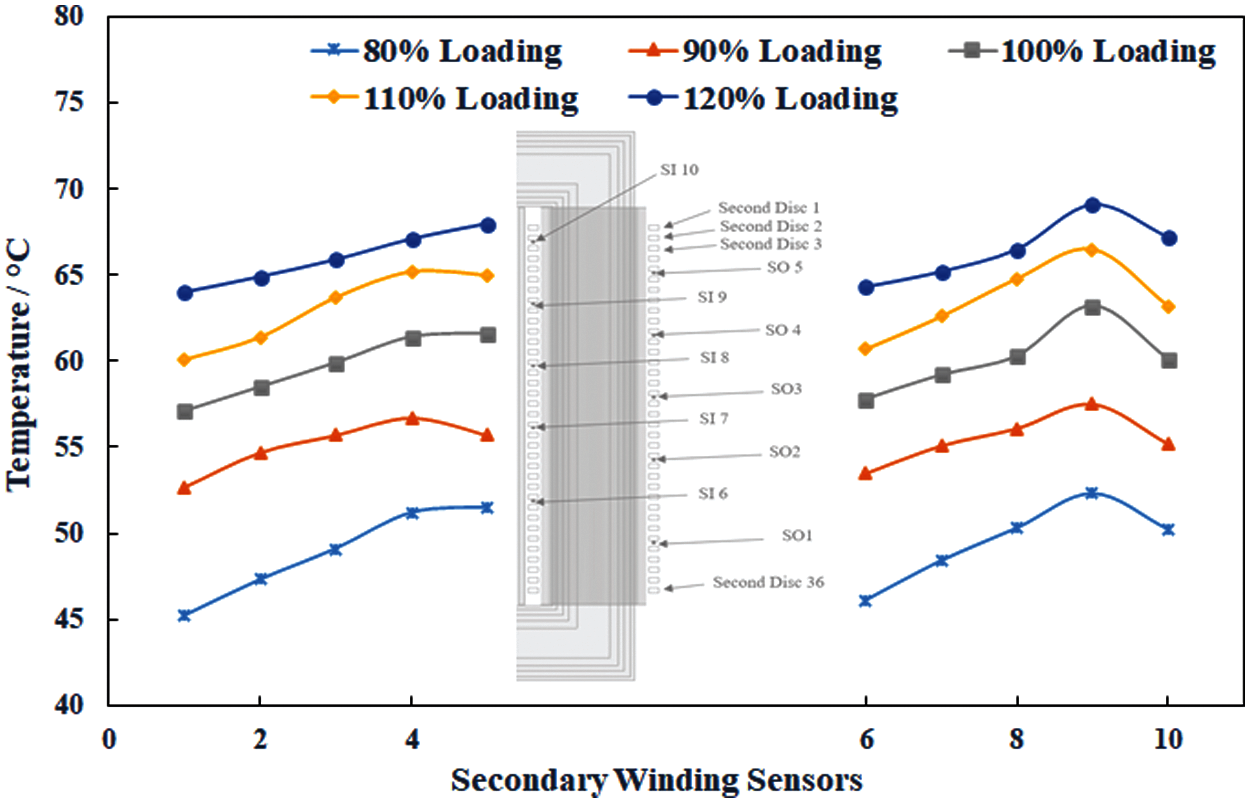
Figure 12: Temperature variation in outer (sensors 1–5) and inner (sensors 6–10) sides of secondary winding for different loading conditions
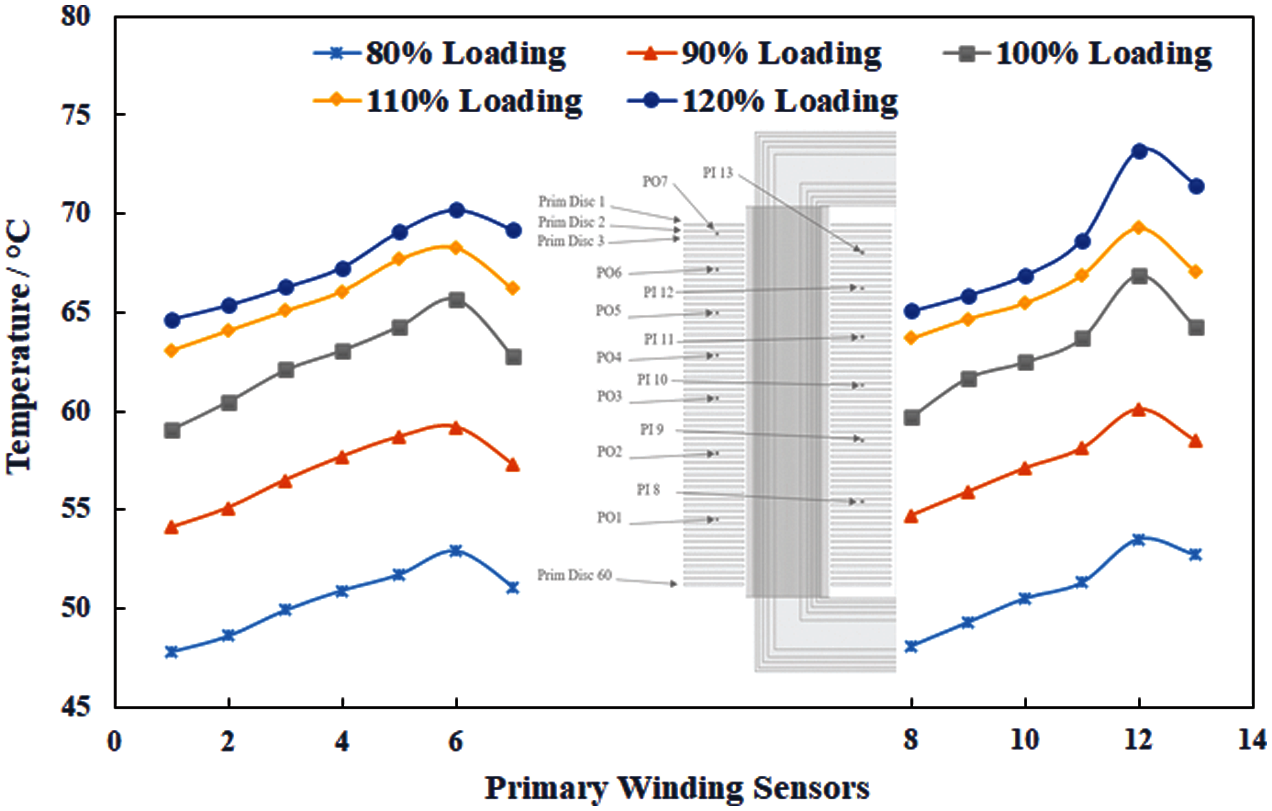
Figure 13: Temperature variation in outer (sensors 1–7) and inner (sensors 8–13) sides of primary winding for different loading conditions
For estimation of the safe operating conditions, the thermal behavior of each component was plotted. Thermal distribution in oil and core near the primary winding side of the transformer is shown in left and near the secondary winding side is shown in right, while outer sensors of the windings are plotted on left and inner sensors are plotted on the right in Figs. 14–16.
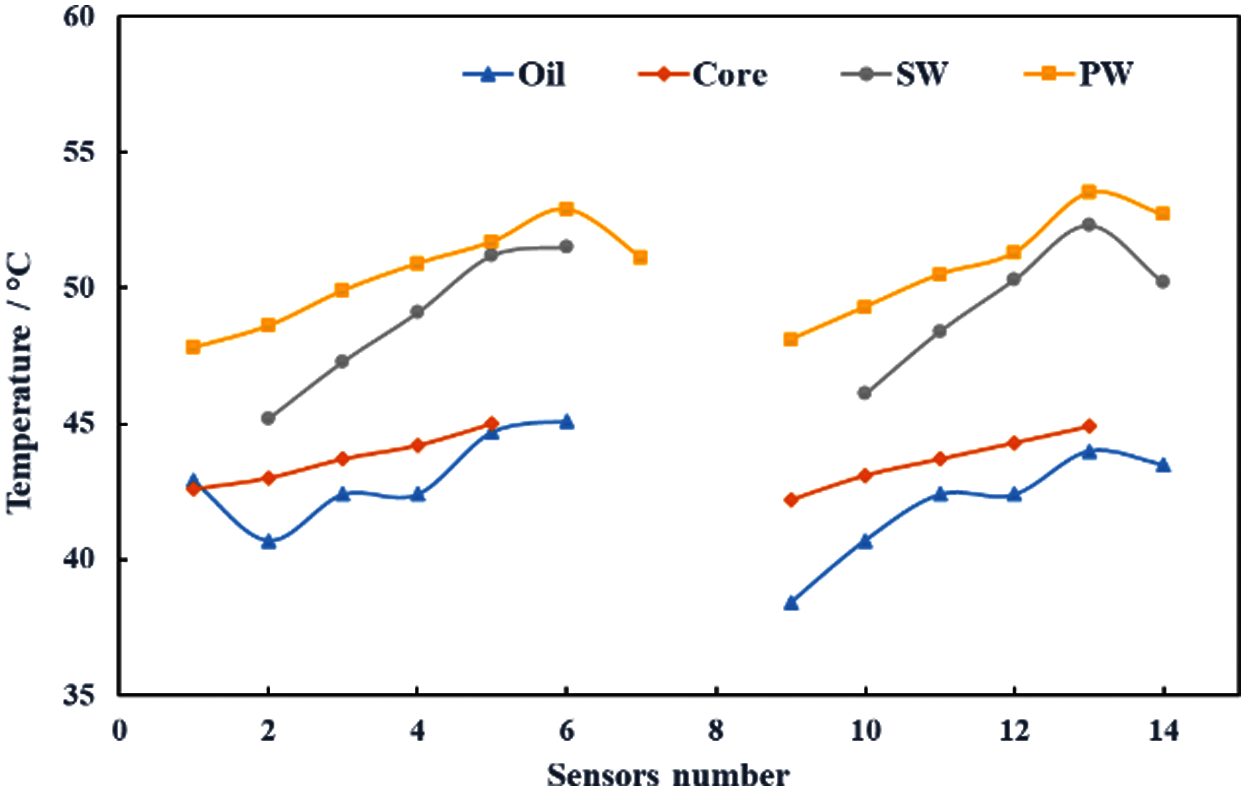
Figure 14: Right side curves show temperatures in oil, core near primary winding and inner sides of both windings while left side lines show temperatures in oil, core near secondary winding and outer sides of both windings at 80% loading
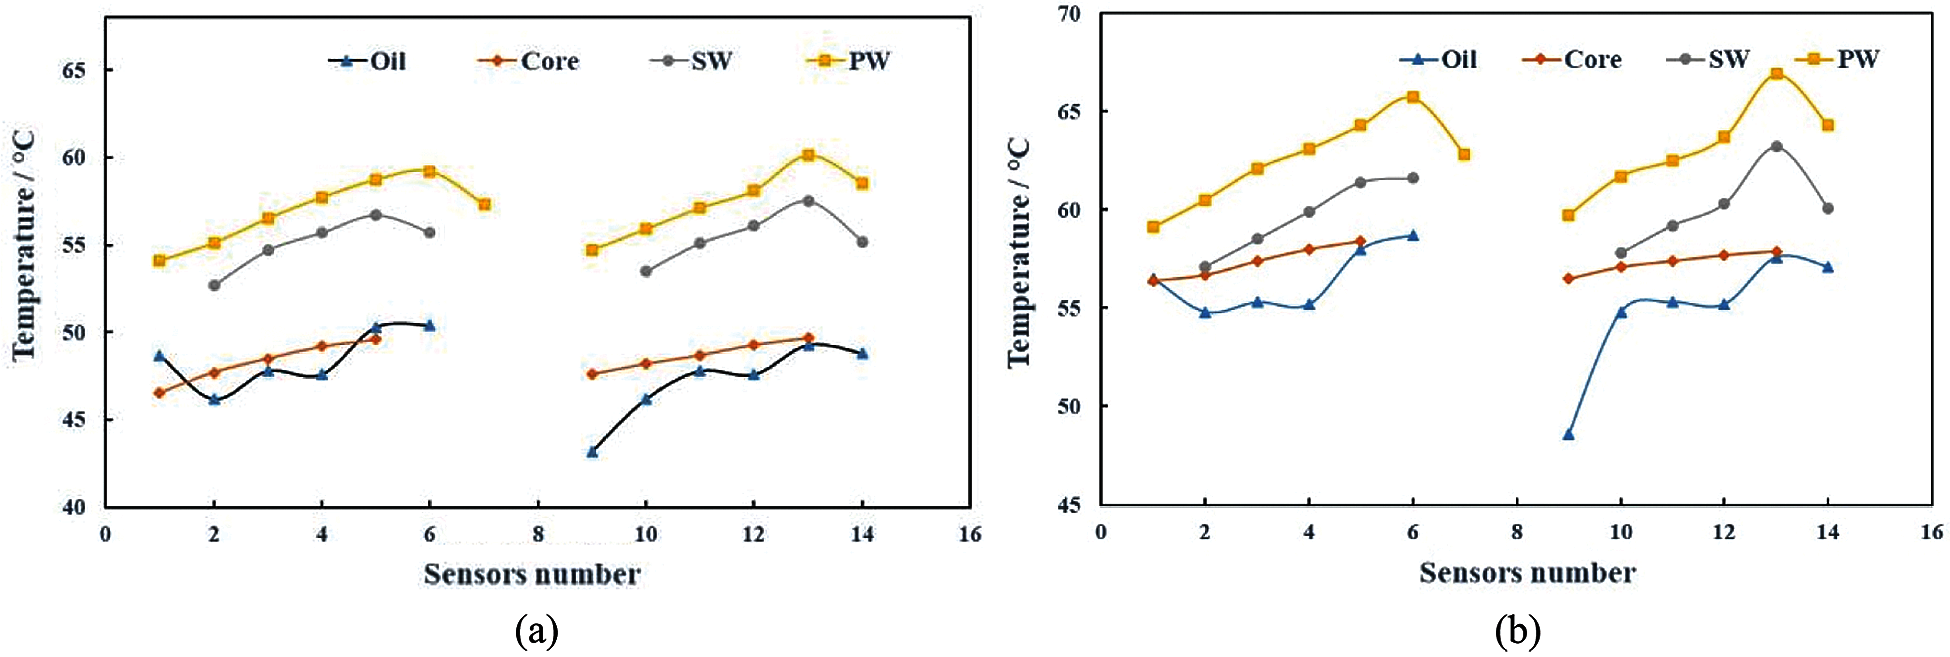
Figure 15: (a) Right side curves show temperatures in oil, core near primary winding and inner sides of both windings while left sidelines show temperatures in oil, core near secondary winding and outer sides of both windings at 90% loading (b) Right side curves show temperatures in oil, core near primary winding and inner sides of both windings while left sidelines show temperatures in oil, core near secondary winding and outer sides of both windings at 100% loading
It can be realized in Figs. 14 and 15a, despite the running of the transformer for long duration at 80% and 90% loading, the temperature of the core and the oil is quite lower than that of the windings.
However, this temperature difference reduces for the loading of 100% and 110% as shown in Figs. 15b and 16a, respectively. Even though, it is run for a short period at this loading, the temperature recorded by sensor 9 in oil gets even higher than that of the windings. Therefore, the transformer loading of up to 90% is considered as safe limit. Moreover, the oil and core temperature rise on significant scales for loading of 120% as shown in Fig. 16b, rendering it unsafe for even very short time.
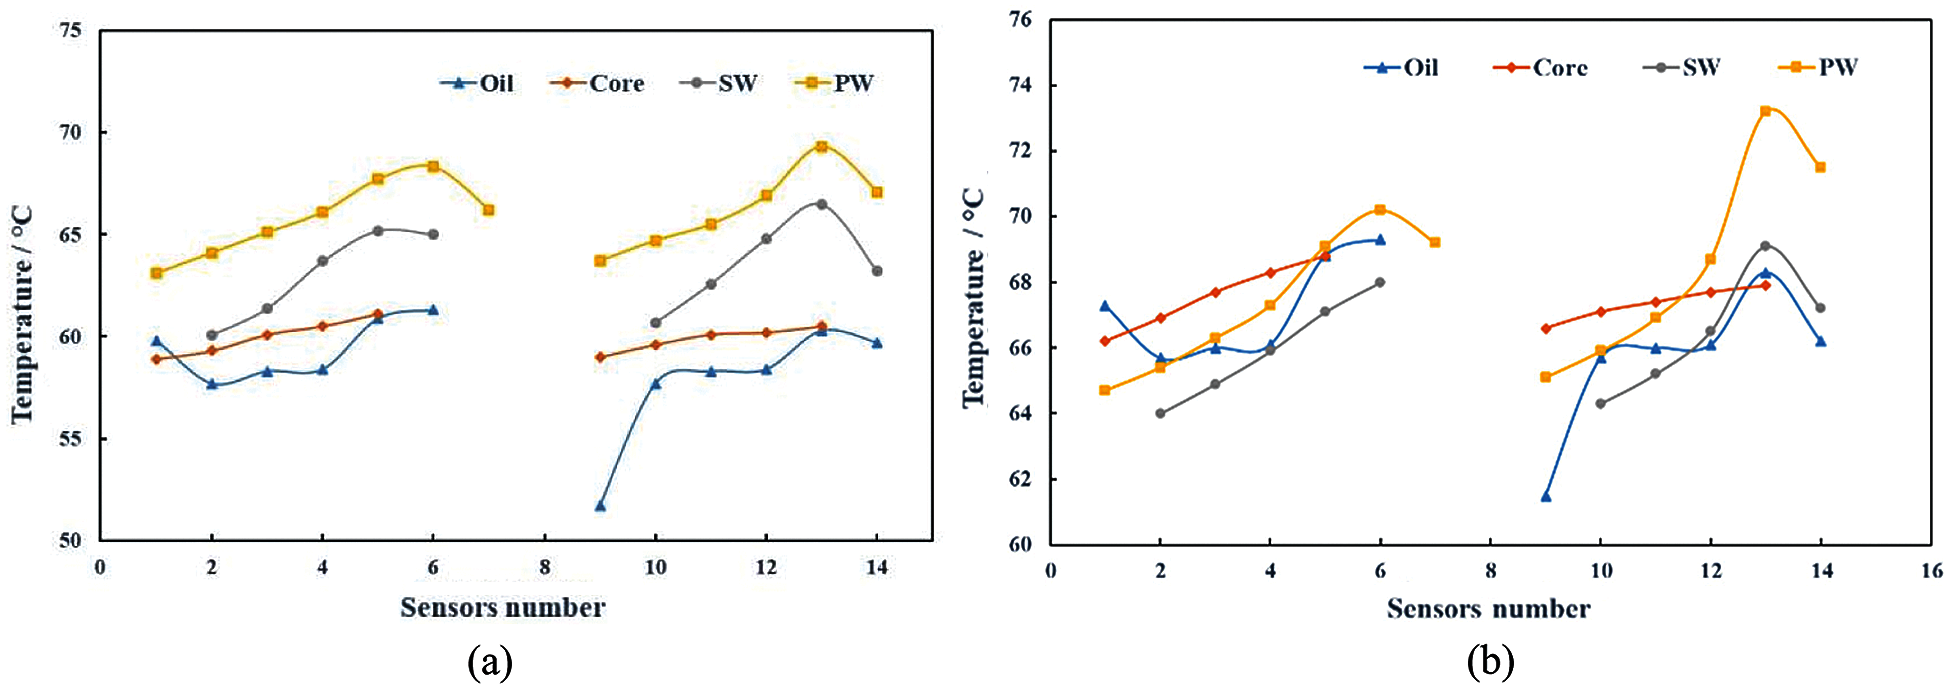
Figure 16: (a) Right side curves show temperatures in oil, core near primary winding and inner sides of both windings while left sidelines show temperatures in oil, core near secondary winding and outer sides of both windings at 110% loading (b) Right side curves show temperatures in oil, core near primary winding and inner sides of both windings while left sidelines show temperatures in oil, core near secondary winding and outer sides of both windings at 120% loading
At the beginning stages of the experiment, the temperature in the top oil is higher than that in primary winding. However, with the passage of time, the temperature in the primary winding rises and reaches a maximum of 53.5°C after 160 min. This increase in temperature is evidently because of the primary winding copper losses. Moreover, the experimental results suggest that the HST is more likely to occur in the Primary winding at the coordinates of Sensor 3. In addition, the temperature in the regions surrounding this sensor is also higher than the rest of the winding. Therefore, HST is most probable to occur in this region between the Sensors 2 and 4 in primary winding. The maximum temperature in each component at each loading is shown in Fig. 17.
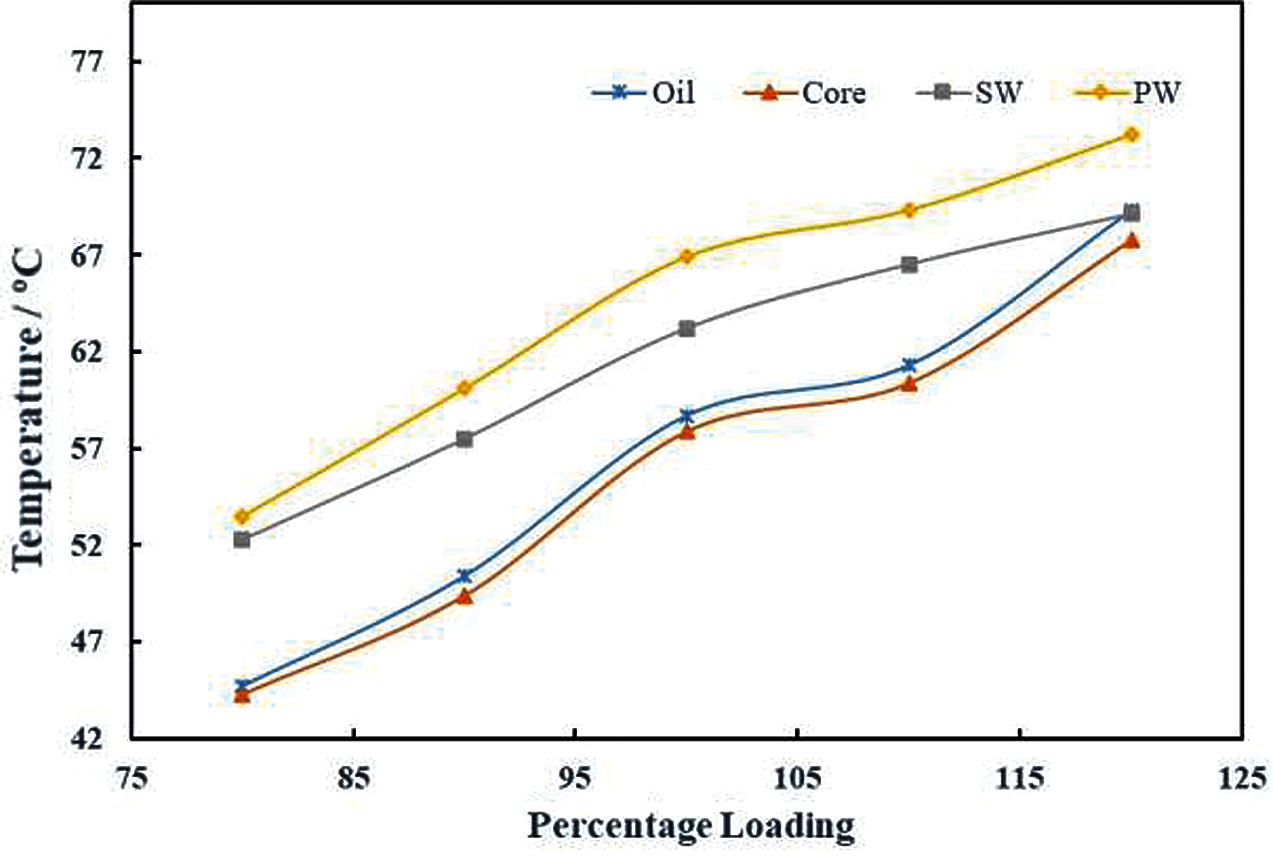
Figure 17: The maximum temperature at each loading in oil, core and windings
Thermal analysis has been done with core losses imported into ANSYS Mechanical as a heat generation source for the core. A maximum loading case is considered for this simulation and its core losses are imported into the setup of ANSYS Mechanical during 80 to 100 ms as shown in Fig. 18a. Core meshing size of 10 mm is used to maintain the scaling factor equal to unity to import heat generation. From the results, temperature distribution in core is shown in Fig. 18b. The maximum temperature measured in the core with sensors is 67.8°C and maximum temperature from the simulation in the core is 68.34°C.
In Fig. 19, temperature distribution calculated by simulations in the core at three different loadings is compared with experimentally recorded temperature data. These results are in good agreement which shows that the PTs in experimental equipment is providing the accurate measurement of temperature data. Therefore, it can be inferred that the PTs installed in the test transformer are not altering its design and operation. Hence, this technique can be used in practical distribution transformers for cost effective real time HST monitoring.
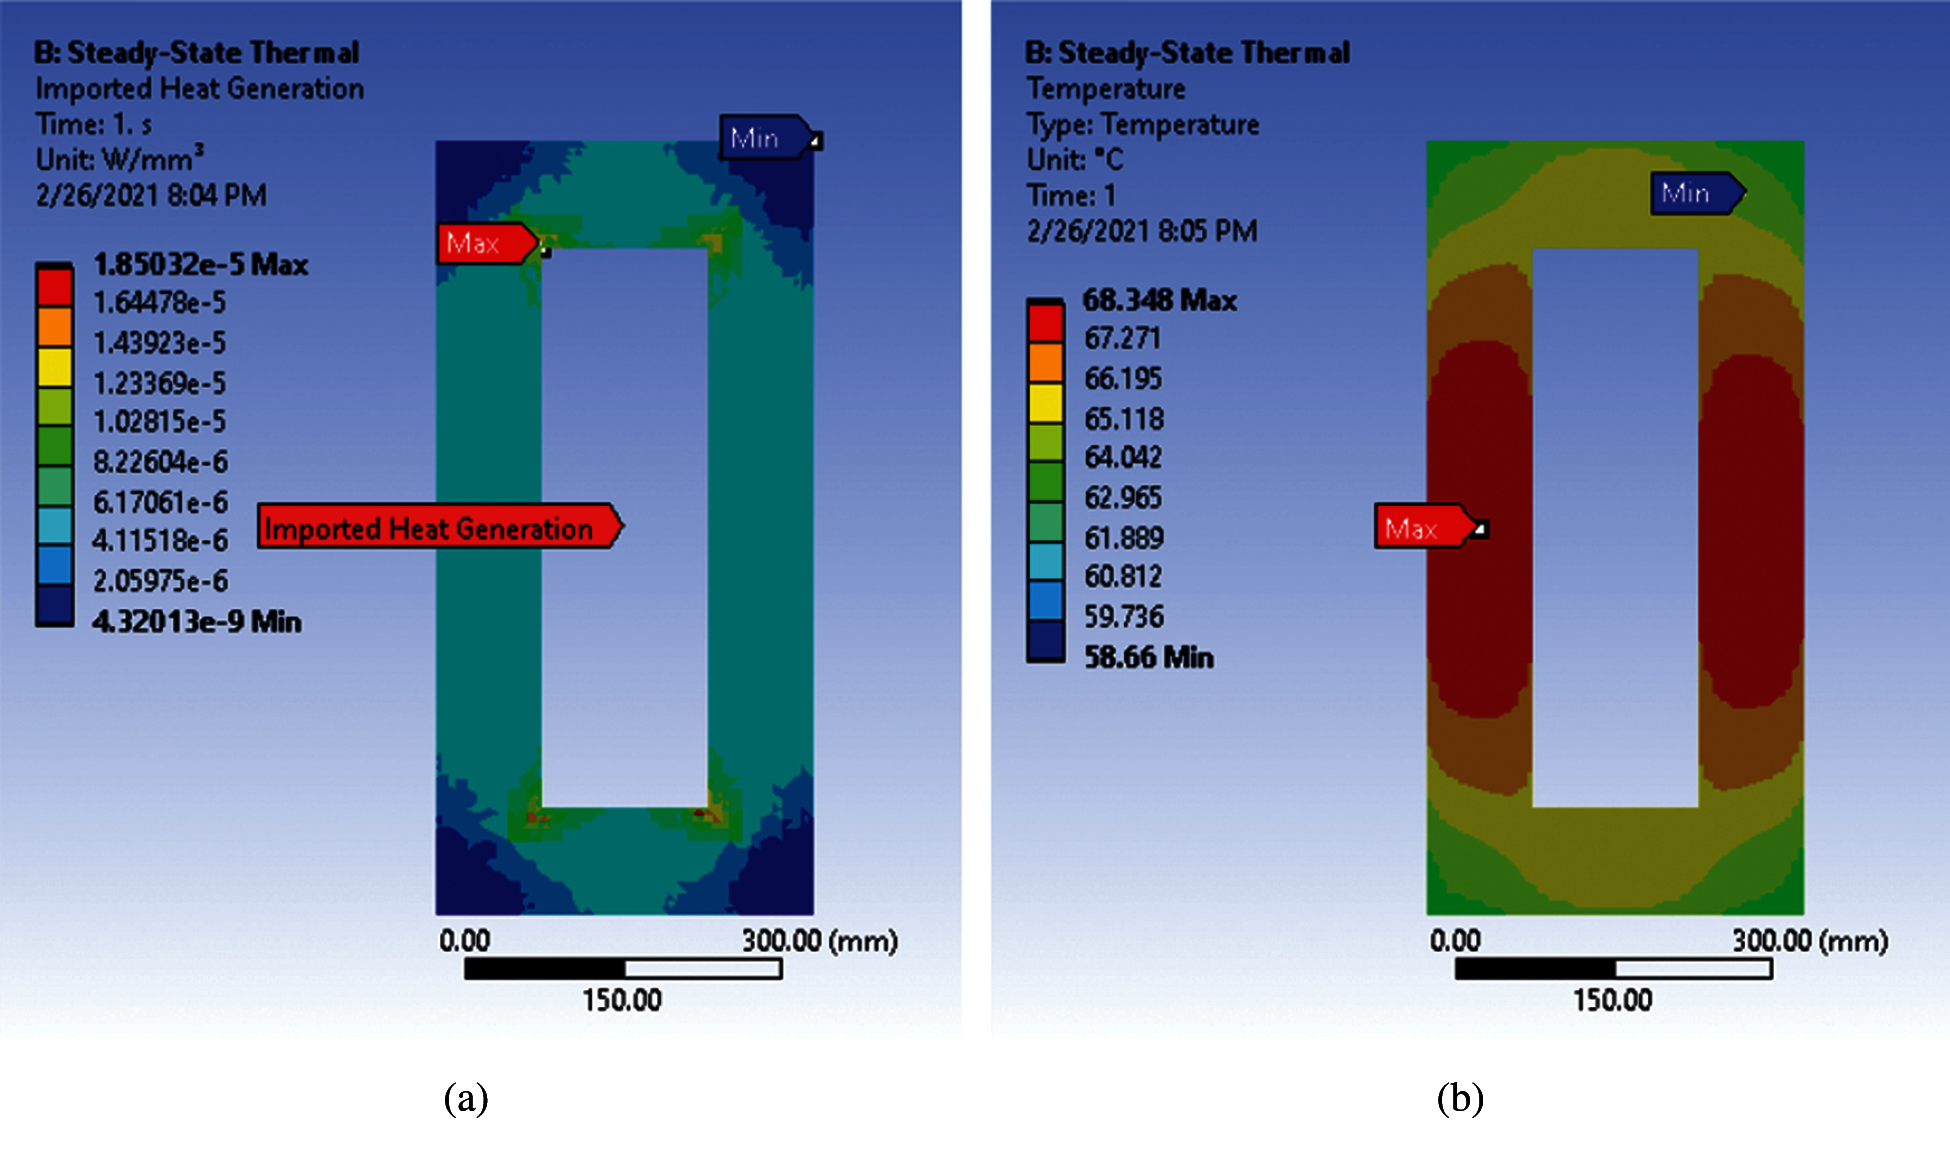
Figure 18: (a) Imported heat generation by core losses from Maxwell 3D for the maximum loading case (b) Thermal distribution in transformer core at maximum loading case
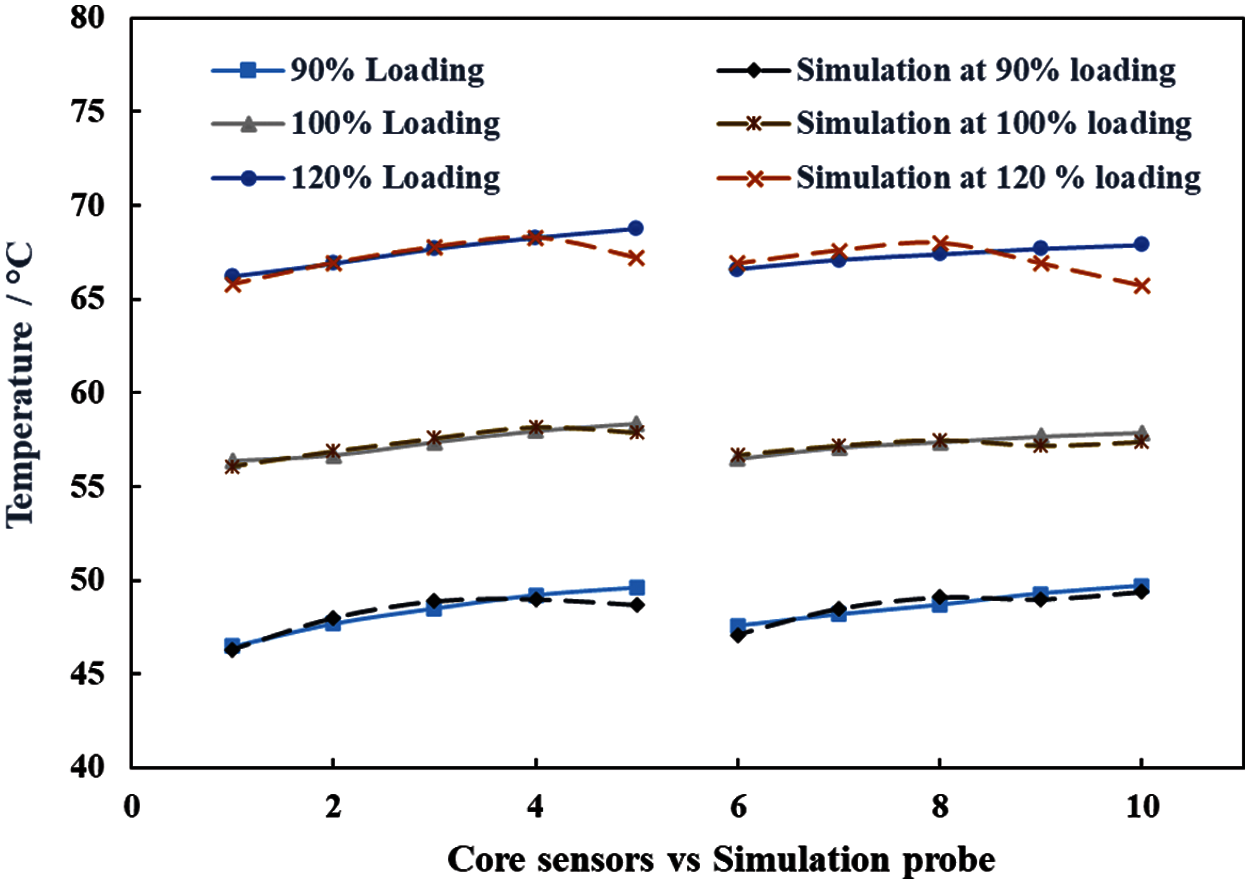
Figure 19: Comparison of experimental and simulated thermal distribution in test transformer core
This experimental thermal study is performed for a direct investigation in a 10 kVA oil–immersed disc–type test transformer at different loading conditions. Detailed temperature distribution is found in the core, oil and windings of the transformer with several sensing points at each loading as compared with previous studies. It is concluded from the obtained results that temperature rises with increasing height of the windings up to 4/5th of their height, and then decreases afterward till the top of the windings. Furthermore, HST in primary winding is found to be higher than the secondary winding at each loading. Core temperature varies almost linearly along the height at each loading. The temperature in oil is found to be higher near the primary winding than secondary winding. From the comprehensive temperature distribution, HST is found to be 73.2°C at 120% loading, at 85% height of the primary winding. The maximum temperature in the core is 67.8°C whereas in oil is 68.8°C.
This study is performed by selecting the maximum number of temperature sensing points in the test transformer. However, it is established that adequate temperature distribution can be obtained with a lesser number of sensors in critical regions of the windings, oil and core for future work which in progress. This suggestion will help the manufacturers to design direct temperature measurement system for the distribution transformers during their operation in the power system.
Funding Statement: The authors received no specific funding for this study.
Conflicts of Interest: The authors declare that they have no conflicts of interest to report regarding the present study.
1. Tippachon, W., Klairuang, N., Khatsaeng, T., Teera-achariyakul, N., Hokierti, J. (2006). Failure mode distribution of transformers in Thailand. International Conference on Power System Technology, pp. 1–5. Chongqing, China, IEEE. [Google Scholar]
2. Singh, R., Singh, A. (2010). Causes of failure of distribution transformers in India. 9th International Conference on Environment and Electrical Engineering, pp. 388–391. EEEIC, Prague, Czech Republic. [Google Scholar]
3. Singh, J., Singh, S., Singh, A. (2019). Distribution transformer failure modes effects and criticality analysis (FMECA). Engineering Failure Analysis, 99, 180–191. DOI 10.1016/J.ENGFAILANAL.2019.02.014. [Google Scholar] [CrossRef]
4. Bengtsson, C. (1996). Status and trends in transformer monitoring. IEEE Transactions on Power Delivery, 11, 1379–1384. DOI 10.1109/61.517495. [Google Scholar] [CrossRef]
5. Lesieutre, B. C., Hagman, W. H., Kirtley, J. (1997). An improved transformer top oil temperature model for use in an on-line monitoring and diagnostic system. IEEE Transactions on Power Delivery, 12, 249–256. DOI 10.1109/61.568247. [Google Scholar] [CrossRef]
6. Pradhan, M., Ramu, T. (2004). Estimation of the hottest spot temperature (HST) in power transformers considering thermal inhomogeniety of the windings. IEEE Transactions on Power Delivery, 19, 1704–1712. DOI 10.1109/TPWRD.2004.835291. [Google Scholar] [CrossRef]
7. Lewin, P. L., Tran, T. N., Swaffield, D. J., Hallstrom, J. K. (2008). Zero-phase filtering for lightning impulse evaluation: A K-factor filter for the revision of IEC60060–1 and –2. IEEE Transactions on Power Delivery, 23, 3–12. DOI 10.1109/TPWRD.2007.911124. [Google Scholar] [CrossRef]
8. Ding, H., Heywood, R., Lapworth, J., Ryder, S. (2009). Why transformers fail. Euro TechCon, pp. 1–18. Stretton, UK. [Google Scholar]
9. Tripathy, S. C., Lakervi, E. (2000). Evaluation of transformer loading above nameplate rating. Electric Machines & Power Systems, 28, 625–636. DOI 10.1080/07313560050129846. [Google Scholar] [CrossRef]
10. Hurezeanu, I., Nicola, C., Sacerdoţianu, D., Nicola, M., Aciu, A. et al. (2016). Temperature control and monitoring system for power transformer windings using fiber optic sensors. International Symposium on Fundamentals of Electrical Engineering (ISFEEpp. 1–4. Bucharest, Romania, IEEE. [Google Scholar]
11. Kennedy, S. P., Gordner, T. (2013). Hot spot studies for sheet wound transformer windings. 80th International Conference of Doble Clients, Watertown, Massachusetts, USA. [Google Scholar]
12. Zhang, X., Yao, S., Huang, R., Hou, D., Huang, W. et al. (2014). Oil-immersed transformer online hot spot temperature monitoring and accurate life lose calculation based on liber bragg grating sensor technology. China International Conference on Electricity Distribution (CICEDpp. 1256–1260. Shenzhen, China, IEEE. [Google Scholar]
13. Anoop, S., Naufal, N. (2017). Monitoring of winding temperature in power transformers—A study. International Conference on Intelligent Computing, Instrumentation and Control Technologies, pp. 1334–1337. Kannur, Kerala, India, IEEE. [Google Scholar]
14. Arabul, A. Y., Arabul, F. K., Senol, I. (2018). Experimental thermal investigation of an ONAN distribution transformer by fiber optic sensors. Electric Power Systems Research, 155, 320–330. DOI 10.1016/j.epsr.2017.11.007. [Google Scholar] [CrossRef]
15. Lecler, S., Meyrueis, P. (2012). Intrinsic optical fiber sensor. Sensors/special issue: Fiber optic sensors. London, UK: IntechOpen Limited. [Google Scholar]
16. Radakovic, Z., Feser, K. (2003). A new method for the calculation of the hot-spot temperature in power transformers with ONAN cooling. IEEE Transactions on Power Delivery, 18, 1284–1292. DOI 10.1109/TPWRD.2003.817740. [Google Scholar] [CrossRef]
17. Betta, G., Pietrosanto, A., Scaglione, A. (2001). An enhanced fiber-optic temperature sensor system for power transformer monitoring. IEEE Transactions on Instrumentation and Measurement, 50, 1138–1143. DOI 10.1109/19.963173. [Google Scholar] [CrossRef]
18. Gong, R., Ruan, J., Chen, J., Quan, Y., Wang, J. et al. (2017). Analysis and experiment of hot-spot temperature rise of 110 kV three-phase three-limb transformer. Energies, 10, 1079. DOI 10.3390/en10081079. [Google Scholar] [CrossRef]
19. Zhou, K., Ren, L., Shi, J., Xu, Y., Pu, D. et al. (2020). Feasibility study of optical fiber sensor applied on HTS conductors. Physica C: Superconductivity and its Applications, 575, 1353693. DOI 10.1016/j.physc.2020.1353693. [Google Scholar] [CrossRef]
20. Akram, S., Wang, P., Nazir, M. T., Zhou, K., Bhutta, M. S. et al. (2020). Impact of impulse voltage frequency on the partial discharge characteristic of electric vehicles motor insulation. Engineering Failure Analysis, 116, 104767. DOI 10.1016/j.engfailanal.2020.104767. [Google Scholar] [CrossRef]
21. Susa, D., Lehtonen, M., Nordman, H. (2005). Dynamic thermal modeling of distribution transformers. IEEE Transactions on Power Delivery, 20, 1919–1929. DOI 10.1109/TPWRD.2005.848675. [Google Scholar] [CrossRef]
22. Kasinathan, M., Praveen, O., Sosamma, S., Kumar, A., Rao, C. B. et al. (2012). Hotspot monitoring in transformers using fiber bragg grating. International Conference on Fiber Optics and Photonics, pp. 1–3. IIT Madras, India, IEEE. [Google Scholar]
23. Akram, S., Castellon, J., Kai, Z., Agnel, S., Habas, J. P. et al. (2020). Dielectric properties and modeling of multilayer polyimide nanocomposite to highlight the impact of nanoparticles dispersion. IEEE Transactions on Dielectrics and Electrical Insulation, 27, 1238–1246. DOI 10.1109/TDEI.94. [Google Scholar] [CrossRef]
24. Liu, Y., Yin, J., Tian, Y., Fan, X. (2019). Design and performance test of transformer winding optical fibre composite wire based on Raman scattering. Sensors, 19, 2171. DOI 10.3390/s19092171. [Google Scholar] [CrossRef]
25. Lu, P., Buric, M. P., Byerly, K., Moon, S. R., Nazmunnahar, M. et al. (2019). Real-time monitoring of temperature rises of energized transformer cores with distributed optical fiber sensors. IEEE Transactions on Power Delivery, 34, 1588–1598. DOI 10.1109/TPWRD.61. [Google Scholar] [CrossRef]
26. Bal, S., Demirdelen, T., Tümay, M. (2019). Three-phase distribution transformer modeling and electromagnetic transient analysis using ANSYS Maxwell. 3rd International Symposium on Multidisciplinary Studies and Innovative Technologies (ISMSITpp. 1–4. Ankara, Turkey, IEEE. [Google Scholar]
27. Akram, S., Castellon, J., Agnel, S., Zhou, K., Habas, J. P. et al. (2021). Multilayer polyimide nanocomposite films synthesis process optimization impact on nanoparticles dispersion and their dielectric performance. Journal of Applied Polymer Science, 138, 49715. DOI 10.1002/app.49715. [Google Scholar] [CrossRef]
28. Bal, S., Demirdelen, T., Tümay, M. (2019). Lightning electric field analysis of a transformer using ANSYS Maxwell. 3rd International Symposium on Multidisciplinary Studies and Innovative Technologies, pp. 1–4. Ankara, Turkey, IEEE. [Google Scholar]
29. Ziomek, W., Vijayan, K., Boyd, D., Kuby, K., Franchek, M. (2011). High voltage power transformer insulation design. Electrical Insulation Conference, pp. 211–215. Annapolis, Maryland, USA, IEEE. [Google Scholar]
30. Tapiawala, G., Mishra, R. K. (2016). Comprehensive modeling of dry type foil winding transformer to analyse inter turn insulation under lightning impulse voltage. National Power Systems Conference, pp. 1–5. IIT Bhubaneswar, India, IEEE. [Google Scholar]
31. Dutta, B. K. (2015). Heat transfer: Principles and applications. Dehli, India: PHI Learning Private Limited. [Google Scholar]
32. Forsberg, C. H. (2020). Heat transfer principles and applications. USA: Academic Press. [Google Scholar]
33. Wang, Y. Q., Cui, H. H., Yuan, S., Bi, J. G., Liu, Y. P. (2014). Research of temperature sensor arrangement based on transformer hot-spot temperature estimates. International Conference on Power System Technology, pp. 1393–1397. Chengdu, China, IEEE. [Google Scholar]
34. Jardini, J. A., Brittes, J. L. P., Magrini, L. C., Bini, M. A., Yasuoka, J. (2005). Power transformer temperature evaluation for overloading conditions. IEEE Transactions on Power Delivery, 20, 179–184. DOI 10.1109/TPWRD.2004.835433. [Google Scholar] [CrossRef]
35. Das, A. K., Chatterjee, S. (2017). Finite element method-based modelling of flow rate and temperature distribution in an oil-filled disc-type winding transformer using COMSOL multiphysics. IET Electric Power Applications, 11, 664–673. DOI 10.1049/iet-epa.2016.0446. [Google Scholar] [CrossRef]
 | This work is licensed under a Creative Commons Attribution 4.0 International License, which permits unrestricted use, distribution, and reproduction in any medium, provided the original work is properly cited. |