| Computer Modeling in Engineering & Sciences |
DOI: 10.32604/cmes.2022.016224
ARTICLE
Analysis of Water Pollution Causes and Control Countermeasures in Liaohe Estuary via Support Vector Machine Particle Swarm Optimization under Deep Learning
1College of Environmental Science and Engineering, Ocean University of China, Qingdao, 266003, China
2National Marine Environmental Monitoring Center, Ministry of Ecology and Environment, Dalian, 116023, China
*Corresponding Author: Yanbin Gu. Email: ybgu@nmemc.org.cn
Received: 26 February 2021; Accepted: 16 June 2021
Abstract: This study explores the loss or degradation of the ecosystem and its service function in the Liaohe estuary coastal zone due to the deterioration of water quality. A prediction system based on support vector machine (SVM)-particle swarm optimization (PSO) (SVM-PSO) algorithm is proposed under the background of deep learning. SVM-PSO algorithm is employed to analyze the pollution status of the Liaohe estuary, so is the difference in water pollution of different sea consuming types. Based on the analysis results for causes of pollution, the control countermeasures of water pollution in Liaohe estuary are put forward. The results suggest that the water pollution index prediction model based on SVM-PSO algorithm shows the maximum error of 2.41%, the average error of 1.24% in predicting the samples, the root mean square error (RMSE) of 5.36 × 10⁻⁴, and the square of correlation coefficient of 0.91. Therefore, the prediction system in this study is feasible. At present, the water pollution status of Liaohe estuary is of moderate and severe levels of eutrophication, and the water pollution status basically remains at the level of mild pollution. The general trend is from phosphorus moderate restricted eutrophication to phosphorus restricted potential eutrophication. To sum up, the SVM-PSO algorithm shows good sewage prediction ability, which can be applied and promoted in water pollution control and has reliable reference significance.
Keywords: Water pollution; countermeasure analysis; support vector machine; particle swarm optimization
With the acceleration of industrialization in recent years, China’s economic growth rate has increased by leaps and bounds. However, rapid economic development is a double-edged sword. It can improve the quality of people’s lives. It can generate varying degrees of negative impacts on the ecological environment, such as over-utilization of resources, environmental pollution, and water pollution. Water pollution is severe, and pollution of water resources such as rivers, lakes, and oceans can be seen everywhere [1]. The destruction of the ecological environment has aroused the attention of all sectors of society. The water body eutrophication has become a worldwide task for water pollution control and a hot issue for environmental scientists. Eutrophication has been raised since the beginning of the 20th century [2,3]. Eutrophication means that nutrients such as nitrogen and phosphorus needed by organisms enter slow-flowing water bodies in large quantities under the influence of human activities. It can cause the rapid reproduction of algae and other organisms, the decline of water solubility, the deterioration of water quality, and the massive death of fish. Eutrophication can be natural and man-made. Under natural conditions, lakes will transition from oligotrophic to eutrophic, but this process is prolonged, often requiring thousands or even tens of thousands of years [4]. The water body eutrophication caused by man-made discharge of nutrient-containing industrial wastewater and domestic sewage can appear quickly. The current water body eutrophication is severe and has become one of the global environmental problems.
The Liaohe estuary wetland is located on the northern bank of the Liaodong Bay of the Bohai Sea, the southernmost point of the Liaohe Delta. The water source comes from Daliao River, Liao River, Daling River, and Xiaoling River. Permanent freshwater marshes, salt marshes, beaches, and intertidal tidal flats are formed at the head of Liaodong Bay [5]. The Liaohe estuary wetland covers an area of 3,149 square kilometers and consists of natural wetlands and constructed wetlands. Liaohe estuary is one of the important gateways of the Northeast Bohai Sea with its unique natural conditions and good marine industry [5]. However, the pollution of Liaohe estuary has become more and more serious in recent years, mainly in the following aspects. First of all, environmental input pressure has caused serious marine water pollution. The health status of the Liaohe estuary ecological monitoring area has been in a sub-healthy or unhealthy state. Secondly, the impacts of human development and utilization activities in the estuary area, including human activities, oilfield development, and aquaculture, have caused some pollution to the water of Liaohe estuary. Finally, the natural deposition in the estuary area led to the change of natural habitat and the succession of vegetation [6]. The Liaohe estuary is of great significance to the Northeast of China, so it is urgent to control its water pollution.
Particle swarm optimization (PSO) is a new global optimization evolutionary algorithm proposed by American scholars. The algorithm is developed based on the simulation of a school of birds and a school of fish. PSO algorithm is an effective tool for nonlinear continuous optimization, combinatorial optimization, and mixed-integer nonlinear optimization [7]. It is characterized by fast convergence speed with fewer parameters to be set. The pollution control plan of the water environment is a complex system. It involves the social, economic, water quality status, pollution load, pollution source parameters, water quality parameters, and hydrological conditions of the entire water area. The water environment management system is of non-linearity, non-uniformity, network type, and controllability [8].
Based on the above backgrounds, the support vector machine (SVM)-PSO algorithm is proposed to predict the water pollution of Liaohe estuary. The overview of Liaohe estuary and the SVM-PSO used in this study is introduced. Then, a pollution index prediction system based on SVM-PSO is constructed, the performance of which is analyzed. In addition, the water pollution control strategy is proposed based on the relevant data of the water pollution status evaluation and the water pollution difference analysis. This study aims to provide a good theoretical basis for the application of deep learning in water pollution environments.
2.1 General Geographical Situation of Liaohe Estuary
Liaohe estuary has a total length of 1,430 km, a drainage area of 2193 × 105 km2, and flows through 8 cities. Liaohe estuary has vast tidal flats, wetlands, and large areas of shallow water resources. It contains abundant resources such as marine fishery, gasoline, salt, transportation, and tourism. Liaohe estuary wetland covers area of 3,149 km2 and is composed of natural and artificial wetlands. The Liaohe estuary area is an important part of Liaoning coastal economic belt, the core node of the spindle of “Dalian-Yingkou-Panjin”, and a hub region organically connected the overall layout framework of “one core, one axis, and two wings” of Liaoning coastal zone. It has unique natural conditions, and marine industrial foundation is good, which makes it one of the important sea gates of Bohai sea in the northeast.
In recent years, the environment in this area has been threatened by various pollutants, and the quality of the marine environment is very severe. The pollution characteristics are as follows. I: Daliao River is the largest pollution source in the Liaodong Bay. The main pollutants are biochemical oxygen demand (BOD), chemical oxygen demand (COD), and heavy metals. The adjacent seas of Daliao River are polluted to varying degrees. II: the contents of BOD, COD, and heavy metals in the wet period are higher than in the normal water period, and those in the dry period are the lowest. III: the content of pollutants such as inorganic nitrogen and inorganic phosphorus in normal water period is higher than that in high water period, and nutrients in Liaodong Bay in autumn are more likely to induce red tides.
Proposed in the 1990s, SVM is a popular statistical learning theory of machine learning languages, which can be used to solve the small sample and nonlinear high recognition pattern [9]. The expression is as follows:
The following equation is to simplify Eq. (1).
Eq. (1) can be expressed as follows:
In Eq. (3),
For SVM sample data, normalization should be carried out. In the case of a large number of matrix dimensions, the original data should be added (subtracted) to the same unit if the corresponding units of variables are not unified. However, there will be a very big gap in the meaning of variables reflected by the data nodes obtained in this way [13]. In addition, if the data scale is not uniform, the regression, classification, and prediction results of the data will be seriously affected [14]. On the other hand, it is extremely likely that the Karush-Kuhn-Tucker conditions are not up to the standard if the data are not normalized during the training, which may lead to a long operation time and even a dead cycle [15].
In the optimization process of SVM algorithm, the training sample can be defined as
The conditions that the optimal hyperplane has to satisfy are as follows:
In the equations,
When the quadratic programming of the optimal hyperplane is solved, Lagrange function should be constructed firstly.
In Eq. (8),
The optimization principle can be expressed in the following equations:
Under Karush-Kuhn-Tucker condition, w and b in the equation can be eliminated through joint solution, and Lagrange’s quadratic programming solution can be transformed into a generic function by WOLF dual theorem.
The optimal solution can be obtained as follows:
And the optimal hyperplane can be obtained as follows:
According to Eqs. (16) and (17), the selection of the correct kernel function should be paid attention to in the optimal hyperplane calculation of SVM algorithm, which is also the most important point in the SVM algorithm. There are four commonly used kernel functions, which are linear kernel function, polynomial kernel function, Gaussian kernel function, and exponential kernel function [18–21].
POS algorithm initializes the system with many random solutions and searches for the best through generations. Each particle in the particle swarm is a potential solution, and finding the best particle is the best solution to the problem. This technology can find the best parameters for the SVM model to better predict pollution. PSO has been widely used in SVM optimization. For example, Huang and Dunt proposed a PSO-SVM model to improve classification accuracy through appropriate feature subsets. The SVM algorithm falsely recruits the optimal parameters in the prediction area of the PSO model, which can more effectively overcome the problem of local optimization. Therefore, the SVM-PSO model is adopted to predict the indicators of water pollution, such as optical density, dissolved oxygen (DO) concentration, and pH. The solution of SVM is designed to be quadratic programming, so the computational complexity will increase with the increase of the number of training samples. In this study, the SVM-PSO prediction model has outstanding classification accuracy.
2.3 Construction of Pollution Index Prediction System Based on SVM-PSO Algorithms
There are 7 effective water quality detection indexes in the Liaohe estuary, and the water environment quality evaluation factors are determined by the evaluation of factor contribution rate. Due to the impacts of various pollution factors on water quality, different weights are given according to the size of the effect in water quality, and the main pollution indexes are determined by the weight. The evaluation standard adopts the EI classification standard. The evaluation indexes include eutrophication index, DO, COD, and oil pollution index.
To establish a water pollution index prediction system, the waters near the Liaohe estuary are selected for water quality evaluation, including eutrophication index and evaluation, organic pollution index and evaluation, and potential eutrophication evaluation of marine water. The response mechanism of karst groundwater quality with the change of influencing factors is analyzed under different indexes [22]. Some of the data received in this study are shown in Table 1.

The collected index sample sets have to be normalized and trained. The data set of the training sample is shown in Table 1. Seven influencing factors are selected from the indexes affecting water pollution, but the units, dimensions, and sample values of different factors are different, so it is necessary to carry out normalization processing and sample training for the purpose of preventing data loss, algorithm isn’t convergence, and failure to get the results [23]. In this study, MATLAB software is used for normalization preprocessing, and there is a normalized processing function for the data set in the SVM module.
The normalization processing method of MATLAB software is as follows (Fig. 1).
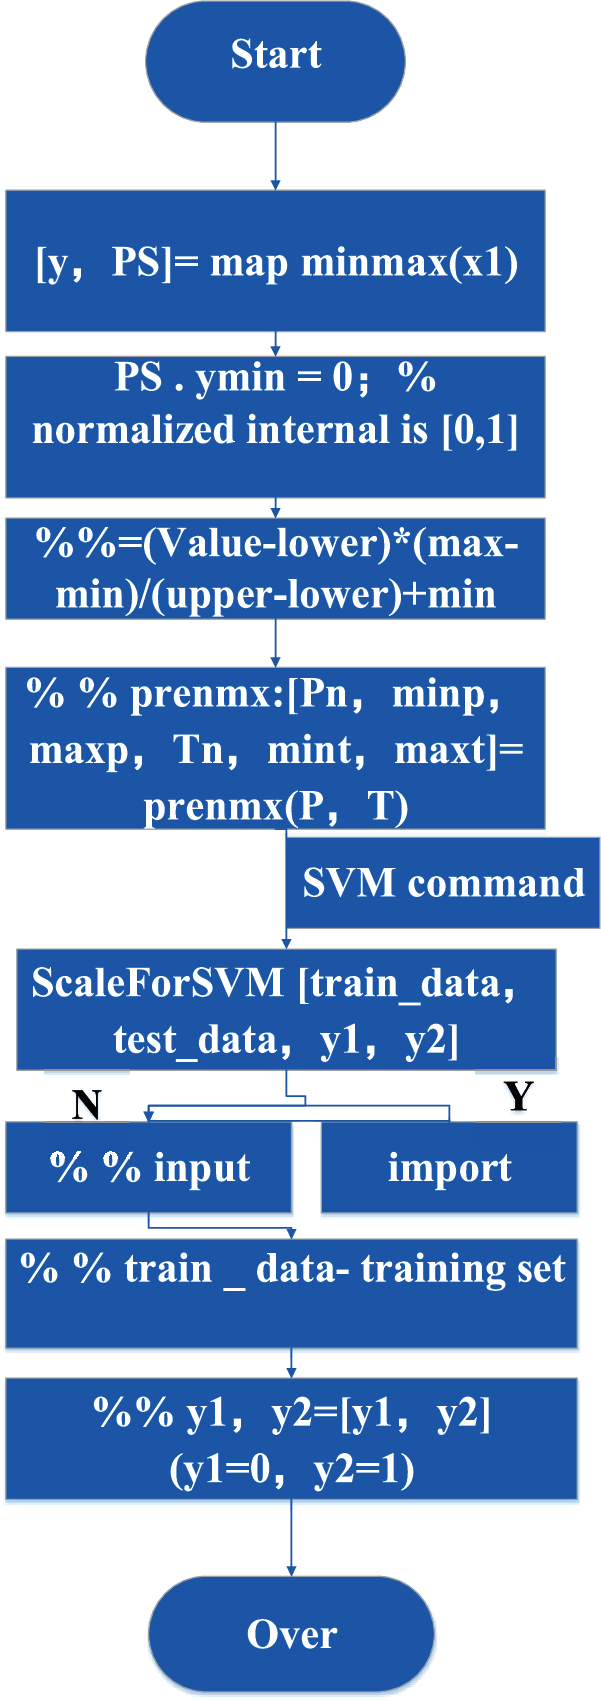
Figure 1: MATLAB flow charts
3.1 Systematic Error Analysis Based on SVM-PSO Algorithm
In this study, system establishment and error analysis are carried out after normalization of data in Table 2. First, 7 influencing factors and sample data are trained to establish the prediction sample set of marine water pollution. Then, 15 groups of randomly distributed sample data are used for testing, and the results of principal component extraction are shown in Fig. 2. It illustrates that the cumulative contribution rate of each principal component, and the cumulative contribution rate effected by the corresponding 5 components in the organic pollution index are different. The cumulative contribution rate of the first principal component to the fifth are 31.9%, 27.3%, 23.5%, 14.9%, and 12.4%, respectively. Moreover, the cumulative contribution rate is more than 97.3%, which is greatly different from the result of principal component extraction in rough sets.

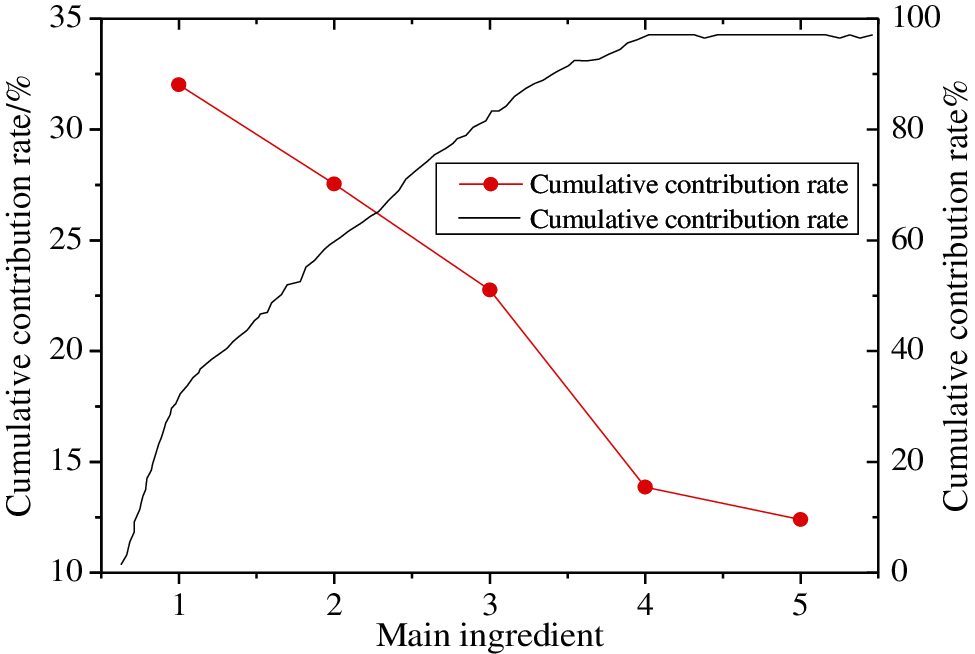
Figure 2: Contribution rate of water pollution principal component in Liaohe estuary
Then the data are normalized and dimensionality reduced, and the SVM parameters are optimized for the regression calculation of the training samples. The predicted results are shown in Figs. 3–6.
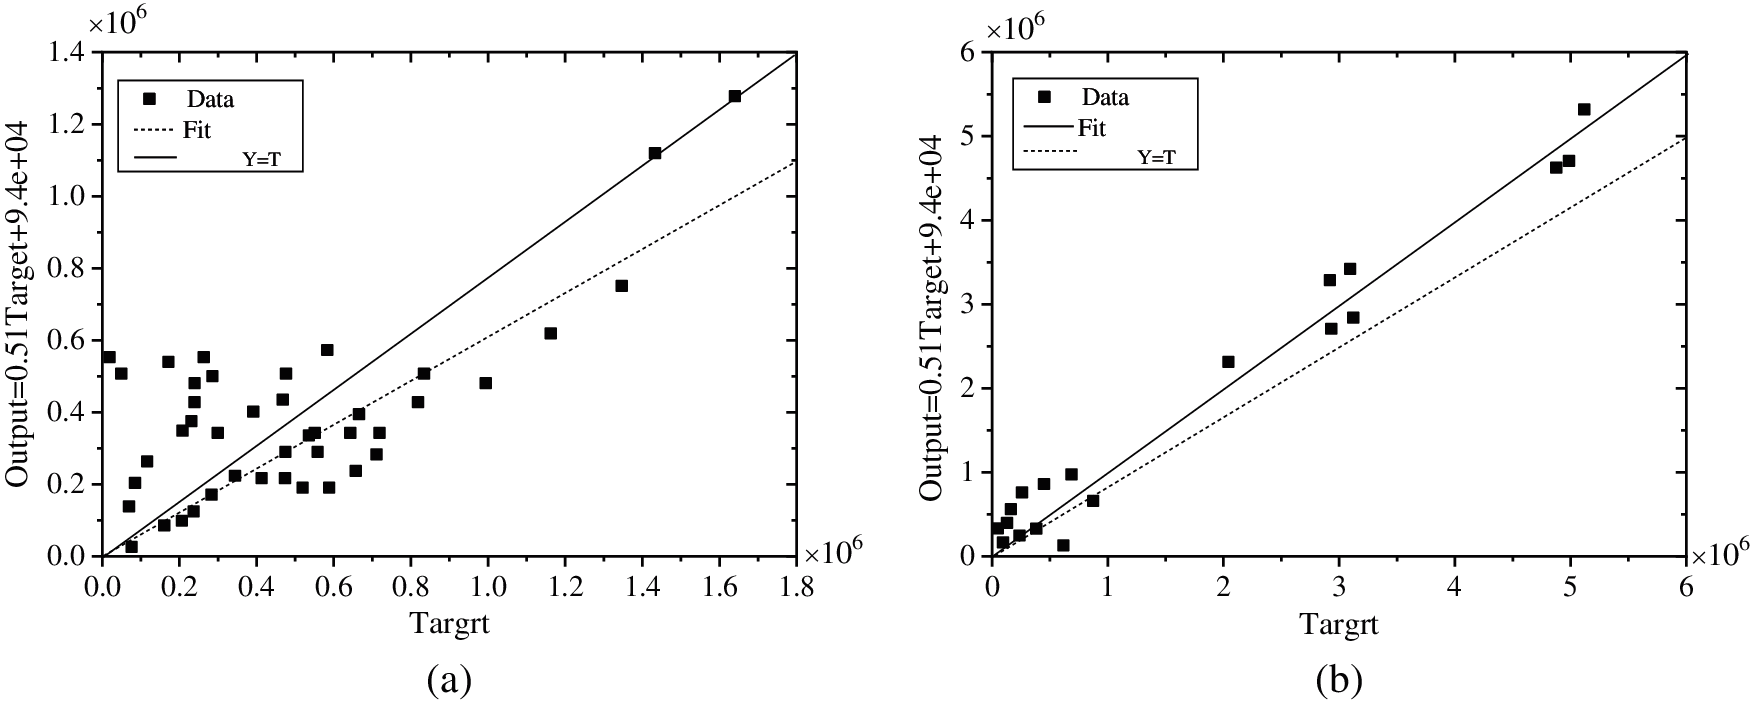
Figure 3: The regression curve of the SVM model test samples. (a) Training result of the first set of data, (b) Training result of the second set of data
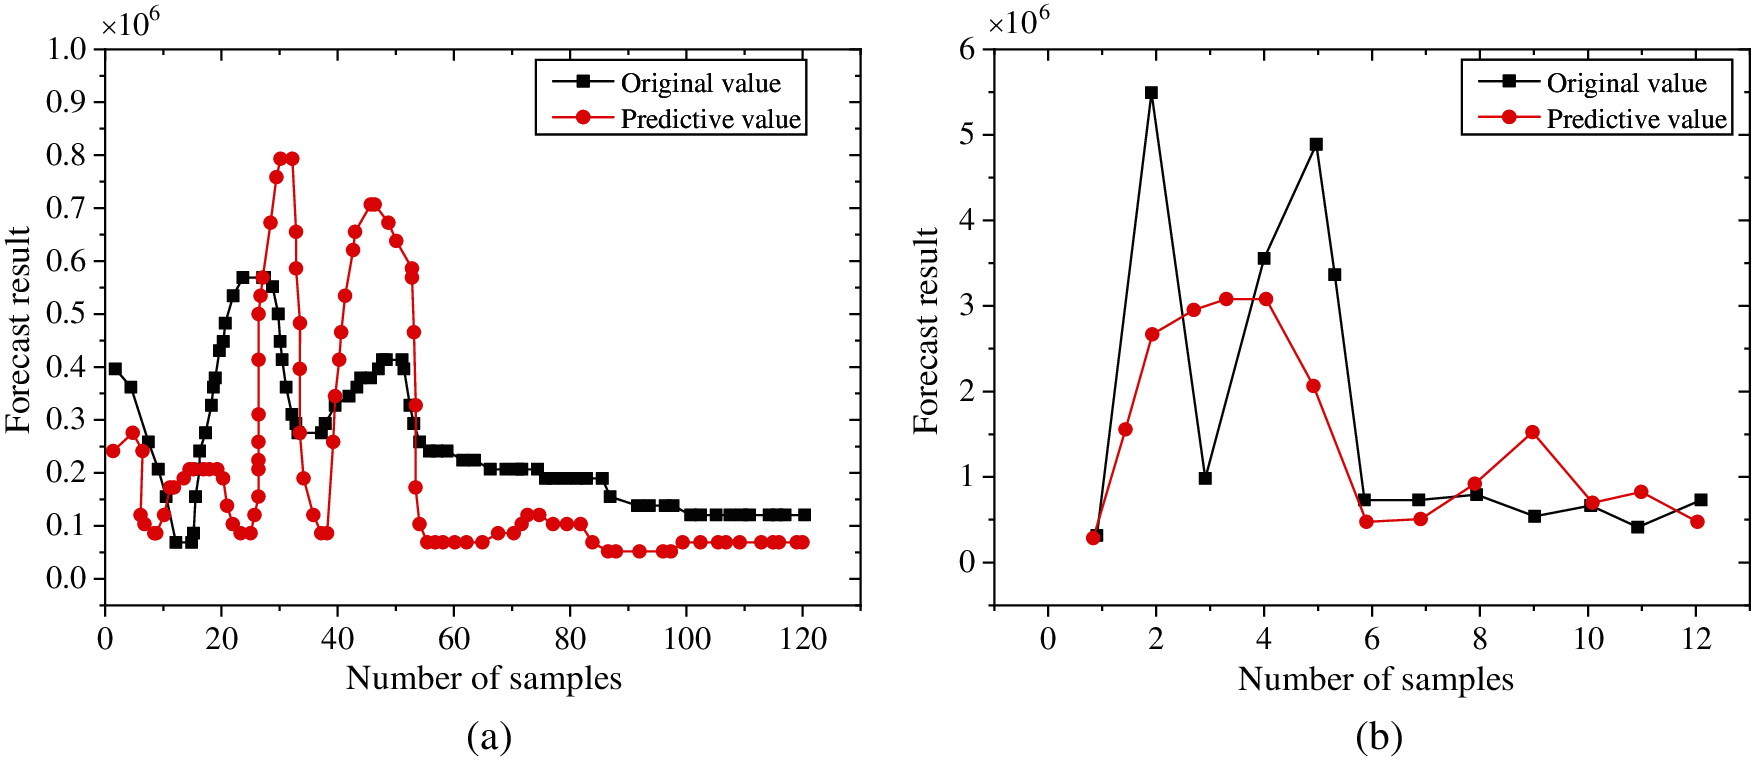
Figure 4: The regression curve of the SVM model prediction samples. (a) Training result of the first set of data, (b) Training result of the second set of data
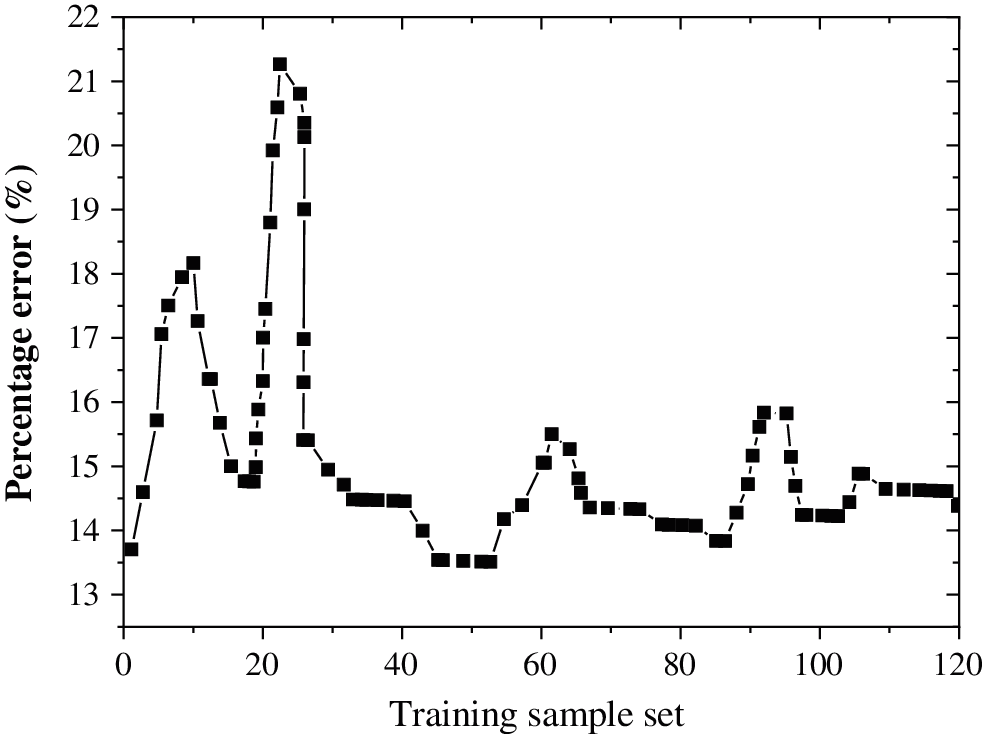
Figure 5: Training sample set percentage error
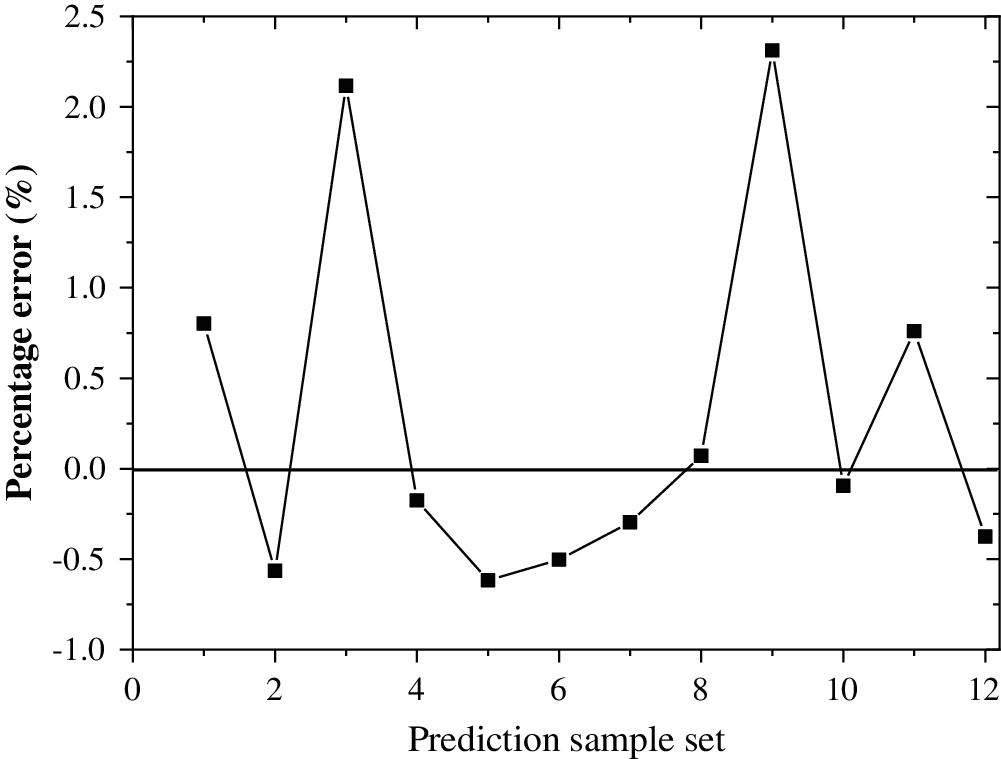
Figure 6: Prediction sample set percentage error
According to Table 2, the prediction system of water pollution index in Liaohe estuary is established by SVM-PSO algorithm. According to the normalized processing results of the data, the parameter values of SVM determined by the grid search algorithm are 0.732 and g is 1.73. The results satisfy the parameter optimization process of the prediction system. The sample data test is conducted, it is found that the maximum error of the prediction sample is 2.41%, and the average error is 1.24%. The RMSE of water pollution index prediction is 5.36 × 10⁻⁴, and the square of correlation coefficient is 0.91. Therefore, the prediction system in this study is feasible.
3.2 Evaluation Results of Water Pollution in Liaohe Estuary
In this study, the water quality is evaluated through eutrophication index, organic pollution index, and potential eutrophication evaluation of marine water after the prediction of water pollution in Liaohe estuary with SVM-PSO algorithm. Fig. 7 illustrates the eutrophication status of marine water quality in spring, summer, autumn, and winter in 2019. The marine water quality presents perennial eutrophication. Among them, severe eutrophication emerged in the summer of 2018 and continued in the first three seasons of 2018; the condition was not lightened until the summer of 2019, and it reappeared in the autumn of 2019. The eutrophication lasted for 4 consecutive years, and the general trend was from moderate to severe to moderate. However, the eutrophication of water quality changes significantly in each year, but there is no significant change rule.
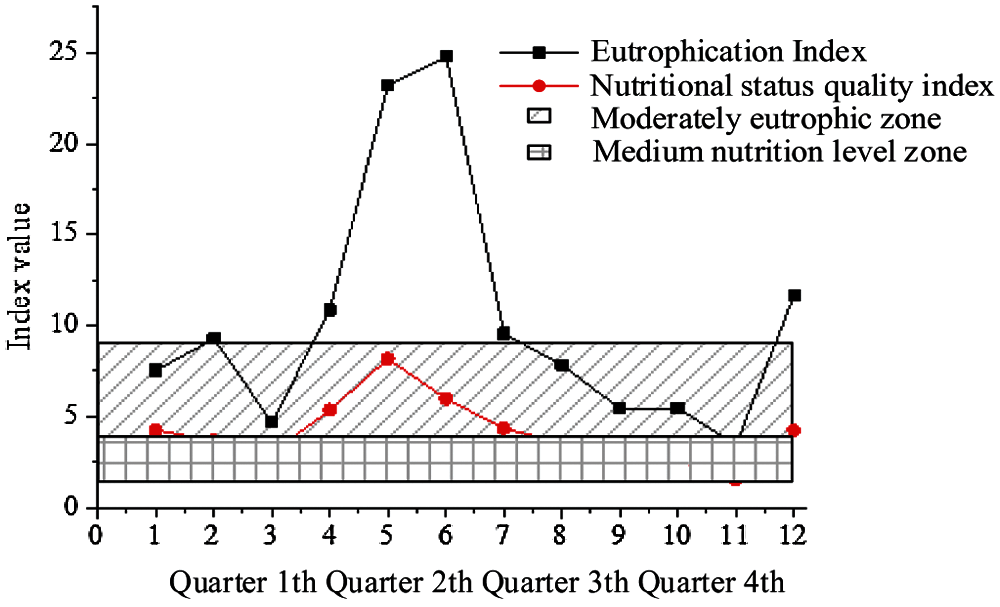
Figure 7: Eutrophication of marine water in Liaohe estuary in different seasons in 2019
I. Eutrophication index analysis results show that the index values are all greater than 1, within the range of 3.44~24.60. The water quality reaches the degree of moderate eutrophication and severe eutrophication. Nutrition state index (NQI) analysis results show that the index range is 1.76~9.61. Except for the poor nutrition level in the summer of 2015, the average nutrition level and the eutrophication level in other years and seasons are all moderate nutrition level and eutrophication level. The overall variation trend of eutrophication index and nutrient status quality index are consistent. The correlation analysis shows that P > 0.05, and the two methods present a good correlation.
II. The analysis results of the organic pollution index show that the index values are all greater than 1, and the index range is 1.52~8.27. The overall water quality is always in the state of being polluted from 2017 to 2019. Among them, the water quality in spring, summer, and autumn of 2017 gradually improved, and the annual trend of moderate pollution was from medium pollution to mild pollution to starting being polluted. By the spring of 2018, the pollution had increased again and reached the level of heavy pollution in the summer and autumn. From the spring of 2010 to the autumn of 2020, the pollution had been significantly alleviated, and the water pollution had basically remained at the level of mild pollution.
III. The evaluation of potential eutrophication in marine water is expressed by the ratio of nitrogen to phosphorus in marine water and the evaluation of potential eutrophication in each year and season. In the autumn of 2018 and 2019, the water environment was phosphorus moderate restricted eutrophication level, and it was phosphorus restricted potential eutrophication level in all other seasons. The general trend was from phosphorus moderate restricted eutrophication level to phosphorus restricted potential eutrophication level.
3.3 Differences Analysis of Water Pollution of Different Sea Consuming Types in Liaohe Estuary
The difference analysis of water pollution of different sea consuming types in Liaohe estuary is shown in Fig. 8. The 7 different sea consuming types of ship industry, port, open aquaculture, artificial pond, aquaculture, oil and gas exploitation, and fishery foundation are mainly investigated in this study.
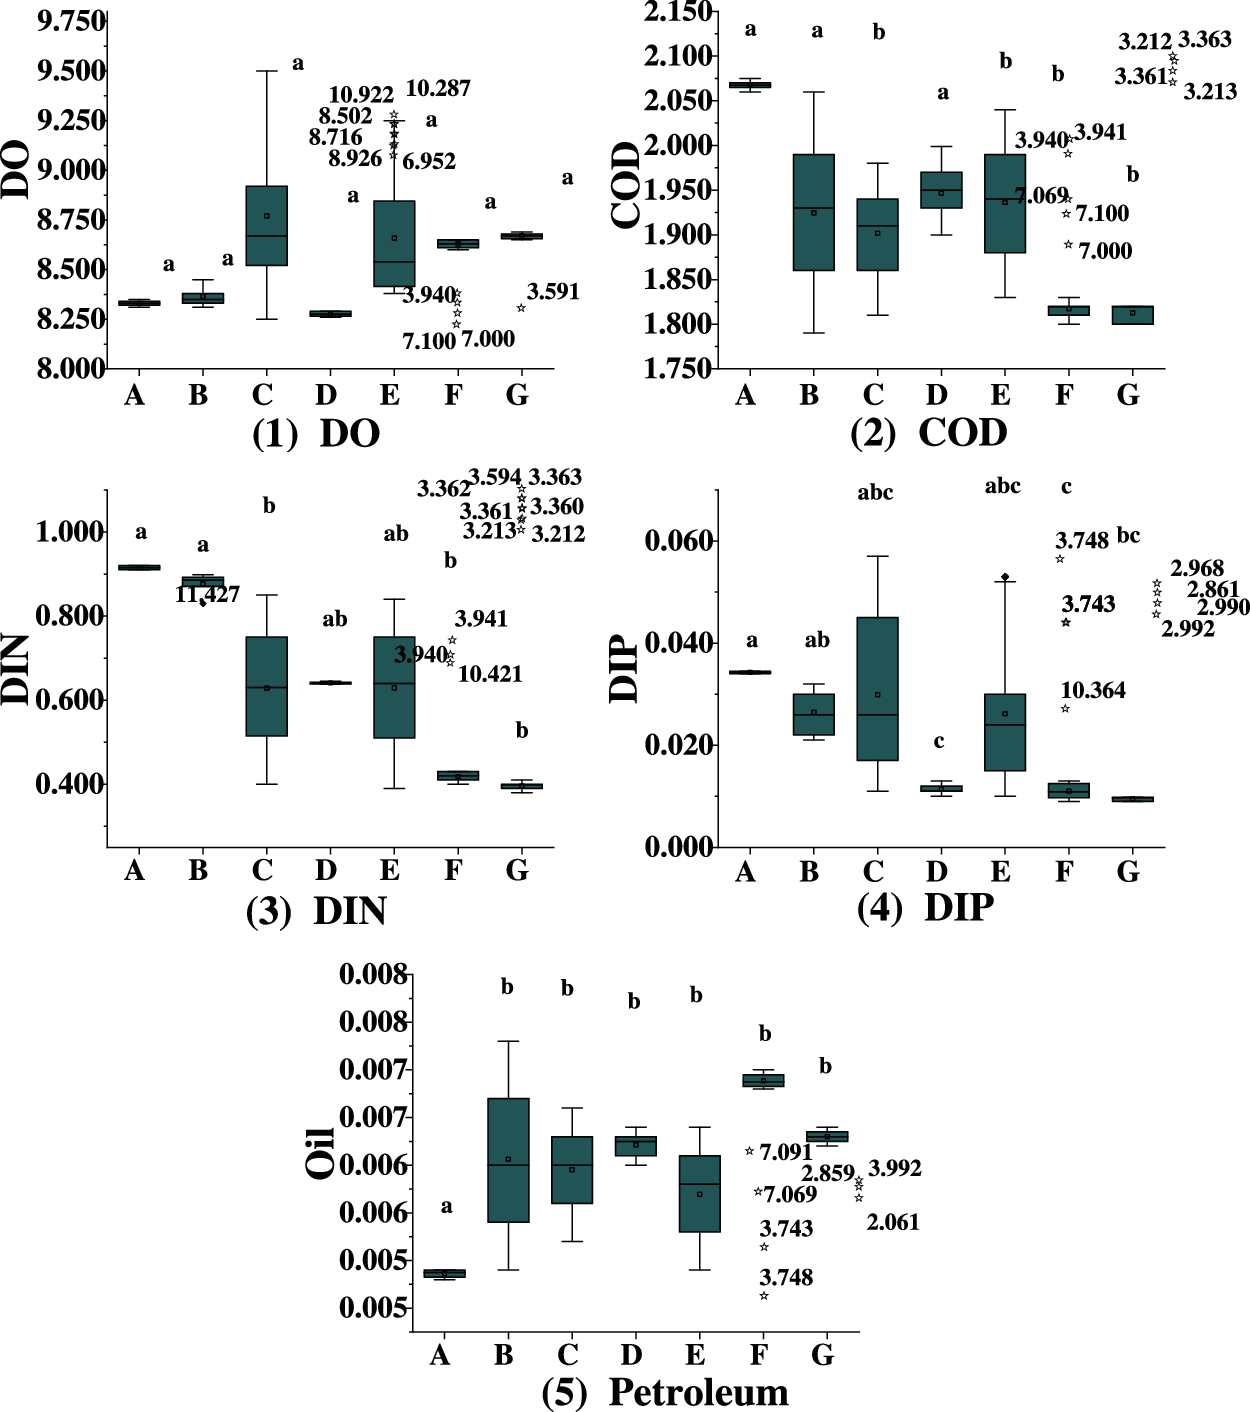
Figure 8: The difference analysis of water quality parameters of different sea consuming types. (a indicates that the difference is statistically considerable vs. other indexes; b indicates that the difference is statistically considerable vs. a; and c indicates that the difference is statistically considerable vs. a and b)
Fig. 8(1) shows the difference analysis of water pollution of DO. It can be seen that the DO emissions from open aquaculture and fishery infrastructure are relatively high, while the average DO emissions from artificial reef and marine industry are relatively low. Fig. 8(2) shows the difference analysis of water pollution of COD. It can be seen that the highest average COD emissions is from shipbuilding industry, while the lowest average COD emissions is from oil and gas exploration. There are significant differences in the emissions of carbonic oxide (CO) in marine industry, marine oil and gas exploitation, marine fishery infrastructure, open aquaculture, and marine aquaculture. Fig. 8(3) shows the difference analysis of water pollution of dissolved inorganic nitrogen (DIN). DIN emissions mean value of each sea consuming types shows that DIN emission from shipbuilding industry is the highest, while that from oil and gas exploration is the lowest. The difference of its emission in marine industry, port, oil and gas exploitation, fishery infrastructure, and open aquaculture is significant. Fig. 8(4) shows the difference analysis of water pollution of dissolved inorganic phosphorus (DIP). According to the average DIP emission of each sea consuming types, the DIP emission from shipbuilding industry is the highest, while that from artificial reef is the lowest. The mean values of DIP emission from artificial reef and oil and gas exploration are significantly different from that of port and marine industry. Fig. 8(5) shows the difference analysis of water pollution of petroleum. The average emission of petroleum from different sea consuming types shows that the highest emission is from oil and gas exploitation and the lowest is from marine industry. The change of petroleum emission between other types is not significant except for the shipbuilding industry.
It can be concluded that the factors of water environment of different sea consuming types show different changing rules. In particular, the relative changes of COD, DIN, and DIP in various sea consuming types are significant. The mean values of these three indexes are the highest in the sea consuming type of shipping industry. The main pollution factors in this area are obviously affected by the industrial activities near the shore. However, as there are only two marine areas used by shipbuilding industry, which are relatively concentrated, the specific influence degree needs to be further determined. The analysis of the eutrophication index of the Liaohe estuary from 2017 to 2019 shows that the water quality of the marine water presents the perennial eutrophication, and the overall trend is moderate to severe to moderate. Among them, severe eutrophication emerged in the summer of 2017, continued in the first three seasons of 2018, alleviated in the summer of 2019, and reappeared in the autumn of 2019. However, from the perspective of seasons, the eutrophication of water quality changed significantly in each year, but there was no significant change rule. The eutrophication evaluation results showed that the estuary area was at the level of severe eutrophication, and the degree of eutrophication improved with the flow direction of the river. The moderate to severe eutrophication area covered more than 3/4 of the area, and the moderate eutrophication area was the largest, which was consistent with the results of the trend evaluation of water quality status in the autumn of 2018.
The organic pollution index analysis of the Liaohe estuary from 2017 to 2019 shows that the marine water quality is always in a state of being polluted. Among them, the water quality in spring, summer, and autumn of 2017 gradually improved, and with the annual trend of moderate pollution to mild pollution to early stage of pollution. By the spring of 2018, the pollution had increased again and reached the level of heavy pollution in the summer and autumn. From the spring of 2017 to the autumn of 2018, the pollution was significantly alleviated, and the water pollution remained basically at a mild level. The results of organic pollution evaluation show that the estuary area is moderately and severely polluted, and the pollution is diluted with the flow direction of the river, yet an obvious pollution zone has been formed in the central region of Liaohe estuary due to the weak hydrodynamic condition on the right side of the estuary, which affects the water quality of the region greatly.
3.4 Control Countermeasures of Water Pollution in Liaohe Estuary
The pollution of nitrogen and phosphorus in the marine area near the Liaohe estuary is serious. The main causes of water pollution are as follows. The land pollution inflow amount is massive; Daliao river inflow pollution proportion is high; the water exchange capacity of the marine area adjacent to the Liaohe estuary is very weak, and that of the marine area adjacent to the Daliaohe river is the weakest; there is high inventory of nitrogen and phosphorus pollutants in Liaohe estuary. According to the above reasons, the corresponding control strategies are proposed.
I. Achieving the stability of the surface basement of the ecosystem. The surface basement is the carrier of the development and existence of the ecosystem, so the instability of the basement cannot guarantee the succession and development of the ecosystem. Therefore, the restoration of the base type of the ecosystem is the primary purpose of the restoration project.
II. Realizing the ecological system restoration and coordinated development of regional social, economic, and cultural development. The restoration project is the restoration of wetland ecosystem, which requires the balance of ecological, economic, and social factors. Therefore, the rationality of the public requirements and policies should also be concerned in addition to considering the ecological rationality of the renovation project. The integrated social, economic, and cultural impacts on the region should be taken into account, so that the historical culture of Panjin in the process of marine economic development is shown, and the social culture, regional economic development, and ecological system restoration are combined, with overall consideration and comprehensive development.
III. Restoring the natural functions of wetlands according to the principle of ecological restoration. The restoration project is a process of restoring the biological community and its composition, structure, function, and natural ecology of the degraded wetland ecosystem. A complete ecosystem is resilient, self-sustaining, and able to withstand certain environmental pressures and changes, whose major ecological conditions operate normally within a certain range of natural variations.
The Liaohe estuary wetland is taken as the research object to discuss the causes of water pollution in Liaohe estuary and the prevention and control measures in this study. Based on the idea of deep learning, the SVM-PSO algorithm for predicting the water pollution index of Liaohe estuary is proposed, and the systematic error results of SVM-PSO algorithm are analyzed. It is concluded that the index prediction system proposed in this study is feasible. In addition, the state of water pollution in the Liaohe estuary and the differences in water pollution of different sea consuming types are evaluated and analyzed. The results show that the water quality of Liaohe estuary is moderate and severe eutrophication. Organic pollution is at the mild level, and the potential eutrophication shows a trend of phosphorus moderate restricted eutrophication to phosphorus restricted potential eutrophication. Different factors of the water environment of different sea consuming types show different variation rules, especially COD, DIN, and DIP, which are relatively significant in different sea consuming types. The mean values of these three indexes are the highest in the shipping industry sea consuming type. According to the situation of water pollution, 3 prevention and control strategies are proposed. This study provides a good significance for improving the quality of water pollution in Liaohe estuary wetland, but there are still some limitations. In this study, the selection range of training sample and prediction sample data set of SVM-PSO algorithm is small, and the number of sample sets should be expanded in the following researches.
To sum up, adopting SVM-PSO pollution prediction system to predict the water pollution index of Liaohe estuary has a good predictive effect, which can be promoted and used in water pollution prevention and treatment, and it also provides a reliable reference for subsequent research.
Funding Statement: This work was supported by National Key R&D Program of China (2019YFC1407700), National Natural Science Foundation of China (Grant 41606141), Study on the mechanisms of macrobenthos responses to oil spill based on MINE method.
Conflicts of Interest: The authors declare that they have no conflicts of interest to report regarding the present study.
1. Li, T., Chu, C., Zhang, Y., Ju, M., Wang, Y. (2017). Contrasting eutrophication risks and countermeasures in different water bodies: Assessments to support targeted watershed management. International Journal of Environmental Research and Public Health, 14(17), 695. DOI 10.3390/ijerph14070695. [Google Scholar] [CrossRef]
2. Chen, Z., Huang, P., Zhang, Z. (2019). Interaction between carbon dioxide emissions and eutrophication in a drinking water reservoir: A three-dimensional ecological modeling approach. Science of the Total Environment, 663, 369–379. DOI 10.1016/j.scitotenv.2019.01.336. [Google Scholar] [CrossRef]
3. Li, W., Liu, F., Wang, F., Ding, M., Liu, T. (2020). Industrial water pollution and transboundary eco-compensation: Analyzing the case of Songhua River Basin, China. Environmental Science and Pollution Research, 27(28), 34746–34759. DOI 10.1007/s11356-019-07254-9. [Google Scholar] [CrossRef]
4. Rashtian, J., Chavkin, D. E., Merhi, Z. (2019). Water and soil pollution as determinant of water and food quality/contamination and its impact on female fertility. Reproductive Biology and Endocrinology, 17(1), 5. DOI 10.1186/s12958-018-0448-5. [Google Scholar] [CrossRef]
5. Hao, S., Ling, J., Ling, H. (2017). Elementary analysis on countermeasure for current situation and improvement of an Urban River in regions south of Yangtze River. Urban Roads Bridges & Flood Control, 4(4), 120–123. DOI 10.16799/j.cnki.csdqyfh.2017.04.035. [Google Scholar] [CrossRef]
6. Yang, S., Tian, H., Shi, J. (2017). Survey on and countermeasures for chemical pollution of water used in large hotels: A case study. Chemical Engineering Transactions, 62, 601–606. DOI 10.3303/CET1762101. [Google Scholar] [CrossRef]
7. Chen, Z., Cao, H., Ye, K., Zhu, H., Li, S. (2015). Improved particle swarm optimization-based form-finding method for suspension bridge installation analysis. Journal of Computing in Civil Engineering, 29(3), 04014047. DOI 10.1061/(ASCE)CP.1943-5487.0000354. [Google Scholar] [CrossRef]
8. Bailey, T. L. (2019). MD-SVM: A novel SVM-based algorithm for the motif discovery of transcription factor binding sites. BMC Bioinformatics, 20(Suppl 7), 200. DOI 10.1186/s12859-019-2735-3. [Google Scholar] [CrossRef]
9. Su, Y. (2019). Dynamic security assessment and the countermeasures analysis of land ecology in Henan province from 2007 to 2017. RSC Advances, 9(56), 32414–32424. DOI 10.1039/C9RA05318B. [Google Scholar] [CrossRef]
10. Zhang, Y., Du, W., Han, Z. (2017). Analysis on prevention and countermeasures for the atmospheric pollution in Beijing-Tianjin-Hebei region. Journal of Green Science and Technology, 1(2), 39–40. DOI CNKI:SUN:LVKJ.0.2017-02-015. [Google Scholar]
11. Xin, K., Tao, T., Li, S. (2017). Contamination accidents in China’s drinking water distribution networks: Status and countermeasures. Water Policy, 19(1), 13–27. DOI 10.2166/wp.2016.157. [Google Scholar] [CrossRef]
12. Guo, G., Cheng, G. (2019). Mathematical modelling and application for simulation of water pollution accidents. Process Safety and Environmental Protection, 127(1), 189–196. DOI 10.1016/j.psep.2019.05.012. [Google Scholar] [CrossRef]
13. Lin, L. U., Wang, E. Q., Ji, H. L., Pang, J. J. (2017). Strategic necessity analysis and countermeasures of oil-use peony industrial development in China. Acta Agriculturae Jiangxi, 29(7), 147–150. DOI 10.19386/j.cnki.jxnyxb.2017.07.31. [Google Scholar] [CrossRef]
14. Yang, M., Zou, M., Liu, H. M. (2018). Pollution status and countermeasures analysis of cadmium in infant formula of Jiangxi province. Journal of Food Safety and Quality, 9(23), 6334–6337. DOI 10.3969/j.issn.2095-0381.2018.23.044. [Google Scholar] [CrossRef]
15. Tang, C., Yi, Y., Yang, Z., Sun, J. (2016). Risk analysis of emergent water pollution accidents based on a bayesian network. Journal of Environmental Management, 165, 199–205. DOI 10.1016/j.jenvman.2015.09.024. [Google Scholar] [CrossRef]
16. Sairinen, R., Tiainen, H., Mononen, T. (2017). Talvivaara mine and water pollution: An analysis of mining conflict in Finland. The Extractive Industries and Society, 4(3), 640–651. DOI 10.1016/j.exis.2017.05.001. [Google Scholar] [CrossRef]
17. Li, C., Sun, L., Jia, J., Cai, Y., Wang, X. (2016). Risk assessment of water pollution sources based on an integrated k-means clustering and set pair analysis method in the region of Shiyan. China Science of the Total Environment, 557, 307–316. DOI 10.1016/j.scitotenv.2016.03.069. [Google Scholar] [CrossRef]
18. Zheng, H., Lei, X., Shang, Y., Duan, Y., Kong, L. et al. (2018). Sudden water pollution accidents and reservoir emergency operations: Impact analysis at Danjiangkou reservoir. Environmental Technology, 39(6), 787–803. DOI 10.1080/09593330.2017.1311945. [Google Scholar] [CrossRef]
19. Yusuf, I. A. (2016). Analysis of water pollution control in the upper Citarum river zone using multi-dimensional scalling model. Jurnal Sumber Daya Air, 12(1), 17–32. DOI 10.32679/jsda.v12i1.162. [Google Scholar] [CrossRef]
20. Long, S., Zhao, L., Shi, T., Li, J., Yang, J. et al. (2018). Pollution control and cost analysis of wastewater treatment at industrial parks in Taihu and Haihe water basins. China Journal of Cleaner Production, 172, 2435–2442. DOI 10.1016/j.jclepro.2017.11.167. [Google Scholar] [CrossRef]
21. Li, D., Shi, L., Dong, Z., Liu, J., Xu, W. (2019). Risk analysis of sudden water pollution in a plain river network system based on fuzzy-stochastic methods. Stochastic Environmental Research and Risk Assessment, 33(2), 359–374. DOI 10.1007/s00477-018-01645-z. [Google Scholar] [CrossRef]
22. Chaudhary, M., Mishra, S., Kumar, A. (2017). Estimation of water pollution and probability of health risk due to imbalanced nutrients in River Ganga, India. International Journal of River Basin Management, 15(1), 53–60. DOI 10.1080/15715124.2016.1205078. [Google Scholar] [CrossRef]
23. Knieper, C., Pahl-Wostl, C. (2016). A comparative analysis of water governance, water management, and environmental performance in River Ganga, India. Water Resources Management, 30(7), 2161–2177. DOI 10.1007/s11269-016-1276-z. [Google Scholar] [CrossRef]
 | This work is licensed under a Creative Commons Attribution 4.0 International License, which permits unrestricted use, distribution, and reproduction in any medium, provided the original work is properly cited. |