| Computer Modeling in Engineering & Sciences |
DOI: 10.32604/cmes.2022.016437
ARTICLE
Sustainable Investment Forecasting of Power Grids Based on the Deep Restricted Boltzmann Machine Optimized by the Lion Algorithm
1School of Economics and Management, Jilin Institute of Chemical Technology, Jilin, 132022, China
2School of Economics and Management, Northeast Electric Power University, Jilin, 132012, China
3Digital Grid Research Institute, China Southern Power Grid, Guangzhou, 510000, China
4School of Art, Hebei GEO University, Shijiazhuang, 050031, China
*Corresponding Author: Xiaolong Yang. Email: yangxiaolong@neepu.edu.cn
Received: 06 March 2021; Accepted: 26 July 2021
Abstract: This paper proposes a new power grid investment prediction model based on the deep restricted Boltzmann machine (DRBM) optimized by the Lion algorithm (LA). Firstly, two factors including transmission and distribution price reform (TDPR) and 5G station construction were comprehensively incorporated into the consideration of influencing factors, and the fuzzy threshold method was used to screen out critical influencing factors. Then, the LA was used to optimize the parameters of the DRBM model to improve the model's prediction accuracy, and the model was trained with the selected influencing factors and investment. Finally, the LA-DRBM model was used to predict the investment of a power grid enterprise, and the final prediction result was obtained by modifying the initial result with the modifying factors. The LA-DRBM model compensates for the deficiency of the single model, and greatly improves the investment prediction accuracy of the power grid. In this study, a power grid enterprise was taken as an example to carry out an empirical analysis to prove the validity of the model, and a comparison with the RBM, support vector machine (SVM), back propagation neural network (BPNN), and regression model was conducted to verify the superiority of the model. The conclusion indicates that the proposed model has a strong generalization ability and good robustness, is able to abstract the combination of low-level features into high-level features, and can improve the efficiency of the model's calculations for investment prediction of power grid enterprises.
Keywords: Lion algorithm; deep restricted boltzmann machine; fuzzy threshold method; power grid investment forecasting
With the concept of sustainable development and green economy becoming important themes of current development in various fields, the focus on accelerating the transformation of economic development models has highlighted resource-saving and environment-friendly attributes of society. With the exponential growth of electricity consumption and the expansion of the scale of investment, the critical factors affecting investment in power grids have become increasingly diversified. Investment in power grid enterprises is no longer only affected by traditional factors but is also affected by emerging factors brought by the advancement of power grids. For example, the income model of power grid investment is greatly affected by power system reform [1,2], and the integration and sharing of 5G station construction and basic grid resources also provides new directions for power grid investment. In order to reasonably control costs and optimize resource allocation, power grid enterprises should comprehensively consider the above factors, optimize grid investment plans, and conduct supervision [3]. Therefore, research on investment prediction of power grid enterprises is conducive to the sustainable development of power grids.
For power grid investment forecasting, domestic and foreign scholars have put forward different ideas and solutions. At present, statistical prediction models and artificial intelligence prediction models are widely used in the field of power grid investment prediction. Traditional statistical prediction methods mainly include principal component analysis, regression algorithms, Kalman filter, and clustering. These methods have simple principles, but have longer periods, slower speeds, and larger errors. The intelligent algorithms proposed on the basis of traditional prediction methods include co-integration theory, particle swarm optimization theory, fuzzy analysis, back propagation neural network (BPNN), and support vector machines (SVM). These algorithms are intelligent and personalized, so they are widely used in power grid investment forecasting.
In terms of traditional statistical forecasting models, regression analysis is widely used. For example, Chen [4] comprehensively considered the multi-dimensional constraints, established the investment scale prediction model by using the regression analysis method, and verified its good auxiliary effect on investment planning through empirical analysis. In the artificial intelligence prediction models, BPNN [5] and support vector machines [6] are proven to be highly effective methods. Among them, neural networks have high computing power and fitting efficiency because of their large number of neurons and multiple hidden layers, and they also have a significant effect on the regression and classification of related variables and analysis of function fitting. Some scholars have used BPNN to analyze and predict this. However, due to the principle of gradient descent, the BPNN algorithm is prone to the problem of gradient vanishing and easily falls into the local optimal solution. In order to solve this problem, many scholars use principal component analysis or multiple regression models in combination with the BPNN to form new combined algorithms or use genetic algorithms to improve it. In reference [7], principal component analysis is used to analyze the relevant factors of power engineering investment, and particle swarm optimization is used to optimize the BPNN to establish an innovative prediction model. Liu et al. [8] combined grey prediction, a multiple regression model, and a BPNN in an optimized combination model using an improved genetic algorithm; they proposed a combination prediction model that can combine the model and the original data well. It is proven that the combined model has a shorter convergence time and search efficiency. Although the BPNN's prediction performance has been greatly improved and can obtain more accurate prediction results, it is not suitable for the prediction of few sample data. Therefore, SVM is favored by many scholars because of its strong robustness and good prediction accuracy, which is suitable for few sample data. Dai et al. [9] used the grey correlation analysis method to screen the influencing factors and optimized the Grey Wolf algorithm through differential evolution and SVM. The results demonstrate that the model has a strong generalization ability and a good prediction effect. In order to make up for the shortcomings of the single BPNN or SVM model, some scholars have combined different models to predict the amount of power grid investment. Xu et al. [10] combined SVM, BPNN, and multiple regression models based on the analysis of the indicator system to form a power grid portfolio model. The particle swarm algorithm was used to optimize the investment portfolio model to achieve more accurate investment forecasts.
In addition to the above algorithm, some scholars have used other methods to analyze power grid investment. Liu et al. [11] put forward a calculation model of power grid demand and investment capacity by analyzing the influence of the change in transmission and distribution price on power grid investment decisions. Li et al. [12] mainly used the correlation coefficient method and grey prediction model to realize power grid investment predictions and confirmed the practicability and innovation of the method through data analysis. From the perspective of renewable energy power generation, Wagner [13] analyzed the site selection of wind power investors under different support plans and its impact on grid investment and found that the additional costs brought by site selection had a great impact on grid investment. As a shallow learning algorithm, the above models have limited processing capabilities for complex function problems, and these algorithms are based on prior knowledge and cannot fully reflect the characteristics of the information. A restricted Boltzmann machine (RBM) can abstract the combination of low-level features into high-level features so as to better reflect data features.
In the field of forecasting, RBM plays an important role. For example, Shi et al. [14] combined a depth confidence network and RBM to extract data features. Wan et al. [15] used RBM to build a deep belief network (DBN) model and proposed a deep regression feature learning (DFL) wind speed prediction method. Phan et al. [16] proposed an SRBM model to predict healthy social networks. Internal and external social influences and environmental events form a three-layer training model. This model proves that it is more effective than traditional methods.
However, the generalization ability of RBM is low, and its fixed training rate is not conducive to the network jumping out of the minimum point. Some experts have begun to use various algorithms to optimize it. Cho et al. [17] used Gaussian–Bernoulli to limit the RBM and scientifically optimize the parameters of the RBM. However, Gaussian–Bernoulli had problems such as local convergence and slow convergence. Liu et al. [18] used a genetic algorithm to optimize the RBM, which effectively improved the RBM feature extraction performance. However, genetic algorithms may converge to the local optimum when the fitness function was not properly selected and cannot reach the global optimum. Du et al. [19] weighted the fusion of a clustering algorithm with Time-RBM. Although this effectively improved the prediction accuracy, the clustering algorithm had high computational complexity, and the result depended on the selection of certain empirical parameters. In contrast, as a biomimetic algorithm based on the social behavior of lions, the Lion algorithm has strong robustness and the ability to search for better solutions. It is easy to implement in parallel and has a fast convergence speed. At the same time, the deep restricted Boltzmann machine (DRBM) algorithm can overcome the shortcomings of the RBM and improve the processing capacity of complex data.
Combined with the advantages and improvements of previous methods, this paper proposes a new power grid investment forecasting model based on the DRBM optimized by the Lion algorithm (LA). Considering the characteristics of power grid investment prediction, transmission and distribution price reform (TDPR) and 5G station construction are integrated into the influencing factors for comprehensive consideration. We analyzed the influence factors of power grid investment using a fuzzy threshold method and constructed a power grid investment prediction model using a deep restricted Boltzmann machine optimized by the Lion algorithm (LA-DRBM). The model improved the global search ability and enhanced the abstraction ability of high-dimensional complex data through layer-by-layer feature transformation. Then, a regression model, BPNN, SVM, RBM model, and LA-RBM model were selected for comparative analysis. The empirical study illustrates that the prediction accuracy and generalization performance of the model have been effectively improved.
The rest of the paper is arranged as follows: Section 2 introduces the basic theories of the deep restricted Boltzmann machine and the Lion algorithm; Section 3 carries out the analysis of the influencing factors of the power grid enterprise's investment based on a fuzzy threshold method; Section 4 uses the established model for empirical analysis; and Section 5 presents the conclusions.
2.1 Deep Restricted Boltzmann Machine
2.1.1 Restricted Boltzmann Machine
RBM is a non-feedback random neural network model with two layers. One layer is the visual layer for inputting observation data, and the other layer is the hidden layer for feature extraction [20,21]. In this network, different layers are fully connected, and there is no communication between the same floor. Assuming that the RBM has visible layer neurons and hidden layer neurons, the value of the neuron of the visible layer and the value of the neuron of the hidden layer neuron are denoted, respectively. The structure and principle of the RBM is demonstrated in Fig. 1.
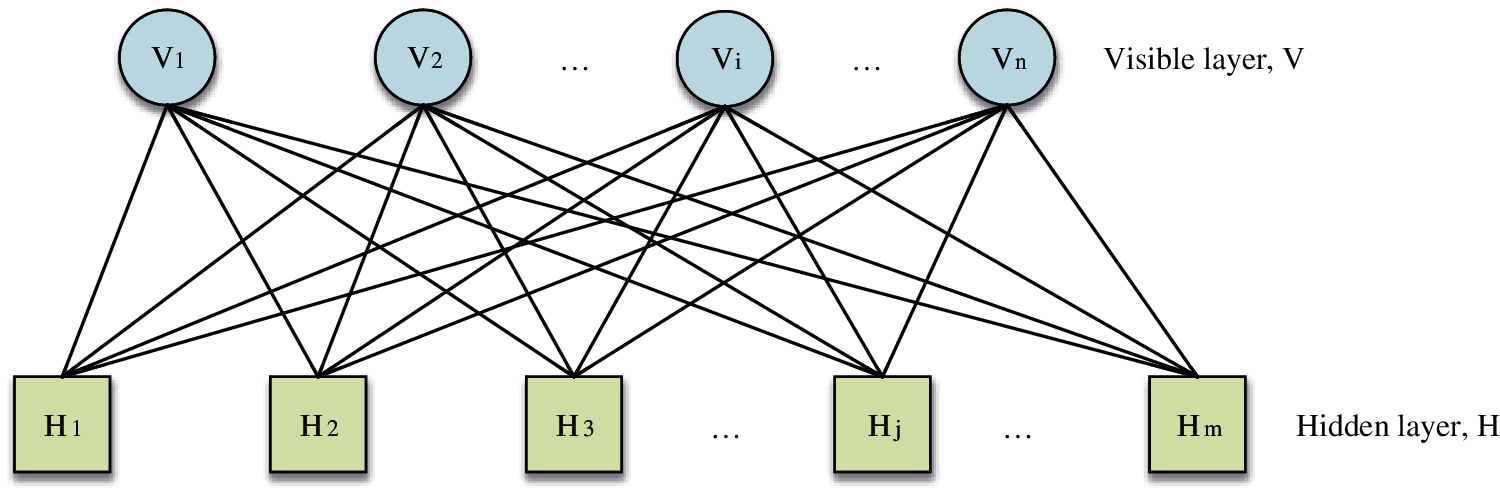
Figure 1: The structure and principle of the RBM model
The RBM is a typical model based on energy function. For a given state
where
On the basis of the energy function of formula (1), the joint probability distribution function under a given state
where
Under the assumption that the hidden layer unit and the visible layer unit are binary variables, which means
where
As the RBM structure is symmetrical, the activation probability of the
During training of the RBM model, it is necessary to adjust the parameter
The objective of optimizing parameters in the RBM is to maximize the likelihood function
Through the logarithmic processing of function
Considering the complexity of likelihood function calculation, this paper uses the reconstruction error instead of the likelihood function for the evaluation function of the RBM. The reconstruction error takes the training sample as the initial state and calculates the difference with the original data after several block Gibbs samples. In the training process of the RBM, the reconstruction error of the
where m represents the number of visible layer nodes, and k represents the number of training samples.
When the error condition is met, the output result of the hidden layer is the output result of the system.
2.1.2 Deep Restricted Boltzmann Machine
Considering that the RBM, as a single-layer structure, has insufficient ability to extract and process information, this paper takes the RBM as the basic network structure, constructs a multi-layer network structure, and forms a DRBM model [22]. The DRBM model effectively trains the entire network layer by extracting the output of the previous layer of the network as the training data input of the next layer, and its structure is shown in Fig. 2.
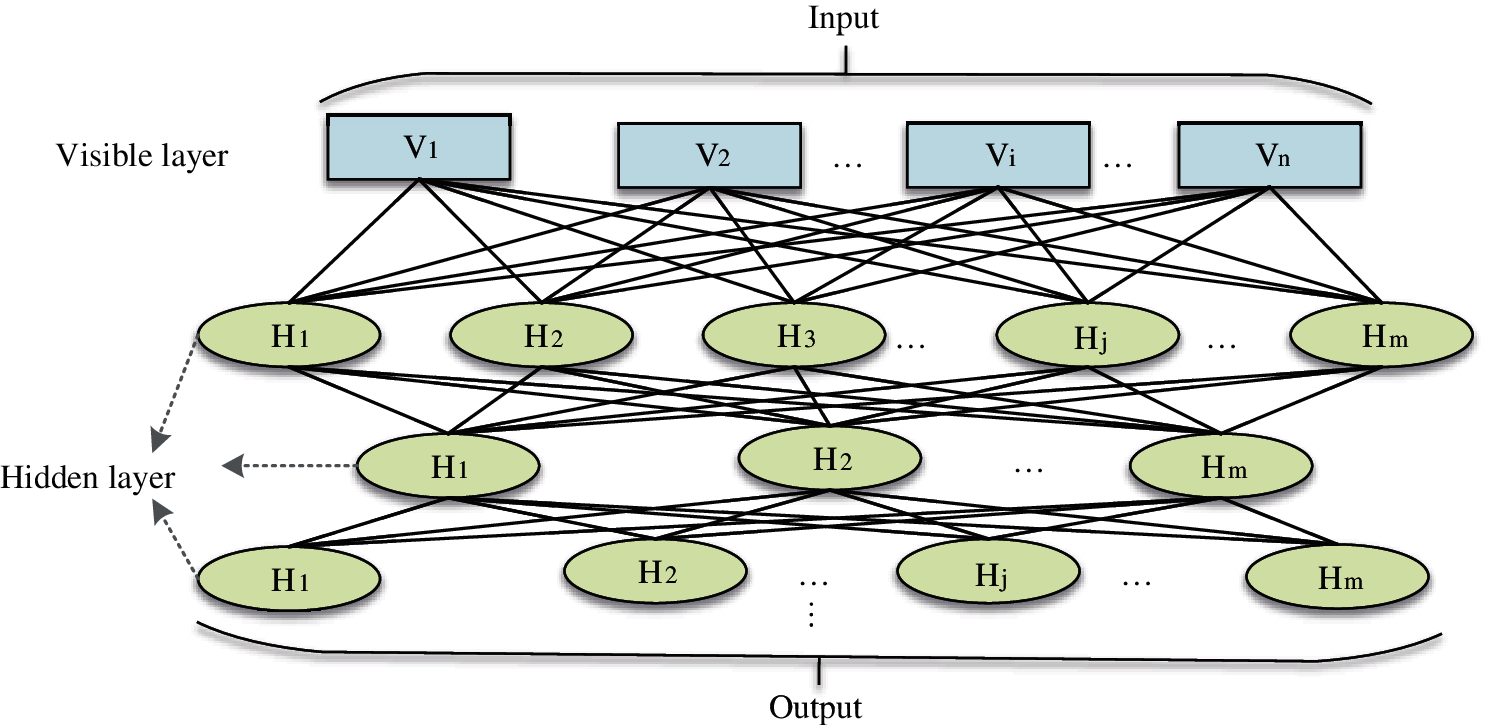
Figure 2: The structure of the DRBM model
Compared with the RBM, the DRBM can extract more abstract space vectors from high-dimensional complex input data through layer-by-layer feature transformation. In addition, the DRBM can train a large number of unlabeled sample data to reduce the impact of error or redundant information on the output results so as to increase the accuracy of the prediction results.
The training set is substituted into the DRBM model for training, and the network output result is the prediction result.
At the beginning of the 21st century, Rajakumar proposed the Lion algorithm [23]. As a heuristic algorithm based on the group behavior of lions, the algorithm constantly updates the location information of lions by imitating the natural behaviors of lions such as mating, mutation, and territorial defense to reach the goal of seeking the optimal solution. The Lion algorithm performs well in dealing with complex optimization problems [23,24].
The algorithm can be divided into four parts according to the behavior characteristics of the lion group: initial population, mating and mutation, territorial defense, and territorial takeover. Firstly, a random individual is selected as the starting point, and each lion is taken as a solution vector to search according to the target. Then, in these feasible solutions, an iterative operation is carried out. When the termination condition is reached, the optimal solution is obtained. Therefore, the fitness function of the model needs to be determined. Taking this as the basis of the search iteration, suppose the fitness function is:
Considering that the optimization problem of RBM parameters is a complex multi-variable optimization problem, integer coding is selected as the encoding method, which can effectively improve the execution efficiency of the algorithm and simplify the calculation difficulty of the algorithm.
(1) Initialize the pride
We first set the population size and set the number of lions as
(2) The pride
Mating is an effective way to generate new individuals. Therefore, mating in the algorithm can make existing solution vectors generate new feasible solution vectors. The process includes steps such as crossover, mutation, clustering, and elimination of weak individuals.
In the algorithm, the crossover based on double probability is introduced; that is, two different probabilities are used for crossover to produce offspring. After
In the algorithm, mutation is used to generate a new cub by a random mutation with probability p; that is,
In order to group and cluster, the k-means method can be used for gender grouping of the existing eight species of offspring, which are divided into male cubs (
Finally, in order to update the cub group and maintain its stability, the health status of the two groups of the cubs was compared, and the weak individuals of the excessive group were eliminated so that the number of the two groups of cubs was maintained in balance. Additionally, after the population is updated, the age of the cub is initialized to 0.
(3) Territorial defense
Territorial defense is a unique behavior of lions. In order to protect the group and demonstrate loyalty, male lions defend against attacks of nomad lions. The defense process is shown in Fig. 3.
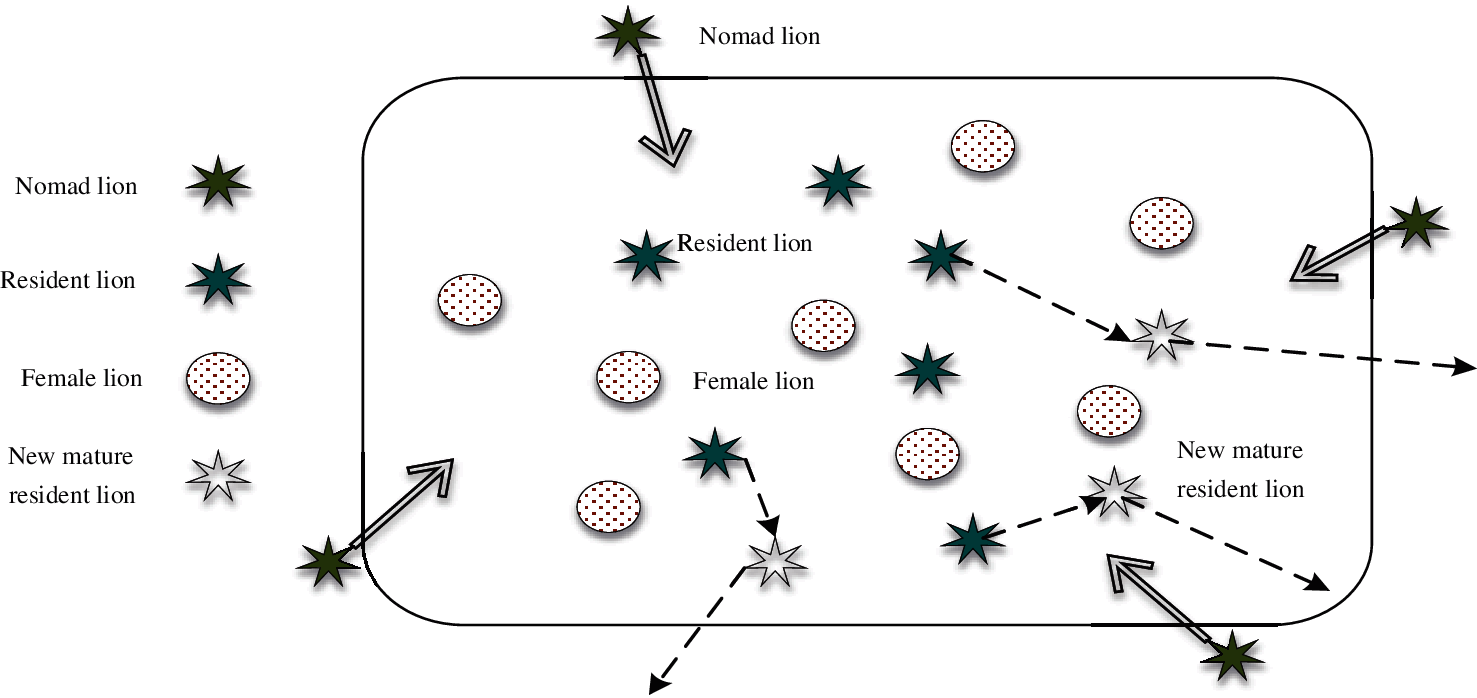
Figure 3: Lion group defense diagram
Firstly, initialize the nomad lions
If
where
(4) Territorial takeover
The cubs begin to take over the territory when they ware mature, and they are compared as lions with the original lions. The optimal solution (
Let t denote the breeding number of
Let
2.3 Deep Restricted Boltzmann Machine Optimized by Lion Algorithm
The DRBM is a multi-layer structure composed of the traditional RBM. The DRBM has similar problems as the RBM, in that it will become extremely slow due to pathological problems. Therefore, we applied the Lion algorithm to optimize the parameters of the DRBM.
The steps of optimizing the DRBM model by the Lion algorithm are as follows:
(1) Initialize the DRBM model parameters. For the DRBM, the model parameter is
(2) Use the training vectors to train the DRBM model and calculate the evaluation function of the model.
(3) Randomly set the initial population of the Lion algorithm, take the objective function of the DRBM model as the fitness function of the Lion algorithm, and use the Lion algorithm to continuously optimize the model parameters.
The optimization of the DRBM model through the Lion algorithm can speed up the training efficiency of the model and improve the learning ability of the model. The analysis process of the LA-DRBM model is shown in Fig. 4.

Figure 4: LA-DRBM model
3 Analysis of Influencing Factors of the Power Grid Enterprise's Investment Based on Fuzzy Threshold Method
As an effective evaluation method of influencing factors, the fuzzy threshold method can judge the critical influencing factors by comparing the calculated fuzzy recognition value with the actual set threshold [25]. This method is suitable for complex and fuzzy evaluation criteria and can combine experience with objective facts to make the evaluation results more accurate. Suppose the factor set of the evaluated object is S and
(1) Determine the evaluation level. Each influencing factor must be evaluated according to certain standards. The evaluation levels are as follows:
where m represents the number of evaluation levels.
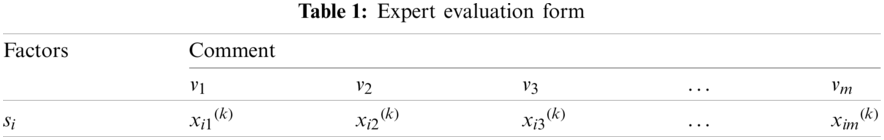
(2) Establish a fuzzy relationship matrix. Assuming that there are N experts in total, all the experts evaluate each influencing factor according to the grad, and the
Therefore, the fuzzy relationship matrix T is calculated as:
where
(3) Determine the evaluation grade weight vector, and the vector is as follows:
where
It is determined that the weight settings have a great impact on the comprehensive evaluation results.
(4) Calculate the evaluation result. Multiply the evaluation grade weight vector W and the fuzzy relationship matrix T to obtain the fuzzy comprehensive evaluation result vector
(5) Based on experience, set thresholds and screen critical influencing factors.
3.2 Analysis of Critical Influencing Factors
There are many factors influencing power grid investment, which are closely related to the income of power grid companies, investment benefits, and customer needs [26–28]. At the same time, with the advancement of 5G base station construction and TDPR, power grid investment is also affected by these two factors. Therefore, TDPR and 5G station construction should be considered as two influencing factors in the investment forecast of power grid enterprise. According to the analysis, it can be concluded that the influencing factors of the power grid enterprise's investment mainly include total assets s1, total electricity consumption s2, power supply population s3, load s4, line loss rate s5, ratio of grid assets to income s6, ratio of profits to cost s7, increased load per unit of grid investment s8, return on equity s9, power supply reliability s10, growth rate of electricity sales s11, power generation of renewable energy s12, standard coal saving s13, maximum load of the whole society s14, carbon dioxide emission reduction s15, influence factors of TDPR s16, 5G station construction s17, and so on [29–34].
The fuzzy threshold method is used to analyze the critical influencing factors of power grid investment, and the evaluation level V = {Extremely important, very important, generally important, not very important, not important} is set, and the corresponding weight vector is determined as W = {0.3, 0.25, 0.2, 0.15, 0.1}. Then, the fuzzy relationship matrix is obtained by the expert scoring and calculating the overall membership degree and multiplying it with the weight vector W to obtain the fuzzy comprehensive evaluation result, as shown in Table 2.
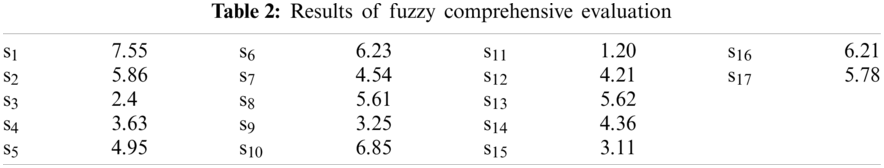
According to the results of the comprehensive calculation and the actual situation, the threshold value is set to 5, and the influencing factors with a fuzzy comprehensive evaluation result greater than 5 are the critical influencing factors of power grid investment. It is concluded that the critical influencing factors include total assets s1, total electricity consumption s2, ratio of grid assets to income s6, increased load per unit of grid investment s8, power supply reliability s10, standard coal saving s13, influence factors of TDPR s16, and 5G station construction s17, as shown in Fig. 5.

Figure 5: The critical influencing factors of power grid investment
In the analysis of the influence factors of TDPR and 5G station construction, the two influencing factors are taken into account by introducing correction factors. The correction coefficient of TDPR is
According to the analysis of the fuzzy threshold method, the critical influencing factors of power grid investment are total assets s1, total electricity consumption s2, ratio of grid assets to income s6, increased load per unit of grid investment s8, power supply reliability s10, standard coal saving s13, influence factors of TDPR s16, and 5G station construction s17. We took a provincial power grid company (Z power grid company) in the southeast region of China as the research object, and selected data from 2010 to 2020 as samples for analysis. The input vector of the prediction model was {s1, s2, s6, s8, s10, s13}, and the output vector was the investment amount
where
In order to reduce the influence of dimensions and units on the prediction results, the extreme value method is used to normalize the original data. The calculation formula is as follows:
where
We can use the data of Z grid company from 2010 to 2019 as training set to train the model and use the trained model to predict the company's investment in 2020.
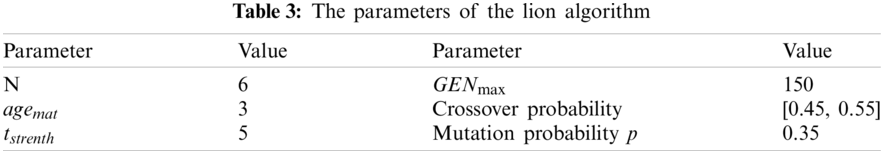
First, set the Lion algorithm parameters, as shown in Table 3.
Then, the lion algorithm is used to iteratively optimize the parameters of the DRBM. At the same time, based on experience, set the correction coefficient

Figure 6: The training results of the LA-DRBM model
According to the graphic analysis, the forecasting value of the sample largely coincides with the actual value, and the fitting effect is excellent.
Calculate the relative error rate (RER) and non-linear function goodness of fit (R2) between the actual value and the forecasting value of the training sample. The calculation formula of the RER and R2 is:
where
The RER of the training result is shown in Fig. 7.

Figure 7: The RER of the training result of the LA-DRBM model
The analysis result shows that the RERs of the training results are between −0.02 and 0.015, which are small, indicating that the training effect of the model is excellent. Therefore, it can be considered that the model is an effective method to predict the investment amount of power grids.
Finally, we can use the optimized model to forecast the investment of Z grid companies in 2020.
The prediction effect of this model is compared with the prediction effect of the BPNN, SVM, RBM, and regression model. The comparison results are shown in Table 5 and Fig. 8.
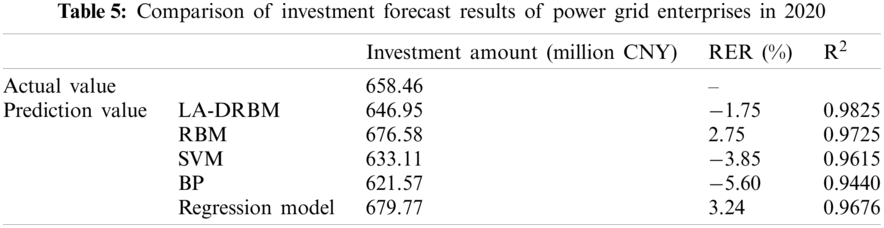

Figure 8: Comparison of RER of the prediction results of each model
According to the analysis results, the RERs for Z grid enterprise's investment forecast in 2020 of the LA-DRBM model, the RBM model, the SVM model, the BP model, and the regression model are −1.75%, 2.75%, −3.85%, −5.60%, and 3.24%, respectively. Among them, the RER of the LA-DRBM model is the smallest. From the analysis of the results, the LA-DRBM model can achieve a good prediction effect and high prediction accuracy in forecasting power grid investment.
In order to respond to the requirement of sustainable development of power grid investment and improve the accuracy of power grid investment prediction, a new power grid investment prediction model based on the LA-RBM (deep restricted Boltzmann machine optimized by the Lion algorithm) model is proposed according to the characteristics of power grid planning and the trend of power grid investment. In this paper, the main findings and conclusions are as follows:
(1) Firstly, the fuzzy threshold method was used to analyze the influencing factors of a power grid enterprise's investment. After analysis, 8 critical influencing factors were screened out of 17 influencing factors, including total assets s1, total electricity consumption s2, ratio of grid assets to include s6, increased load per unit of grid investment s8, power supply reliability s10, standard cost saving s13, influence factors of TDPR s16, and 5G station construction s17. These factors were used as input variables to train the model.
(2) Then, considering the problem of the insufficient solution speed of the DRBM model, the Lion algorithm was used to optimize the parameters of the DRBM model. The optimized parameter set of the DRBM model was
(3) Finally, the LA-RBM power grid investment forecast model was compared with the RBM, SVM, and BPNN. According to the analysis results, the RERs for Z grid enterprise's investment forecast in 2020 of the LA-DRBM model, the RBM model, the SVM model, and the BP model were 3.22%, 7.92%, 9.01%, and 10.77%, respectively. Among them, the RER of the LA-DRBM model was the smallest. From the analysis of the results, the LA-DRBM model can achieve a good prediction effect and high prediction accuracy in forecasting power grid investment.
Therefore, the experimental results fully prove that the LA-DRBM power grid investment forecast model has strong generalization ability and robustness; the prediction accuracy is better than other models; and it can achieve good prediction results. This model provides new ideas and references for power grid investment forecasting.
The innovations of the paper are as follows:
(1) The LA-DRBM model can abstract the combination of low-level features into high-level features so as to adequately reflect the data characteristics and improve the computational efficiency of the model.
(2) The LA-DRBM model uses the Lion algorithm to optimize the deep restricted Boltzmann machine, which improves the forecasting accuracy of the model.
(3) The article introduces the TDPR and 5G station construction as influencing factors, which were used in an innovative index system of influencing factors.
(4) The model can combine the advantages of a single model and overcome the shortcomings of a single model. The combined model is thus an effective prediction method for power grid investment and has a strong generalization ability and good robustness.
Author Contributions: Conceptualization, Q.W. and X.Y.; formal analysis, D.P.; investigation, Q.W.; resources, Q.W.; data curation, Y.F.; writing—original draft preparation, Q.W. and D.P.; writing—review and editing, X.Y. All authors have read and agreed to the published version of the manuscript.
Funding Statement: This research was funded by the National Key Research and Development Program of China (Grant No. 2020YFB1707804), the 2018 Key Projects of Philosophy and Social Sciences Research (Grant No. 18JZD032), and Natural Science Foundation of Hebei Province (Grant No. G2020403008).
Conflicts of Interest: The authors declare that they have no conflicts of interest to report regarding the present study.
1. Ma, Q., Wang, Z. C., Pan, X. P., Liu, X. F. (2019). Evaluation method of power grid investment decision based on utility function under new electricity reform environment. Electric Power Automation Equipment, 39, 198–204. DOI 10.16081/j.epae.201910011. [Google Scholar] [CrossRef]
2. Yang, N., Liu, D. N., Liu, M. G., Ye, B., Ma, J. et al. (2020). Differentiated investment strategy of provincial power grid considering development stage of city region. Automation of Electric Power Systems, 44, 115–122. DOI CNKI:SUN:DLXT.0.2020-07-015. [Google Scholar]
3. Pan, E. S., Peng, D., Long, W. C., Xue, Y., Zhao, L. et al. (2019). Provincial grid investment scale forecasting based on MLR and RBF neural network. Mathematical Problems in Engineering, 2019, 1–12. DOI 10.1155/2019/3197595. [Google Scholar] [CrossRef]
4. Chen, X. (2016). Research and application of power grid investment forecast and distribution model in foshan power supply bureau (Master's Thesis). South China University of Technology, China. [Google Scholar]
5. Yang, L., Xiao, M. (2016). Research and prediction of substation project cost analysis model based on BP neural network. China Power Enterprise Management, 15, 56–61. DOI CNKI:SUN:ZGDQ.0.2016-18-015. [Google Scholar]
6. Wang, N. N., Wang, F., Yin, Y. T., Li, H., Hou, Y. (2016). Research on cost predicting of power transformation projects based on SVM. Construction Economy, 37, 48–52. DOI 10.14181/j.cnki.1002-851x.201605048. [Google Scholar] [CrossRef]
7. Hu, J. L., Gao, X. B., Liu, C. M., Shen, C. S. (2017). Empirical study on the influencing factors of power grid project investment based on BP neural network. Engineering Economy, 27, 15–19. DOI 10.19298/j.cnki.1672-2442.201710015. [Google Scholar] [CrossRef]
8. Liu, W., Li, M., Li, Q. Y., Wang, L. L., Hu, Z. et al. (2020). Power grid portfolio forecasting method based on an improved genetic algorithm. Power System Protection and Control, 48, 78–85. DOI 10.19783/j.cnki.pspc.190644. [Google Scholar] [CrossRef]
9. Dai, S. Y., Niu, D. X., Han, Y. R. (2018). Forecasting of power grid investment in China based on support vector machine optimized by differential evolution algorithm and grey wolf optimization algorithm. Applied Sciences, 8, 636–655. DOI 10.3390/app8040636. [Google Scholar] [CrossRef]
10. Xu, B., Ma, J., Liu, H. X., Chen, Q., Liu, J. et al. (2020). Investment allocation method based on distribution network evaluation. Engineering Journal of Wuhan University, 53, 248–254. DOI 10.14188/j.1671-8844.2020-03-009. [Google Scholar] [CrossRef]
11. Liu, D. N., Xu, E. F., Qin, G. Y., He, Y. J. (2019). Research on reasonable grid investment scale measurement under the reform of transmission and distribution electricity price. Energy Procedia, 156, 412–416. DOI 10.1016/j.egypro.2018.11.099. [Google Scholar] [CrossRef]
12. Li, H., Wang, Y. L., Peng, D., Wang, Z. D., Ma, Y. Z. et al. (2019). Research on investment demand forecast of power grid based on grey system theory. IOP Conference, 295, 042017. DOI 10.1088/1755-1315/295/4/042017. [Google Scholar] [CrossRef]
13. Wagner, J. (2019). Grid investment and support schemes for renewable electricity generation. Energy Journal, 40, 195–220. DOI 10.5547/ISSN0195-6574-EJ. [Google Scholar] [CrossRef]
14. Shi, J. Q., Zhang, J. H. (2017). Ultra–Short–Term photovoltaic refined forecasting model based on deep learning. Electric Power Construction, 38, 28–35. DOI 10.3969/j.issn.1000-7229.2017.06.005. [Google Scholar] [CrossRef]
15. Wan, J., Liu, J. F., Ren, G. R., Guo, Y. F., Yu, D. R. et al. (2016). Day-Ahead prediction of wind speed with deep feature learning. International Journal of Pattern Recognition & Artificial Intelligence, 30, 433–438. DOI 10.1142/S0218001416500117. [Google Scholar] [CrossRef]
16. Phan, N. H., Dou, D. J., Piniewski, B., Kil, D. (2015). Social restricted boltzmann machine: human behavior prediction in health social networks. IEEE/ACM International Conference on Advances in Social Networks Analysis and Mining, pp. 424–431. Berlin, IEEE. [Google Scholar]
17. Cho, K. H., Ilin, A., Raiko, T. (2011). Improved learning of Gaussian–Bernoulli restricted boltzmann machines. Lecture Notes in Computer Science, 6791, 10–17. DOI 10.1007/978-3-642-21735-7. [Google Scholar] [CrossRef]
18. Liu, K., Zhang, L. M., Sun, Y. W. (2015). RBM optimization based on genetic algotiyhms. Microelectronics & Computer, 32, 96–100. DOI 10.19304/j.cnki.issn1000-7180.2015.06.021. [Google Scholar] [CrossRef]
19. Du, D. Q., Zhou, F. (2018). Hybrid collaborative filtering algorithm based on time RBM and item attribute clustering. Application Research of Computers, 35(2), 433–438. DOI 10.3969/j.issn.1001-3695.2018.02.007. [Google Scholar] [CrossRef]
20. Feng, S., Chen, C. L. P. (2018). A fuzzy restricted boltzmann machine: Novel learning algorithms based on the crisp possibilistic mean value of fuzzy numbers. IEEE Transactions on Fuzzy Systems, 26, 117–130. DOI 10.1109/TFUZZ.91. [Google Scholar] [CrossRef]
21. Harrington, P. B. (2020). Enhanced zippy restricted boltzmann machine for feature expansion and improved classification of analytical data. Journal of Chemometrics, 34(3), 1–13. DOI 10.1002/cem.3228. [Google Scholar] [CrossRef]
22. Nhan, D. C., Khoa, L., Gia, Q. K., Bui, T. D. (2019). Deep appearance models: A deep boltzmann machine approach for face modeling. International Journal of Computer Vision, 127, 437–455. DOI 10.1007/s11263-018-1113-3. [Google Scholar] [CrossRef]
23. Rajakumar, B. R. (2012). The lion's algorithm: A new nature–inspired search algorithm. Procedia Technology, 6, 126–135. DOI 10.1016/j.protcy.2012.10.016. [Google Scholar] [CrossRef]
24. Li, Y. Y., Huang, Y. S., Zhang, M. M. (2018). Short-term load forecasting for electric vehicle charging station based on niche immunity lion algorithm and convolutional neural network. Energies, 11, 1253–1271. DOI 10.3390/en11051253. [Google Scholar] [CrossRef]
25. Thakran, S. (2020). A hybrid GPFA–EEMD_Fuzzy threshold method for ECG signal denoising. Journal of Intelligent and Fuzzy Systems, 39, 1–10. DOI 10.3233/JIFS-191518. [Google Scholar] [CrossRef]
26. He, Y. X., Jiao, J., Chen, R. J., Shu, H. (2018). The optimization of Chinese power grid investment based on transmission and distribution tariff policy: A system dynamics approach. Energy Policy, 113, 112–122. DOI 10.1016/j.enpol.2017.10.062. [Google Scholar] [CrossRef]
27. Jiang, Q., Huang, R. M., Huang, Y. C., Chen, S. J. (2019). Application of BP neural network based on genetic algorithm optimization in evaluation of power grid investment risk. IEEE Access, 7, 154827–154835. DOI 10.1109/ACCESS.2019.2944609. [Google Scholar] [CrossRef]
28. Ge, Y., He, Y., Hu, X., Sun, W., Zhang, W. et al. (2018). Analysis method and empirical research on economic benefit of large–scale consumptive power grid investment. The Journal of Engineering, 17, 1285–1289. DOI 10.1049/joe.2017.0536. [Google Scholar] [CrossRef]
29. Yang, F., Zhang, S., Sun, C. W. (2020). Energy infrastructure investment and regional inequality: Evidence from China's power grid. Science of the Total Environment, 749, 1–10. DOI 10.1016/j.scitotenv.2020.142384. [Google Scholar] [CrossRef]
30. He, Y. X., Liu, W. Y., Jiao, J., Guan, J. (2018). Evaluation method of benefits and efficiency of grid investment in China: A case study. The Engineering Economist, 63, 1–21. DOI 10.1080/0013791X.2016.1258100. [Google Scholar] [CrossRef]
31. Liang, Y., Niu, D. X., Hong, W. C. (2019). Short term load forecasting based on feature extraction and improved general regression neural network model. Energy, 166, 653–663. DOI 10.1016/j.energy.2018.10.119. [Google Scholar] [CrossRef]
32. Li, H., Liu, Z., Yu, P., Wang, Z., Zhao, L. (2021). Research on optimal method of multi-regional power grid investment project. Journal of Physics: Conference Series, 1748, 1–10. DOI 10.1088/1742-6596/1748/5/052024. [Google Scholar] [CrossRef]
33. Du, Y., Ma, T. N., Wan, M. Y., Chen, J. Y., Yu, G. X. et al. (2021). Research on key index system and investment scale calculation model of power grid investment. IOP Conference Series: Earth and Environmental Science, 714, 1–9. DOI 10.1088/1755-1315/714/4/042036. [Google Scholar] [CrossRef]
34. Wang, Y. L., Zhou, M. H., Zhang, F. L., Zhang, Y. L., Ma, Y. Z. et al. (2021). Chinese grid investment based on transmission and distribution tariff policy: An optimal coordination between capacity and demand. Energy, 219, 1–12. DOI 10.1016/j.energy.2020.119589. [Google Scholar] [CrossRef]
 | This work is licensed under a Creative Commons Attribution 4.0 International License, which permits unrestricted use, distribution, and reproduction in any medium, provided the original work is properly cited. |