| Computer Modeling in Engineering & Sciences |
DOI: 10.32604/cmes.2022.017815
ARTICLE
Sensitivity Analysis of COVID-19 in Mediterranean Island
1Near East University, Faculty of Arts and Sciences, Nicosia, 99138, North Cyprus
2Near East University, Mathematics Research Center, Nicosia, 99138, North Cyprus
3Cyprus International University, Faculty of Medicine, Nicosia, 99138, North Cyprus
*Corresponding Author: Nezihal Gokbulut. Email: nezihal.gokbulut@neu.edu.tr
Received: 15 June 2021; Accepted: 06 August 2021
Abstract: The aim of this study is to examine the progress of the worldwide pandemic Covid-19. As authors, we have decided to analyze the situation of COVID-19 on Mediterranean island with accurate data. For this purpose, a mathematical model is constructed and proposed by dividing the whole population into sensible and suitable compartments. The study captures the dates February 01 till May 15, 2021. For the control of the spread of disease, vaccination and infection rates are compared and calculated. During calculations and comparison, MatLab software is used. All of the data that are used are taken from the Ministry of Health. The effect of parameters is examined with sensitivity analysis. Furthermore, with this analysis, values of parameters are obtained. Afterwards, by using the constructed model, the effect of vaccine on infected individuals is analyzed separately. As a result, it is concluded that the studied part of the island is late for the control of the disease via vaccine. This can be explained by two main reasons; vaccinating the people that are not in mobility most of the time (aged people and people with chronic diseases) and getting the vaccine late. Hence, the results showed that this rate and distribution of vaccines would not be enough to control the pandemic on the island.
Keywords: COVID-19; vaccination; mathematical model; basic reproduction number; island; sensitivity analysis
From the beginning, our world has faced with outbreaks; some of them became a pandemic, some of them remained as an epidemic [1]. Although prevention of outbreaks seem theoretically easy, practical applications can often fail. Outbreaks have demonstrated the insufficiency of infection prevention and control programs [2]. Many health systems fail to build strong foundations to reduce the risks and transmission of health-care-associated outbreaks. They also tolerate an unacceptably poor level of infection prevention and control in everyday practice [3].
Nowadays, the world is encountering with the Coronavirus disease of 2019 (COVID-19), resulting from SARS-CoV-2 infection, which was declared as a pandemic by the World Health Organization (WHO) on 11 March 2020 [4]. As of April 12, 2021, more than 136,682,133 COVID-19 cases were identified, and more than 2,950,744 deaths were reported due to the disease [5].
Beside the biological and epidemiological factors, a multitude of social and economic criteria also interferes with the extent of the coronavirus disease transmission within a population. There exist 31 potential socio-economic determinants such as medical resources, health coverage, death rate, mortality rate, immunization, etc. [6].
Public health measures include personal protective measures (hand hygiene, respiratory etiquette), environmental measures, physical distancing measures, and travel-related measures. Physical distancing measures are applied to individuals (e.g., isolation of cases and quarantine of contacts) or communities, specific segments of the population, or to the whole population. These measures are not mutually exclusive. WHO recommends that all suspected cases should be identified, tested, isolated and cared for. Furthermore, contacts of suspected cases should be identified, traced, and quarantined [7]. A multitude of social and economic criteria have been attributed as potential determinants for the observed variety in the coronavirus outcome during the first wave of the pandemic. Some experts infer that the reason for the hardest hit countries can be explained by having an older population or an underdeveloped healthcare system [8,9].
Mathematical models for the propagation mechanisms of infectious disease exist in literature. These models play a major role in determining the methods of quantify and analyzing effective control and preventive measures of infectious diseases [10–12]. Most of the developed countries like Germany, England, and USA, takes advantages of mathematical modelling to control cancers and infectious diseases like influenza, COVID-19, HIV, etc. [13,14]. The general idea of mathematical modelling is to divide the whole population into sensible number of compartments and to construct the basic reproduction number, denoted by R0, of the disease. R0 can be defined as the number of secondary infections per primary infection. R0 values less than 1 indicates that the pursued policy is enough and efficient to control the transmission of disease. Otherwise, it highlights the requirements for increased applications to control the disease [15].
The aim of this study is to observe the progress of COVID-19 in North Cyprus by using real data and to determine control strategies with the constructed model. In North Cyprus many restrictions are applied; some of them have been present since the beginning of the disease. According to the records, First case was seen on March, 2020. Subsequently, the country has experienced many lockdowns including closure of borders, and airport, closure of schools, etc. [15]. The proposed model in the paper is constructed regarding the situation of the island. All of the population is divided into compartments and their relations are explained by means of mathematical expressions. All of the restrictions and applications existing because of the disease are taken into account so that the results are overlapped with the upcoming situation.
Among those models, there are some examples that portray the benefits of mathematical modeling in studying the dynamics of epidemics/pandemics and the effect of vaccination on epidemics/pandemics [15–19].
This paper is organized as follows: firstly, data, methods and construction of the model are explained in Section 2. Secondly, model analysis is introduced and proved by suitable theorems. In the continuation of Section 3, sensitivity analysis is made for the parameters of the model. Afterwards, numerical simulations are made and figures are revealed. Lastly, conclusion and discussions are elucidated.
In this study, the daily cases of COVID-19 in North Cyprus are considered and all data are taken from the Ministry of Health. This study captures the dates 1st of February and 15th of May, 2021. In Fig. 1, the pattern of daily cases can be seen.
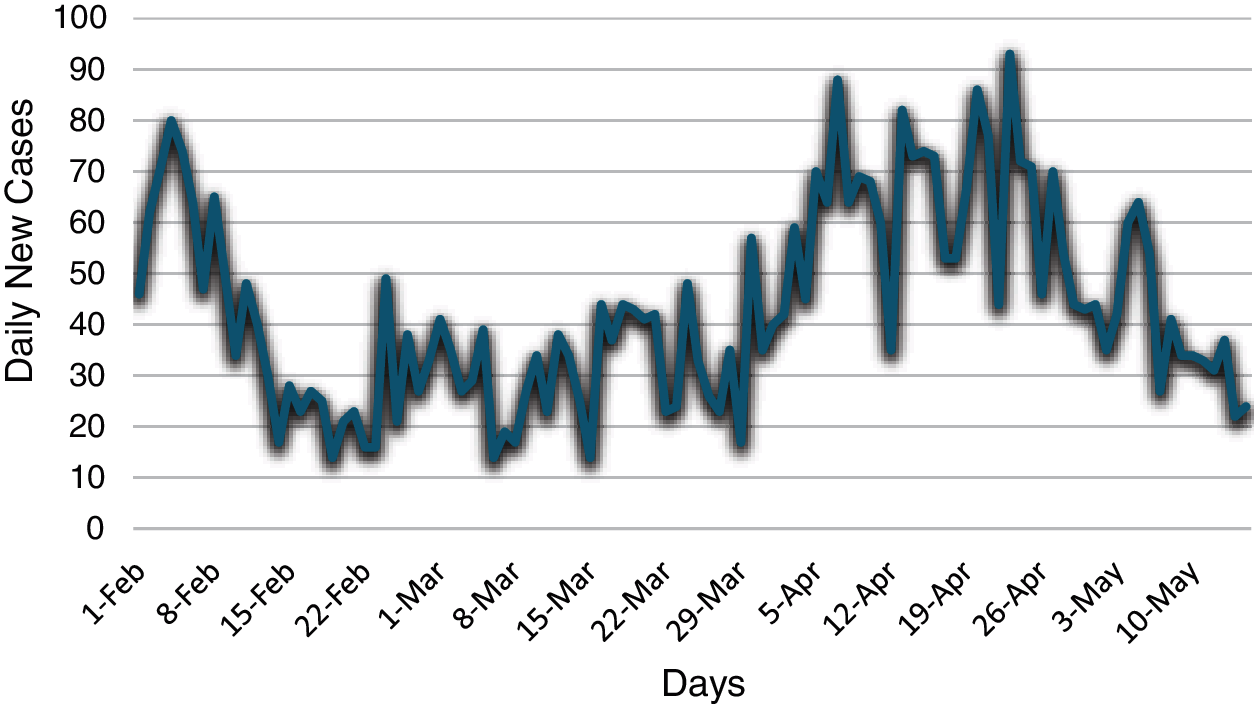
Figure 1: The daily COVID-19 cases in North Cyprus between the dates February 01 and May 15, 2021
A new mathematical model is proposed to study the progress and transmission dynamics of COVID-19 and in North Cyprus. The importance of this model is that it captures all of the population by means of its compartments. Because of this reason, its results can be applied to real life. The model is divided into 8 compartments; susceptible individuals, vaccinated individuals, individuals in quarantine, individuals that are getting treatment in quarantine hotels with mild infection, individuals that are getting treatment in hospitals, individuals that are getting treatment in intensive care units with severe infection, recovered individuals, individuals that passed away because of COVID-19 and they are denoted by
In the above system, first derivative of compartments is constructed since it describes the change in compartments at time t.
During the construction and analysis of the model it is assumed that only severe infected individuals that are in intensive care units pass away because of COVID-19. Also, it is accepted that transition of infected individuals is as follows: Mild infected individuals that are in quarantine hotels can be infected individuals that are in hospitals and infected individuals that are in hospitals can be severe infected individuals that are in intensive care units. That is, there is no direct transition from the compartment
The model is non-negative with respect to the population, each of its state variables and parameters for
Theorem 3.1. Let
is invariant, positive, and all of the solutions in
Proof. Adding all of the terms in Eq. (1) gives
From the Eq. (3), it is clear that
3.1 Stability of the Disease-Free Equilibrium
The constructed model exhibits a unique disease-free equilibrium point, denoted by DFE, and it is calculated as
It is obvious from the Eq. (4) that
The basic reproduction number, denoted by
Finally, the basic reproduction number, which is the dominant eigenvalue of the multiplication matrix
Theorem 3.2. For the model given in Eq. (1), the disease-free equilibrium point is locally asymptotically stable whenever
Proof. The Jacobian matrix evaluated at the DFE point
where
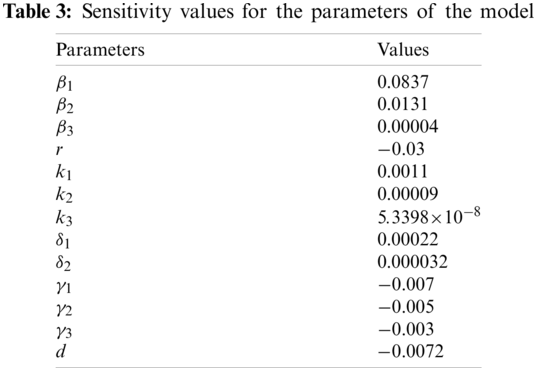
In this section, sensitivity analysis of the parameters is calculated to determine their effect on variables (i.e., compartments) and basic reproduction number, R0. The values that are obtained for the parameters by making some calculations, are given in Table 3. All of the calculations and estimations for the parameters are based on the real data of the country. As it can be seen from the Table 3, increase in
In this section, numerical simulations are made. By using the constructed model with the data taken from the Ministry of Health, some simulations are obtained with MatLab. These simulations aim to see the effect and progress of COVID-19 in North Cyprus. Vaccination is started in February and some restrictions about mobility are applied in the country. So, the figures are constructed according to these conditions.
Fig. 2 represents the pattern of infected individuals. Infected individuals can be read by multiplying each corresponding value with 10 for the corresponding date(day). Its beginning date is February 01, 2021. At that time because of the increase in positive cases, partial and full lockdowns are applied for two weeks. It is drawn with 95% mobility and 15% vaccination rate which is the situation nowadays in the country. In this figure, without any restrictions positive cases were expected to raise approximately 800 which would be very dangerous when the health conditions are taken into consideration for the country. With taken decisions and restrictions by the government, this situation is prohibited since the active cases were approximately 300.
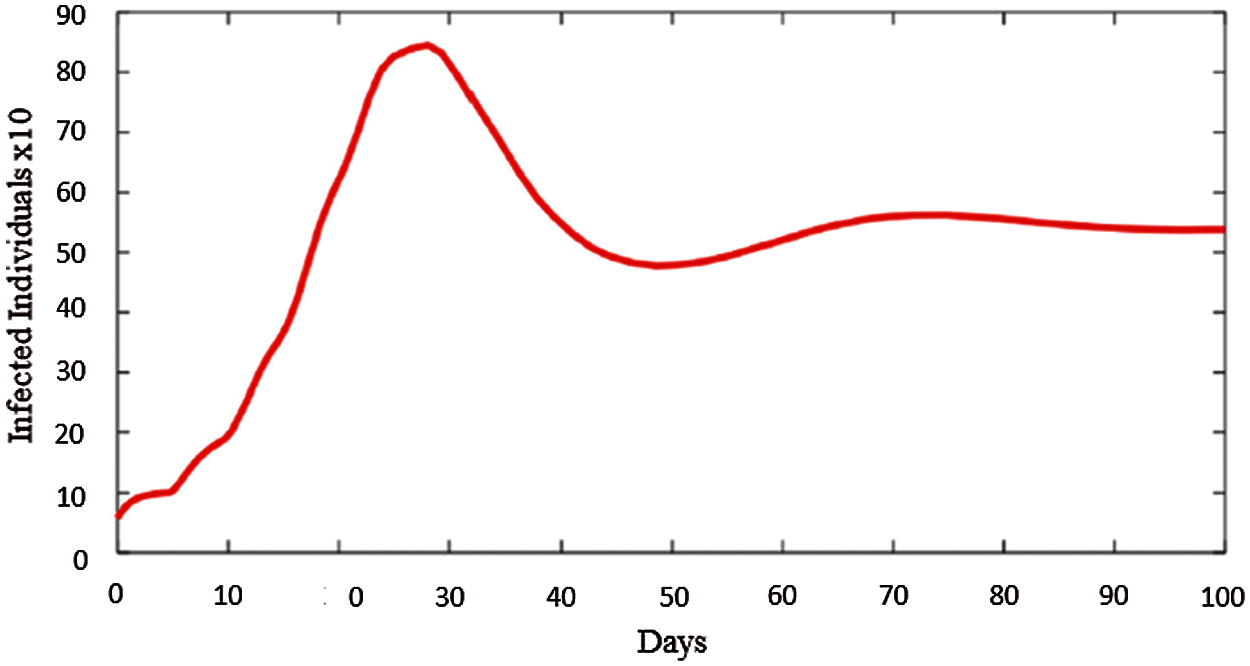
Figure 2: Pattern of infected individuals in North Cyprus starting from February 01
When the Fig. 2 is checked, it reflects the exact fluctuation in the country. In these days, daily cases started to raise because of high mobility and wrong vaccination strategy since the ones that already stays at home (ages > 65) get vaccine while the people that are active outdoors are not vaccinated yet. This time corresponds to days between 50–60 in the Fig. 2. Beside this, Fig. 3 represents the distribution of positive cases in North Cyprus as mild infected individuals, IQ, hospitalized individuals, IH, and severe infected individuals, IC.
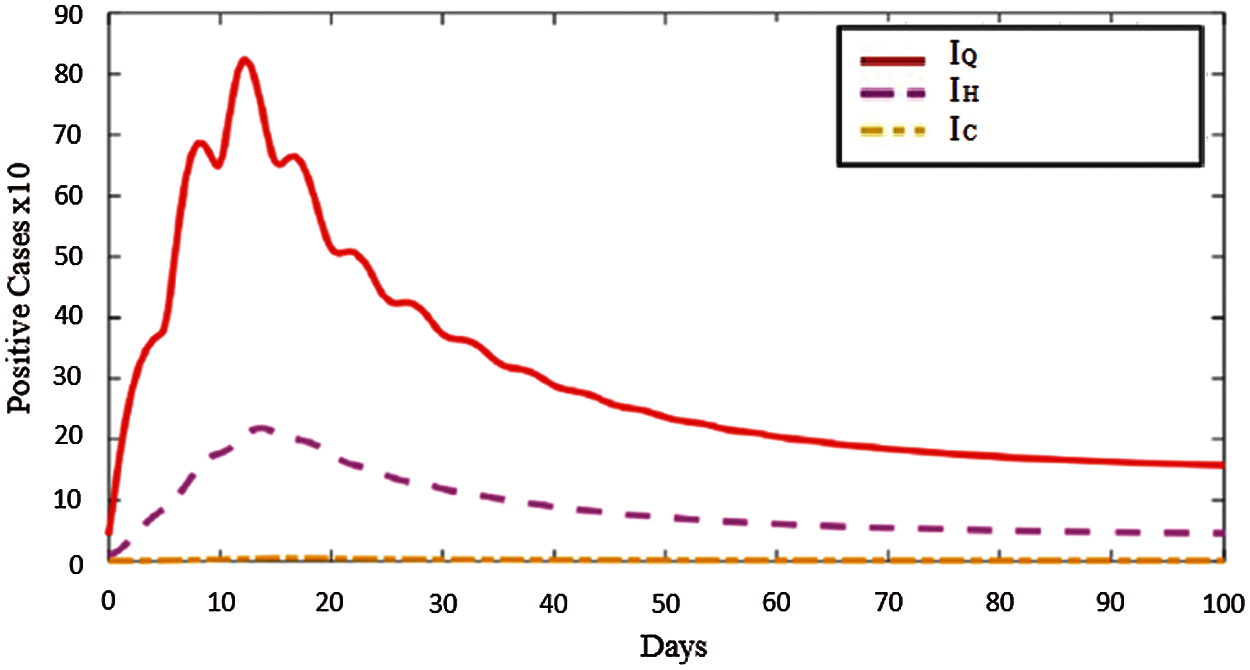
Figure 3: Distribution and pattern of
Vaccine has been the most discussed idea for the control of the COVID-19. So, with the proposed model and real parameter values in North Cyprus, Figs. 4 and 5 are drawn with Matlab. In Fig. 4, the rate of vaccine is 0.02 while in Fig. 5 vaccine rate is 0.15. At the beginning, February 2021, only 2% of the population get vaccine in North Cyprus and approximately at the end of April 2021, this percentage increased to 15%. It can be said that increase in r caused a decrease in infected and quarantined individuals in North Cyprus.
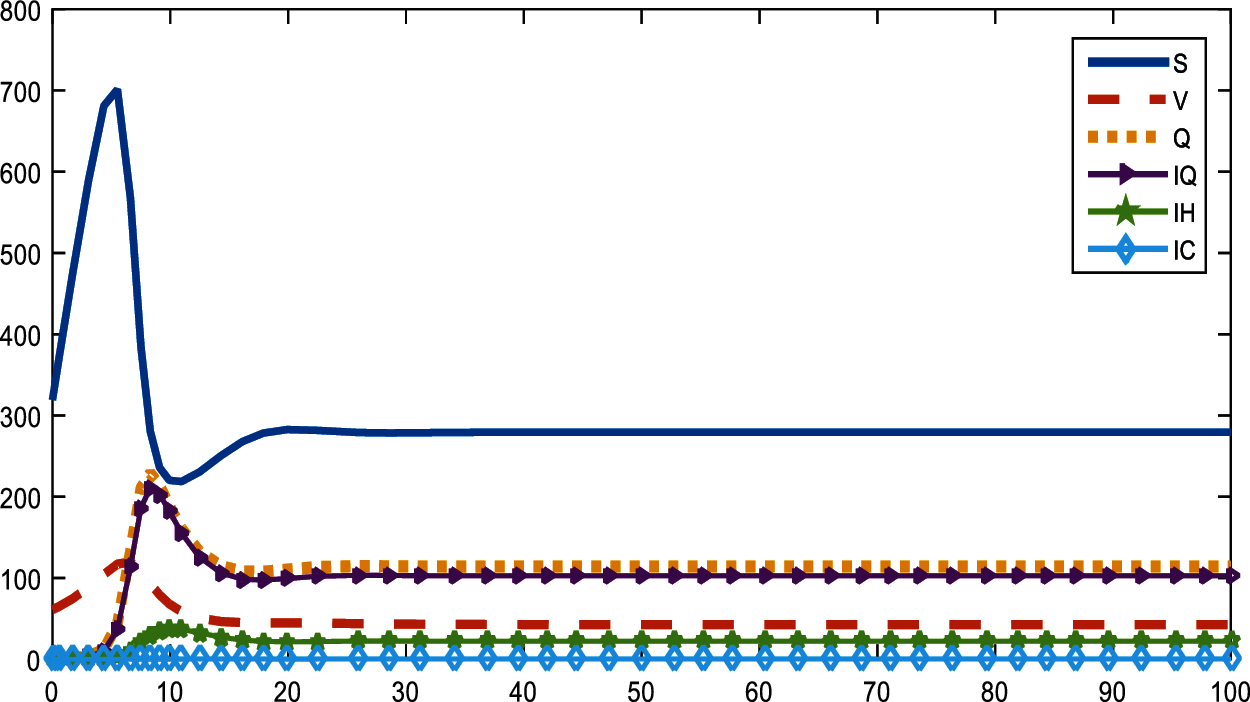
Figure 4: Distribution of compartments with
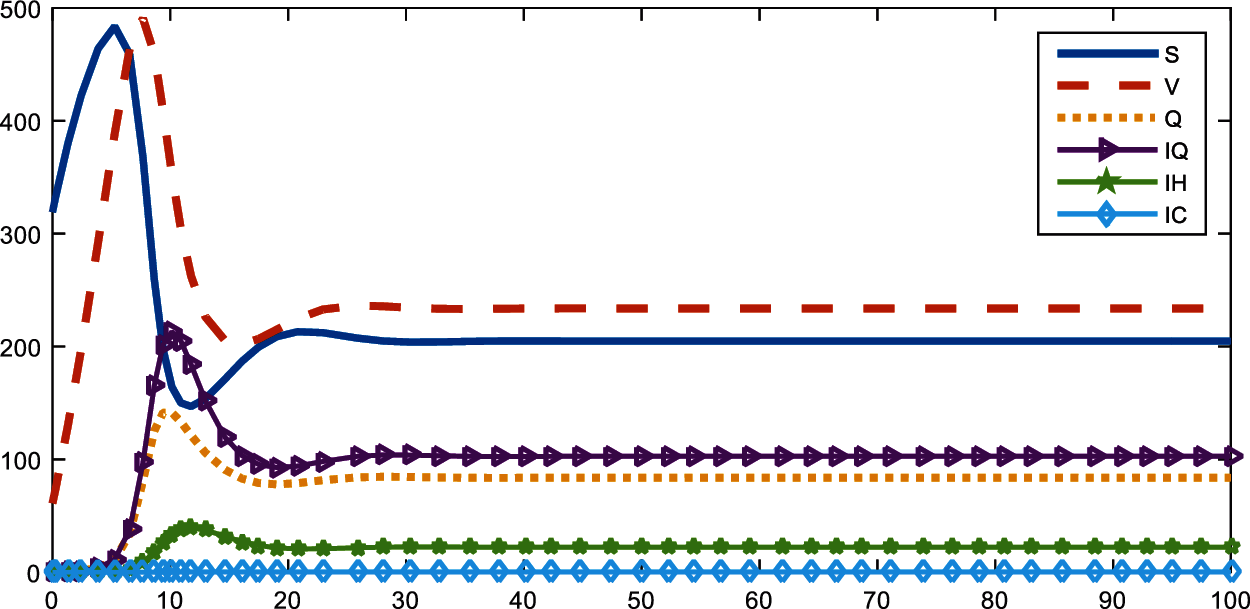
Figure 5: Distribution of compartments with
For the sensitivity, to get sensible results, percentage of
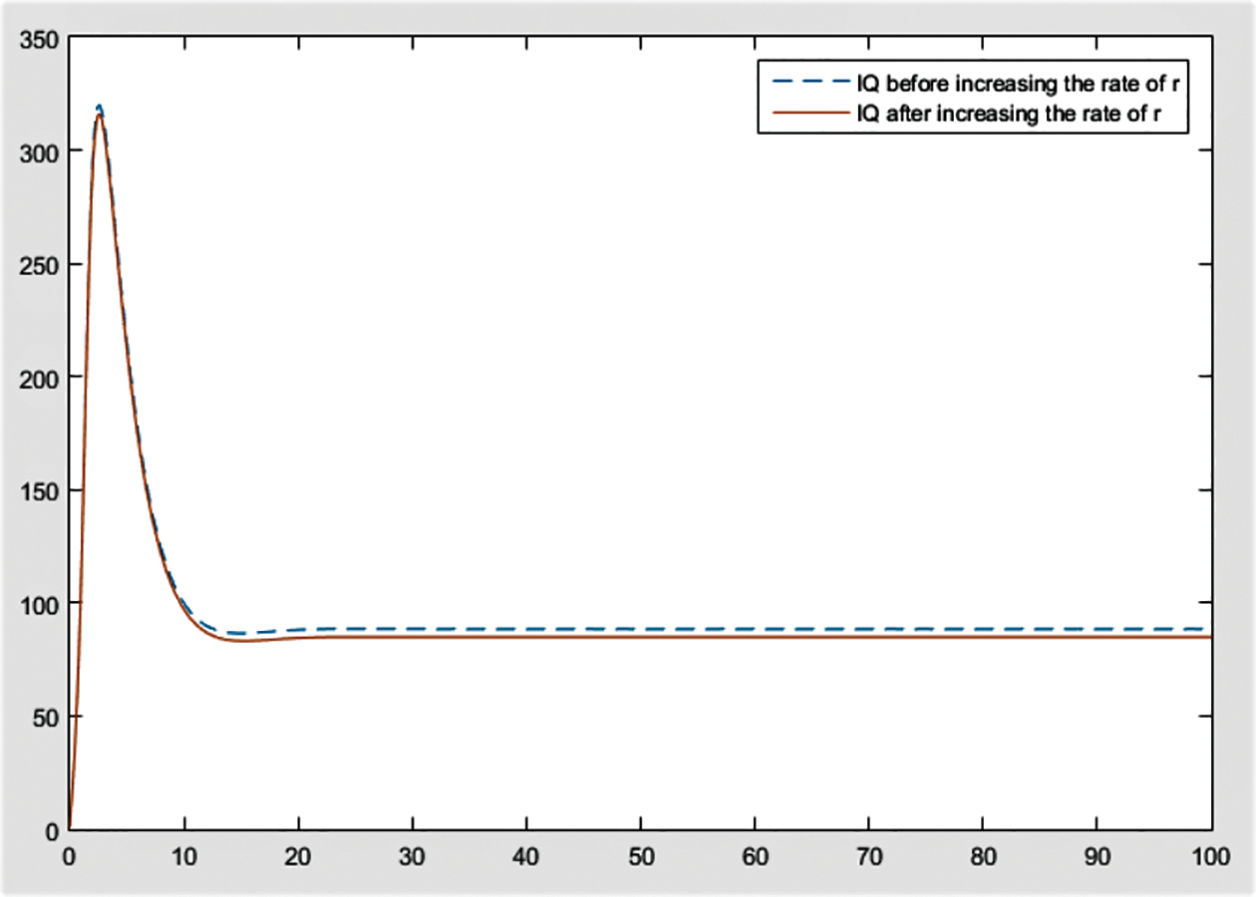
Figure 6: Effect of r on
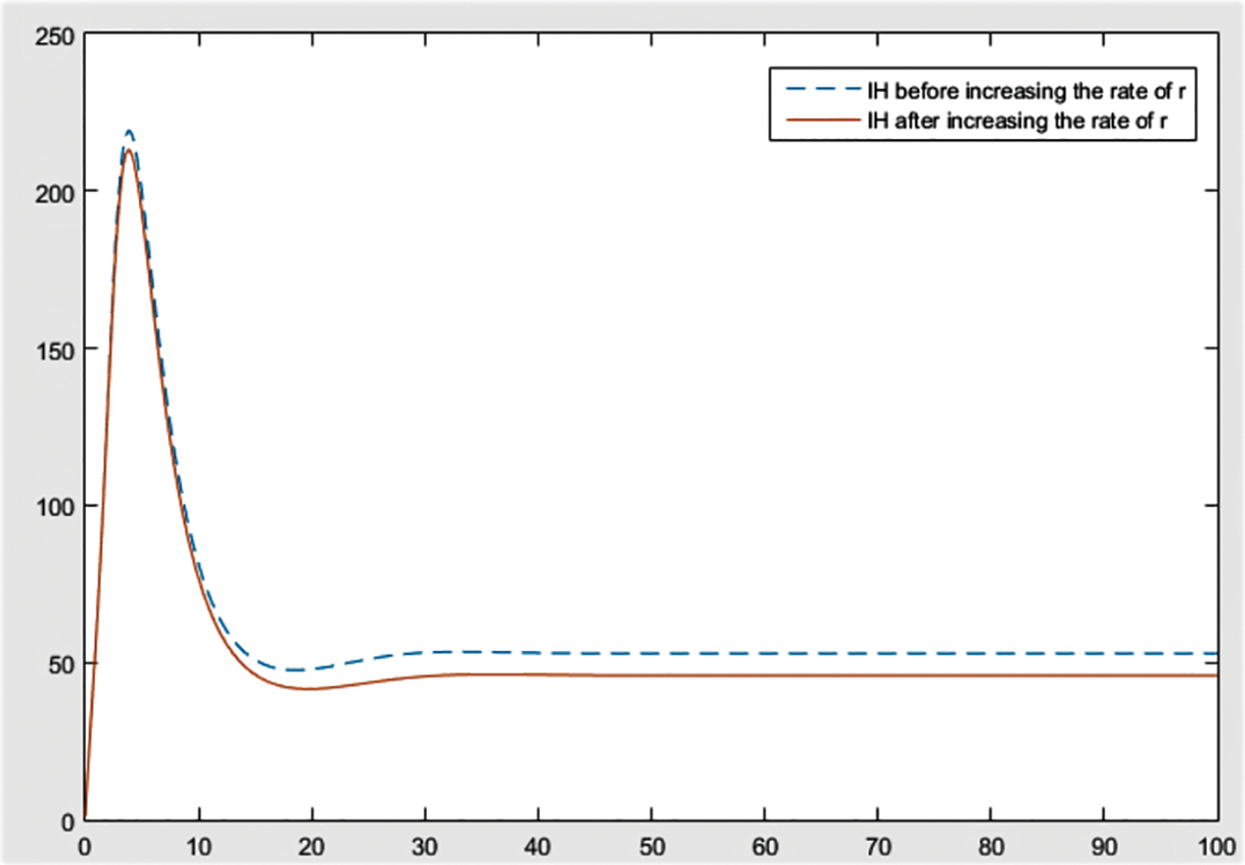
Figure 7: Effect of r on
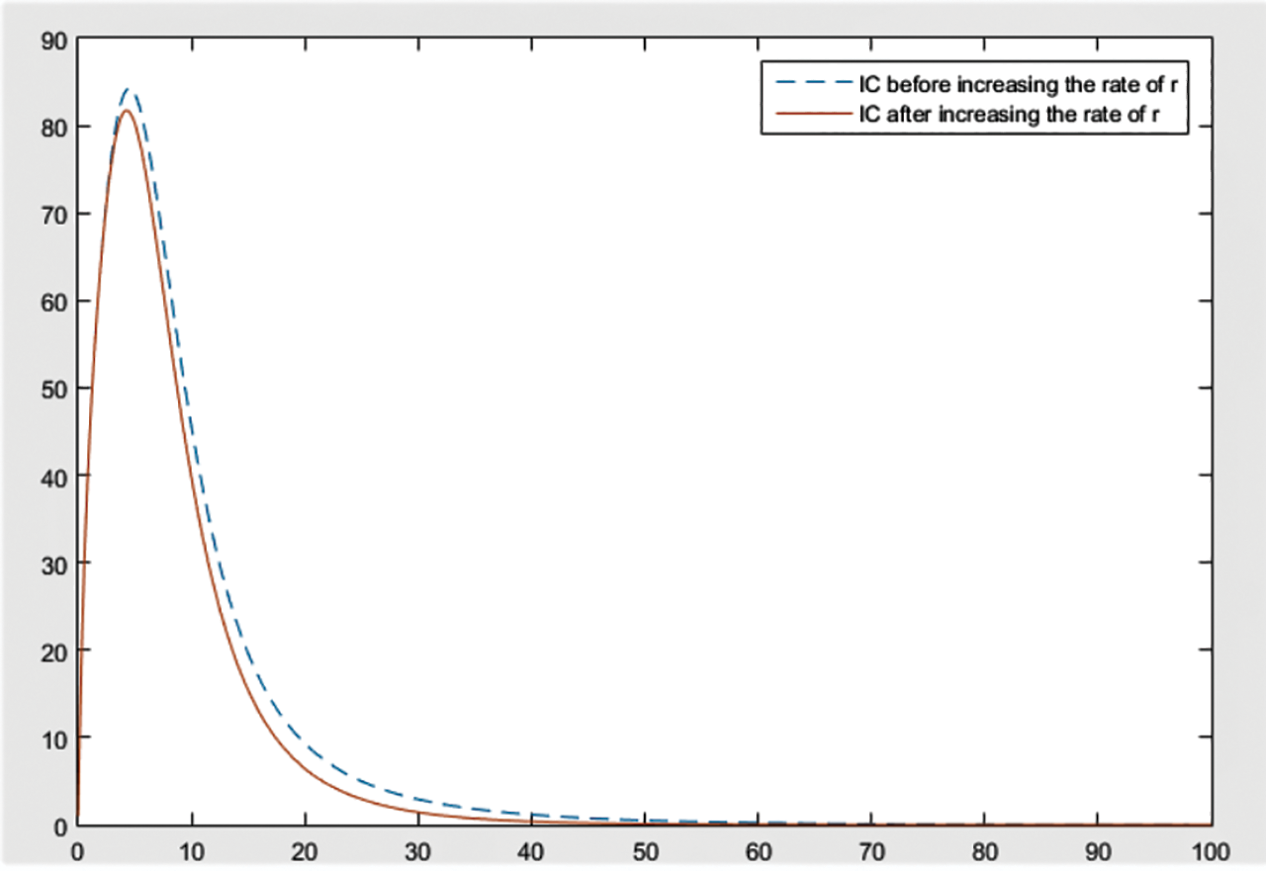
Figure 8: Effect of r on
From the figures, it can be concluded that the most significant effect or difference occur in severe infected individuals,
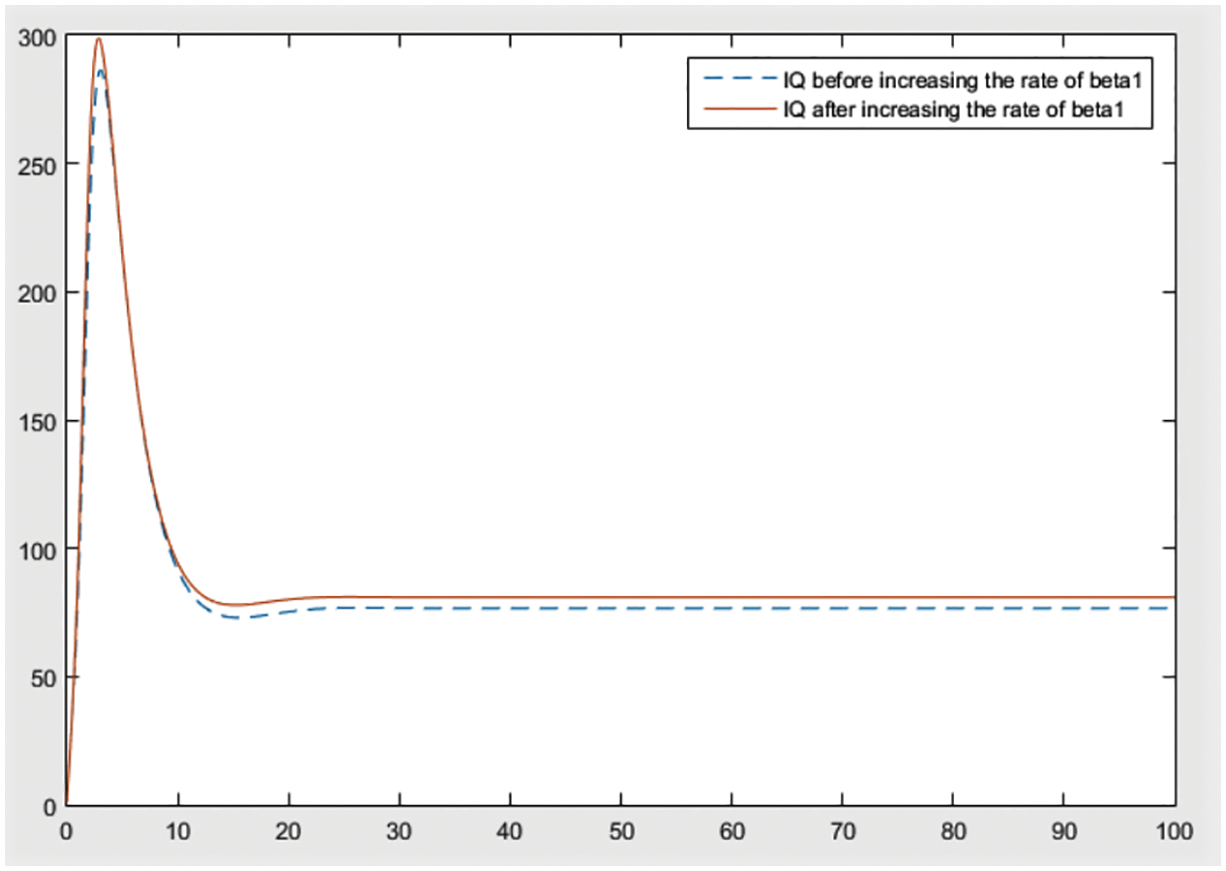
Figure 9: Effect of
By checking the figures Figs. 9–11, it can be easily said that increase in
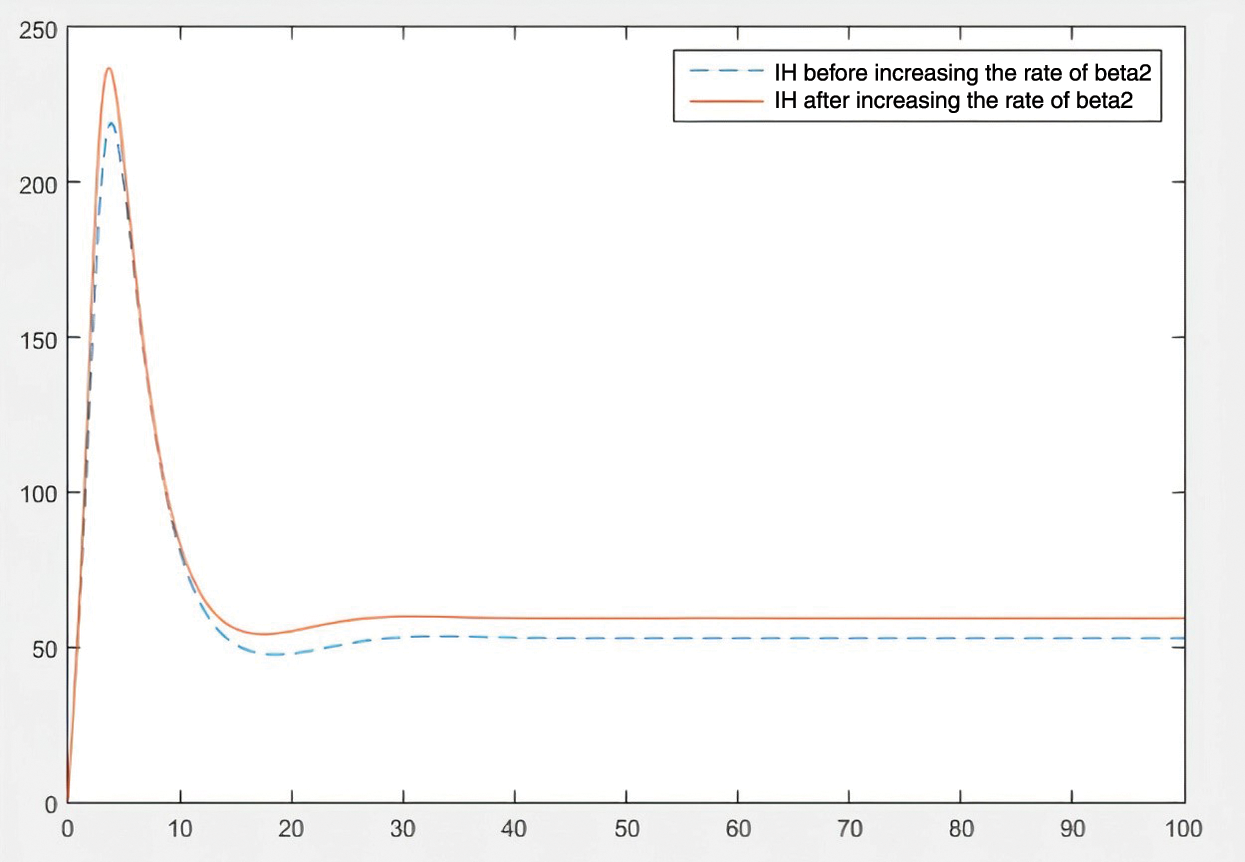
Figure 10: Effect of
At the end of the study, the answer to the question how can vaccination be effective is analyzed. For this purpose, cases are simulated with MatLab for vaccination rate
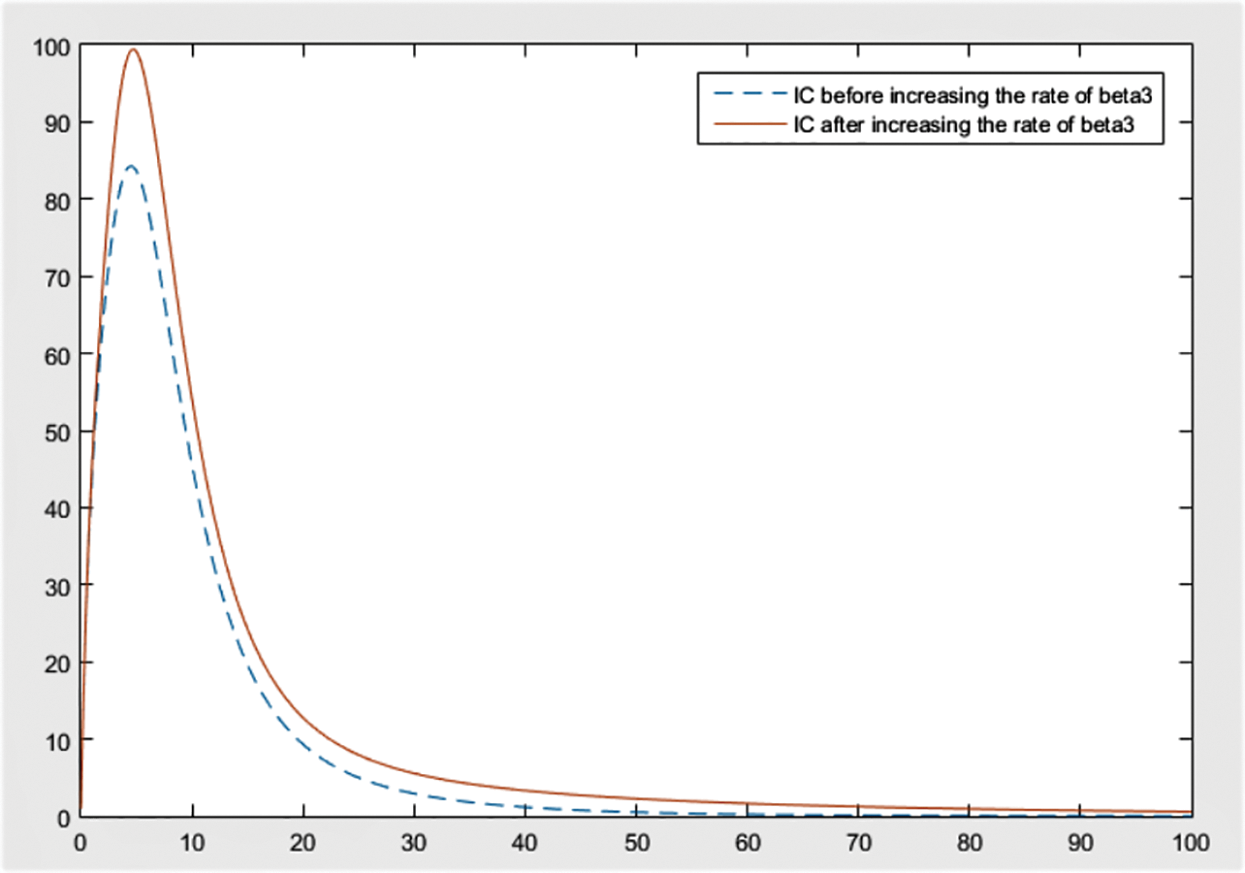
Figure 11: Effect of
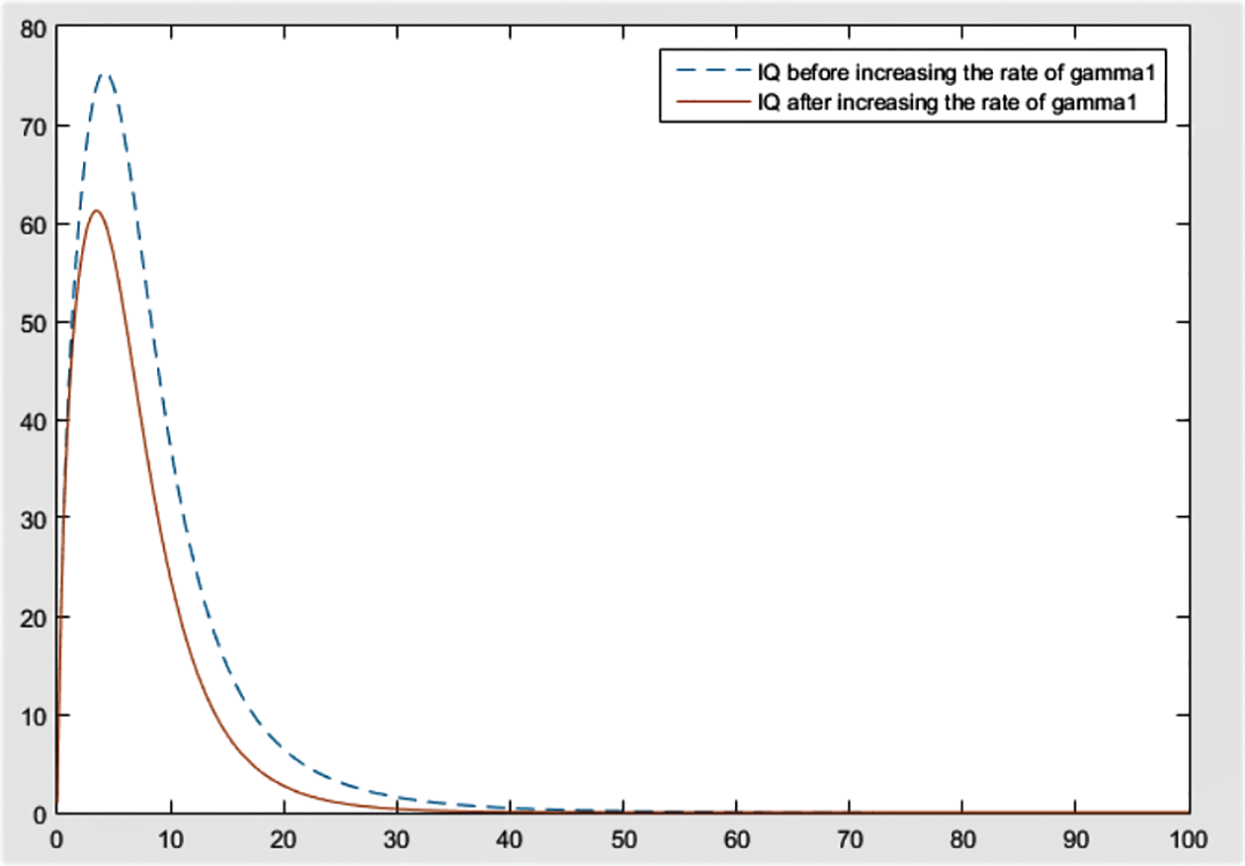
Figure 12: Effect of
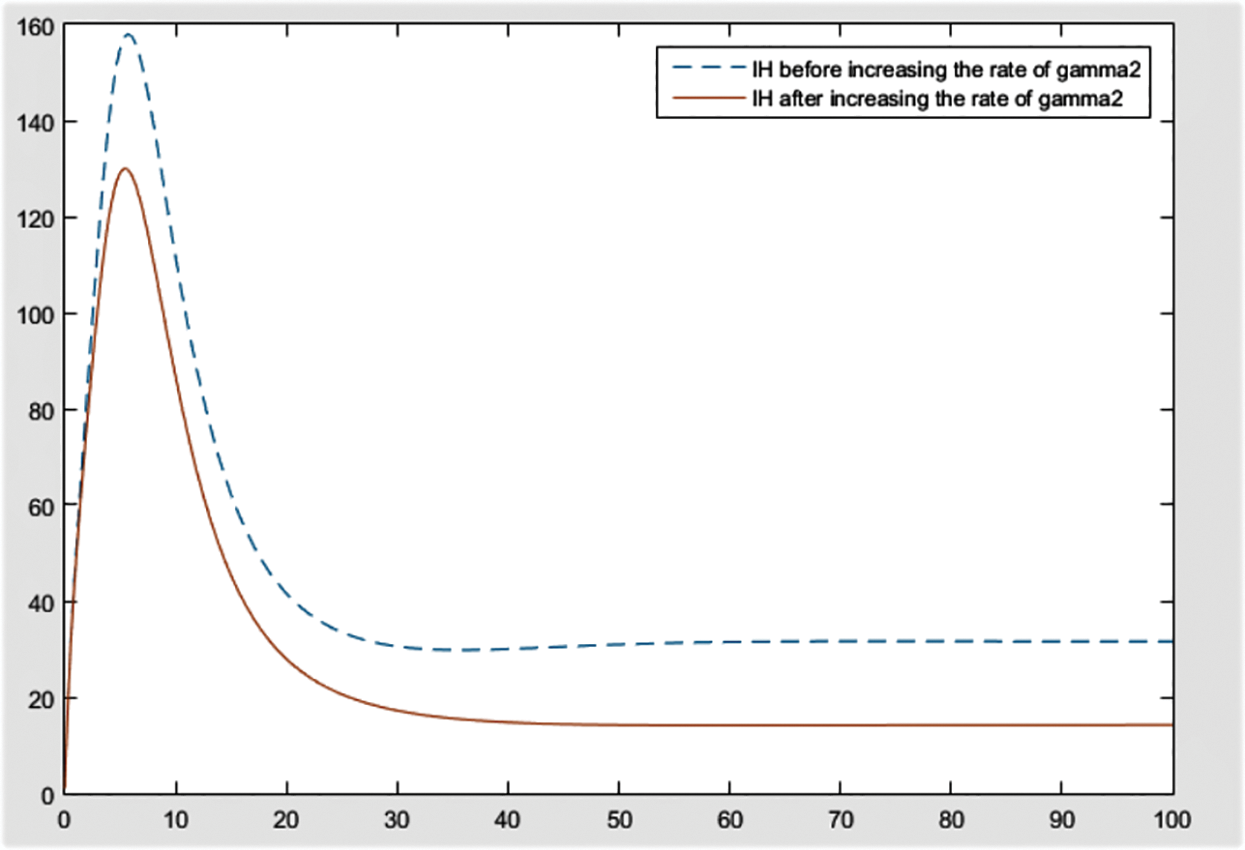
Figure 13: Effect of
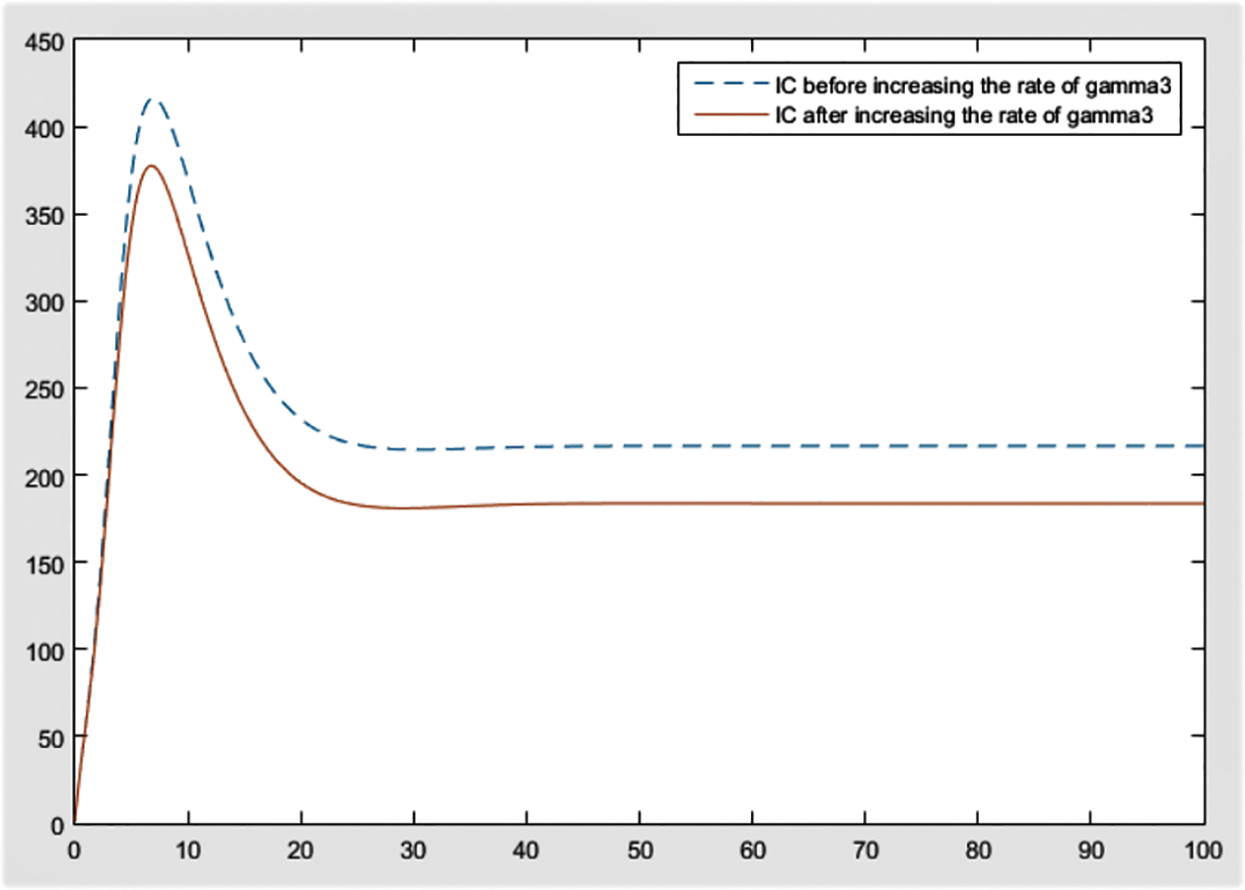
Figure 14: Effect of
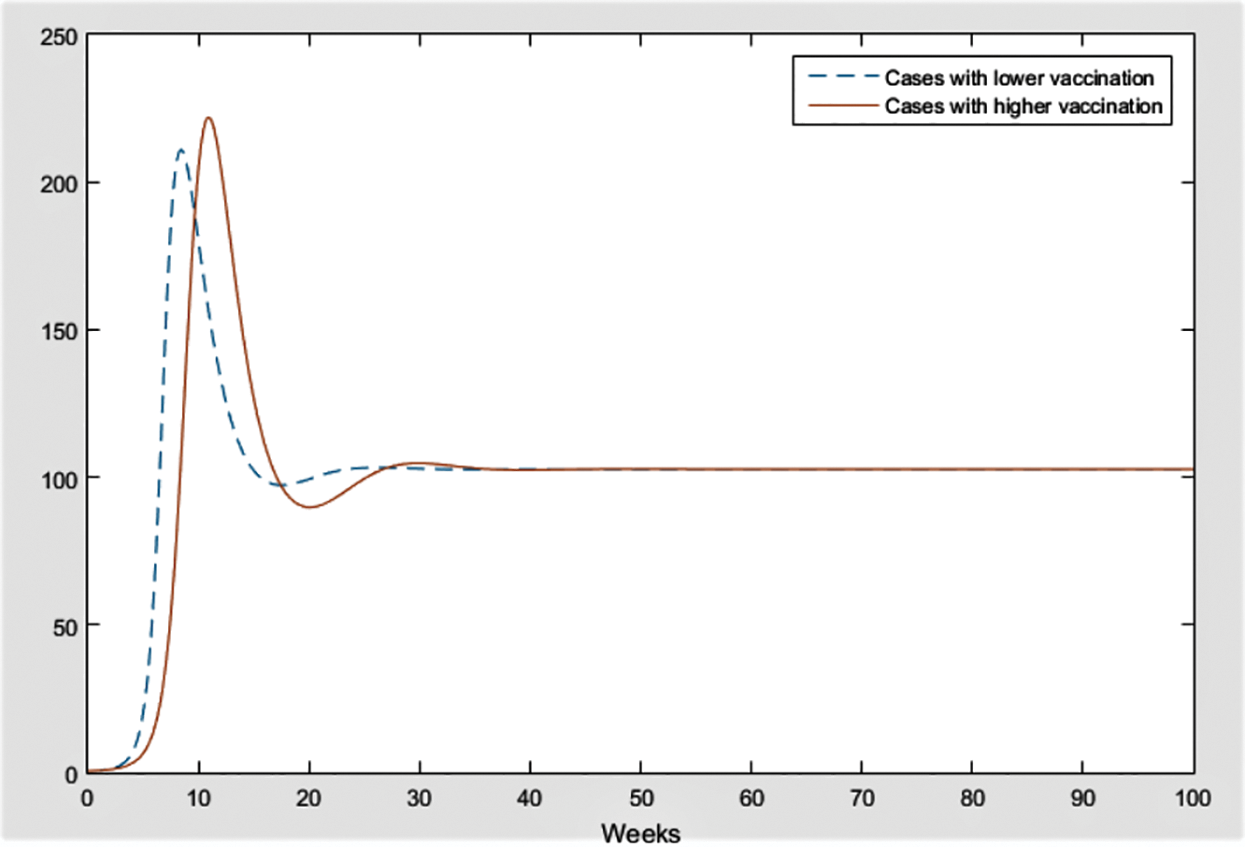
Figure 15: Comparison of cases with vaccination rate r = 0.02 and r = 0.15
In this paper, COVID-19 pandemic in North Cyprus is examined. One of the most discussed treatment, vaccination, is analyzed to see its effect on the disease. For this purpose, sensitivity analysis is made for 100 days. As a result, it is deduced that the vaccine alleviates the severe symptoms of the disease for severe infected individuals, in other words, increase in vaccination rate is the root of the drastic change in severe cases (Figs. 7 and 8). Also, a small decrease in mild infections is observed with the rise in vaccination rate (Fig. 6). The model showed that a decrease in infection rates with increase in recovery rates causes a decrease in whole infected individuals. Thus, this draws a rational outcome.
Fig. 15 is given to indicate the importance of vaccination rates; it compares infected individuals with different percentages of vaccination. It is evident that approximately in 25 weeks, total cases are expected to come up to the same point with different vaccination rates, 2% and 15%. The explanation for this lies in clarifying the majority of the vaccinated population. First of all, in North Cyprus, vaccinated people mostly consist of people above the age 65 and have chronic diseases who are out of mobility, most of the time. Substantially, people that are not in mobility get vaccinated. Secondly, along a month, no new vaccination programs are initiated due to a lack of vaccination supply. As a result, the progress of vaccination proceeds slowly in the country. Besides this, the currency and protectiveness of the vaccine are approximately 24 weeks. Regarding all of these, success in controlling the disease via the vaccine is improbable. Therefore, the effect of the vaccination was not distinctly reflected on the model, efficiently, due to the delay in vaccination and above reasons. There are other studies that show the importance of control strategies which include awareness, mobility, vaccination rate, etc. [21–23]. For future works, effect of medicine can be modelled and analyzed as a treatment of COVID-19.
Funding Statement: The authors received no specific funding for this study.
Conflicts of Interest: The authors declare that they have no conflicts of interest to report regarding the present study.
1. Singer, B., Thompson, R., Bonsall, M. (2021). The effect of the definition of âpandemicâ on quantitative assessments of infectious disease outbreak risk. Scientific Reports, 11(1). DOI 10.1038/s41598-021-81814-3. [Google Scholar] [CrossRef]
2. Allegranzi, B., Nejad, S., Combescure, C., Graafmans, W., Attar, H. et al. (2011). Burden of endemic health-care-associated infection in developing countries: Systematic review and meta-analysis. The Lancet, 377(9761), 228–241. DOI 10.1016/S0140-6736(10)61458-4. [Google Scholar] [CrossRef]
3. Allegranzi, B., Kilpatrick, C., Storr, J., Kelley, E., Park, B. et al. (2017). Global infection prevention and control priorities 2018â22: A call for action. The Lancet, 5(12), E1178–E1180. DOI 10.1016/S2214-109X(17)30427-8. [Google Scholar] [CrossRef]
4. WHO (2021). Coronavirus disease (COVID-19) weekly epidemiological update and weekly operational update. https://www.who.int/emergencies/diseases/novel-coronavirus-2019/situation-reports/. [Google Scholar]
5. Worldometers.info COVID-19 Coronavirus Pandemic (2021). https://www.worldometers.info/faq/. [Google Scholar]
6. Stojkoski, V., Utkovski, Z., Jolakoski, P., Tevdovski, D., Kocarev, L. (2020). The socio-economic determinants of the coronavirus disease (COVID-19) pandemic. https://www.medrxiv.org/content/early/2020/04/17/2020.04.15.20066068.full.pdf. [Google Scholar]
7. WHO (2020). Critical preparedness, readiness and response actions for COVID-19: Interim guidance. 22 March 2020. https://apps.who.int/iris/handle/10665/331511. [Google Scholar]
8. Gardner, W., States, D., Bagley, N. (2020). The coronavirus and the risks to the elderly in long-term care. Journal of Aging Social Policy, 32(4–5), 310–315. DOI 10.1080/08959420.2020.1750543. [Google Scholar] [CrossRef]
9. Lima, C., Carvalho, P., Lima, I., Nunes, J., Saraiva, J. et al. (2020). The emotional impact of coronavirus 2019-ncov (new coronavirus disease). Psychiatry Research, 287, 112915. DOI 10.1016/j.psychres.2020.112915. [Google Scholar] [CrossRef]
10. Rachah, A., Torres, D. (2016). Dynamics and optimal control of ebola transmission. Mathematics in Computer Science, 10, 331–342. DOI 10.1007/s11786-016-0268-y. [Google Scholar] [CrossRef]
11. Ndairou, F., Area, I., Nieto, J., Silva, C., Torres, D. (2018). Mathematical modeling of zika disease in pregnant women and newborns with microcephaly in Brazil. Mathematical Methods in the Applied Sciences, 41(18), 8929–8941. DOI 10.1002/mma.4702. [Google Scholar] [CrossRef]
12. Djordjevic, J., Silva, C., Torres, D. (2018). Mathematical modeling of zika disease in pregnant women and newborns with microcephaly in Brazil. Applied Mathematics Letters, 84, 168–175. DOI 10.1016/j.aml.2018.05.005. [Google Scholar] [CrossRef]
13. Bloom, D. E., Kuhn, M., Prettner, K. (2020). Modern infectious diseases: Macroeconomic impacts and policy responses. Working Paper 27757. National Bureau of Economic Research. http://www.nber.org/papers/w27757. [Google Scholar]
14. Thompson, R. (2020). Epidemiological models are important tools for guiding COVID-19 interventions.BMC Medicine, 18 (152), 152–155. DOI 10.1186/s12916-020-01628-4. [Google Scholar] [CrossRef]
15. Hincal, E., Kaymakamzade, B., Gokbulut, N. (2018). Basic reproduction number and effective reproduction number for North Cyprus for fighting COVID-19. Bulletin of the Karaganda University, Mathematics Series, 3(99), 86–95. DOI 10.31489/2020M3/86-95. [Google Scholar] [CrossRef]
16. Tuite, A., Tien, J., Eisenberg, M., Earn, D., Ma, J. et al. (2011). Cholera epidemic in Haiti, 2010: Using a transmission model to explain spatial spread of disease and identify optimal control interventions. Annals of Internal Medicine, 154(9), 593–601. DOI 10.7326/0003-4819-154-9-201105030-00334. [Google Scholar] [CrossRef]
17. Kaymakamzade, B., Baba, I., Hincal, E. (2016). Stability analysis of osaltamivir-resistant influenza virus model. Procedia Computer Science, 102, 333–341. DOI 10.1016/j.procs.2016.09.409. [Google Scholar] [CrossRef]
18. Muhammad, S., Hincal, E., Kaymakamzade, B., Gokbulut, N. (2021). Sensitivity analysis on the seir-sei model for the dynamics of blinding trachoma. AIP Conference Proceedings, 2325(1), 020014. DOI 10.1063/5.0040299. [Google Scholar] [CrossRef]
19. Gokbulut, N., Kaymakamzade, B., Sanlidag, T., Hincal, E. (2021). Mathematical modelling of COVID-19 with the effect of vaccine. AIP Conference Proceedings, 2325(1), 020065. DOI 10.1063/5.0040301. [Google Scholar] [CrossRef]
20. Delamater, P., Street, E., Leslie, T., Yang, Y., Jacobsen, K. (2019). Complexity of the basic reproduction number (r0). Emerging Infectious Diseases, 25(1), 1–4. DOI 10.3201/eid2501.171901. [Google Scholar] [CrossRef]
21. Baba, I. A., Nasidi, B. A., Baleanu, D. (2021). Optimal control model for the transmission of novel COVID-19. Computers, Materials & Continua, 66(3), 3089–3109. DOI 10.32604/cmc.2021.012301. [Google Scholar] [CrossRef]
22. Memon, Z., Qureshi, S., Memon, B. R. (2021). Assessing the role of quarantine and isolation as control strategies for COVID-19 outbreak: A case study. Chaos, Solitons & Fractals, 144, 110655. DOI 10.1016/j.chaos.2021.110655. [Google Scholar] [CrossRef]
23. Musa, S. S., Qureshi, S., Zhao, S., Yusuf, A., Mustapha, U. T. et al. (2021). Mathematical modeling of COVID-19 epidemic with effect of awareness programs. Infectious Disease Modelling, 6, 448–460. DOI 10.1016/j.idm.2021.01.012. [Google Scholar] [CrossRef]
 | This work is licensed under a Creative Commons Attribution 4.0 International License, which permits unrestricted use, distribution, and reproduction in any medium, provided the original work is properly cited. |