| Computer Modeling in Engineering & Sciences |
DOI: 10.32604/cmes.2021.017679
REVIEW
A Survey on Machine Learning in COVID-19 Diagnosis
1School of Educational Science, Nanjing Normal University, Nanjing, 210023, China
2School of Informatics, University of Leicester, Leicester, LE17RH, UK
*Corresponding Author: Zhihai Lu. Email: luzhihai@njnu.edu.cn
#These authors contributed equally
Received: 30 May 2021; Accepted: 09 August 2021
Abstract: Since Corona Virus Disease 2019 outbreak, many expert groups worldwide have studied the problem and proposed many diagnostic methods. This paper focuses on the research of Corona Virus Disease 2019 diagnosis. First, the procedure of the diagnosis based on machine learning is introduced in detail, which includes medical data collection, image preprocessing, feature extraction, and image classification. Then, we review seven methods in detail: transfer learning, ensemble learning, unsupervised learning and semi-supervised learning, convolutional neural networks, graph neural networks, explainable deep neural networks, and so on. What's more, the advantages and limitations of different diagnosis methods are compared. Although the great achievements in medical images classification in recent years, Corona Virus Disease 2019 images classification based on machine learning still encountered many problems. For example, the highly unbalanced dataset, the difficulty of collecting labeled data, and the poor quality of the data. Aiming at these problems, we propose some solutions and provide a comprehensive presentation for future research.
Keywords: COVID-19 diagnosis; machine learning; deep learning; deep neural network
The novel coronavirus pneumonia broke out in 2019 [1]. The pathogen is identified as a new enveloped ribonucleic acid-β (RNA-β) coronavirus, and it is similar to Severe Acute Respiratory Syndrome Coronavirus (SARS-CoV), now named SARS-CoV-2 [2]. The novel coronavirus pneumonia is transmitted through interpersonal transmission [3], and the recent emergence of large numbers of infected people without initial symptoms of infection accelerates the spread of the disease [4], the surge in patients has put a lot of pressure on medical institutions [5]. On March 11, 2020, the World Health Organization (WHO) announced that Corona Virus Disease 2019 (COVID-19), an acute respiratory syndrome, is pandemic [6]. WHO recommended people avoid close contact with infected people and wash their hands frequently, especially after direct contact with patients [7]. At the same time, different countries imposed border restrictions, flight restrictions, social distancing, and increased awareness of hygiene [8].
COVID-19 is an acute resolved disease with a case fatality rate of 2% [9]. Its clinical symptoms mainly include fever, cough, headache, and breathing difficulty [10]. And studies have shown that patients with high blood pressure are at greater risk of death, followed by those with diabetes or heart disease [11], and children are usually less symptomatic than adults, but young children and infants are vulnerable [12]. Currently, there is no specific drug. Reverse-transcription polymerase chain reaction (RT-PCR) is the current standard test for the COVID-19 diagnosis [13], and it is to collect samples by nasopharyngeal swab or laryngopharyngeal swab [14]. RT-PCR is a genetic test in which RNA is reverse transcribed into complementary deoxyribonucleic acid [15], but this method has some limitations, especially in middle and low-income countries, including time consumption, high cost, and shortage of the kit [16]. Since the viral load of SARS-CoV-2 in respiratory samples decreases with the prolongation of the disease course, RT-PCR may produce false negative results [17]. Some research revealed that RT-PCR positive rate for pharyngeal swabs was about 30%–60% at initial detection [18], but chest CT images have a sensitivity of 97% and an accuracy of 68% in the diagnosis of COVID-19 [16]. In general, doctors gain significant information and make a diagnosis with CT scan images or X-ray images, and the process is faster, cheaper, and more readily available than RT-PCR [19]. However, a large number of medical images must be evaluated by doctors in a short period of time, which may increase the probability of misclassification [20]. So, artificial intelligence is increasingly used in the diagnosis of reference [21]. Deep learning plays an important role in this diagnosis, which includes plenty of training methods and models. By reading the literature, we know that the learning methods are varied, such as traditional methods, transfer learning, multi-task learning, end-to-end deep learning, and so on. In addition, convolutional neural networks (CNNs), graph neural networks (GNNs), and explainable deep neural networks (xDNNs) have been widely used in researches. However, with so many methods, the classification accuracy of each one is different. Through reading the literature about the diagnosis of the COVID-19, it was found that the following seven learning methods (transfer learning, ensemble learning, unsupervised learning and semi-supervised learning, convolutional neural networks, graph neural networks, explainable deep neural networks, and so on) are more commonly used in the diagnosis of the COVID-19. Moreover, most experiments encountered some problems, such as the highly unbalanced dataset, the difficulty of collecting labeled data, and the poor quality of the data. Therefore, we summarize these seven learning methods in this paper, and propose solutions to these problems encountered.
In this paper, we will introduce the procedure of diagnosis COVID-19 based on machine learning in Section 2. Then we will introduce seven methods and the corresponding literature in detail in Section 3. Finally, the future research directions of COVID-19 diagnosis methods will be concluded in Section 4. To help understand more clearly, we provide a table with all abbreviations and full names as Table 1.
2 Computer-Aided Diagnosis (CAD) in COVID-19
CAD is becoming more and more popular in the field of medical diagnosis. It is a method that uses machine learning to analyze the image or non-image dataset to diagnose the patient's condition. The method can be used as an aid in the decision-making process of clinicians and reduce doctors’ stress in disease diagnosis [22], particularly when COVID-19 breaks out in the world in a short time. Machine learning algorithms could detect underlying patterns through training datasets, then make some predictions with the best fit parameter [23]. The procedure of COVID-19 classification based on machine learning is shown in Fig. 1.
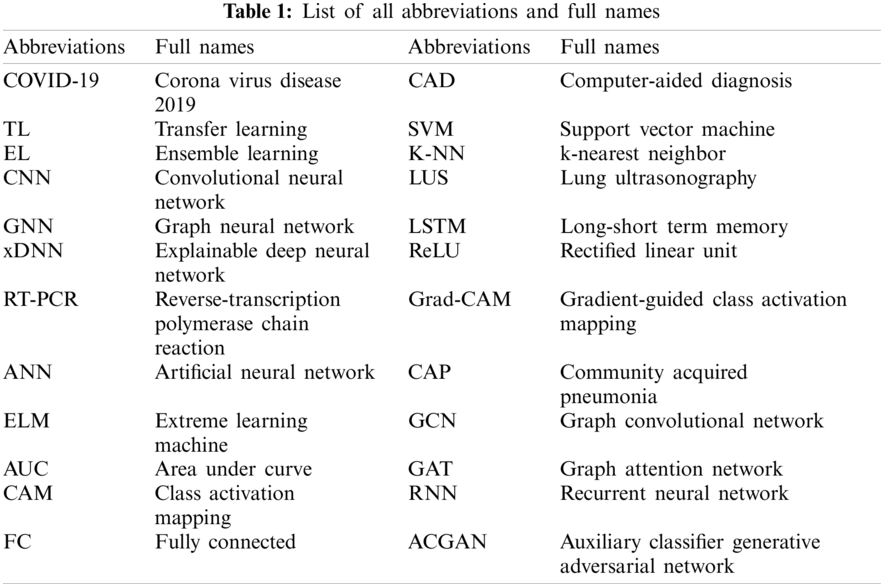
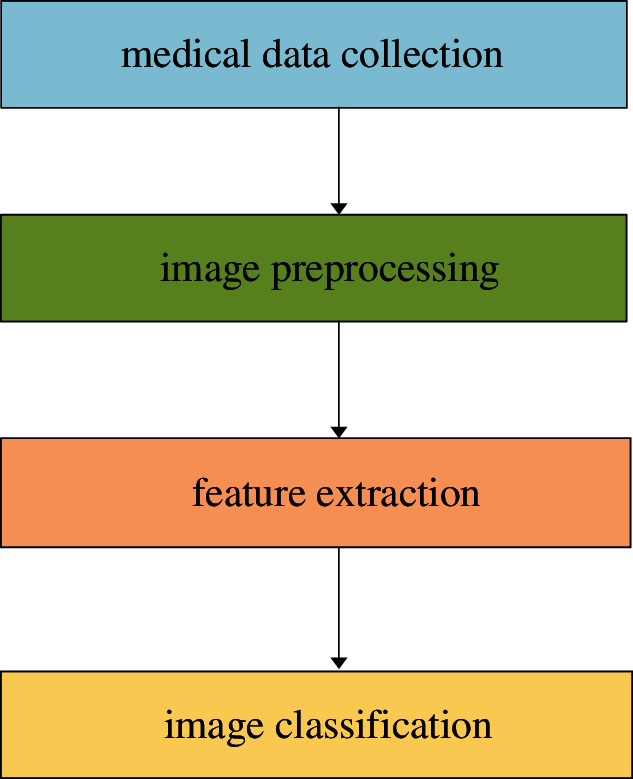
Figure 1: The procedure of COVID-19 classification based on machine learning
Despite that CAD has made great contributions to clinical practice, there are still many problems in the COVID-19 diagnosis, leading to the low generalization of models and the failure of diagnostic accuracy to meet the clinical application. For example, during the data collection stage, labeled data are difficult to collect, and the dataset is highly unbalanced. During the data preprocessing stage, the size and protocol of images are inconsistent. In the feature extraction stage, COVID-19 images have similar features to viral pneumonia images, making it difficult to accurately extract feature information. In the classification stage, there are many types of classifiers such as support vector machine (SVM), k-nearest neighbor (K-NN), random forest, Bayesian network, Gaussian network, and so on, so the selection and optimization of classifiers are a challenge [24].
In the COVID-19 diagnostic research based on machine learning, X-ray images, CT images, and lung ultrasonography (LUS) images are the main medical images. Chest CT imaging is a widely available, time-saving, and noninvasive method for the detection of COVID-19 [25], and the characteristic of COVID-19 CT images as ground-glass opacities at the early stage, air space consolidation during the peak stage, bronchovascular thickening in the lesion stage, and traction bronchiectasis are visible during the absorption stage [26]. So, medical practitioners can distinguish different features from early to late stages and distinguish the asymptomatic patients via chest CT images [27]. Despite some advantages of CT scans, CT scan machines are difficult to clean [28]. Compared with CT images, the X-ray images of COVID-19 patients did not show obvious symptoms in the early stage; hence the early chest X-ray images of COVID-19 patients could be easily misdiagnosed [29]. However, with the disease progressing, COVID-19 gradually manifests as a typical unilateral patchy infiltration involving the middle, upper or lower zone of the lungs, occasionally with evidence of a consolidation [30]. And an open image library was set up on GitHub by Mohammadi et al. [31], consisting of a large number of COVID-19 chest X-ray images with new images added regularly. In recent years, in addition to X-ray images and CT images, LUS images have also been used for medical diagnosis [32], which is cheap and safe. And LUS images have minimal infection spreading risks since they can be used at the bedside of patients, without the need to go to the public examination room [30]. Carrer et al. [33] conducted experiments using LUS from Italian COVID-19 LUS Database. They proposed an automatic pleural line location method based on the hidden Markov model and Viterbi algorithm for LUS data. The findings suggest specific LUS characteristics and imaging biomarkers for COVID-19 patients, so the LUS can be used to the COVID-19 diagnosis [34].
Due to the short duration of the COVID-19 outbreak and the difficulty of obtaining medical images, many datasets are highly unbalanced. Therefore, most researchers proposed many data augment methods, such as traditional data augment methods of rotation and zoom [35], conditional generative adversarial nets method [36], and two-stage data argument technique [37]. Conditional generative adversarial nets were composed of generator network and discriminator network, and the method could enlarge the dataset by ten times. As for the two-stage data argument technique, the shallow image enhancement method was used in the first stage, and the synthesis of a few oversampling methods was used in the second stage. And a federated learning platform and the dual-sampling algorithm were proposed by Wang et al. [38] and Ouyang et al. [39] to solve the problem of unbalanced datasets.
In addition, the X-ray images or CT images are acquired from different hospitals and agencies, so the images are different in their sizes and standards. Heidari et al. [40] generated a pseudo-color image to improve the classification accuracy via two image preprocessing steps. They collected 8,474 COVID-19 chest X-rays from several publicly available image databases. Moreover, they removed the aperture area of the image and divided the original image into the binary image. Then the morphological filter was utilized to smooth the boundary. Finally, the processed binary image was mapped to the original image. Heidarian et al. [41] used the U-Net network to remove noise and artifacts of CT images. In their experiments, the bilateral low-pass filter was adopted to remove noise, and the Gaussian low-pass filter was used when calculating the weight. Then they used the histogram equalization method to normalize the image. Their experimental results showed that the two preprocessing steps improved the classification performance of the model with a classification accuracy of 98.40%, while the classification accuracy was only 88.00% without two preprocessing steps. Similarly, Togacar et al. [42] proposed a new preprocessing technique, namely fuzzy technique, and stacking technique. The fuzzy technique played an important role in the image analysis step, and the results depended on the similarity or difference functions used for color separation, and the input values were RGB three variables. And the stacking technique was adopted to improve the quality of images, including original images and fuzzy color images. Zhou et al. [43] proposed a rapid, accurate, and machine-agnostic quantification method to quantify the CT images from different sources. The method included two steps, the first one was spatial normalization, and the other was signal normalization. The two steps resolved the heterogeneity problem of CT scan images. In addition, contrast limited adaptive histogram equalization and normalization were used frequently as important techniques of image preprocessing, and the image data was preprocessed and local features were extracted by exploiting the frequency and texture regions to generate a feature pool [44]. The literature with images preprocessing is as Table 2.
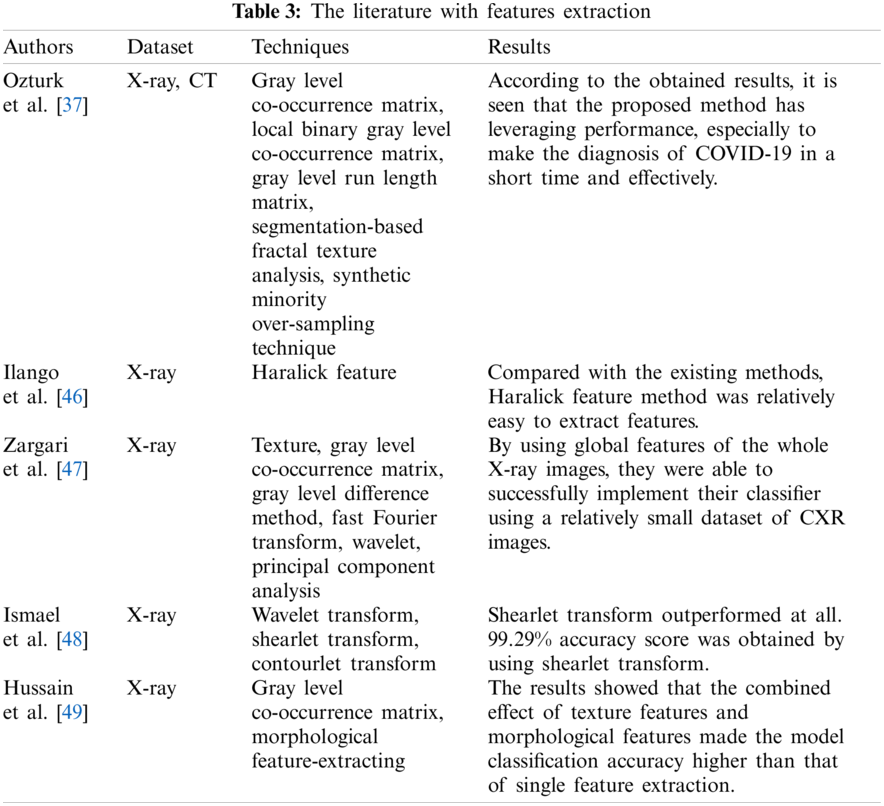
Features extraction is a very important part of medical diagnosis. Gray level co-occurrence matrix, local binary gray level co-occurrence matrix, gray level run length matrix, as well as segmentation-based fractal texture analysis and synthetic minority over-sampling techniques, were used by Ozturk et al. [37]. They proposed a framework, which was based on combining feature vectors produced by four feature extraction methods and then reproduced with over-sampling and augmentation methods.
Since many studies have found that viral pneumonia and COVID-19 are similar in terms of pulmonary infection area and infection characteristics [45], Haralick feature was adopted to extract texture features from chest X-ray images [46]. Haralick feature could derive textual feature measures from the co-occurrence matrix and could provide information about how the intensity of a particular pixel is related to the intensity of adjacent pixels. Compared with the existing methods, Haralick feature method was relatively easy to extract features. Zargari et al. [47] used texture, gray level co-occurrence matrix, gray level difference method, fast Fourier transform, and wavelet to calculate image features. A total of 252 chest X-ray image features were extracted by their feature extraction scheme, including 14 features from texture, 14 features from fast Fourier transform, 56 features from gray level co-occurrence matrix, 56 features from gray level difference method, and 112 features from wavelet. Then, the matrix of feature combination was obtained by Pearson correlation coefficient. Finally, the best feature vector was obtained by the principal component analysis method. Ismael et al. [48] used wavelet transform, shearlet transform, and contourlet transform to decompose the chest radiograph images and then normalized feature extraction from the decomposed chest X-ray images.
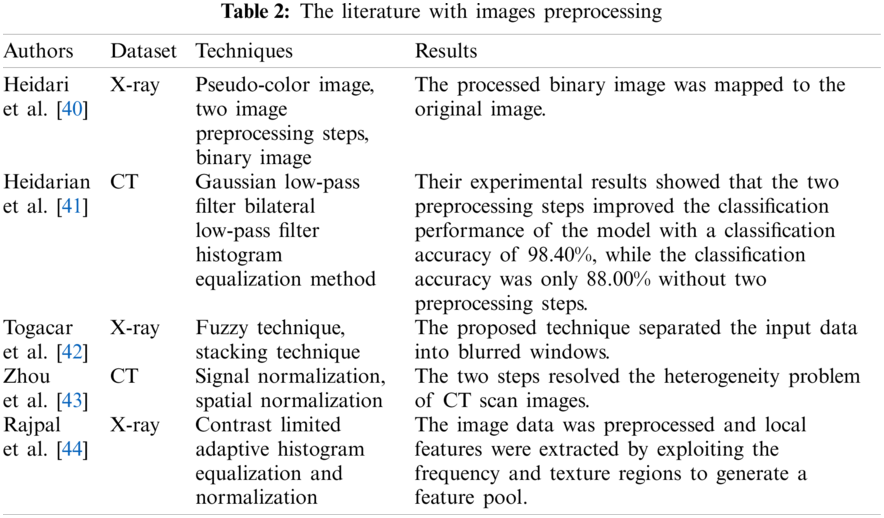
Hussain et al. [49] applied five classifiers (XGB-L, XGB-Tree, classification and regression tree, K-NN, and Naive Bayes) to classify the chest X-ray images of COVID-19, bacterial pneumonia, non-COVID-19 viral pneumonia, and health. In addition, gray level co-occurrence matrix technique was adopted to extract texture features of images, and the morphological feature-extracting method was utilized to obtain morphological features. The results showed that the combined effect of texture features and morphological features made the model classification accuracy higher than that of single feature extraction, and in binary classification, the accuracy of the K-NN classifier was lower than other classifiers. The flow of data and analysis is as Fig. 2.
Figure 2: Flow of data and analysis
The literature with features extraction is as Table 3.
There are many types of traditional classification methods, such as SVM, K-NN, decision tree, random forest, AdaBoost, XGBoost, and Bagging. Tabrizchi et al. [50] utilized EL to improve the classification accuracy of COVID-19. They used SVM, artificial neural network (ANN), Naive Bayes, and CNN for classification. Among them, the SVM is good at classifying non-linear problems, and ANNs can analyze features of samples and make predictions, and multilayer perceptron is distributed in the connected layer of ANN. Naive Bayes is a famous probabilistic classifier, which estimates the previous probability by means of posterior probability and conditional probability density function, and then makes the final prediction with the maximum posterior probability. The results showed that SVM outperformed other classifiers with an accuracy of 99.00%. Likewise, Turkoglu [51] used AlexNet as a pre-training model for transfer learning, and SVM as a classifier. They were trained and tested in the COVID-19 X-ray dataset and achieved a classification accuracy of 99.18. In addition, K-NN is commonly used in image classification. Arslan [52] used the K-NN for COVID-19 diagnosis. They utilized genomic sequences as datasets. The accuracy of K-NN mainly depends on the distance measurement. Five groups of measurements were used in their experiments, and the results showed that the best group of distance measurements achieved the classification accuracy of 98.40%. Yasar et al. [53] also utilized SVM, K-NN as classifiers. Their experimental results showed that SVM was superior to KNN.
The classification effect of a single classifier and multi-mode classification can be compared, and the multi-mode classification effect is better than that of a single classifier. Xu et al. [54] used 43 combination features to distinguish four types of pneumonia, including non-severe, severe, healthy and viral pneumonia, and completed diagnosis by three classification methods, namely k-nearest neighbor, random forest, and support vector machine. Mohammed et al. [55] also compared five classification methods, including SVM, linear kernel and radial basis function, K-NN, decision tree, and CNNs. The results showed that CNNs completed good performance, among which ResNet50 achieved the optimal classification accuracy of 98.80%. Secondly, compared with the traditional classification methods, the SVM method achieved a classification accuracy of 95.00%. Abraham et al. [56] used a Bayesian classifier to classify COVID-19. In their experiments, several pre-trained networks were applied to extract features from chest X-ray images, and then the images were classified by combining correlation-based feature selection and a Bayesian classifier.
Besides these traditional classifiers, most novel classification methods were proposed by researchers. Pokkuluri et al. [57] proposed a hybrid nonlinear cellular automata classifier and compared it with traditional methods, such as long-short term memory (LSTM), Adaboost, SVM, regression, etc. An extreme learning machine (ELM) has a strong anti-overfitting ability and can be used as a kernel-based support vector machine with the structure of neural networks. The hybrid nonlinear cellular automata classifier had reported an accuracy of 78.80%. The proposed classifier can also predict the rate at which this virus spreads, transmission within the boundary. Albadr et al. [58] used an Optimized Genetic Algorithm-Extreme Learning Machine for diagnosis. Their experimental result showed that the Optimized Genetic Algorithm-Extreme Learning Machine achieved 100.00% accuracy with fast computation time. Moreover, El-Kenawy et al. [59] proposed a voting classifier based on particle swarm optimization algorithm, which aggregated the prediction results of different classifiers to select the category with the highest voter turnout.
Medical image segmentation plays a critical role in the training of the models. Extra areas are removed from the lung image so that only infected parts of the lung can be treated effectively [60]. In image segmentation, the selection of the best threshold value is very important to the filtering process [61]. However, the threshold value varies from image to image. Therefore, Shankar et al. [62] applied the Gaussian Filtering method to preprocess medical images. Gaussian Filtering is a common method to improve image quality by smoothing images in medical image classification [46]. Elaziz et al. [63] proposed a hybrid approach that combines the features of the marine predator algorithm and the moth-flame optimization. The hybrid approach performed better in image segmentation. Tiwari et al. [64] proposed an image segmentation approach based on the marine predator algorithm. In their research, they conducted X-ray segmentation experiments with this approach and found that the approach achieved good performance. El-bana et al. [65] used multi-modal learning to fine-tune the InceptionV3 architecture and proposed pulmonary nodule detection to improve the segmentation accuracy of lung infections in CT scans. Furthermore, the contrast limited adaptive histogram equalization method was used for enhancing small details, textures and local contrast of the images. Their experimental results demonstrated an increase of approximately 2.5% and 4.5% for the dice coefficient and mean intersection-over-union, respectively, while achieving 60% reduction in computational time, compared to the recent literature. Wang et al. [66] proposed a new noise reduction algorithm. This algorithm was the extension of the dice-loss algorithm and the mean-absolute error loss algorithm. In addition, they built a novel COVID-19 Pneumonia Lesion segmentation network to deal with the lesions with various scales and appearances. Their experiments indicated that the proposed network achieved higher performance than state-of-the-art image segmentation networks. The literature with classification is as Table 4.

3 Diagnosis Techniques Based on Deep Neural Networks in COVID-19
3.1 COVID-19 Diagnosis Based on Transfer Learning
In many studies, deep learning models have shown superior performance to classical machine learning models [67]. But, deep learning models have some drawbacks. For example, they need a large number of labeled images for training that is costly and time-consuming. Transfer learning just makes up for this shortcoming [68]; this is a technique that reuses pre-trained models for a new related problem with fewer data and low complexity [69]. Mohammadi et al. [31] utilized four pre-trained networks to construct models, including VGG16, VGG19, MobileNet, as well as InceptionResNetV2, and compared their classification performance. These models were trained and tested in the X-rays dataset, and the results showed that the MobileNet provided the highest classification accuracy.
Ardakani et al. [70] compared ten well-known convolutional neural networks, including AlexNet, VGG16, VGG19, SqueezeNet, GoogleNet, MobileNetV2, ResNet18, ResNet50, ResNet101 and Xception. In their experiments, ResNet101 and Xception worked well. ResNet101 and Xception had the same area under the curve (AUC) of 99.40%, and Xception performed better than ResNet101 in specificity, but ResNet101 achieved a higher sensitivity. Chowdhury et al. [71] also trained networks using transfer learning (TL) and compared the performance of networks with and without data augment. These deep learning networks were MobileNetv2, SqueezeNet, ResNet18, InceptionV3, ResNet101, CheXNet, VGG19, and DenseNet201. These data augment methods were rotation and translation. The dataset consisted of 423 COVID-19 chest X-ray images, 1485 pneumonia chest X-ray images, and 1579 healthy chest X-ray images. The results showed that DenseNet201 performed better than other networks while with data augmentation, and CheXNet achieved the highest AUC and sensitivity when without data augment. Narin et al. [72] proposed an end-to-end structure, which did not require manual feature extraction, selection, and classification. Five pre-trained networks were trained, namely ResNet50, ResNet101, ResNet152, InceptionV3, and InceptionResNetV2. Through their experiments, it was clear that ResNet50 performed better than other networks. Ismael et al. [73] collected 180 COVID-19 chest X-ray images and 200 healthy chest X-ray images to train CNN. This CNN training process consisted of three parts: deep feature extraction, fine-tuning of pre-trained convolutional neural networks, and end-to-end training of CNN, as Fig. 3.
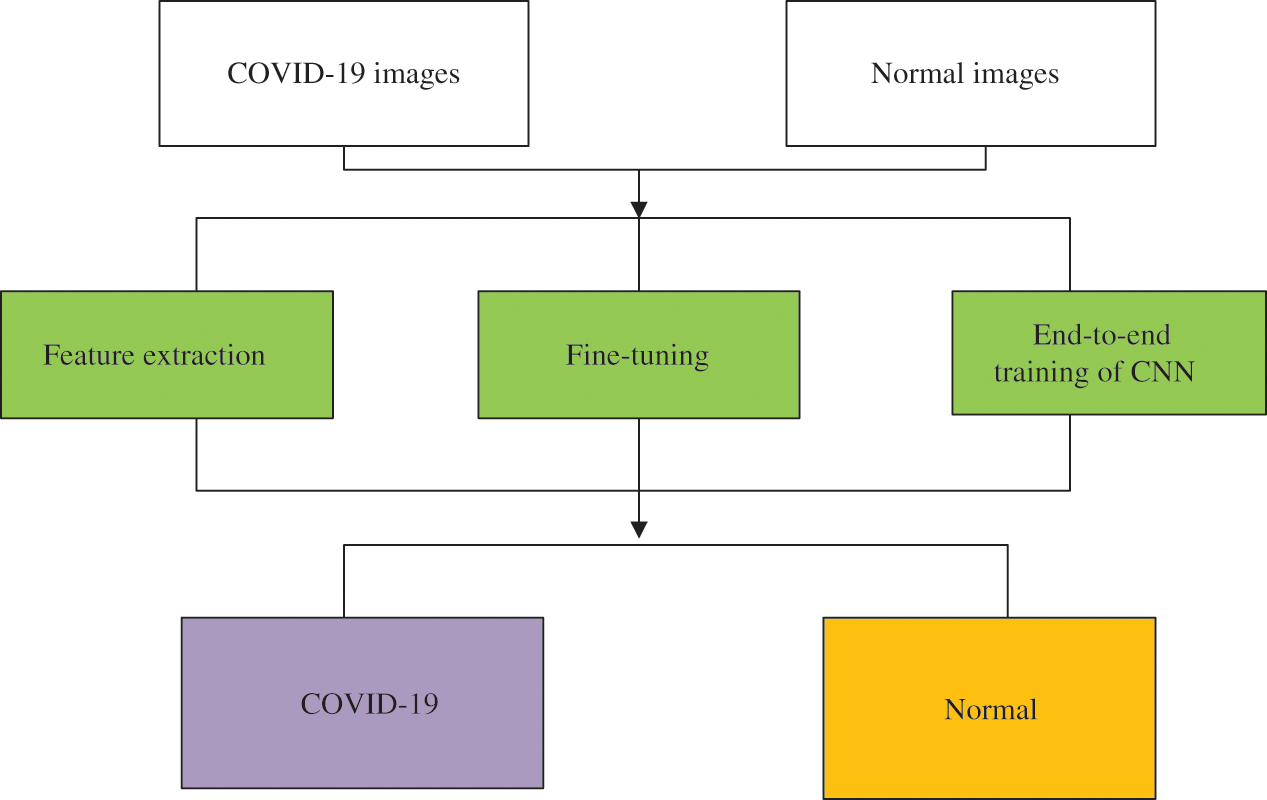
Figure 3: Illustration of the proposed methodology for COVID-19 detection
Five pre-trained deep networks were used for feature extraction, including ResNet18, ResNet50, ResNet101, VGG16, and VGG19. SVM with quadratic, linear, cubic, and Gaussian kernel functions were used for classification. The results showed that the classification performance of the SVM with cubic kernel function was better than other kernel functions.
Murugan et al. [74] proposed a new framework based on an ELM classifier. In their experiments, ResNet50 was used as an image preprocessing network, which would ignore some details in the processing of small-size images, thus reducing the diagnostic accuracy. Marques et al. [75] proposed a CNN based on EfficientNet. EfficientNet can extend the baseline ConvNet to any target resource constraint while maintaining the model efficiency for transmitting learning datasets. In general, the EfficientNet model offers more accuracy and efficiency than existing CNN models such as AlexNet, ImageNet, GoogleNet, and MobileNetV2 [76]. EfficientNet includes models ranging from B0 to B7, each with different parameters. The author used EfficientNetB4 with 19 M parameters. The results were that the proposed CNN achieved 99.62% accuracy in binary classification. Tammina [77] built a novel network called CovidSORT. This network was developed by the TL with six pre-trained networks (InceptionV3, VGG16, VGG19, ResNet50, DenseNet121, and MobileNetV2). The novel network achieved an accuracy of 96.83% based on the majority voting method of these models. Sun et al. [78] proposed a model based on adaptive feature selection guided deep forest. Adaptive feature selection guided deep forest is a method of obtaining a high-level representation of specific positional features from CT images. Each layer of the deep forest was composed of N independent random forests and a feature selection unit, among them, each random forest produced a probability distribution vector of COVID-19 and community acquired pneumonia (CAP). Then, they concatenated the N probability distribution vectors with the input feature vector, and calculated the feature importance for each feature within the input feature vector to reduce the redundancy of the features. The feature importance
where
where
Do et al. [80] used five architectures as the model backbones, including VGG16, VGG19, InceptionV3, InceptionResNetV2, and Xception. The results indicated that the VGG16-based model performed best with an accuracy of 97.00%, and these performances of the Xception-based model and InceptionV3-based model were slightly lower. Chaudhary et al. [81] decomposed the chest X-ray images into subband images via the Fourier-Bessel series expansion-based dyadic decomposition method. These subband images were then fed as input to ResNet50, a pre-trained network that was trained on ImageNet. Their experimental results indicated that the proposed method increased classification accuracy, and the ResNet50 performed better with a classification accuracy of 98.66%. Karar et al. [82] proposed a cascaded deep learning classifier. First, they used a series of binary classifiers to simplify the complex multi-label classification of X-ray images, then fine-tuned VGG and ResNet by stochastic gradient descent optimizer. 306 chest X-ray images were collected, including bacterial pneumonia, COVID-19, viral pneumonia, and healthy chest X-ray images. In the preprocessing step, perceptual adaptation of the image was applied to improve the quality of images. Their experiments indicated that the performance of the cascaded deep learning classifier was superior to other multi-label classifiers for COVID-19 and pneumonia in previous studies. Sixteen pre-trained networks were trained through transfer learning [83], including SqueezeNet, GoogLeNet, InceptionV3, DenseNet201, MobileNetV2, ResNet18, ResNet50, ResNet101, Xception, InceptionResNetV2, ShuffleNet, NasNetMobile, NasNetLarge, AlexNet, VGG16, and VGG19. In their experiments, CT images were used. Among these, 80% of the images were used for training and the rest for testing. The results showed that the DenseNet201 was the deepest, and it achieved the best performance in accuracy, sensitivity, and F1 score. Polat et al. [84] used TL to retrain three networks, including ResNet, DenseNet and VGG. And, the class activation mapping (CAM) method was applied to create the activation map that highlights key areas of the radiographs to improve causality and comprehensibility. The experimental results showed that the final model optimized by DenseNet161 structure had the best performance and achieved the classification accuracy of 97.10%. A distant domain transfer learning diagnosis method was proposed by Niu et al. [85], which consisted of two parts: the U-Net segmentation model and the distance feature fusion classification model. Distant domain transfer learning is a newly introduced transfer learning method that differs from the traditional TL method in that it mainly solves the negative transfer problem caused by the loose relationship between the source domain and the target domain [86]. The proposed algorithm achieved 96.00% classification accuracy, which was 13% higher classification accuracy than “non-transfer” algorithms, and 8% higher than existing transfer and distant transfer algorithms. Do [87] proposed a bundled transfer learning to detect COVID-19 cases from pneumonia and healthy patients. Features extracted from each pre-trained model were collected and used to train new layers. Ibrahim et al. [88] used the pre-trained AlexNet to classify X-rays and performed binary classification and multi-classification for COVID-19 pneumonia, non-COVID-19 viral pneumonia, bacterial pneumonia, and healthy patients. For X-rays for classifying COVID-19 pneumonia and non-COVID-19 pneumonia, the accuracy of the network was 99.62%, and the accuracy of the multi-classification was 93.42%. Dastider et al. [89] used the pre-trained ResNet152V2 as the backbone architecture of the ResCovNet. The dataset consisted of 7400 chest X-ray images, including COVID-19, viral pneumonia, bacterial pneumonia, mycoplasma pneumonia and healthy chest X-ray images. They used Otsu's thresholding to enhance the characteristics of the classification network on the preprocessing stage, and used ReLU function as the activation function and softmax function as the prediction function. Later, the model obtained 88.00% accuracy in multi-classification. Canayaz [90] proposed MH-COVIDNet, which applied four pre-trained networks (AlexNet, VGG19, GoogleNet, and ResNet) to complete feature extraction tasks. The binary particle swarm optimization algorithm and the binary gray wolf optimization were adopted to select the best potential features. The overall accuracy of this network was 99.38%.
Above all, these studies are only made available for classifying COVID-19 from other pneumonia patients or healthy cases, but cannot distinguish the stage of the COVID-19. Yu et al. [91] used the TL method to diagnose the stage of COVID-19 cases. Taking the advantages of pre-trained deep neural networks, InceptionV3, ResNet50, ResNet101, and DenseNet201 were exploited to extract the features from CT scans. A total of 729 2D axial plan slices with 246 severe cases and 483 non-severe cases were employed. Then, these features were fed to classifiers, and classifiers include linear discriminant, cubic SVM, linear SVM, K-NN, and Adaboost decision tree. The experimental results demonstrated that the DenseNet201 with cubic SVM achieved the best performance in COVID-19 severity screening. The DenseNet201 with cubic SVM achieved the highest severity classification accuracy of 95.20% and 95.34% for tenfold cross-validation and leave-one-out, respectively. The literature with transfer learning is as Table 5.

3.2 COVID-19 Diagnosis Based on Convolutional Neural Networks Training from Scratch
CNNs play an important role in clinical diagnosis. In the diagnosis of COVID-19, CNNs training from scratch have been favored by medical researchers. Wang et al. [92] introduced a new network—Covid-Net, which is an opening source for the general public. The Covid-Net combined lightweight projection-expansion-projection-extension with selective long-range connectivity. These methods enhanced representational ability while maintaining reduced calculation complexity. Leveraging a large number of long-range connections in densely connected deep neural networks would lead to increased computational complexity. Therefore, long-range connections were adopted in a sparing manner, and four convolution layers were leveraged as central hubs of long-connected much later layers in the network. Covid-Net was said to be the first open-source network design to detect COVID-19 from X-rays, which encouraged repeatability. Waheed et al. [93] designed CovidGAN to generate more images, which was based on an auxiliary classifier generative adversarial network (ACGAN). The ACGAN is as Fig. 4.
ACGAN used the class label c and noise z to each produced sample, and then the generator G leveraged them to produce

Figure 4: ACGAN architecture

Figure 5: CovidGAN structure map
CovidGAN utilized two loss functions, with binary-CrossEntropy in the first layer and sparse-categorical-CrossEntropy in the second layer. The dataset, 1124 chest X-ray images, were obtained from three publicly accessible datasets. The CovidGAN produced more composite images, which improved the classification accuracy to 95.00%. While without these composite images, the accuracy was only 85.00%. A novel CNN namely CoroDet, was proposed by Hussain et al. [94], which achieved 99.10% and 91.20% classification accuracy in the binary classification (COVID-19 and healthy chest images) and the multi-classification (COVID-19, non-COVID bacterial pneumonia, non-COVID viral pneumonia, and healthy chest images). They used a flatten layer that transforms the entire pooled feature map matrix into a single column. Moreover, three activation functions were used in their network, sigmoid function, ReLU function, and leaky ReLU function. Singh et al. [95] discussed the multi-objective differential evolution–based CNNs to classify COVID-19-infected patients from chest CT images. Their research designed a multi-objective fitness function as:
here,
here,
here,
where

3.3 COVID-19 Diagnosis Based on Ensemble Learning
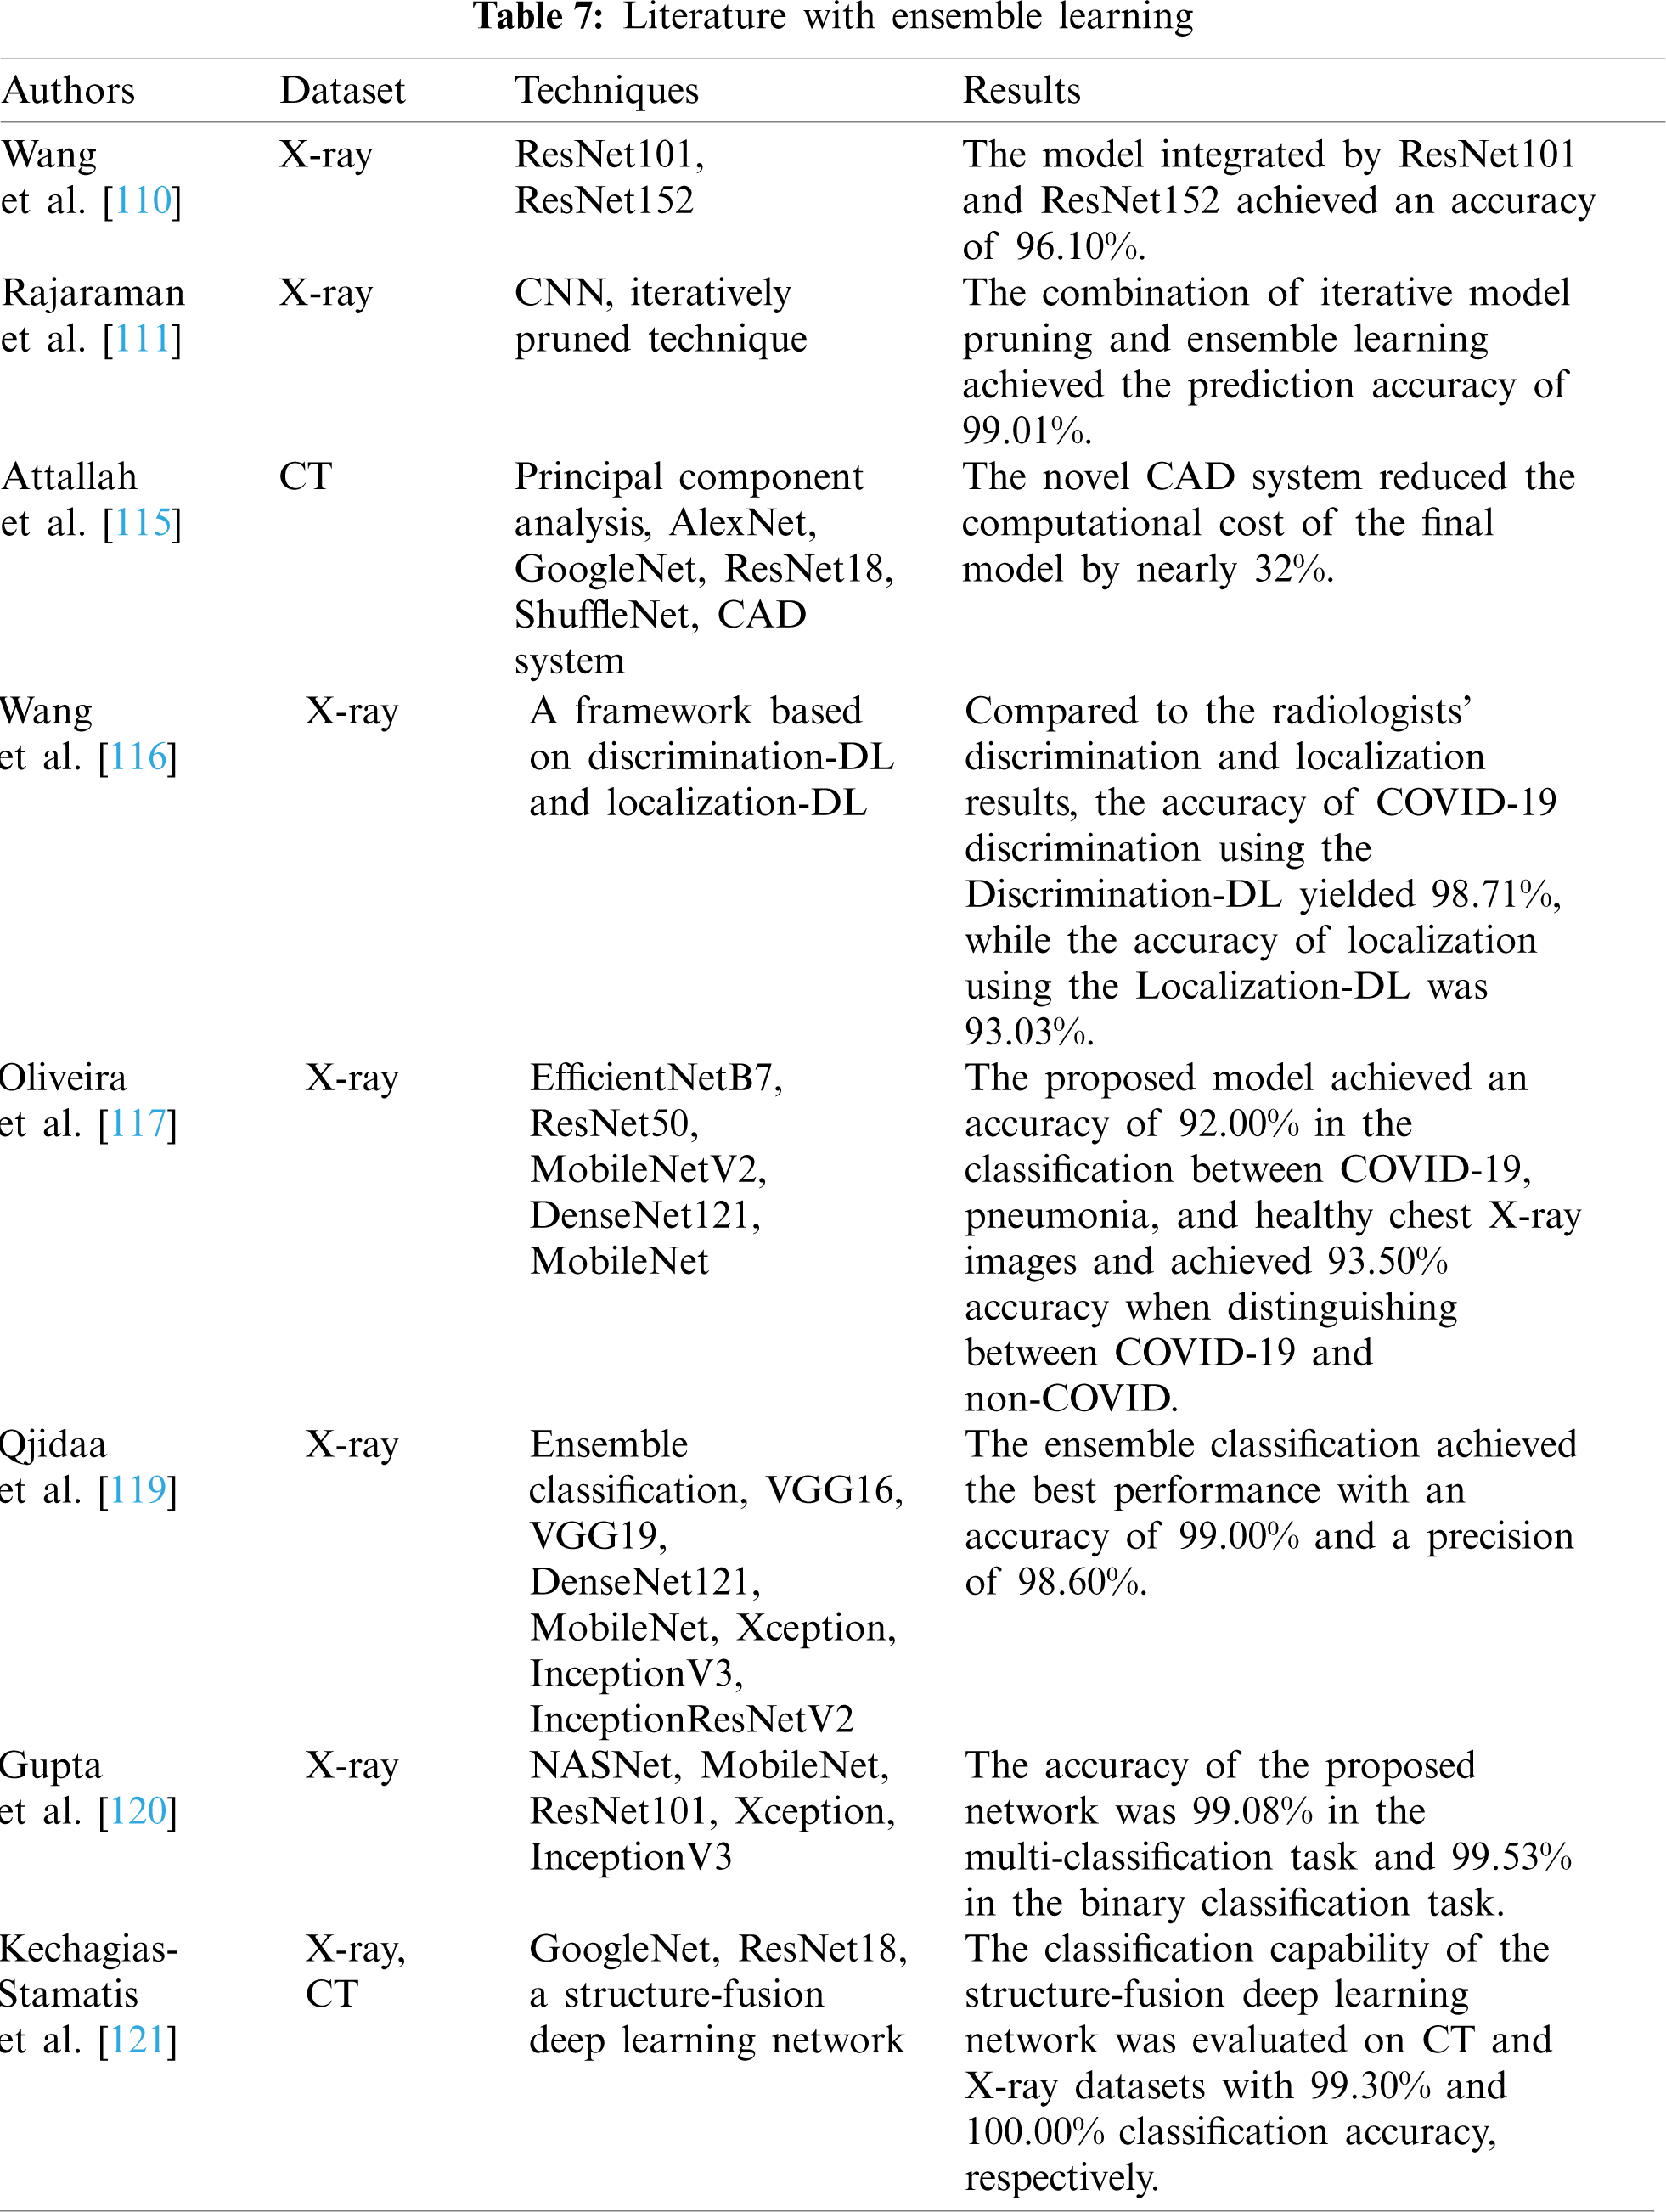
Since many deep learning models work well only under a common assumption: the training and testing data are drawn from the same feature space and the same distribution. When the distribution changes, most models need to be rebuilt from scratch via newly collected training data. However, in many practical applications, it is expensive or impossible to recollect the needed training data and rebuild the models [108]. So, ensemble learning (EL) is a significant technique for enhancing the model classification performance [109]. Wang et al. [110] used two pre-trained architectures for COVID-19 diagnosis via transfer learning and model integration. The two pre-trained architectures were ResNet101 and ResNet152. After training, the model achieved 96.1% classification accuracy on the testing dataset. Rajaraman et al. [111] obtained the optimal model by iteratively pruned method and combined the prediction results of the optimal pruning model through different ensemble strategies. Four datasets, PEDIATRIC X-ray dataset [112], RSNA X-rays dataset [113], TWITTER COVID-19 X-rays dataset, and MONTREAL COVID-19 X-rays dataset [114], were collected, and 90% of these images were used for training, and 10% of these images were used for testing. Through their experiments, it could be observed that the combination of iterative model pruning and ensemble learning could improve the prediction accuracy. Attallah et al. [115] proposed a novel CAD system based on the fusion of multiple CNNs for detecting COVID-19. The CAD system employed four types of CNNs, including AlexNet, GoogleNet, ResNet18, and ShuffleNet. First, they used the end-to-end classification. Then, depth features were extracted separately from each network, and principal component analysis was applied to each depth feature set extracted from each network. Afterward, a certain number of principal components were selected from each depth feature set for fusion. The results showed that the system could reduce the computational cost of the final model by nearly 32%. Wang et al. [116] proposed a CAD framework based on two deep learning models: the discrimination-DL and the localization-DL. The discrimination-DL used the feature pyramid network as the backbone to compute a convolutional feature map of the input images, and COVID-19 chest X-ray images would be recognized automatically. Due to the imbalanced dataset, they obtained the multi-focus function through the class imbalance focus loss function of binary classification to realize recognition, and the function was calculated as follows:
here, i is the class of X-ray, and
where x is a vector, and the individual
3.4 COVID-19 Diagnosis Based on Unsupervised Learning and Semi-Supervised Learning
The COVID-19 outbreak has placed tremendous pressure on radiologists to read these medical images. Medical practitioners are on the front lines of the epidemic, and studies of their mental health have shown that a significant number of medical practitioners show symptoms of depression, anxiety, and insomnia [122]. Although many models based on supervised learning achieved high classification accuracy, a large number of images with radiologist labels are necessarily needed in the process of training models. However, in such an outbreak situation, clinicians have very limited time to perform the tedious manual labels, which may lead to not adequate labeled images. Therefore, unsupervised learning and semi-supervised learning are becoming more and more popular, which do not need a large number of labeled images.
Li et al. [123] proposed a dual-track ranking method to train a model based on the self-supervised learning method. They extracted features from negative CT images and COVID-19 CT images and calculated the earth mover's distance between these two kinds of image features for making “difficulty” and “diversity” soft labels. Through the dual-track ranking method, they only used half of the negative samples for training, which reduced the training time and achieved superior classification performance. However, the method is only applicable to binary classification tasks, which is an area that needs to be improved in the future. Roy et al. [124] raised a novel network, which derived from spatial transformer networks [125] for the analysis of LUS images. They solved several limitations in some previous researches. First, they used a spatial transformer network to learn a semi-supervised learning localization policy and leveraged an ensemble of multiple state-of-the-art convolutional networks for image segmentation. Second, they predicted the presence of COVID-19 artifacts and a score connected to the disease severity via ordinal regression. The results showed that the spatial transformer network could improve positioning accuracy, and the segmentation network could segment the LUS images from the background with high accuracy. Wang et al. [126] put forward the DeCoVNet, which is a 3D deep convolutional neural network with semi-supervised learning. The 3D deep convolutional neural network architecture is as Fig. 6.

Figure 6: DeCoVNet architecture
The proposed network took a CT volume with its 3D lung mask as input and directly output the probabilities of COVID-positive and COVID-negative. First, CT volumes were generated by U-Net. In the first stage, rich local visual information was retained. And in the second stage, 3D feature maps were generated to generate feature maps via two 3D residual blocks. In the third stage, the information in the CT volume was extracted, and then the probability was output. The network was a weakly supervised learning network that only utilized small amounts of images with labels for training. Also, Hu et al. [127] proposed a new model with semi-supervised learning. A multi-view U-Net was used for lung segmentation, and the segmentation network could deduce the delineation of the lung anatomy of COVID-19, CAP, and nosocomial pneumonia. According to the infected areas between COVID-19 and CAP cases, they proposed a multi-scale learning scheme to cope with variations of size and location of the lesions and then applied a spatial aggregation with a global max pooling operation to obtain categorical scores. Their experiments utilized representational learning on multiple feature levels and explained which features can be learned at each level. Calderón Ramírez et al. [128] proposed a semi-supervised deep learning model based on Mix Match [129], in which they used labeled and unlabeled chest X-ray images. The labeled images observed
where w corresponds to the weights of the model to estimate,
3.5 COVID-19 Diagnosis Based on Graph Neural Networks
The data used in traditional machine learning is Euclidean data, and the most significant feature of Euclidean data is regular spatial structure. However, a large number of images are not following this rule, so that traditional deep learning is not available for this type of data. In recent years, graph neural networks have been used to solve this problem [133]. Its core is that each node is connected with its adjacent nodes [134], and the change of the node can cause the corresponding changes of the adjacent nodes [135]. For example, the risk of infection can be inferred using temporal and spatial information between people [136]. The GNNs include several types, such as graph convolutional network (GCN), graph attention network (GAT), graph autoencoder, graph generative network, and so on.

Wang et al. [137] proposed a framework, namely FGCNet, based on CNN and GCN. The CNN provided the individual image-level representation and the GCN produced the relation-aware representation. In addition, they used the Grad-CAM method to provide a visual explanation about the medical diagnosis and increase the reliability of the framework. Most of the hyperparameter values in their study were set by trial-and-error method. The stability factor was set as 10−5. The retention probability was set as 0.5. The pooling size was set to 2. The rank threshold was set to 2. The maximum shift factor was 25, the mean and variance of noise injection were set to 0 and 0.01, respectively. The number of conv layers and fully connected layers were set as 7 and 2, respectively. The number of cluster centroids was set to 256. The number of neighbors in KNN was set to 7. The framework was compared with state-of-the-art methods, and the results indicated that the framework outperformed other methods with high classification accuracy. Sehanobish et al. [138] proposed a baseline architecture that proved to be better than GAT and GCN. The architecture was composed of transformers and GAT layers, and it can produce new edges via unsupervised learning and self-supervised learning. Their experiments indicated the baseline architecture could provide an explanation about the genes and cells in all phases of the COVID-19 cases. Yu et al. [139] proposed a new model, namely ResGNet-C. In ResGNet-C, two by-products, named NNet-C and ResNet101-C, were also produced, which showed high classification accuracy in COVID-19 detection. ResNet101-C could extract more representative features for the rest two models NNet-C and ResGNet-C. NNet-C, a one-layer neural network, was a simple classifier that took features extracted by ResNet101-C as input. The ResGNet-C framework is as Fig. 7.

Figure 7: ResGNet-C framework
Fully connected (FC)-128 was a transitional layer that prevented significant information loss, which could otherwise happen when inputting the features directly into the final FC-2 layer. In the graph construction, they assumed an edge when a node falls into the first k nearest neighbors of another node, based on the Euclidean distance shown in Fig. 8. Instead of iteratively updating the nodes in the graph, they predefined the number of nodes based on the batch size N, while updating the edges about the adjacency matrix.

Figure 8: Graph construction
The model was evaluated on 296 CT scans, and the results showed that the ResGNet-C achieved a high classification accuracy of 96.62%. They also proposed a network, which was called CGNet [140]. The network consisted of three parts: feature extraction, graph-based feature reconstruction, and classification. They used the pre-trained CNNs for feature extraction and then used the extracted features for feature reconstruction. Finally, they used a single-layer graph neural network, GNet, as a classifier for classification, and the inputs were nodes in the graph and the graph representation. The proposed network was tested on a public CT dataset, and the results showed that the CGNet had a good classification performance and achieved a classification accuracy of 99.00%. Shaban et al. [141] proposed a hybrid diagnosis strategy, that is, to construct a connected graph of features to represent the weight of this feature and the degree of combination of this feature with other features. The approach could sort selected features by projecting them onto the proposed patient space and inferred predictions by the ranking of features and the degree of combination of this feature with neighborhoods. The hybrid diagnosis strategy consisted of five steps, including fuzzification, normalization, fuzzy rule induction, highly defuzzification, and inference decision making. Normalization was the multiplication of the output of the fuzzification step by the rank of the relevant features calculated in the characteristic rank stage as:
where
where

3.6 COVID-19 Diagnosis Based on Explainable Deep Neural Networks
Although deep learning networks have made great contributions to medical diagnosis, many networks are black boxes that do not provide credible information [142]. Therefore, explainable deep neural networks are more and more used by researchers. Explainable deep neural networks can provide explanations for the obtained results, and they have more credibility in clinical application.
Angelov et al. [143] proposed an explainable deep neural network for COVID-19 diagnosis. The proposed xDNN offers a new deep learning architecture that combines reasoning and learning in a synergy. It was non-iterative and non-parametric, which explained its efficiency in terms of time and computational resources. The network was composed of a features layer, a density layer, a typicality layer, a prototypes layer, and a mega clouds layer. In the first layer, they adopted the pre-trained VGG-VD-16DCNN as the backbone for feature extraction. And the core of the xDNN was the prototype layer because it could provide an explainable information. The xDNN performed better in classification and achieved a high classification accuracy. Karim et al. [144] proposed a novel model, DeepCOVIDExplainer. First, the Perona-Malik filter, histogram equalization, and unsharp were adopted to preprocess chest X-ray images. Then Grad-CAM and layer-wise relevance propagation were utilized to highlight the classification recognition regions. As a result of their experiments, the framework could recognize the COVID-19 cases with a positive predictive value of 89.61%. Brunese et al. [145] utilized the pre-trained VGG16 to build an explainable model. They provided reliability of model predictions via gradient weighted Grad-CAM algorithm. They collected 6523 chest X-ray images for training and testing, and their experiments showed that the model performed well in COVID-19 classification, and the average accuracy was equaled to 97.00%. Alshazly et al. [146] proposed a new model, CheXNet, which consisted of 121 layers. The dataset was composed of SARS-CoV-2 CT scans and COVID-19 CT scans. The model employed five pre-trained architectures based on transfer learning, which were SqueezeNet, Inception, ResNet, ResNeXt, Xception, ShuffleNet, and DenseNet. The explanation of CheXNet was reflected in t-distributed stochastic neighboring embedding and Grad-CAM, where they utilized t-distributed stochastic neighboring embedding to project two dimensions of the learned features and then presented the infected areas of COVID-19 cases. The CheXNet displayed the infected localization and provided a better explanation. Ahsan et al. [147] proposed a framework. The framework could accurately locate the infected area and provided an interpretable connection between inputs and prediction results by the local interpretable model-agnostic explanations. The results showed that the framework achieved an accuracy of 82.94% in CT scans and the accuracy of 93.94% in X-ray images. Panwar et al. [148] proposed an xDNN based on a VGG19. The use of Grad-CAM increased the visualization and explainability of the xDNN. In addition, two experiments were conducted with pneumonia vs. COVID-19, and COVID-19 vs. healthy cases. In all experiments, they used a color visualization method based on grayscale images to clearly interpret the detected radiological images. The proposed xDNN could detect COVID-19 positive cases within 2 s. 5G networks are on the rise, and 5G is well-known because of its fast features. Hossain et al. [149] proposed a model based on 5G network features, namely beyond 5G (B5G). The model could diagnose COVID-19 and predict the likelihood of infection in their social groups. The B5G architecture was divided into three layers, a stakeholder layer, an edge layer, and a cloud layer. The B5G achieved a faster diagnosis speed than the 4G network and made a contribution to medical diagnosis.
Since CT scan images are time-consuming for analysis, Wu et al. [150] proposed a Joint Classification and Segmentation system, which could be used for real-time and interpretable diagnosis. They increased the interpretability of the system by the activating mapping method and used image blending techniques to help the classifier focus on the lesion area in the COVID-19 cases to reduce the probability of overfitting. Their experimental results showed that the sensitivity of the Joint Classification and Segmentation system on the test set was 95.00%. Khincha et al. [151] proposed visual interpretation and textual interpretation. They used the COVIDx dataset to train and test. The learning rate used was 10−4 and the model was trained for 500 epochs. Their experimental results showed that text representation was more relevant to diagnosis. An explicable risk prediction system based on Additive Trees was built by Casiraghi et al. [152]. The system could support physicians in the early COVID-19 risk assessment through a set of simple and human-interpretable decision rules. Multiple imputation techniques, random forest-based techniques, and maximum likelihood estimation methods were applied to process and analyze the missing data in their experiments. The comparison results showed that the maximum likelihood estimation produced some noise estimation during processing, and the technique based on random forest yielded better performance. In addition, the prediction performance of the explicable risk prediction system was compared with that of the generalized linear model, and the results showed that the proposed system was effective and robust. Jin et al. [153] established an interpretable diagnosis system, which consisted of five parts, a segmentation network, a slice diagnosis network, a slice location network, a visualization network, and an image phenotypic analysis network. The last two networks were mainly utilized to provide an explicable region through Grad-CAM. The interpretable system provided effective help for doctors’ work, and the system was tested on two public datasets with AUC of 92.99% and 93.25%, respectively. Born et al. [154] used LUS to diagnose COVID-19 and collected 202 videos from different hospitals and medical facilities. They presented a VGG16-based model and used VGG-CAM to spatiotemporal localization of lung biomarkers. The model was tested on an independent dataset and achieved a sensitivity of 80.60% and a specificity of 96.20%. The literature with xDNNs is as Table 10.

In addition to the above methods, there are some models based on capsule networks or recurrent neural networks (RNNs), as well as new algorithms that are applied to optimize the existing networks. Recurrent neural networks are usually utilized to process time-series data to make predictions about what will happen in the future [155]. One of these structural functions is memory, linking contextual relationships [156]. So, by keeping an eye on the patient's progress, RNNs can predict the severity of the patient and make predictions about the future progress of the patient's disease, which allows doctors to better diagnose the diseases [157].
The capsule neural network is a kind of neural network that constructs and abstracts subgrids from the neural network. Each capsule focuses on several independent tasks while maintaining the spatial characteristics of the image. In addition, capsule neural networks can complete network training with very little training data, which is incomparable to the traditional neural network [158]. Toraman et al. [159] came up with a new model based on a capsule network. CNNs use scalar activation functions, while capsule networks use vector activation functions. The accuracy of the proposed model for binary class and multi-class was 97.24% and 84.22%, respectively. CNNs cannot capture the spatial relationship between image instances. However, capsule networks can capture the spatial relationship, and capsule networks require smaller datasets as well as fewer parameters. Heidarian et al. [41] proposed a novel framework that consisted of a 2D Capsule Network. This framework was initialized by a stack of four convolutional layers along with a batch-normalization and one max pooling layer. The last convolutional layer was then used to feed the subsequent Capsule Layers to extract deeper and smaller feature maps. Two more capsule layers were subsequently added to the framework, where the amplitude of the last one represents the probability of the input image belonging to each target class. In the next step, they aggregated slice-level features extracted by intermediate layers of the described network to move on to the patient-level domain. In their regard, the capsule layer before the last one was used as the representative feature map of the slices. Their framework could be applied for feature extraction of CT images, and it did not need complex image labeling processes. The proposed framework achieved a classification accuracy of 90.80%.
CNN typically performs better with larger datasets than with smaller ones; however, most datasets contain only a few COVID-19 samples, so to solve the dataset imbalance problem, Sakib et al. [160] proposed an adaptive data augmentation algorithm, being referred to as data augmentation of radiograph images. The algorithm worked by synthesizing many chest X-ray images from a generative adversarial network model, which used two competing neural networks to create new virtual data instances that could be transmitted as real data. The data enhancement method improved the classification accuracy of COVID-19 from 54.55% to 93.94%. Oh et al. [161] built a patch-based network with a relatively small number of trainable parameters for COVID-19 diagnosis and obtained the final classification result through voting of multiple patch positions on inference results. They designed a segmentation network based on FC-DenseNet103, to extract lung and heart contours from chest radiography images. The CrossEntropy loss was used as the objective function in semantic segmentation, and the calculation formula is as follows:
where
The generalized extreme value function is based on three extreme value distributions, when
where x is the input data,
Researchers have proposed many hyperparameter optimization algorithms because the selection of hyperparameters plays a crucial role in classification. For instance, Ezzat et al. [163] proposed an optimization algorithm called the gravitational search algorithm and built a new network was based on the DenseNet121 network. The gravitational search algorithm could determine the optimal hyperparameters for network architecture training. The results showed that their network achieved a classification accuracy of 98.38%. Ucar et al. [164] proposed COVIDiagnosis-Net. The COVIDiagnosis-Net was a SqueezeNet, which used fewer parameters and consumed less time in training, and it obtained an optimal hyperparameter by Bayesian optimization. The proposed network achieved a multi-classification accuracy of 98.30% and a binary classification of 100.00%.
Zhang et al. [165] replaced average and maximum pooling with random pooling, and the conv layer was combined with the batch normalization layer, and the leaky layer was combined with the full connection layer to get the full connection block. Their experimental results showed that random pooling had a better performance than average and maximum pooling, and their network achieved the classification accuracy of 93.64% in the COVID-19 and healthy chest X-ray images classification. A hybrid 2D and 3D network was proposed by Zhang et al. [166], and the name of the network was Dual spatial and channel Attention Bidirectional ConvLSTM Net. In addition, U-Net was applied to process in-plane context and LSTM was leveraged to integrate cross-plan context. Their network showed an excellent performance in the image segmentation and the AUC of the proposed network for disease progression prediction reached 93.00%. Javor et al. [167] developed a new deep learning method derived machine learning model with the same architecture and hyperparameters as the original model to identify the image sources, and the model evaluated a possible bias from recognition of the various images sources. The original model was ResNet50. The proposed model was tested on an independent dataset with an accuracy of 95.60%. Victor et al. [168] compared the performance between CNN and ResNet. The results showed that a good learning effect could be obtained by training ResNet from scratch without the aid of transfer learning. Amyar et al. [169] proposed an automatic COVID-19 classification and segmentation tool based on multi-task learning to identify COVID-19 lesion segments from the chest CT images. The proposed tool was evaluated using a dataset of 1369 patients. The results showed that the area under the receiver operating characteristic curve of classification was higher than 97.00%. Goel et al. [170] proposed a new architecture that was composed of optimized feature extraction and classification components. The Grey Wolf Optimizer algorithm was used to optimize the hyperparameters for training the CNN layers. The proposed model was tested and compared with different classification strategies utilizing an openly accessible dataset of COVID-19, pneumonia, and healthy chest images. The presented optimized CNN model provided accuracy, sensitivity, specificity, precision, and F1 score values of 97.78%, 97.75%, 96.25%, 92.88%, and 95.25%, respectively, which were better than those of state-of-the-art models. The literature with other optimizations is as Table 11.

In this paper, the diagnostic methods of COVID-19 are reviewed and summarized. Through the comparison of diagnostic methods, the following conclusions can be drawn. (i) Transfer learning and ensemble learning play an important role in medical diagnosis, which can achieve high classification accuracy on small datasets and save training time. Unsupervised learning is rarely used, and although it can save time in the process of labeling the dataset, the classification effect is not very good for COVID-19 diagnosis. (ii) It is also clear from the specific details that CT scans and X-ray images are the main datasets. In terms of data sets, many experiments are faced with the problem that it is difficult to collect data sets. This paper summarizes several open data sets, such as GitHub, CheXpert Dataset, and COVIDx Dataset, and so on, which are only used to protect privacy. For the problem of unbalanced data set, traditional data enhancement methods can be used to increase the number of data, such as rotation, translation, etc., new algorithms can be proposed to enhance the data set. (iii) In the aspect of image preprocessing, because the data may come from different medical institutions or machines, and the protocols used are different, so the image imaging methods are also different. After the image preprocessing, it will be conducive to the next step of feature extraction and can improve the classification effect. The feature extraction is mainly focused on texture analysis and intensity features, and the traditional classification method that is the most widely used is SVM. (iv) GNNs and xDNNs are becoming more and more popular. GNNs can analyze the population infection according to the relationship between nodes. Through GNN, it can effectively and timely find the transmission group of the epidemic and carry out quarantine and other measures. xDNNs can provide visual explanatory information for the classification results, while other networks are like a black box. Using xDNNs can improve the interpretation of the network. As for the comparison of seven deep learning methods, this paper summarizes the advantages and disadvantages, as shown in Table 12.

However, labeled COVID-19 images are difficult to capture, resulting in an unbalanced dataset that reduces the degree of generalization of the model. Thus, future research on COVID-19 diagnosis can focus on the following aspects. (i) Establishing suitable COVID-19 images benchmark databases, which can be consolidated, improved, and allowed to compare various techniques. (ii) The new technique is based on deep neural networks such as CNNs, RNNs, GNNs, and xDNNs, which have the potential to improve classification accuracy, and these are propellers to enhance diagnosis.
In general, this paper summarizes COVID-19 diagnostic methods, including traditional methods and seven deep learning methods, and proposes solutions to some problems encountered in their experiments. In addition, seven deep learning methods are represented in tables in this paper. The classification results realized in each experiment and the advantages and disadvantages of each method can be seen. In a word, this paper hopes to make contributions to the diagnosis of COVID-19.
Funding Statement: The paper is supported by Priority Academic Program Development of Jiangsu Higher Education Institutions (PAPD).
Conflicts of Interest: The authors declare that they have no conflicts of interest to report regarding the present study.
1. Chen, N., Zhou, M., Dong, X., Qu, J., Gong, F. et al. (2020). Epidemiological and clinical characteristics of 99 cases of 2019 novel coronavirus pneumonia in Wuhan, China: A descriptive study-scienceDirect. The Lancet, 395(10223), 507–513. DOI 10.1016/S0140-6736(20)30211-7. [Google Scholar] [CrossRef]
2. Lu, R., Zhao, X., Li, J., Niu, P., Tan, W. (2020). Genomic characterisation and epidemiology of 2019 novel coronavirus: Implications for virus origins and receptor binding. The Lancet, 395(10224), 565–574. DOI 10.1016/S0140-6736(20)30251-8. [Google Scholar] [CrossRef]
3. Li, Q., Guan, X. H., Wu, P., Wang, X. Y., Zhou, L. et al. (2020). Early transmission dynamics in Wuhan, China, of novel coronavirus-infected pneumonia. New England Journal of Medicine, 382(13), 1199–1207. DOI 10.1056/NEJMoa2001316. [Google Scholar] [CrossRef]
4. Li, R. Y., Pei, S., Chen, B., Song, Y. M., Zhang, T. et al. (2020). Substantial undocumented infection facilitates the rapid dissemination of novel coronavirus (SARS-CoV-2). Science, 368(6490), 489. DOI 10.1126/science.abb3221. [Google Scholar] [CrossRef]
5. Abdulaal, A., Patel, A., Charani, E., Denny, S., Alqahtani, S. A. et al. (2020). Comparison of deep learning with regression analysis in creating predictive models for SARS-CoV-2 outcomes. BMC Medical Informatics and Decision Making, 20(1), 11. DOI 10.1186/s12911-020-01316-6. [Google Scholar] [CrossRef]
6. Shah, S. G. S., Farrow, A. (2020). A commentary on “World health organization declares global emergency: A review of the 2019 novel coronavirus (COVID-19)” comment. International Journal of Surgery, 76, 128–129. DOI 10.1016/j.ijsu.2020.03.001. [Google Scholar] [CrossRef]
7. Erenler, A. K., Baydin, A. (2020). Challenges in COVID-19 diagnosis. Bratislava Medical Journal-Bratislavske Lekarske Listy, 121(12), 864–869. DOI 10.4149/BLL_2020_142. [Google Scholar] [CrossRef]
8. Rothan, H. A., Byrareddy, S. N. (2020). The epidemiology and pathogenesis of coronavirus disease (COVID-19) outbreak. Journal of Autoimmunity, 109, 4. DOI 10.1016/j.jaut.2020.102433. [Google Scholar] [CrossRef]
9. Xu, Z., Shi, L., Wang, Y. J., Zhang, J. Y., Huang, L. et al. (2020). Pathological findings of COVID-19 associated with acute respiratory distress syndrome. Lancet Respiratory Medicine, 8(4), 420–422. DOI 10.1016/S2213-2600(20)30076-X. [Google Scholar] [CrossRef]
10. Huang, C. L., Wang, Y. M., Li, X. W., Ren, L. L., Zhao, J. P. et al. (2020). Clinical features of patients infected with 2019 novel coronavirus in Wuhan, China. The Lancet, 395(10223), 497–506. DOI 10.1016/S0140-6736(20)30183-5. [Google Scholar] [CrossRef]
11. Wu, C. M., Chen, X. Y., Cai, Y. P., Xia, J. A., Zhou, X. et al. (2020). Risk factors associated with acute respiratory distress syndrome and death in patients with coronavirus disease 2019 pneumonia in Wuhan, China. Jama Internal Medicine, 180(7), 934–943. DOI 10.1001/jamainternmed.2020.0994. [Google Scholar] [CrossRef]
12. Dong, Y., Mo, X., Hu, Y., Qi, X., Jiang, F. et al. (2020). Epidemiology of COVID-19 among children in China. Pediatrics, 145(6), e20200702. [Google Scholar]
13. Corman, V. M., Landt, O., Kaiser, M., Molenkamp, R., Meijer, A. et al. (2020). Detection of 2019 novel coronavirus (2019-nCoV) by real-time RT-PCR. Eurosurveillance, 25(3), 23–30. DOI 10.2807/1560-7917.ES.2020.25.3.2000045. [Google Scholar] [CrossRef]
14. Wang, D. W., Hu, B., Hu, C., Zhu, F. F., Liu, X. et al. (2020). Clinical characteristics of 138 hospitalized patients with 2019 novel coronavirus-infected pneumonia in Wuhan, China. JAMA-Journal of the American Medical Association, 323(11), 1061–1069. DOI 10.1001/jama.2020.1585. [Google Scholar] [CrossRef]
15. Alsharif, W., Qurashi, A. (2020). Effectiveness of COVID-19 diagnosis and management tools: A review. Radiography (London, England : 1995), 27(2), 682–687. DOI 10.1016/j.radi.2020.09.010. [Google Scholar] [CrossRef]
16. Ai, T., Yang, Z. L., Hou, H. Y., Zhan, C. N., Chen, C. et al. (2020). Correlation of chest CT and RT-pCR testing for coronavirus disease 2019 (COVID-19) in China: A report of 1014 cases. Radiology, 296(2), 32–40. DOI 10.1148/radiol.2020200642. [Google Scholar] [CrossRef]
17. He, X., Lau, E., Wu, P., Deng, X., Wang, J. et al. (2020). Temporal dynamics in viral shedding and transmissibility of COVID-19. Nature Medicine, 26(5), 762–765. DOI 10.1101/2020.03.15.20036707. [Google Scholar] [CrossRef]
18. Yang, Y., Yang, M., Shen, C., Wang, F., Yuan, J. et al. (2020). Laboratory diagnosis and monitoring the viral shedding of 2019-nCoV infections. The Innovation, 1(3). [Google Scholar]
19. Teichgraber, U., Malouhi, A., Ingwersen, M., Neumann, R., Reljic, M. et al. (2021). Ruling out COVID-19 by chest CT at emergency admission when prevalence is low: The prospective, observational SCOUT study. Respiratory Research, 22(1), 11. DOI 10.1186/s12931-020-01611-w. [Google Scholar] [CrossRef]
20. Polsinelli, M., Cinque, L., Placidi, G. (2020). A light CNN for detecting COVID-19 from CT scans of the chest. Pattern Recognition Letters, 140, 95–100. DOI 10.1016/j.patrec.2020.10.001. [Google Scholar] [CrossRef]
21. Ghimire, A., Thapa, S., Jha, A. K., Kumar, A., Adhikari, S. (2020). AI and IoT solutions for tackling COVID-19 pandemic. IEEE International Conference on Electronics, Communication and Aerospace Technology. Coimbatore, India. [Google Scholar]
22. Chan, H. P., Hadjiiski, L. M., Samala, R. K. (2020). Computer-aided diagnosis in the era of deep learning. Medical Physics, 47(5), 218–227. DOI 10.1002/mp.13764. [Google Scholar] [CrossRef]
23. Seonwoo Min, B. L., Sungroh, Y. (2017). Deep learning in bioinformatics. Briefings in Bioinformatics, 18(5), 851–869. DOI 10.1093/bib/bbw068. [Google Scholar] [CrossRef]
24. Larranaga, P., Calvo, B., Santana, R., Bielza, C., Galdiano, J. et al. (2006). Machine learning in bioinformatics. Briefings in Bioinformatics, 7(1), 86–112. DOI 10.1093/bib/bbk007. [Google Scholar] [CrossRef]
25. Liu, H. H., Ren, H., Wu, Z. B., Xu, H., Zhang, S. H. et al. (2021). CT radiomics facilitates more accurate diagnosis of COVID-19 pneumonia: Compared with CO-RADS. Journal of Translational Medicine, 19(1), 12. DOI 10.1186/s12967-020-02692-3. [Google Scholar] [CrossRef]
26. Herath, K., Karunasena, G. M. K. B., Ariyathunge, S., Priyankara, H. D. N. S., Nimanthi, U. D. C. (2021). Deep learning approach to recognition of novel COVID-19 using CT scans and digital image processing. 4th SLAAI-International Conference on Artificial Intelligence. The Open University of Sri Lanka. [Google Scholar]
27. Hani, C., Trieu, N. H., Saab, I., Dangeard, S., Bennani, S. et al. (2020). COVID-19 pneumonia: A review of typical CT findings and differential diagnosis. Diagnostic and Interventional Imaging, 101(5), 263–268. DOI 10.1016/j.diii.2020.03.014. [Google Scholar] [CrossRef]
28. Gezer, N. S., Ergan, B., Baris, M. M., Appak, O., Sayiner, A. A. et al. (2020). COVID-19 S: A new proposal for diagnosis and structured reporting of COVID-19 on computed tomography imaging. Diagnostic and Interventional Radiology, 26(4), 315–322. DOI 10.5152/dir.2020.20351. [Google Scholar] [CrossRef]
29. Bridge, J., Meng, Y., Zhao, Y., Du, Y., Zhao, M. et al. (2020). Introducing the GEV activation function for highly unbalanced data to develop COVID-19 diagnostic models. Journal of Biomedical and Health Informatics, 24(10), 2776–2786. DOI 10.1109/JBHI.6221020. [Google Scholar] [CrossRef]
30. Horry, M. J., Chakraborty, S., Paul, M., Ulhaq, A., Pradhan, B. et al. (2020). COVID-19 detection through transfer learning using multimodal imaging data. IEEE Access, 8, 149808–149824. DOI 10.1109/Access.6287639. [Google Scholar] [CrossRef]
31. Mohammadi, R., Salehi, M., Ghaffari, H., Rohani, S. A., Reiazi, R. (2020). Transfer learning-based automatic detection of coronavirus disease 2019 (COVID-19) from chest X-ray images. Biomedical Physics and Engineering, 10(5), 559–568. DOI 10.31661/jbpe. [Google Scholar] [CrossRef]
32. Poggiali, E. (2020). Can lung US help critical care clinicians in the early diagnosis of novel coronavirus (COVID-19) pneumonia. Radiology, 295(3), 715–721. DOI 10.1148/radiol.2020200847. [Google Scholar] [CrossRef]
33. Carrer, L., Donini, E., Marinelli, D., Zanetti, M., Mento, F. et al. (2020). Automatic pleural line extraction and COVID-19 scoring from lung ultrasound data. IEEE Transactions on Ultrasonics Ferroelectrics and Frequency Control, 67(11), 2207–2217. DOI 10.1109/TUFFC.58. [Google Scholar] [CrossRef]
34. Soldati, G., Smargiassi, A., Inchingolo, R., Buonsenso, D., Perrone, T. et al. (2020). Proposal for international standardization of the use of lung ultrasound for patients with COVID-19: A simple, quantitative, reproducible method. Journal of Ultrasound in Medicine, 39(7), 1413–1419. DOI 10.1002/jum.15285. [Google Scholar] [CrossRef]
35. Wang, D., Mo, J., Zhou, G., Xu, L., Liu, Y. (2020). An efficient mixture of deep and machine learning models for COVID-19 diagnosis in chest X-ray images. PLoS One, 15(11), 1–15. DOI 10.1371/journal.pone.0242535. [Google Scholar] [CrossRef]
36. Loey, M., Manogaran, G., Khalifa, N. E. M. (2020). A deep transfer learning model with classical data augmentation and CGAN to detect COVID-19 from chest CT radiography digital images. Neural Computing and Applications, 32, 1–13. DOI 10.20944/preprints202004.0252.v3. [Google Scholar] [CrossRef]
37. Ozturk, S., Ozkaya, U., Barstugan, M. (2020). Classification of coronavirus (COVID-19) from X-ray and CT images using shrunken features. International Journal of Imaging Systems and Technology, 31, 5–15. DOI 10.1002/ima.22469. [Google Scholar] [CrossRef]
38. Wang, Z., Liu, Q., Dou, Q. (2020). Contrastive cross-site learning with redesigned Net for COVID-19 CT classification. IEEE Journal of Biomedical and Health Informatics, 24(10), 2806–2813. DOI 10.1109/JBHI.6221020. [Google Scholar] [CrossRef]
39. Ouyang, X., Huo, J., Xia, L., Shan, F., Liu, J. et al. (2020). Dual-sampling attention network for diagnosis of COVID-19 from community acquired pneumonia. IEEE Transactions on Medical Imaging, 39(8), 2595–2605. DOI 10.1109/TMI.42. [Google Scholar] [CrossRef]
40. Heidari, M., Mirniaharikandehei, S., Khuzani, A. Z., Danala, G., Qiu, Y. C. et al. (2020). Improving the performance of CNN to predict the likelihood of COVID-19 using chest X-ray images with preprocessing algorithms. International Journal of Medical Informatics, 144, 9. DOI 10.1016/j.ijmedinf.2020.104284. [Google Scholar] [CrossRef]
41. Heidarian, S., Afshar, P., Mohammadi, A., Moezedin Javad, R., Oikonomou, A. et al. (2020). CT-Caps: Feature extraction-based automated framework for COVID-19 disease identification from chest CT scans using capsule networks. IEEE International Conference on Acoustics, Speech and Signal Processing, Toronto, ON, Canada. [Google Scholar]
42. Togacar, M., Ergen, B., Comert, Z. (2020). COVID-19 detection using deep learning models to exploit social mimic optimization and structured chest X-ray images using fuzzy color and stacking approaches. Computers in Biology and Medicine, 121, 103805. DOI 10.1016/j.compbiomed.2020.103805. [Google Scholar] [CrossRef]
43. Zhou, L., Li, Z., Zhou, J., Li, H., Chen, Y. et al. (2020). A rapid, accurate and machine-agnostic segmentation and quantification method for CT-based COVID-19 diagnosis. IEEE Transactions on Medical Imaging, 39(8), 2638–2652. DOI 10.1109/TMI.42. [Google Scholar] [CrossRef]
44. Rajpal, S., Rajpal, A., Lakhyani, N., Kumar, N. (2020). COV-Elm classifier: An extreme learning machine based identification of COVID-19 using chest X-ray images. arXiv:2007.08637. [Google Scholar]
45. Bai, H. X., Hsieh, B., Xiong, Z., Halsey, K., Liao, W. H. (2020). Performance of radiologists in differentiating COVID-19 from viral pneumonia on chest CT. Radiology, 296(2), 200823. DOI 10.1148/radiol.2020200823. [Google Scholar] [CrossRef]
46. Ilango, G., Marudhachalam, R. (2011). New hybrid filtering techniques for removal of Gaussian noise from medical images. Journal of Engineering and Applied Sciences, 6(2), 15–18. DOI 10.5120/4571-6732. [Google Scholar] [CrossRef]
47. Zargari, A., Heidari, M., Shariati, A. (2020). COVID-Classifier: An efficient machine learning model to assist in the diagnosis of COVID-19 infection in chest X-ray images. Scientific Reports. [Google Scholar]
48. Ismael, A. M., Sengur, A. (2020). The investigation of multiresolution approaches for chest X-ray image based COVID-19 detection. Health Information Science and Systems, 8(1), 29. DOI 10.1007/s13755-020-00116-6. [Google Scholar] [CrossRef]
49. Hussain, L., Nguyen, T., Li, H., Abbasi, A. A., Lone, K. J. et al. (2020). Machine-learning classification of texture features of portable chest X-ray accurately classifies COVID-19 lung infection. BioMedical Engineering OnLine, 19(1), 88. DOI 10.1186/s12938-020-00831-x. [Google Scholar] [CrossRef]
50. Tabrizchi, H., Mosavi, A., Szabo-Gali, A., László, N. (2020). Rapid COVID-19 diagnosis using deep learning of the computerized tomography scans. IEEE 3rd International Conference and Workshop in Óbuda on Electrical and Power Engineering, Budapest, Hungary. [Google Scholar]
51. Turkoglu, M. (2021). COVIDetectionet: COVID-19 diagnosis system based on X-ray images using features selected from pre-learned deep features ensemble. Applied Intelligence, 51, 1213–1226. DOI 10.1007/s10489-020-01888-w. [Google Scholar] [CrossRef]
52. Arslan, H. (2021). A new COVID-19 detection method from human genome sequences using CpG island features and KNN classifier. Engineering Science and Technology, an International Journal, 24, 839–847. DOI 10.1016/j.jestch.2020.12.026. [Google Scholar] [CrossRef]
53. Yasar, H., Ceylan, M. (2021). A novel comparative study for detection of COVID-19 on CT lung images using texture analysis, machine learning, and deep learning methods. Multimedia Tools and Applications, 80, 5423–5447. DOI 10.1007/s11042-020-09894-3. [Google Scholar] [CrossRef]
54. Xu, M., Ouyang, L., Han, L., Sun, K., Yu, T. T. et al. (2021). Accurately differentiating between patients with COVID-19, patients with other viral infections, and healthy individuals: Multimodal late fusion learning approach. Journal of Medical Internet Research, 23(1), 17. DOI 10.2196/25535. [Google Scholar] [CrossRef]
55. Mohammed, M. A., Abdulkareem, K. H., Garcia-Zapirain, B., Mostafa, S. A., Maashi, M. S. et al. (2021). A comprehensive investigation of machine learning feature extraction and classification methods for automated diagnosis of COVID-19 based on X-ray images. Computers, Materials & Continua, 66(3), 3289–3310. DOI 10.32604/cmc.2021.012874. [Google Scholar] [CrossRef]
56. Abraham, B., Nair, M. S. (2020). Computer-aided detection of COVID-19 from X-ray images using multi-cNN and bayesnet classifier. Biocybernetics and Biomedical Engineering, 40(4), 1436–1445. DOI 10.1016/j.bbe.2020.08.005. [Google Scholar] [CrossRef]
57. Pokkuluri, K. S., Sssn, U. D. N. (2020). A novel cellular automata classifier for COVID-19 prediction. Journal of Health Sciences, 10, 1–5. DOI 10.17532/jhsci.2020.907. [Google Scholar] [CrossRef]
58. Albadr, M. A. A., Tiun, S., Ayob, M., Al-Dhief, F. T., Omar, K. et al. (2020). Optimised genetic algorithm-extreme learning machine approach for automatic COVID-19 detection. PLoS One, 15(12), 28. DOI 10.1371/journal.pone.0242899. [Google Scholar] [CrossRef]
59. El-Kenawy, E. S. M., Ibrahim, A., Mirjalili, S., Eid, M. M., Hussein, S. E. (2020). Novel feature selection and voting classifier algorithms for COVID-19 classification in CT images. IEEE Access, 8, 179317–179335. DOI 10.1109/Access.6287639. [Google Scholar] [CrossRef]
60. Ahmed, S., Hossain, T., Hoque, O., Sarker, S., Rahman, S. et al. (2020). Automated COVID-19 detection from chest X-ray images: A high resolution network (HRNet) approach. SN Computer Science. [Google Scholar]
61. Jin, J. S., Wang, Y. (2000). An adaptive nonlinear diffusion algorithm for filtering medical images. IEEE Transactions on Information Technology in Biomedicine a Publication of the IEEE Engineering in Medicine and Biology Society, 4(4), 298. DOI 10.1109/4233.897062. [Google Scholar] [CrossRef]
62. Shankar, K., Perumal, E. (2020). A novel hand-crafted with deep learning features based fusion model for COVID-19 diagnosis and classification using chest X-ray images. Complex and Intelligent Systems, 7(3), 1277–1293. DOI 10.1007/s40747-020-00216-6. [Google Scholar] [CrossRef]
63. Elaziz, M. A., Ewees, A. A., Yousri, D., Alwerfali, H. S. N., Al-Qaness, M. A. A. (2020). An improved marine predators algorithm with fuzzy entropy for multi-level thresholding: Real world example of COVID-19 CT image segmentation. IEEE Access, 8, 125306–125330. DOI 10.1109/Access.6287639. [Google Scholar] [CrossRef]
64. Tiwari, M., Tiwari, T., Jose, J., Roy, A., Gautam, N. (2020). Marine predators algorithm based segmentation of COVID-19 images. International Journal of Future Generation Communication and Networking, 13, 1574–1581. [Google Scholar]
65. El-bana, S., Al-Kabbany, A., Sharkas, M. (2020). A multi-task pipeline with specialized streams for classification and segmentation of infection manifestations in COVID-19 scans. PeerJ Computer Science, 6, 303. DOI 10.7717/peerj-cs.303. [Google Scholar] [CrossRef]
66. Wang, G., Liu, X., Li, C., Xu, Z., Zhang, S. (2020). A noise-robust framework for automatic segmentation of COVID-19 pneumonia lesions from CT images. IEEE Transactions on Medical Imaging, 39(8), 2653–2663. DOI 10.1109/TMI.2020.3000314. [Google Scholar] [CrossRef]
67. Albahli, S., Albattah, W. (2020). Deep transfer learning for COVID-19 prediction: Case study for limited data problems. Current Medical Imaging Formerly Current Medical Imaging Reviews, 16, 1–9. DOI 10.2174/1573405616666201123120417. [Google Scholar] [CrossRef]
68. Viroonluecha, P., Borisut, T., Santa, J. (2020). COVID19 X-ray image classification using voting ensemble CNNs transfer learning. 15th International Joint Symposium on Artificial Intelligence and Natural Language Processing, Bangkok. [Google Scholar]
69. Rahimzadeh, M., Attar, A. (2021). Introduction of a new dataset and method for detecting and counting the pistachios based on deep learning. Iran Journal of Computer Science. DOI 10.1007/s42044-021-00090-6. [Google Scholar] [CrossRef]
70. Ardakani, A. A., Kanafi, A. R., Acharya, U. R., Khadem, N., Mohammadi, A. (2020). Application of deep learning technique to manage COVID-19 in routine clinical practice using CT images: Results of 10 convolutional neural networks. Computers in Biology and Medicine, 121, 103795. DOI 10.1016/j.compbiomed.2020.103795. [Google Scholar] [CrossRef]
71. Chowdhury, M. E. H., Rahman, T., Khandakar, A., Mazhar, R., Kadir, M. A. et al. (2020). Can AI help in screening viral and COVID-19 pneumonia? IEEE Access, 8, 132665–132676. DOI 10.1109/Access.6287639. [Google Scholar] [CrossRef]
72. Narin, A. K. C., Pamuk, Z. (2020). Automatic detection of coronavirus disease (COVID-19) using X-ray images and deep convolutional neural networks. Pattern Analysis and Applications, 24(3), 1207–1220. DOI 10.1007/s10044-021-00984-y. [Google Scholar] [CrossRef]
73. Ismael, A. M., Sengur, A. (2021). Deep learning approaches for COVID-19 detection based on chest X-ray images. Expert Systems with Applications, 164, 114054. DOI 10.1016/j.eswa.2020.114054. [Google Scholar] [CrossRef]
74. Murugan, R., Goel, T. (2021). E-DiCoNet: Extreme learning machine based classifier for diagnosis of COVID-19 using deep convolutional network. Journal of Ambient Intelligence and Humanized Computing, 12, 8887–8898. DOI 10.1007/s12652-020-02688-3. [Google Scholar] [CrossRef]
75. Marques, G., Agarwal, D., de la Torre Díez, I. (2020). Automated medical diagnosis of COVID-19 through efficientNet convolutional neural network. Applied Soft Computing, 96, 106691. DOI 10.1016/j.asoc.2020.106691. [Google Scholar] [CrossRef]
76. Tan, M., Le, Q. V. (2020). Efficientnet: Rethinking model scaling for convolutional neural networks. arXiv e-prints. [Google Scholar]
77. Tammina, S. (2020). CovidSORT: detection of novel COVID-19 in chest X-ray images by leveraging deep transfer learning models. Springer 2020–International Conference on Data Science, Machine Learning and Applications (ICDSMLA). Pune, Maharashtra, India. [Google Scholar]
78. Sun, L., Mo, Z., Yan, F., Xia, L., Shan, F. et al. (2020). Adaptive feature selection guided deep forest for COVID-19 classification with chest CT. IEEE Journal of Biomedical and Health Informatics, 24(10), 2798–2805. DOI 10.1109/JBHI.6221020. [Google Scholar] [CrossRef]
79. Shan, F., Gao, Y., Wang, J., Shi, W., Shi, N. et al. (2020). Lung infection quantification of COVID-19 in CT images with deep learning. arXiv:2003.04655. [Google Scholar]
80. Do, C. M., Lan, V. (2020). Application of deep learning model (DeepCOVID-19) for detecting COVID-19 cases using chest X-ray images. Applications of Machine Learning 2020. USA: SPIE. [Google Scholar]
81. Chaudhary, P. K., Pachori, R. B. (2020). Automatic diagnosis of COVID-19 and pneumonia using FBD method. 2020 IEEE International Conference on Bioinformatics and Biomedicine (BIBM). Seoul, Korea (South). [Google Scholar]
82. Karar, M. E., Hemdan, E. E. D., Shouman, M. A. (2020). Cascaded deep learning classifiers for computer-aided diagnosis of COVID-19 and pneumonia diseases in X-ray scans. Complex and Intelligent Systems, 7(1), 235–247. DOI 10.1007/s40747-020-00199-4. [Google Scholar] [CrossRef]
83. Pham, T. (2020). A comprehensive study on classification of COVID-19 on computed tomography with pretrained convolutional neural networks. Scientific Reports, 10(1), 16942. DOI 10.36227/techrxiv.12340421. [Google Scholar] [CrossRef]
84. Polat, C., Karaman, O., Karaman, C., Korkmaz, G., Balci, M. C. et al. (2021). COVID-19 diagnosis from chest X-ray images using transfer learning: Enhanced performance by debiasing dataloader. Journal of X-ray Science and Technology, 29(1), 19–36. DOI 10.3233/xst-200757. [Google Scholar] [CrossRef]
85. Niu, S., Liu, M., Liu, Y., Wang, J., Song, H. (2021). Distant domain transfer learning for medical imaging. IEEE Journal of Biomedical and Health Informatics. DOI 10.1109/jbhi.2021.3051470. [Google Scholar] [CrossRef]
86. Tan, B., Song, Y., Zhong, E., Yang, Q. (2015). Transitive transfer learning. 21st ACM SIGKDD Conference on Knowledge Discovery and Data Mining (KDDpp. 1155–1164. [Google Scholar]
87. Do, C. M. (2020). Very large multimodal multi-architecture convolutional neural network with bundled transfer learning for automated coronavirus diagnosis. SPIE Security and Defence. USA: SPIE. [Google Scholar]
88. Ibrahim, A. U., Ozsoz, M., Serte, S., Al-Turjman, F., Yakoi, P. S. (2021). Pneumonia classification using deep learning from chest X-ray images during COVID-19. Cognitive Computation, 13. DOI 10.1007/s12559-020-09787-5. [Google Scholar] [CrossRef]
89. Dastider, A. G., Subah, M. R., Sadik, F., Mahmud, T., Fattah, S. A. (2020). Rescovnet: A deep learning-based architecture for COVID-19 detection from chest CT scan images. TENCON 2020–2020 IEEE Region 10 Conference (TENCON). Osaka, Japan. [Google Scholar]
90. Canayaz, M. (2021). MH-Covidnet: Diagnosis of COVID-19 using deep neural networks and meta-heuristic-based feature selection on X-ray images. Biomedical Signal Processing and Control, 64, 102257–102257. DOI 10.1016/j.bspc.2020.102257. [Google Scholar] [CrossRef]
91. Yu, Z., Li, X., Sun, H., Wang, J., Zhao, T. et al. (2020). Rapid identification of COVID-19 severity in CT scans through classification of deep features. BioMedical Engineering OnLine, 19(1), 63. DOI 10.1186/s12938-020-00807-x. [Google Scholar] [CrossRef]
92. Wang, L., Lin, Z. Q., Wong, A. (2020). COVID-Net: A tailored deep convolutional neural network design for detection of COVID-19 cases from chest X-ray images. Scientific Reports, 10(1), 19549. DOI 10.1038/s41598-020-76550-z. [Google Scholar] [CrossRef]
93. Waheed, A., Goyal, M., Gupta, D., Khanna, A., Al-Turjman, F. et al. (2020). CovidGAN: Data augmentation using auxiliary classifier GAN for improved COVID-19 detection. IEEE Access, 8, 91916–91923. DOI 10.1109/Access.6287639. [Google Scholar] [CrossRef]
94. Hussain, E., Hasan, M., Rahman, M. A., Lee, I., Tamanna, T. et al. (2020). Corodet: A deep learning based classification for COVID-19 detection using chest X-ray images. Chaos Solitons Fractals, 110495. DOI 10.1016/j.chaos.2020.110495. [Google Scholar] [CrossRef]
95. Singh, D., Kumar, V., Vaishali, Kaur, M. (2020). Classification of COVID-19 patients from chest CT images using multi-objective differential evolution-based convolutional neural networks. European Journal of Clinical Microbiology & Infectious Diseases, 39(7), 1379–1389. DOI 10.1007/s10096-020-03901-z. [Google Scholar] [CrossRef]
96. Mahmud, T., Rahman, M. A., Fattah, S. A. (2020). CovXNet: A multi-dilation convolutional neural network for automatic COVID-19 and other pneumonia detection from chest X-ray images with transferable multi-receptive feature optimization. Computers in Biology and Medicine, 122, 103869. DOI 10.1016/j.compbiomed.2020.103869. [Google Scholar] [CrossRef]
97. Selvaraju, R. R., Cogswell, M., Das, A., Vedantam, R., Parikh, D. et al. (2020). Grad-cAM: Visual explanations from deep networks via gradient-based localization. International Journal of Computer Vision, 128(2), 336–359. DOI 10.1007/s11263-019-01228-7. [Google Scholar] [CrossRef]
98. Abbas, A., Abdelsamea, M. M., Gaber, M. M. (2021). Classification of COVID-19 in chest X-ray images using deTraC deep convolutional neural network. Applied Intelligence, 51(2), 854–864. DOI 10.1007/s10489-020-01829-7. [Google Scholar] [CrossRef]
99. Ahmed, S., Yap, M. H., Tan, M., Hasan, M. (2020). Reconet: Multi-level preprocessing of chest X-rays for COVID-19 detection using convolutional neural networks. medrxiv. [Google Scholar]
100. Karthik, R., Menaka, R., H, M. (2021). Learning distinctive filters for COVID-19 detection from chest X-ray using shuffled residual CNN. Applied Soft Computing, 99, 106744. DOI 10.1016/j.asoc.2020.106744. [Google Scholar] [CrossRef]
101. Siddhartha, M., Santra, A. (2020). COVIDLite: A depth-wise separable deep neural network with white balance and CLAHE for detection of COVID-19. arXiv e-prints. [Google Scholar]
102. Chollet, F. (2017). Xception: deep learning with depthwise separable convolutions. 2017 IEEE Conference on Computer Vision and Pattern Recognition (CVPR). Honolulu, HI, USA. [Google Scholar]
103. Keles, A., Keles, M. B., Keles, A. (2021). COV19-CNNet and COV19-resNet: Diagnostic inference engines for early detection of COVID-19. Cognitive Computation, 1–11. DOI 10.1007/s12559-020-09795-5. [Google Scholar] [CrossRef]
104. Aslan, M. F., Unlersen, M. F., Sabanci, K., Durdu, A. (2021). CNN-Based transfer learning-biLSTM network: A novel approach for COVID-19 infection detection. Applied Soft Computing, 98, 12. DOI 10.1016/j.asoc.2020.106912. [Google Scholar] [CrossRef]
105. Pustokhin, D. A., Pustokhina, I. V., Dinh, P. N., Phan, S. V., Nguyen, G. N. et al. (2020). An effective deep residual network based class attention layer with bidirectional LSTM for diagnosis and classification of COVID-19. Journal of Applied Statistics, 1–18. DOI 10.1080/02664763.2020.1849057. [Google Scholar] [CrossRef]
106. Nour, M., Comert, Z., Polat, K. (2020). A novel medical diagnosis model for COVID-19 infection detection based on deep features and Bayesian optimization. Applied Soft Computing, 97, 1–13. DOI 10.1016/j.asoc.2020.106580. [Google Scholar] [CrossRef]
107. Singh, R. K., Pandey, R., Babu, R. N. (2020). COVIDScreen: Explainable deep learning framework for differential diagnosis of COVID-19 using chest X-rays. Neural Computing and Applications, 22. DOI 10.1007/s00521-020-05636-6. [Google Scholar] [CrossRef]
108. Pan, S. J., Yang, Q. (2010). A survey on transfer learning. IEEE Transactions on Knowledge and Data Engineering, 22(10), 1345–1359. DOI 10.1109/TKDE.2009.191. [Google Scholar] [CrossRef]
109. Zhang, C., Ma, Y. (2012). Ensemble machine learning. USA: Springer Nature. [Google Scholar]
110. Wang, N., Liu, H., Xu, C. (2020). Deep learning for the detection of COVID-19 using transfer learning and model integration. 2020 IEEE 10th International Conference on Electronics Information and Emergency Communication (ICEIEC). Beijing, China. [Google Scholar]
111. Rajaraman, S., Siegelman, J., Alderson, P. O., Folio, L. S., Folio, L. R. et al. (2020). Iteratively pruned deep learning ensembles for COVID-19 detection in chest X-rays. IEEE Access, 8, 115041–115050. DOI 10.1109/Access.6287639. [Google Scholar] [CrossRef]
112. Kermany, D., Goldbaum, M., Cai, W., Valentim, C., Liang, H. Y. et al. (2018). Identifying medical diagnoses and treatable diseases by image-based deep learning. Cell, 172, 1122–1131. DOI 10.1016/j.cell.2018.02.010. [Google Scholar] [CrossRef]
113. Shih, G., Wu, C., Halabi, S., Kohli, M., Prevedello, L. et al. (2019). Augmenting the national institutes of health chest radiograph dataset with expert annotations of possible pneumonia. Radiology: Artificial Intelligence, 1, e180041. DOI 10.1148/ryai.2019180041. [Google Scholar] [CrossRef]
114. Cohen, J. P., Morrison, P., Dao, L. (2020). COVID-19 image data collection. arXiv e-prints. [Google Scholar]
115. Attallah, O., Ragab, D. A., Sharkas, M. (2020). Multi-Deep: A novel CAD system for coronavirus (COVID-19) diagnosis from CT images using multiple convolution neural networks. PeerJ, 8, 10086. DOI 10.7717/peerj.10086. [Google Scholar] [CrossRef]
116. Wang, Z., Xiao, Y., Li, Y., Zhang, J., Lu, F. et al. (2021). Automatically discriminating and localizing COVID-19 from community-acquired pneumonia on chest X-rays. Pattern Recognit, 110, 107613. DOI 10.1016/j.patcog.2020.107613. [Google Scholar] [CrossRef]
117. Oliveira, G., Padilha, R., Dorte, A., Cereda, L., Miyazaki, L. et al. (2020). COVID-19 X-ray image diagnostic with deep neural networks. Brazilian Symposium on Bioinformatics, 12558, 57–68. DOI 10.1007/978-3-030-65775-8_6. [Google Scholar] [CrossRef]
118. Kabir, N. C. M. R. M. (2020). PDCOVIDNet: A parallel-dilated convolutional neural network architecture for detecting COVID-19 from chest X-ray images. Health Information Science and Systems, 8(1), 27. DOI 10.1007/s13755-020-00119-3. [Google Scholar] [CrossRef]
119. Qjidaa, M., Mechbal, Y., Ben-Fares, A., Amakdouf, H., Qjidaa, H. (2020). Early detection of COVID19 by deep learning transfer model for populations in isolated rural areas. 2020 International Conference on Intelligent Systems and Computer Vision (ISCV). Fez, Morocco. [Google Scholar]
120. Gupta, A., Anjum, G. S., Katarya, R. (2021). Instacovnet-19: A deep learning classification model for the detection of COVID-19 patients using chest X-ray. Applied Soft Computing, 99, 106859–106859. DOI 10.1016/j.asoc.2020.106859. [Google Scholar] [CrossRef]
121. Kechagias-Stamatis, O., Aouf, N., Koukos, J. (2020). Deep learning fusion for COVID-19 diagnosis. DOI 10.1101/2020.12.11.20246546. [Google Scholar] [CrossRef]
122. Lai, J. B., Ma, S. M., Wang, Y., Cai, Z. X., Hu, J. B. et al. (2020). Factors associated with mental health outcomes among health care workers exposed to coronavirus disease 2019. Jama Network Open, 3(3), 12. DOI 10.1001/jamanetworkopen.2020.3976. [Google Scholar] [CrossRef]
123. Li, Y., Wei, D., Chen, J., Cao, S., Zhou, H. et al. (2020). Efficient and effective training of COVID-19 classification networks with self-supervised dual-track learning to rank. IEEE Journal of Biomedical and Health Informatics, 24(10), 2787–2797. DOI 10.1109/JBHI.2020.3018181. [Google Scholar] [CrossRef]
124. Roy, S., Menapace, W., Oei, S., Luijten, B., Fini, E. et al. (2020). Deep learning for classification and localization of COVID-19 markers in point-of-care lung ultrasound. IEEE Transactions on Medical Imaging, 39(8), 2676–2687. DOI 10.1109/TMI.2020.2994459. [Google Scholar] [CrossRef]
125. Jaderberg, M., Simonyan, K., Zisserman, A., Kavukcuoglu, K. (2015). Spatial transformer networks. https://proceedings.neurips.cc//paper/2015/file/33ceb07bf4eeb3da587e268d663aba1a-Paper.pdf [Google Scholar]
126. Wang, X., Deng, X., Fu, Q., Zhou, Q., Feng, J. et al. (2020). A weakly-supervised framework for COVID-19 classification and lesion localization from chest CT. IEEE Transactions on Medical Imaging, 39(8), 2615–2625. DOI 10.1109/tmi.2020.2995965. [Google Scholar] [CrossRef]
127. Hu, S., Gao, Y., Niu, Z., Jiang, Y., Li, L. et al. (2020). Weakly supervised deep learning for COVID-19 infection detection and classification from CT images. IEEE Access, 8, 118869–118883. DOI 10.1109/access.2020.3005510. [Google Scholar] [CrossRef]
128. Ramírez, C., Giri, S., Moemeni, R., Umaña, A., Elizondo, M. et al. (2020). Dealing with scarce labelled data: semi-supervised deep learning with Mix match for covid-19 detection using chest X-ray images. International Conference on Pattern Recognition, Italy. [Google Scholar]
129. David Berthelot, N. C., Goodfellow, I., Papernot, N., Oliver, A., Raffel, C. (2019). Mixmatch: a holistic approach to semi-supervised learning. 33rd Conference on Neural Information Processing Systems (NeurIPS). [Google Scholar]
130. King, B., Barve, S., Ford, A., Jha, R. (2020). Unsupervised clustering of COVID-19 chest X-ray images with a self-organizing feature Map. 2020 IEEE 63rd International Midwest Symposium on Circuits and Systems (MWSCAS). Springfield, MA, USA. [Google Scholar]
131. Fang, M. J., He, B. X., Li, L., Dong, D., Yang, X. et al. (2020). CT radiomics can help screen the coronavirus disease 2019 (COVID-19A preliminary study. Science China-Information Sciences, 63(7), 8. DOI 10.1007/s11432-020-2849-3. [Google Scholar] [CrossRef]
132. Abdel-Basset, M., Chang, V., Hawash, H., Chakrabortty, R. K., Ryan, M. (2021). FSS-2019-nCov: A deep learning architecture for semi-supervised few-shot segmentation of COVID-19 infection. Knowledge-Based Systems, 212, 14. DOI 10.1016/j.knosys.2020.106647. [Google Scholar] [CrossRef]
133. Hsieh, K. L., Wang, Y., Chen, L., Zhao, Z., Savitz, S. et al. (2020). Drug repurposing for COVID-19 using graph neural network with genetic, mechanistic, and epidemiological validation. Research Square. DOI 10.21203/rs.3.rs-114758/v1. [Google Scholar] [CrossRef]
134. Wu, Z., Pan, S., Chen, F., Long, G., Zhang, C. et al. (2021). A comprehensive survey on graph neural networks. IEEE Transactions on Neural Networks and Learning Systems, 32(1), 4–24. DOI 10.1109/TNNLS.5962385. [Google Scholar] [CrossRef]
135. Gao, Z., Fu, G., Ouyang, C., Tsutsui, S., Liu, X. et al. (2019). Edge2vec: Representation learning using edge semantics for biomedical knowledge discovery. BMC Bioinformatics, 20, 306. DOI 10.1186/s12859-019-2914-2. [Google Scholar] [CrossRef]
136. Kapoor, A., Ben, X., Liu, L., Perozzi, B., Barnes, M. et al. (2020). Examining COVID-19 forecasting using spatio-temporal graph neural networks. arXiv:2007.03113. [Google Scholar]
137. Wang, S. H., VarthananGovindaraj, V., Górriz, J. M., Zhang, X., Zhang, Y. D. (2020). COVID-19 classification by FGCNet with deep feature fusion from graph convolutional network and convolutional neural network. Information Fusion, 67, 208–229. DOI 10.1016/j.inffus.2020.10.004. [Google Scholar] [CrossRef]
138. Sehanobish, A., Ravindra, N., Dijk, D. (2020). Gaining insight into SARS-CoV-2 infection and COVID-19 severity using self-supervised edge features and graph neural networks. https://www.aaai.org/AAAI21Papers/AAAI-2377.SehanobishA.pdf. [Google Scholar]
139. Yu, X., Lu, S., Guo, L., Wang, S., Zhang, Y. D. (2020). Resgnet-C: A graph convolutional neural network for detection of COVID-19. Neurocomputing, 452, 592–605. DOI 10.1016/j.neucom.2020.07.144. [Google Scholar] [CrossRef]
140. Yu, X., Wang, S. H., Zhang, Y. D. (2021). CGNet: A graph-knowledge embedded convolutional neural network for detection of pneumonia. Information Processing and Management, 58(1), 102411. DOI 10.1016/j.ipm.2020.102411. [Google Scholar] [CrossRef]
141. Shaban, W. M., Rabie, A. H., Saleh, A. I., Abo-Elsoud, M. A. (2021). Detecting COVID-19 patients based on fuzzy inference engine and deep neural network. Applied Soft Computing, 99, 106906–106906. DOI 10.1016/j.asoc.2020.106906. [Google Scholar] [CrossRef]
142. Chen, C. H. (2020). ExpDNN: Explainable deep neural network. arXiv:2005.03461. [Google Scholar]
143. Angelov, P. P., Soares, E. A. (2020). Towards explainable deep neural networks (xDNN). Neural Networks, 130, 185–194. DOI 10.1016/j.neunet.2020.07.010. [Google Scholar] [CrossRef]
144. Karim, M. R., Dhmen, T., Rebholz-Schuhmann, D., Decker, S., Beyan, O. (2020). DeepCOVIDExplainer: Explainable COVID-19 predictions based on chest X-ray images. https://saira.eco/open-access-covid-19/uploads/2004-04582-compressed-5ec6d5d41339f2.86983306.pdf. [Google Scholar]
145. Brunese, L., Mercaldo, F., Reginelli, A., Santone, A. (2020). ExeepCOVIDExplainer: Explainable COVIonary disease and coronavirus COVID-19 detection from X-rays. Computer Methods and Programs in Biomedicine, 196, 105608. DOI 10.1016/j.cmpb.2020.105608. [Google Scholar] [CrossRef]
146. Alshazly, H., Linse, C., Barth, E., Martinetz, T. (2020). Explainable COVID-19 detection using chest CT scans and deep learning. Sensors, 21(2), 455. DOI 10.3390/s21020455. [Google Scholar] [CrossRef]
147. Ahsan, M. M., Gupta, K. D., Islam, M. M., Sen, S., Hossain, M. S. (2020). COVID-19 symptoms detection based on nasNetMobile with explainable AI using various imaging modalities. Machine Learning and Knowledge Extraction, 2, 490–504. DOI 10.3390/make2040027. [Google Scholar] [CrossRef]
148. Panwar, H., Gupta, P., Siddiqui, M. K., Morales-Menendez, R., Singh, V. (2020). A deep learning and grad-cAM based color visualization approach for fast detection of COVID-19 cases using chest X-ray and CT-scan images. Chaos Solitons and Fractals, 140, 110190. DOI 10.1016/j.chaos.2020.110190. [Google Scholar] [CrossRef]
149. Hossain, M. S., Muhammad, G., Guizani, N. (2020). Explainable AI and mass surveillance system-based healthcare framework to combat COVID-19 like pandemics. IEEE Network, 34(3), 126–132. DOI 10.1109/MNET.011.2000458. [Google Scholar] [CrossRef]
150. Wu, Y. H., Gao, S., Mei, J., Xu, J., Fan, D. P. et al. (2020). JCS: An explainable COVID-19 diagnosis system by joint classification and segmentation. IEEE Transactions on Image Processing, 30, 3113–3126. DOI 10.1109/TIP.83. [Google Scholar] [CrossRef]
151. Khincha, R., Krishnan, S., Guru-Murthy, K., Dash, T., Vig, L. et al. (2020). Constructing and evaluating an explainable model for COVID-19 diagnosis from chest X-rays. arXiv:2012.10787. [Google Scholar]
152. Casiraghi, E., Malchiodi, D., Trucco, G., Frasca, M., Cappelletti, L. et al. (2020). Explainable machine learning for early assessment of COVID-19 risk prediction in emergency departments. IEEE Access, 8, 196299–196325. DOI 10.1109/Access.6287639. [Google Scholar] [CrossRef]
153. Jin, C., Chen, W., Cao, Y., Xu, Z., Tan, Z. et al. (2020). Development and evaluation of an artificial intelligence system for COVID-19 diagnosis. Nature Communications, 11(1), 5088. DOI 10.1038/s41467-020-18685-1. [Google Scholar] [CrossRef]
154. Born, J., Wiedemann, N., Cossio, M., Buhre, C., Borgwardt, K. (2021). Accelerating detection of lung pathologies with explainable ultrasound image analysis. Applied Sciences, 11(2), 672. DOI 10.3390/app11020672. [Google Scholar] [CrossRef]
155. Zhou, X., Li, Y., Liang, W. (2020). CNN-RNN based intelligent recommendation for online medical Pre-diagnosis support. IEEE/ACM Transactions on Computational Biology and Bioinformatics, 18(3), 912–921. DOI 10.1109/TCBB.8857. [Google Scholar] [CrossRef]
156. Jaeger, H. (2002). Tutorial on training recurrent neural networks, covering BPPT, RTRL, EKF and the echo state network approach. GMD-Forschungszentrum Informationstechnik, 2002, 5. [Google Scholar]
157. Li, Z., Zheng, Y., Xin, J., Zhou, G. (2020). A recurrent neural network and differential equation based spatiotemporal infectious disease model with application to COVID-19. arXiv:2007.10929. [Google Scholar]
158. Han, F., Yang, J., Liu, Y., Zhao, H. (2010). Research on preprocessing algorithm for PET-cT image registration. International Conference on Optoelectronics and Image Processing, pp. 266–269. Haikou, China. [Google Scholar]
159. Toraman, S., Alaku, T. B., Türkolu, B. (2020). Convolutional capsNet: A novel artificial neural network approach to detect COVID-19 disease from X-ray images using capsule networks. Chaos Solitons and Fractals, 140, 110122. DOI 10.1016/j.chaos.2020.110122. [Google Scholar] [CrossRef]
160. Sakib, S., Tazrin, T., Fouda, M. M., Fadlullah, Z. M., Guizani, M. (2020). DL-Crc: Deep learning-based chest radiograph classification for COVID-19 detection: A novel approach. IEEE Access, 8, 171575–171589. DOI 10.1109/Access.6287639. [Google Scholar] [CrossRef]
161. Oh, Y., Park, S., Ye, J. C. (2020). Deep learning COVID-19 features on CXR using limited training data sets. IEEE Transactions on Medical Imaging, 39(8), 2688–2700. DOI 10.1109/TMI.42. [Google Scholar] [CrossRef]
162. Rasheed, J., Hameed, A. A., Djeddi, C., Jamil, A., Al-Turjman, F. (2021). A machine learning-based framework for diagnosis of COVID-19 from chest X-ray images. Interdisciplinary Sciences-Computational Life Sciences, 13(1), 103–117. DOI 10.1007/s12539-020-00403-6. [Google Scholar] [CrossRef]
163. Ezzat, D., Hassanien, A. E., Aboul-Ella, H. (2020). An optimized deep learning architecture for the diagnosis of COVID-19 disease based on gravitational search optimization. Applied Soft Computing, 98, 106742. DOI 10.1016/j.asoc.2020.106742. [Google Scholar] [CrossRef]
164. Ucar, F., Korkmaz, D. (2020). COVIDiagnosis-net: Deep Bayes-squeezeNet based diagnosis of the coronavirus disease 2019 (COVID-19) from X-ray images. Medical Hypotheses, 140, 109761. DOI 10.1016/j.mehy.2020.109761. [Google Scholar] [CrossRef]
165. Zhang, Y. D., Satapathy, S. C., Liu, S., Li, G. R. (2021). A five-layer deep convolutional neural network with stochastic pooling for chest CT-based COVID-19 diagnosis. Machine Vision and Applications, 32(1), 1–13. DOI 10.1007/s00138-020-01119-9. [Google Scholar] [CrossRef]
166. Zhang, X. Y., Yu, Z., Han, X., Zhao, B., Zhuo, Y. et al. (2020). DABC-Net for robust pneumonia segmentation and prediction of COVID-19 progression on chest CT scans. Research Square. DOI 10.21203/rs.3.rs-114267/v1. [Google Scholar] [CrossRef]
167. Javor, D., Kaplan, H., Kaplan, A., Puchner, S. B., Krestan, C. et al. (2020). Deep learning analysis provides accurate COVID-19 diagnosis on chest computed tomography. European Journal of Radiology, 133, 6. DOI 10.1016/j.ejrad.2020.109402. [Google Scholar] [CrossRef]
168. Victor, U., Dong, X., Li, X., Obiomon, P., Qian, L. (2020). Effective COVID-19 screening using chest radiography images via deep learning. 2020 Fourth International Conference on Multimedia Computing, Networking and Applications (MCNA). Valencia, Spain. [Google Scholar]
169. Amyar, A., Modzelewski, R., Li, H., Ruan, S. (2020). Multi-task deep learning based CT imaging analysis for COVID-19 pneumonia: Classification and segmentation. Computers in Biology and Medicine, 126, 104037. DOI 10.1016/j.compbiomed.2020.104037. [Google Scholar] [CrossRef]
170. Goel, T., Murugan, R., Mirjalili, S., Chakrabartty, D. K. (2020). Optconet: An optimized convolutional neural network for an automatic diagnosis of COVID-19. Applied Intelligence, 51, 1–16. DOI 10.1007/s10489-020-01904-z. [Google Scholar] [CrossRef]
 | This work is licensed under a Creative Commons Attribution 4.0 International License, which permits unrestricted use, distribution, and reproduction in any medium, provided the original work is properly cited. |