| Computer Modeling in Engineering & Sciences |
DOI: 10.32604/cmes.2022.015636
ARTICLE
A Novel Indoor Positioning Framework
Department of Electronic Engineering, National Kaohsiung University of Science and Technology (First Campus), Kaohsiung City, 82445, Taiwan
*Corresponding Author: Yin-Ting Cheng. Email: i107109118@nkust.edu.tw
Received: 01 January 2021; Accepted: 08 October 2021
Abstract: Current positioning systems are primarily based on the Global Positioning System (GPS). Although the GPS is accurate within 10 m, it is mainly used for outdoor positioning services (Location-Based Service; LBS). However, since satellite signals cannot penetrate buildings, indoor positioning has always been a blind spot for satellite signals. As indoor positioning applications are extensive with high commercial values, they have created a competitive niche in the market. Existing indoor positioning technologies are unable to achieve less than 10 cm accuracy except for the Ultra Wide Band (UWB) technology. On the other hand, the Bluetooth protocol achieves an accuracy of 1 to 2 m. In this work, we use Bluetooth wireless signals to build a novel indoor positioning framework to avoid the high manufacturing costs involved in the UWB technology. The Bluetooth signals are combined with the results from artificial intelligence algorithms to improve accuracy. During laboratory indoor location tracking, the accuracy rate is 96%, which provides effective indoor tracking for the movement of people.
Keywords: Indoor positioning; Bluetooth protocol; artificial intelligence
Currently, indoor positioning is not as widely used in daily life as outdoor positioning, and fewer service types are provided. However, if accurate indoor positioning services can be provided, outdoor positioning services can be extended indoors. At the same time, if indoor positioning technology can be combined with other technologies such as physiological information acquisition technology, then home medical care or home lifestyle identification can be performed to achieve the goal of ubiquitous care. For example, indoor positioning technology can determine a patient’s location, such as in the living room, bedroom or bathroom. By combining indoor positioning technology with physiological information, the patient’s behavior, such as watching TV on the sofa, going to bed in the bedroom, or staying in the bathroom for overly long, can be speculated. The patient’s behavior can determine whether there is a possibility of an accident and provide appropriate assistance.
Furthermore, indoor positioning systems can provide the location of an automatically classified product to manufacturers to determine whether the product is classified correctly. Employees’ current locations can also be provided to managers through indoor positioning services to determine whether or not the employees have entered restricted areas and violated safety regulations. Other services such as indoor environment monitoring, indoor disaster protection, rescue management [1,2], can all be accomplished with the advancement of indoor positioning technology.
Since indoor environments may be quite complicated, indoor positioning systems may encounter difficulties that affect the accuracy, such as the attenuation of signal strength due to different obstructions, signal drift or positioning algorithm design. In this work, the strength of the Bluetooth wireless signal is used to calculate the person’s location. To obtain a person’s position accurately and rapidly, the system needs to overcome interference signal sources in the environment, such as the electromagnetic interferences generated by metal and electronic products, which attenuates the signal strength and reduces positioning accuracy.
This work uses artificial intelligence to build a novel indoor positioning framework and achieve accurate personnel positioning in a complex indoor environment. The proposed model is used to process the signals and complete the establishment of the algorithm.
There are many different positioning methods for positioning systems. For wireless signal positioning, multiple fixed communication receiving points are set up to communicate with the measured object, and the relative distance is calculated. Many approaches have been proposed to calculate the relative distance as well as the accuracy and computational complexity. Several papers have proposed different methods of indoor personnel positioning.
In 2013, Tsuboi et al. [3] proposed the Ultra-High Frequency Radio Frequency Identification (UHF RFID) based personnel positioning system with a path tracking function. The authors proposed that the RFID method accurately and quickly calculates the personnel’s position and records the personnel’s historical position through the database. The author installed several passive RFID tags on the ceiling of the experimental environment to form an RFID tag array. The subject holds a handheld reader. When the subject moves, the reader reads the RFID tag and sends the tag number to the database to record the historical path and location. This method has very low complexity in positioning calculations and implements localization quickly and accurately. However, it requires a large number of RFID tag installations.
In 2015, Schafermeyer et al. [4] proposed a method that uses simple wall-mounted radio frequency transceiver and IR sensors capable of fingerprint identifications for individual identification. The method achieved a classification accuracy of 98% when using a Gaussian mixture model for classification. In the same year, Ma et al. [5] proposed a method to identify personnel entering or leaving a building. The method used Wi-Fi signals and combined the One-Class SVM and Binary-Class SVM classifiers.
In 2016, Kim et al. [6] proposed a personnel location algorithm based on the wireless signal strength received by a mobile phone. The authors used the K-Nearest Neighbor classification (KNN) machine-learning algorithm to establish a positioning model. The KNN model was used to group the positions of people according to the strength of the received signal. The positioning error of this system was 0.33 to 8.67 m, and the accuracy varied significantly in environments with many interferences.
In 2017, Alkandari et al. [7] proposed a method to estimate the speed between two fixed points based on device-free passive localization (DfPL) [8]. The authors proposed using one access point and onemonitoring point to detect DfPL and estimate the personnel’s indoor position. In the same year, Oguntala et al. [9] proposed using the received signal strength of passive RFID to measure the distance for personnel localization. The system used particle filters to analyze RSS to localize the target position in an indoor environment.
In 2018, Cui et al. [10] proposed a ZigBee-based personnel positioning system. The authors proposed a Zigbee railway tunnel employee positioning system to enable tunnel managers to grasp the exact location of the tunnel personnel in real-time, achieve appropriate deployment and effective command of employees, as well as improve management and emergency command capabilities. The authors set up four Zigbee fixed nodes in the tunnel and used the K-means machine learning method to establish a model. When the fixed node receives the signal sent by the mobile node worn by the personnel, the signal strength calculated based on the received signal is input into the model to calculate the current location of the personnel. The method used machine learning to establish a model with an accuracy of 95% when the personnel’s error is within 2 m.
Al-Khaleefa et al. [11] proposed the maximum feature adaptive online sequential extreme learning machine (MFA-OSELM) in 2019 to process the cyclic dynamic factors due to a person’s movements in an internal environment. In the same year, Xue et al. [12] proposed a WiFi-based localization model by modifying the large localization errors and enhancing the Gaussian process regression (MEGPR). The model increased the effectiveness and feasibility of accurate indoor positioning. However, it required a multitude of access points to provide Wi-Fi signals, thus increasing the implementation cost.
Nowadays, artificial intelligence is widely used in various systems. This study uses TensorFlow as the framework to build the neural network and uses three different neural network architectures to build a fall detection model. As the neural network strives to find the optimal weight value and deviation, the obtained values will be closer to the desired result when the input data passes through the function in the framework.
An activation function is added after the hidden layer of the neural network to determine the desired result and calculate the optimal effect for building a predictive fall detection model. Advantages and disadvantages comparisons of the multi-layer perceptron (MLP) and recurrent neural network (RNN) models are shown in Table 1.
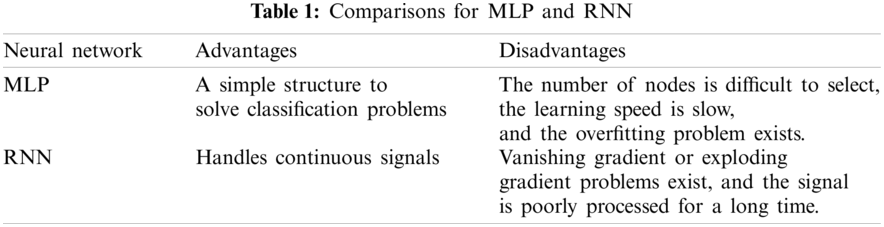
2.1 Multi-Layer Perceptron (MLP)
The MLP is a kind of feedforward neural network. It has a three-layered structure: an input layer, a hidden layer and an output layer. The input layer is the current material to be learned. The hidden layer is the feature node that needs to be learned, and each node is a neuron with a nonlinear activation function so that its output meets the required results. The output layer is the category that needs to be learned. Each layer is a fully-connected layer in the middle. The multi-layer perceptron was widely used in the 1980s in problems such as speech recognition, image recognition, machine translation and has achieved good results in classification problems.
2.2 Recurrent Neural Network (RNN)
Early neural network architectures have no time concept and no label learning for sequence signals. In 1982, Hopfield [13] proposed a Hopfield neural network with 2n states, where the value of each neuron is either 1 or 0, and the output is a four-bit binary number. There are 16 network states in total due to the network’s recursive characteristics. If the network is stable, it converges from any initial state to a stable state; otherwise, it does not diverge because each neuron has only two states.
Jordan [14] proposed a structure in 1986 where the learning method includes labeling the sequence signal, and the output provides feedback to hidden nodes, as shown in the figure. First, the network multiplies the input and the weight values of a neural network and adds on the deviation value of the node. Then, the value that has been calculated once and the output values are recalculated.
Since the RNN is modeled by serial signals, it achieves better results if the signals are correlated before and after. Therefore, it is often applied to natural language, handwriting recognition, weather, or sensor values.
However, as the network’s hidden layer becomes deeper and deeper, the gradient vanishing or gradient exploding problem may occur, making it difficult to use in situations where the signal time is long.
The activation function in neural networks mainly uses nonlinear equations to solve nonlinear problems. Without activation functions, the neural network is a linear combination of operations. Since both the hidden and the output layers are input results of the upper layer, they are calculated with the weight value and the deviation. The calculation result is regarded as the layer’s output so that the output and the input have only a linear relationship. The learned model cannot solve nonlinear problems without using a nonlinear activation function. In this work, we have provided four different activation functions when learning the framework. Activation functions with good outcomes are selected through experiments to establish a fall detection model.
2.3.1 Rectified Linear Unit (ReLU)
According to Eq. (1), the output is 0 when the value is negative, and the output remains unchanged when the value is positive, as shown in Fig. 1. The result is easy to predict since the algorithm is linear. Due to the rapid convergence, the algorithm effectively solves the gradient vanishing and gradient exploding problems with a fast calculation speed. However, it is difficult to activate a particular neuron when it has a value of 0, and the node has no effective results on the data.
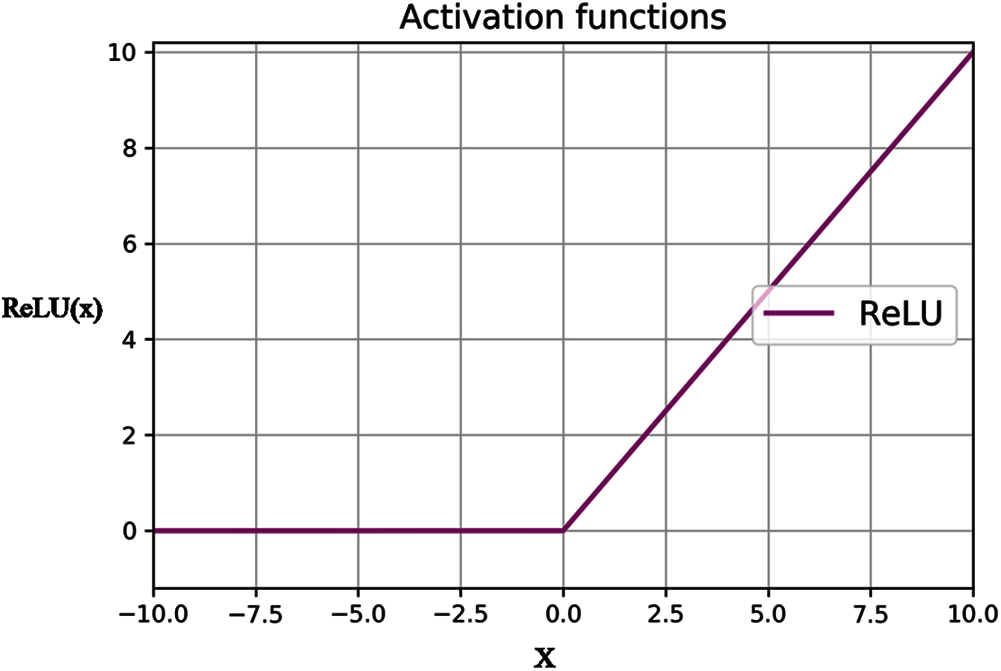
Figure 1: Using ReLU as the activation function
2.3.2 Exponential Linear Unit (ELU)
According to Eq. (2), a nonlinear value is provided as the output when the value is negative, as shown in Fig. 2. Although the amount of calculation increases, the unit provides a smooth solution and solves the shortcomings of the ReLU.
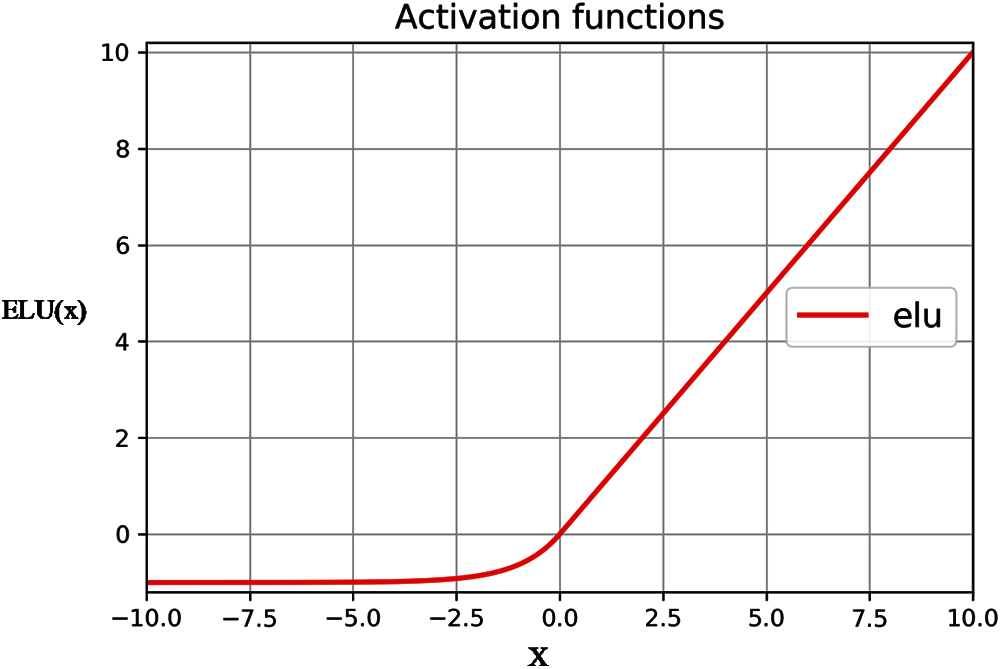
Figure 2: Using ELU as the activation function
2.3.3 Hyperbolic Tangent Function
The result calculated according to Eq. (3) compresses the input values to between −1 and 1, as shown in Fig. 3. The effect is better when the feature is obvious. However, the gradient vanishing problem occurs when the value is larger or smaller when the function includes an exponential calculation with a longer calculation time.
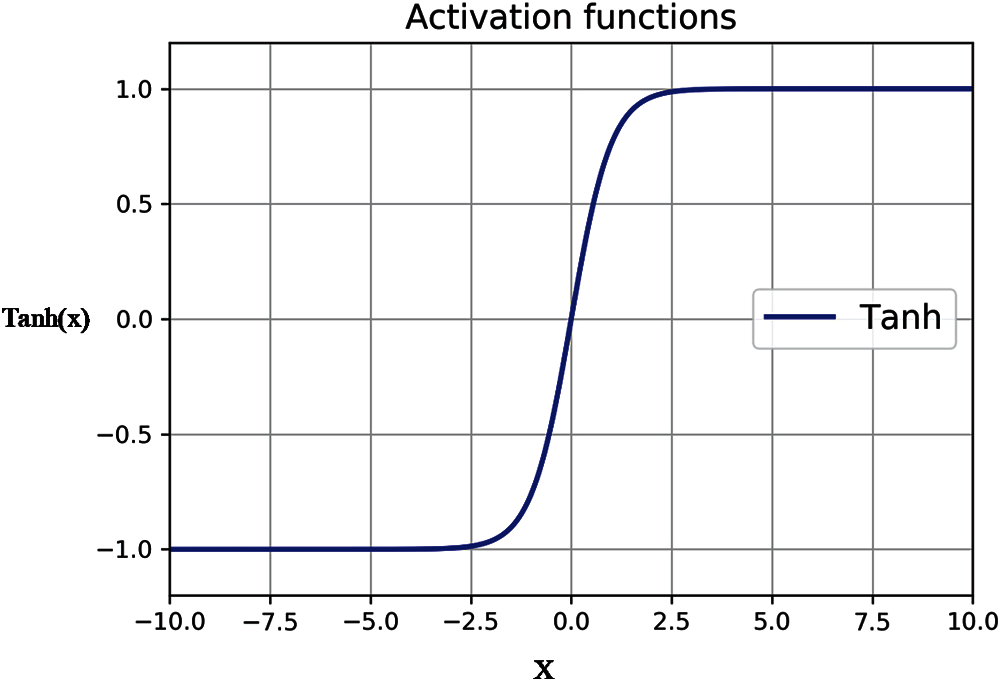
Figure 3: Using Tanh as the activation function
The result calculated according to Eq. (4) compresses the input value to between 0 and 1, as shown in Fig. 4. The effect is better with the bi-partition, but the function is an exponential calculation. As a result, the calculation time is longer, and the gradient vanishing problem may occur.
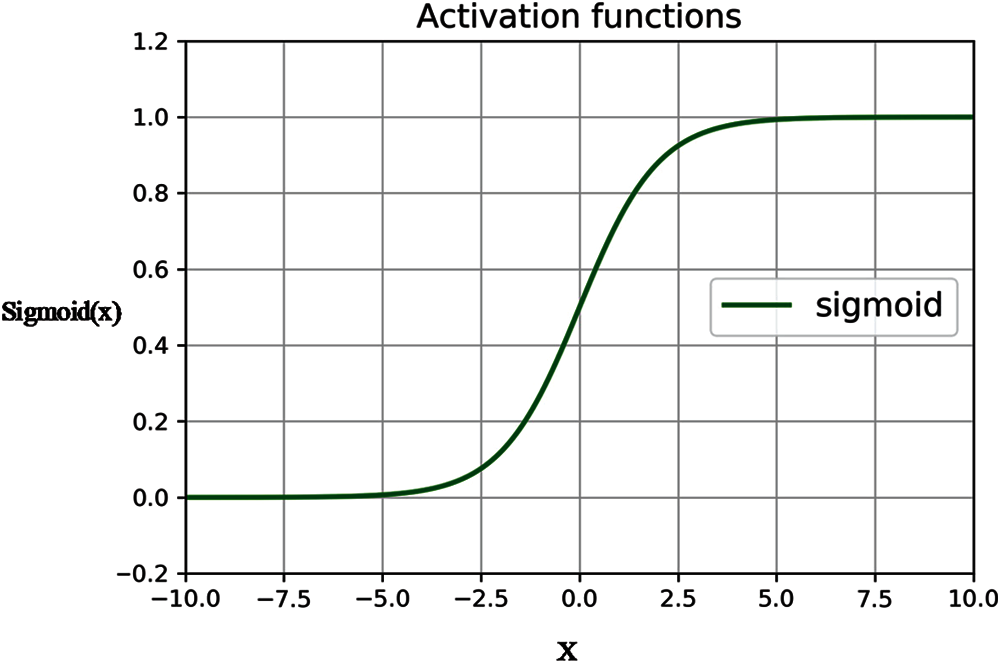
Figure 4: Using the sigmoid function as the activation function
The proposed system combines low-power Bluetooth radio frequency technology, Raspberry Pi embedded system, artificial intelligence and cloud database and other related equipment and technologies. It also uses artificial intelligence algorithms to improve the accuracy of indoor positioning.
The system architecture diagram is shown in Fig. 5. The architecture of the proposed system incorporates four hardware devices: wearable devices worn by the user, information receivers for receiving the packets, routers for establishing the local networks and management computers with interface programs.
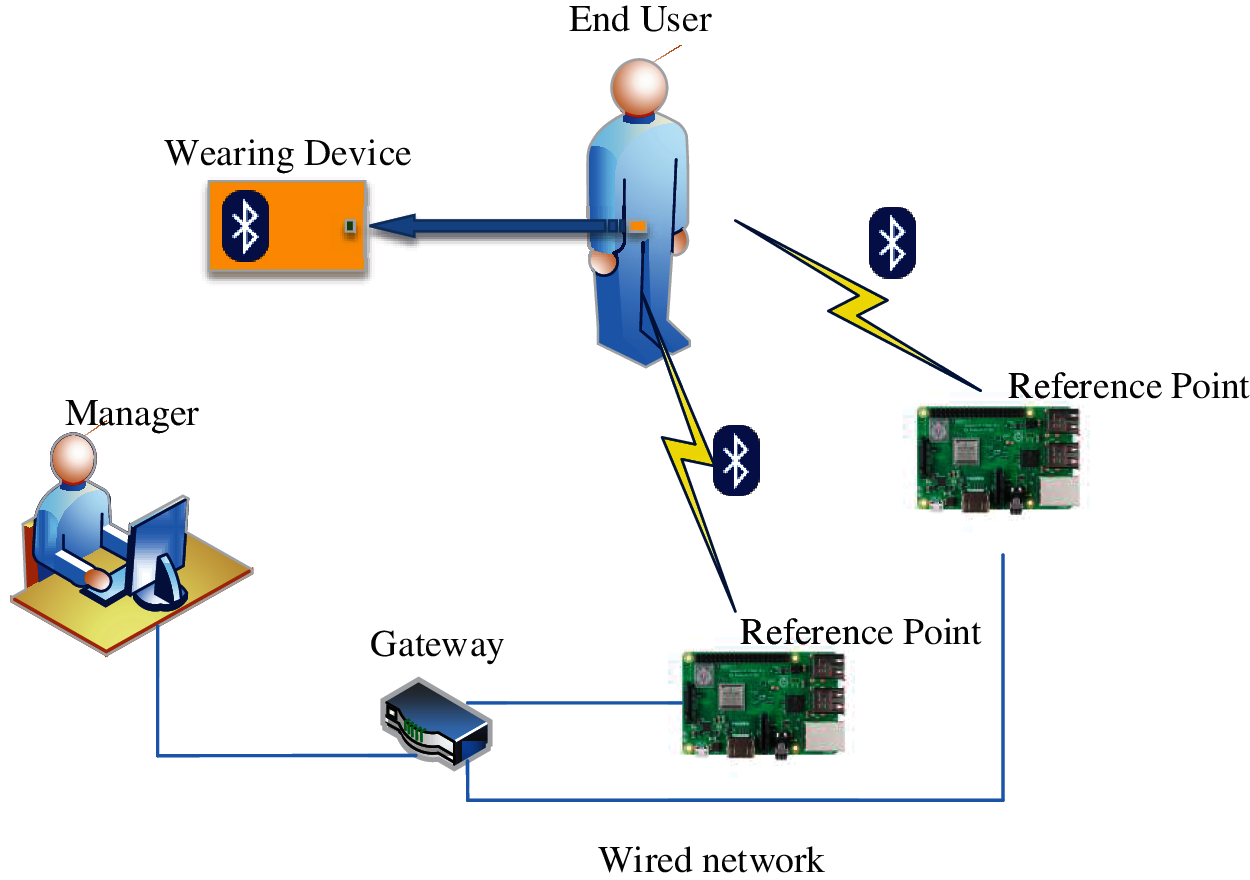
Figure 5: The indoor positioning hardware architecture
The system continuously sends information packets to the information receiving device through the Bluetooth broadcast mode. The information receiver first uses the algorithm to calculate the RSSI value of the packet and sends the user’s positioning information to the computer through the wired network. The management computers first analyze the user’s status information in the packet, calculate the current user location through the positioning algorithm, display the user’s location in the management interface program and finally upload the positioning information to the cloud database for storage.
The device uses Texas Instruments’ CC2541 Bluetooth wireless chip, the core of which is an 8051 microcontroller. The power source is a 3.7 V 1000 mAh polymer lithium battery with a working endurance of about one month. The components of the wearable device are shown in Fig. 6.
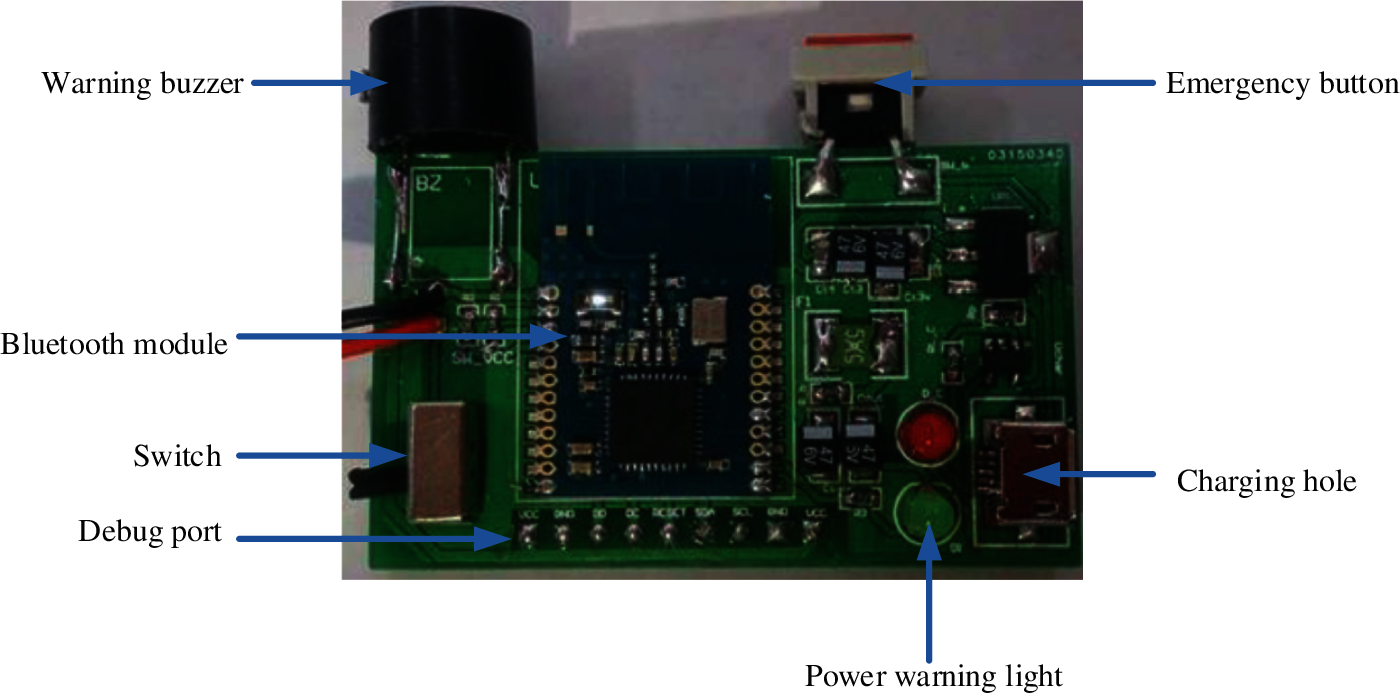
Figure 6: The components of the wearable device
The embedded development software of the wearable device is the IAR Embedded Workbench F, and the program is developed using the C language.
For the system to have low power consumption, automatic detection of power and increased stability, three functions have been added: a low power consumption mode, ADC voltage detection and a watchdog timer (WDT). The low power consumption mode switches to sleep mode after completing an event to reduce power consumption. The ADC voltage detection checks whether or not the current battery power is sufficient when the system is turned on. The WDT checks whether or not the program continues to operate upon the completion of an event. The flowchart of the wearable device system is shown in Fig. 7.
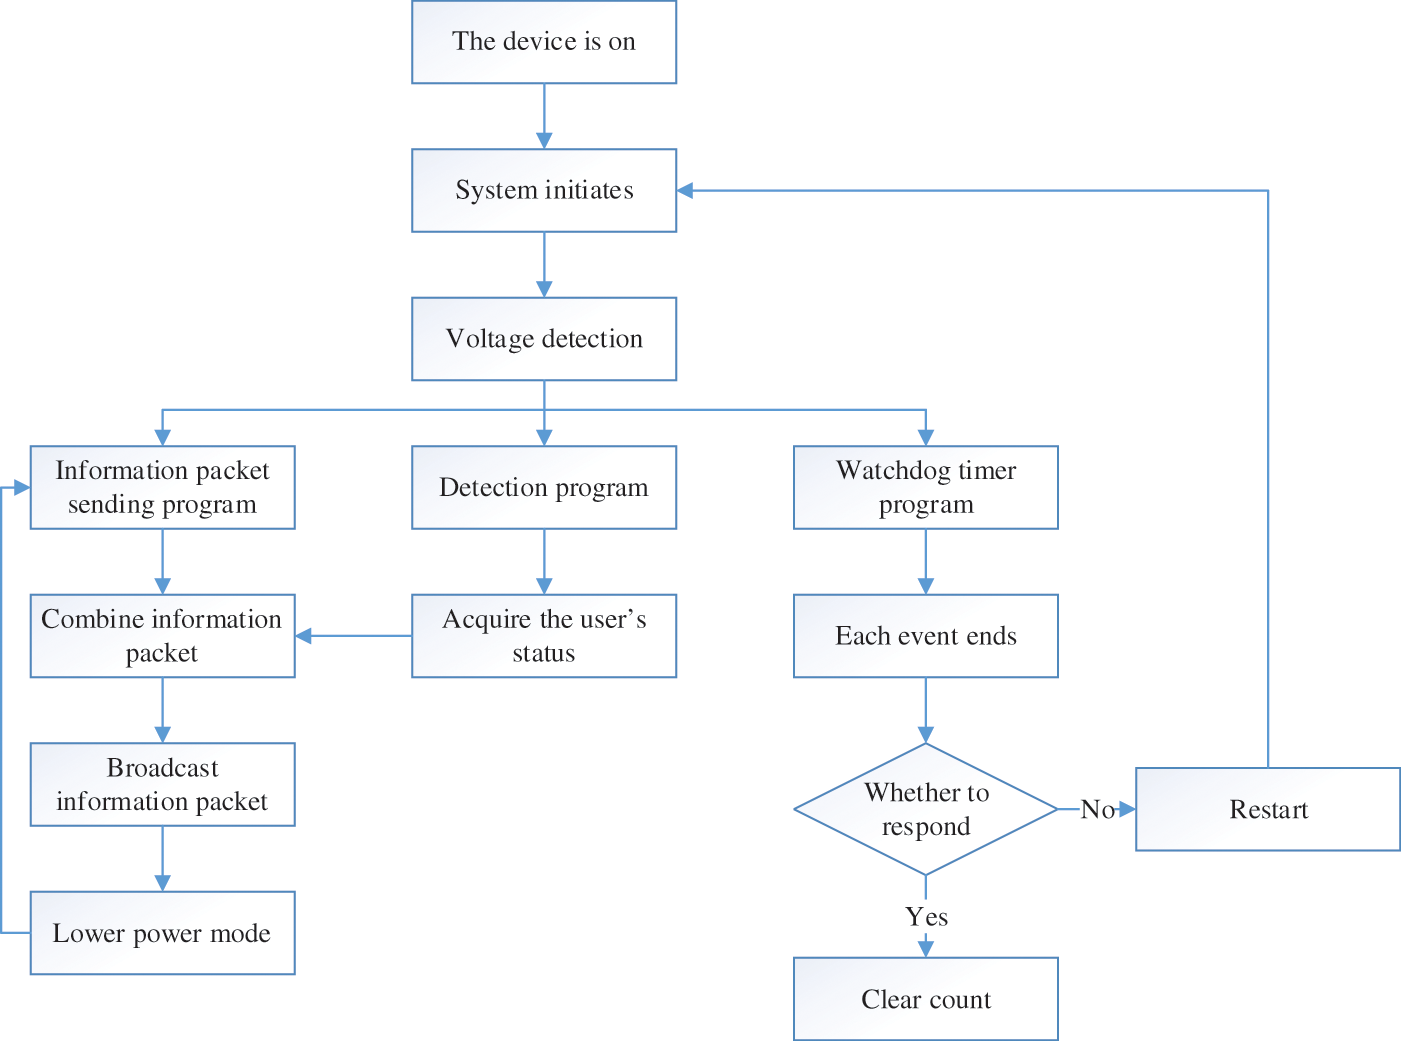
Figure 7: Flowchart for the wearable device
The Analog-to-Digital Converter (ADC) converts the analog voltage value into a digital value after comparing the reference voltage with the voltage to be measured. Since the power supply used by the wearing device is a 3.7 V polymer lithium battery, the ADC function is used to detect whether or not the battery is sufficient. In the proposed system, if the device’s battery voltage is higher than 2.2 V upon being turned on, the battery indicator lights up to indicate that the battery is sufficient. On the contrary, the indicator light is off if the power supply is insufficient or the device malfunctions. The flowchart for power detection is shown in Fig. 8.
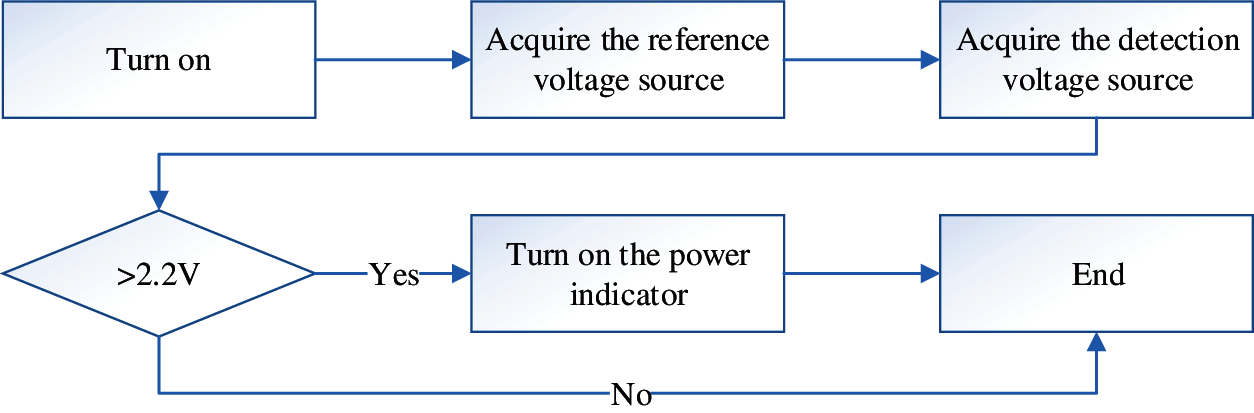
Figure 8: Flowchart for power detection
3.2.2 The Watchdog Timer (WDT)
The system is based on the information packet of the device. Therefore, a WDT is added to the program to ensure that the device sends packets accordingly. The timer is reset after the execution of each event designed by the developer. When an error occurs in the main program and the count value is not cleared for a certain time after the main program crashes, the WDT sends a signal to restart the system to return it to normal and ensure its stability. The flowchart of the watchdog timer is shown in Fig. 9.
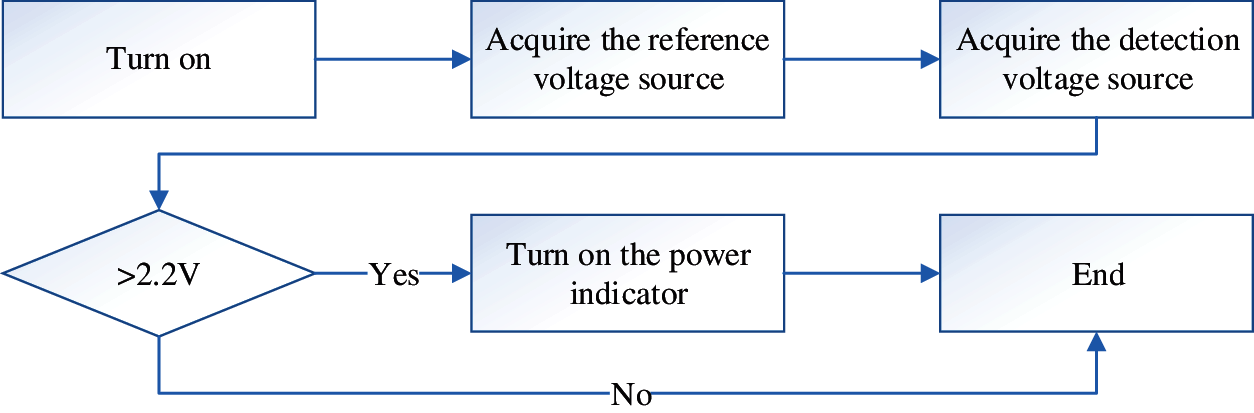
Figure 9: Flowchart of the watchdog timer
3.2.3 Low-Power Sending Packet Program
The 8051 chip provides three low-power modes, as shown in Table 2. The system uses Power Mode 2 because Power Mode 1 wakes up every 4 microseconds, which leads to excessive power consumption by the chip. Since power consumption reduction is one of the system’s goals, Power Mode 1 is not selected. The wake-up time for Power Mode 2 can be set according to the developer’s needs to ensure low power consumption. Furthermore, since the system is designed to broadcast packet information once every 100 ms, it is designed to enter sleep mode at other times to reduce power consumption.

3.3 Indoor Positioning System Process
The flowchart of the indoor positioning system is shown in Fig. 10. The receiver receives the packet sent by the wearable device and discards the packet information not sent by the device. The receiver’s internal algorithm then calculates the RSSI value of the received packet. Next, the RSSI value of the packet is sent to the computer interface program via the TCP/IP socket. Finally, the computer interface program uses a positioning algorithm to calculate the user’s location and marks the location on the computer interface program. The management personnel monitors all users’ locations in the field through the interface program. When a user accidentally falls or activates the emergency button, the displayed user mark will be marked in different colors so that the management personnel can quickly proceed to the location and deal with the situation.
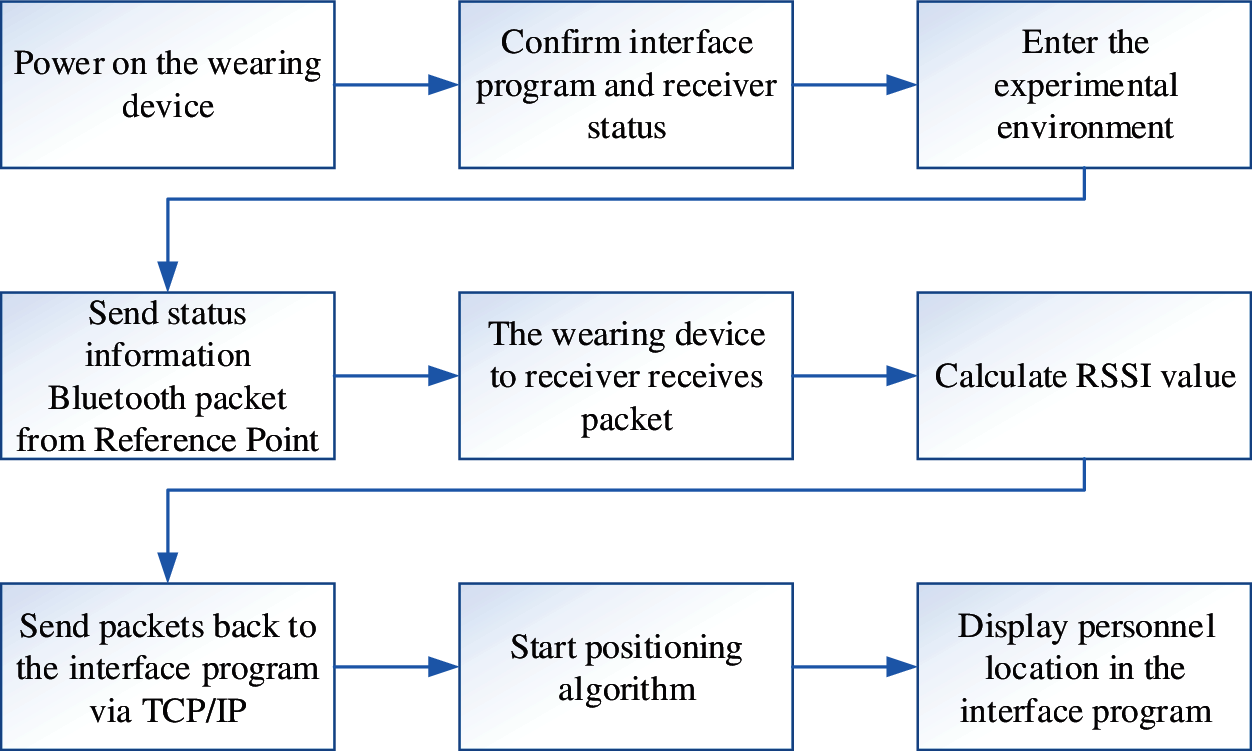
Figure 10: Flowchart of the indoor positioning system
The flowchart of the management interface program system used by the management personnel is shown in Fig. 11. The management personnel can check the user’s position at any time through the management interface program to ensure the user’s safety. After the user installs the wearable device, the device must be paired with the transmitter device through the management interface program. When a user enters the detection area, the user’s location and status can be read on the management interface program. When the user leaves the detection area, the user must use the management interface program to unpair the wearable device and retrieve the device for later use.
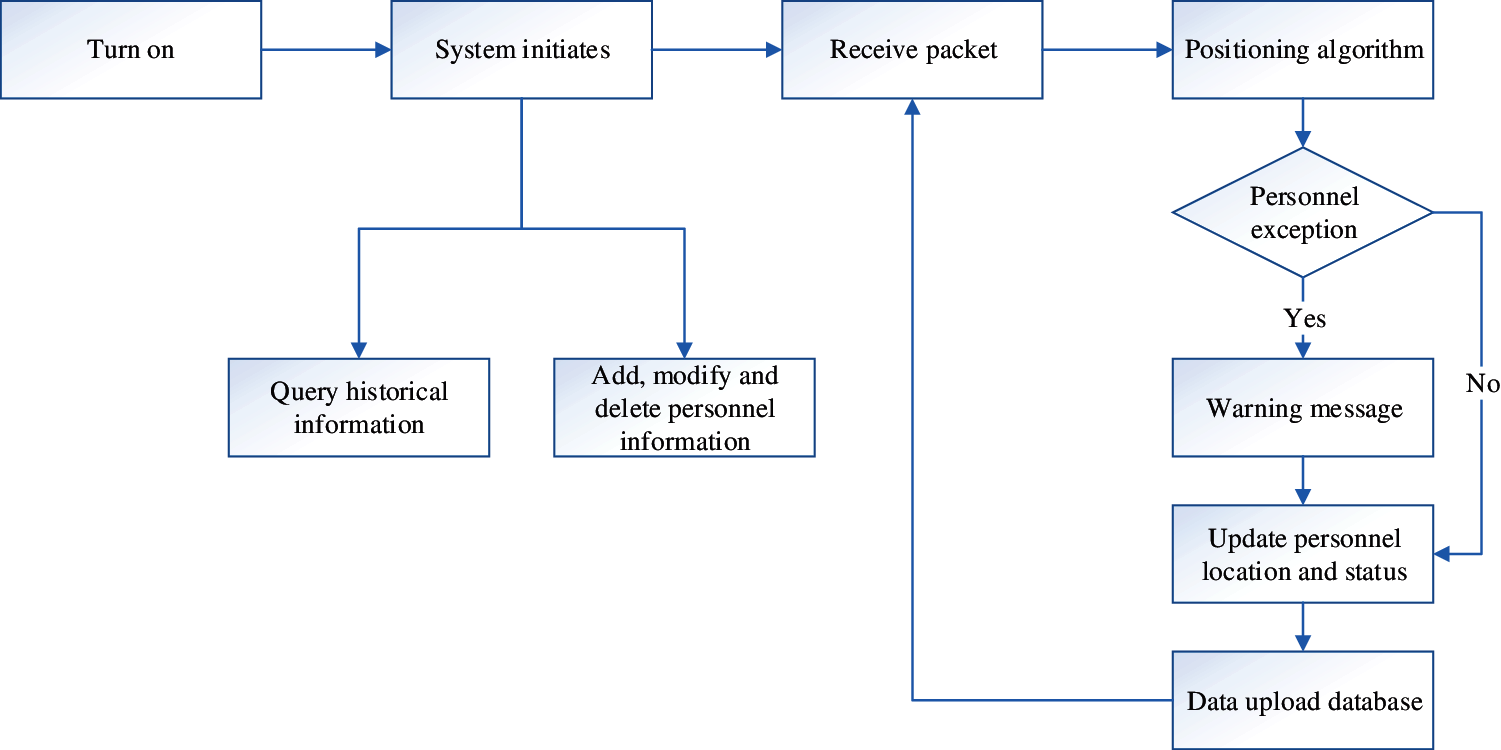
Figure 11: Flowchart of the management interface program system
The information receiver uses the Raspberry Pi 3B as its development platform. Due to the device’s small size, strong computing power and multiple functions, the proposed system adds a USB Bluetooth receiver to its microcomputer and uses the C language to develop a packet receiving program. This program’s main functions are to receive information packets from the wearable device, confirm that the packet information is correct, calculate the RSSI value of the packet, reassemble the packet information, and send it to the computer. The flowchart of the information receiver program is shown in Fig. 12. The information receiver automatically finds and receives the packet information broadcasted by the wearable device, recombines the device number, the user status and the RSSI value of the packet information into a new information packet. Finally, it sends the new packet to the interface program for processing using the TCP/IP Socket.
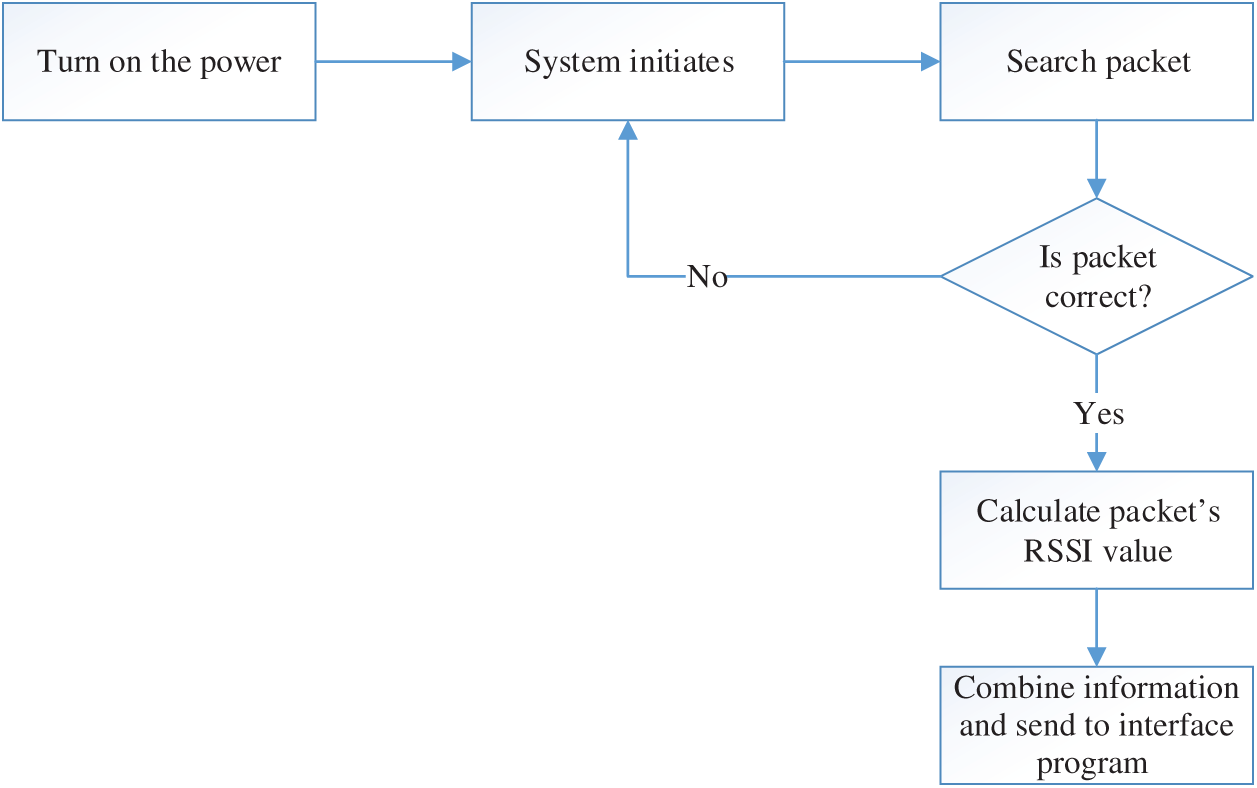
Figure 12: Flowchart of the information receiver program
3.5 The Indoor Positioning Model
The system uses artificial intelligence to establish a positioning model and finds an optimal algorithm to solve the environmental factors that affect indoor positioning. Spyder and Python are used as the development software to create the model. The system uses Tensorflow to build a model and various neural network models to find a high-accuracy model. The established model is reproduced in C/C++, and the algorithm is applied to the indoor positioning system.
3.5.1 Acquire Training Materials
Four or six information receivers can be placed depending on the requirements, and the experimental field is divided into thirty-two areas.
Two placements for the information receivers have been proposed to ensure the quality of information receivers. When the signals are affected by environmental factors, the placement with six information receivers can be used; otherwise, four information receivers are sufficient. In addition, since the information receivers are placed in an array, the experiment field can be divided into thirty-two blocks (Block 1–Block 32) to cover all areas and avoid noise interference from the testing environment, as shown in Fig. 13. According to these two placement methods, thirty-two regional receiver signals are acquired as the training materials, providing five thousand seven hundred thirty-two signals in total.
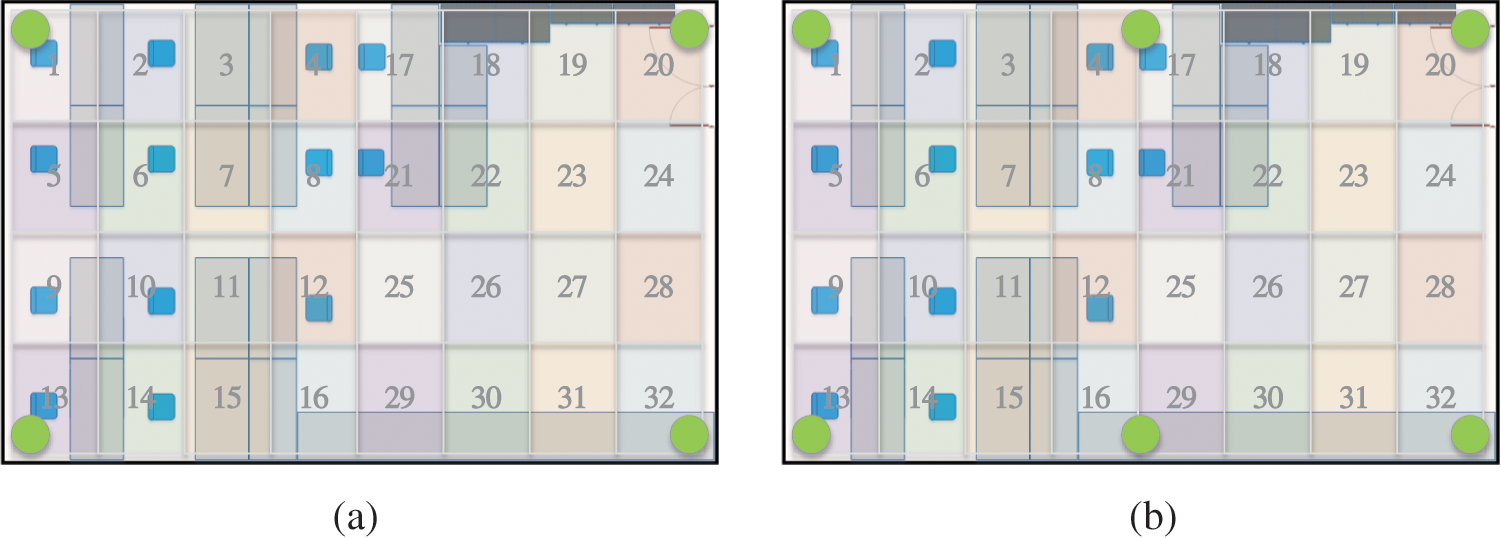
Figure 13: Information receiver placements and subdivisions (a) For four information receivers and (b) 6 information receivers
We have compared two neural network models to determine which area the user is in: the multi-layer perceptron (MLP) and recurrent neural network (RNN). Four thousand two hundred and eighty-three signals are used for training when building the architecture, and one thousand four hundred and ninety-nine three signals are used for testing the trained model architecture. The input unit is the receiver of either four or six signal strength values, and the output unit has thirty-two nodes to represent thirty-two areas. After modifying the number of nodes, the number of layers, and the activation function of the intermediate hidden layer, we use the framework provided by Tensorflow for training and select a model with low resource consumption and high accuracy. Regarding the setting of the number of hidden layers, we refer to the paper proposed by Xu et al. [15] in 2020.
3.5.3 Multi-Layer Perceptron Positioning Model
The architecture diagram of the multi-layer perceptron positioning model is shown in Fig. 14. The input layer has either four or six signal strength values, and the output layer has thirty-two nodes. Each node needs to be multiplied and added with all input values.
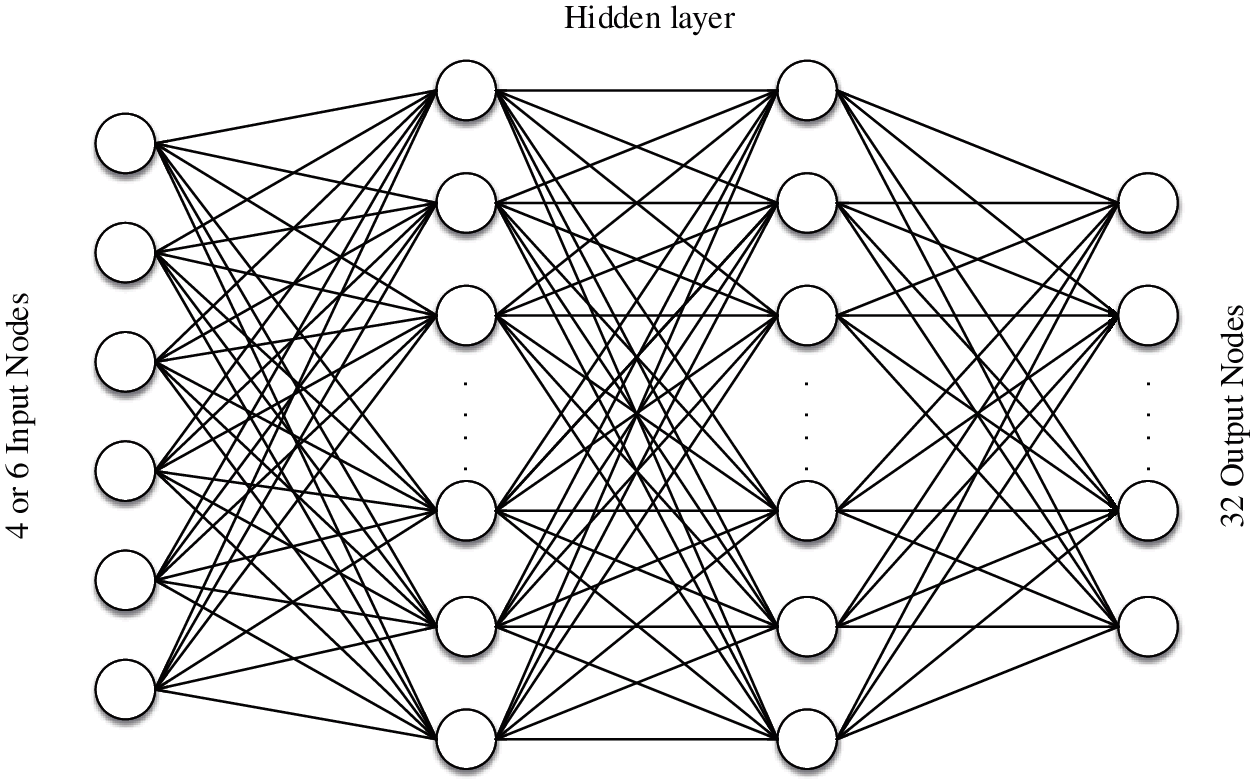
Figure 14: The multi-layer perceptron positioning model
3.5.4 Recurrent Neural Network Positioning Model
The architecture diagram of the recurrent neural network (RNN) positioning model is shown in Fig. 15. The input layer has four or six signal strength values, and the output layer has thirty-two nodes. Since RNN is a recursive architecture, only one (out of four or six) signal strength value is input at a time. The positioning model input signal is only input once compared to the fall action, so it cannot find the correlation of the continuous signal. As a result, the MLP has a better effect than the RNN.
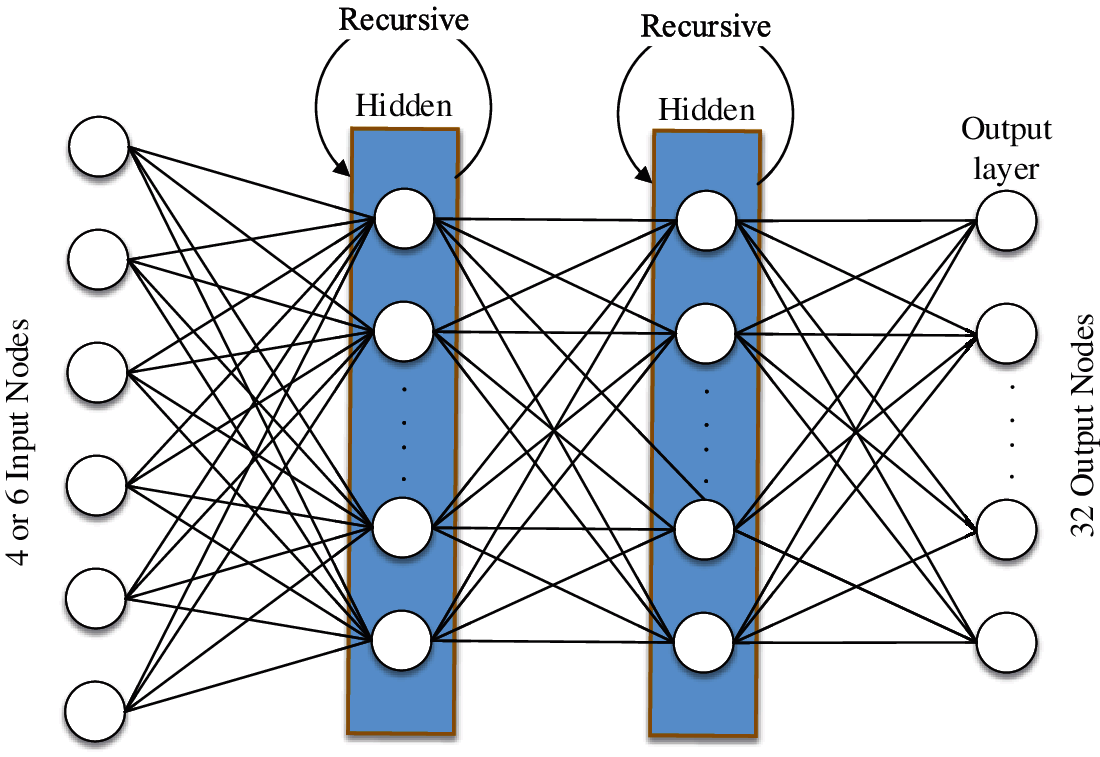
Figure 15: The recurrent neural network positioning model
4 Experimental Result and Discussion
4.1 Acquire Indoor Positioning Model Test Data
There are two ways to place the information receivers, using either four or six receivers and dividing the experimental field into thirty-two areas. The receivers are placed in the experimental field, as shown in Fig. 16.
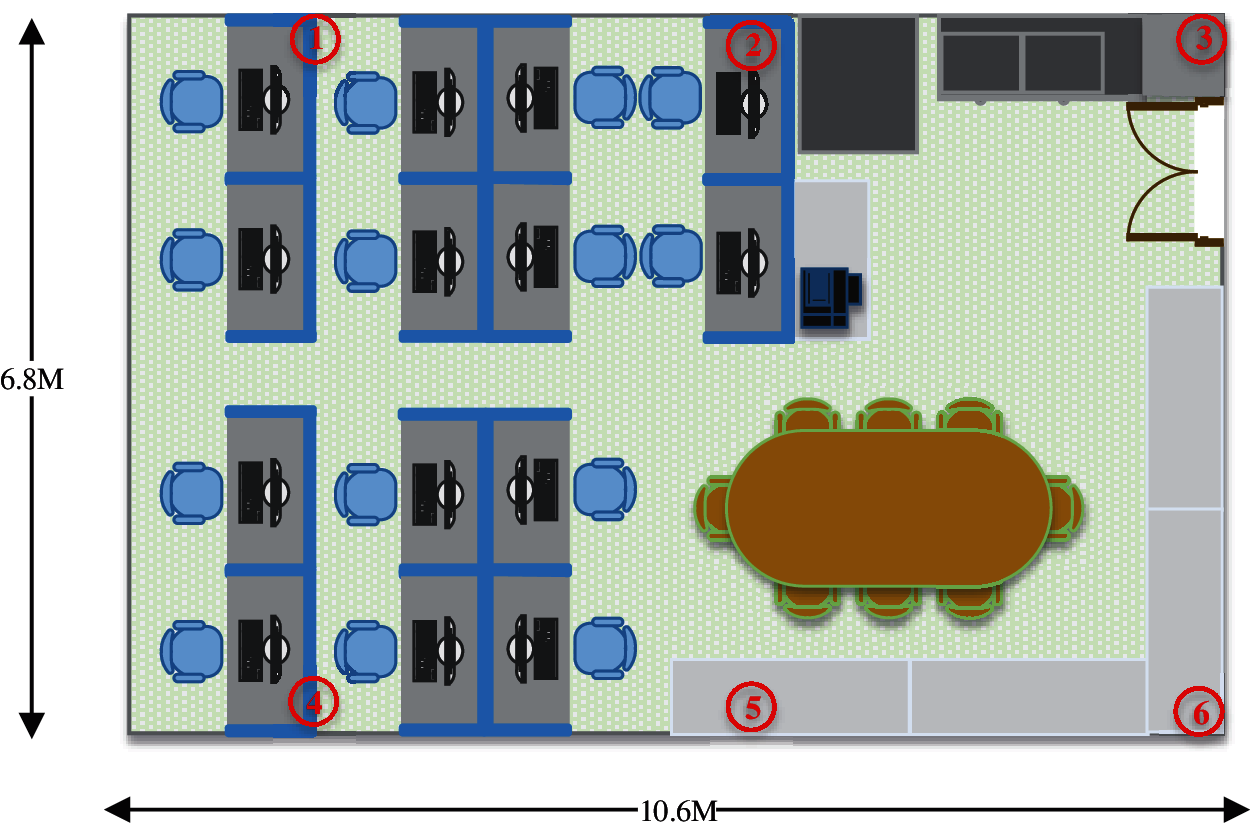
Figure 16: The placement of receivers in the experimental field
The locations of the receivers are at 1, 3, 4 and 6 for the placement with four information receivers and at 1, 2, 3, 4, 5, and 6 for the placement with six information receivers. The training materials also adapt to the thirty-two-area receiver signals based on these two placement methods. Each area obtains one hundred seventy-five to one hundred and eighty-two data values, and a total of five thousand seven hundred thirty-two signals are acquired. The signal values of thirty-two areas are shown in Fig. 17.
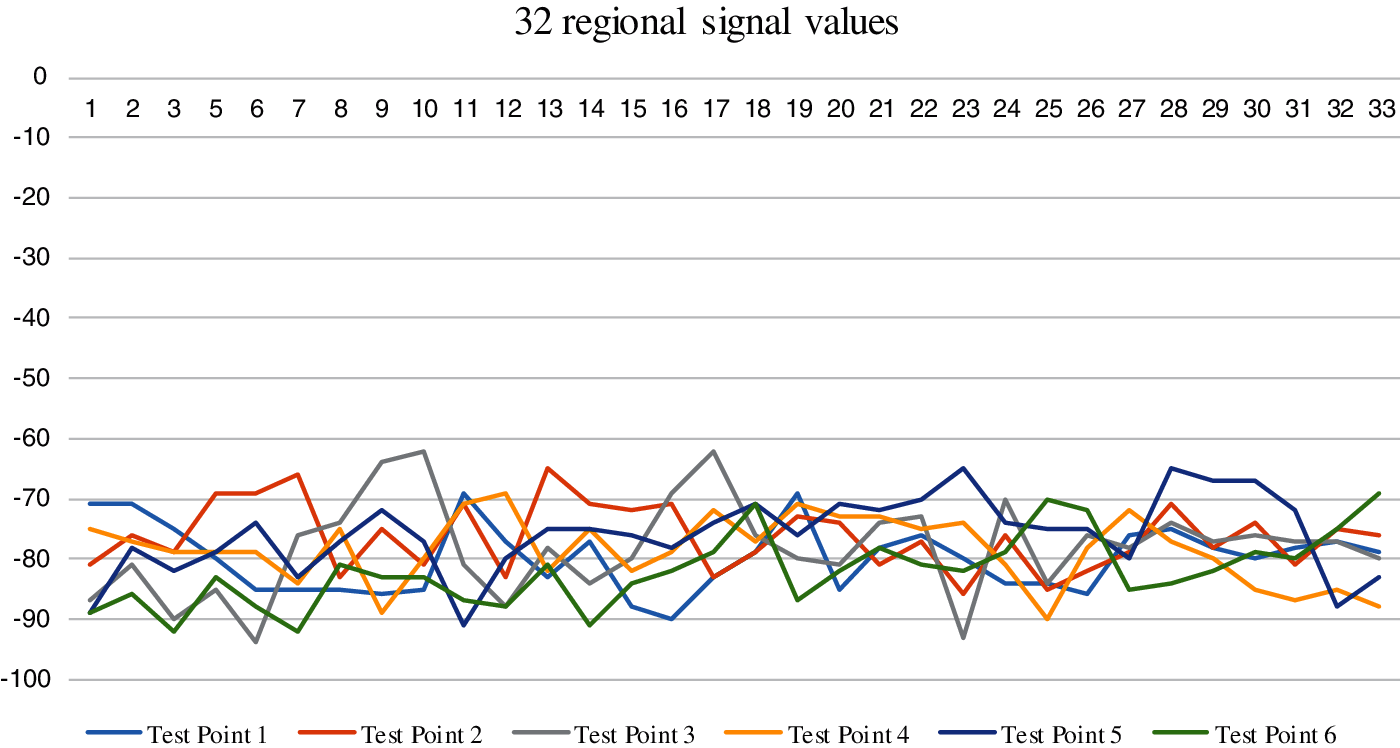
Figure 17: The signal values from the 32 areas
4.2 The Indoor Positioning Model Accuracy and Resource Consumption
The model is divided into two structures, with four or six information receivers, to select the optimal number for information receivers placement. The wearable device is updated once per second, and the calculations are performed by a computer. As such, the architecture is expected to consume a lot of resources.
4.2.1 The MLP Indoor Positioning Model Accuracy and Resource Consumption
The MLP is a fully connected layer architecture, and the number of weights on a single node in the hidden layer is the number of input nodes. For example, the hidden layer has six input units, which means that each node of the layer has six weight values and one deviation value. The MLP model training architecture is shown in Table 3. Since there are only four or six input data values, the model needs more features to learn 32 different regions. The structure has a two-layer design to filter the data and preserve the features as the data is not filtered.

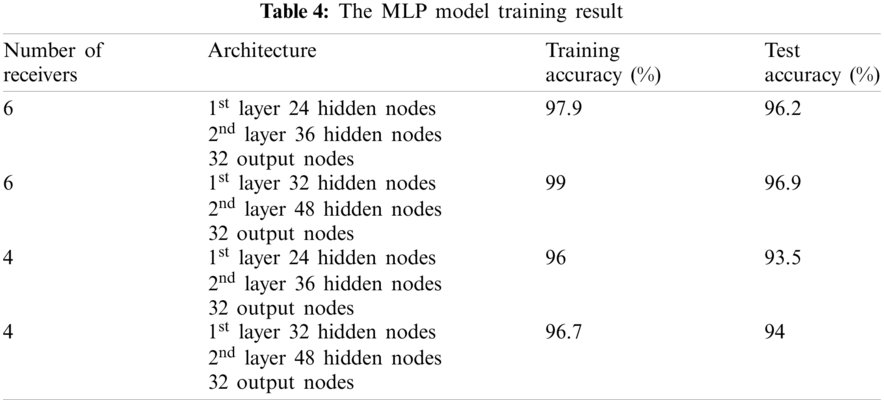
The MLP model training results are shown in Table 4, where the accuracy obtained by six information receivers is higher than that of the four receivers. The reason being that there are more input data with more extracted features, leading to a better learning effect.
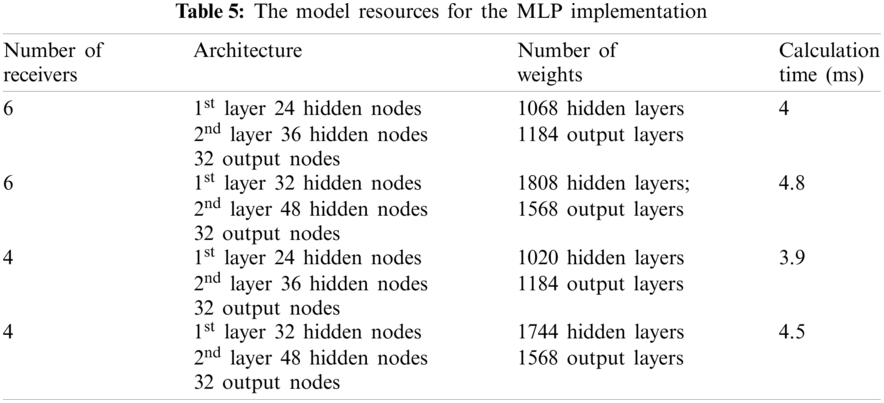
The model resources for the MLP implementation is shown in Table 5, which shows all weights and calculation times of the MLP model. Since the algorithm is performed on a computer, resource cost is not the primary concern, and the calculation time is much shorter than the time required to update the interface program.
4.2.2 The RNN Indoor Positioning Model Accuracy and Resource Consumption
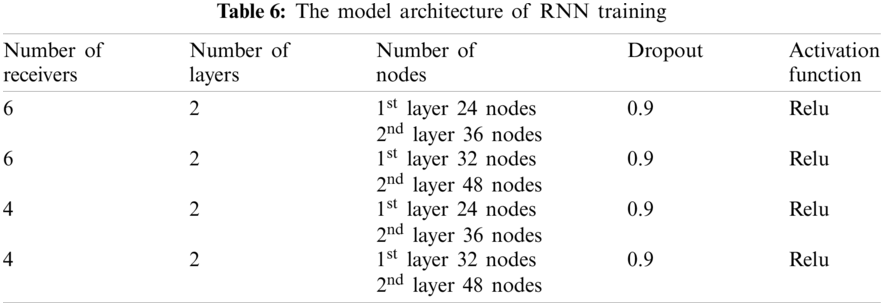
The indoor positioning model does not implement the algorithm due to the low training accuracy. The model architecture of RNN training is shown in Table 6. In terms of model design, it also uses two layers like the MLP and performs filtering and features retention simultaneously.
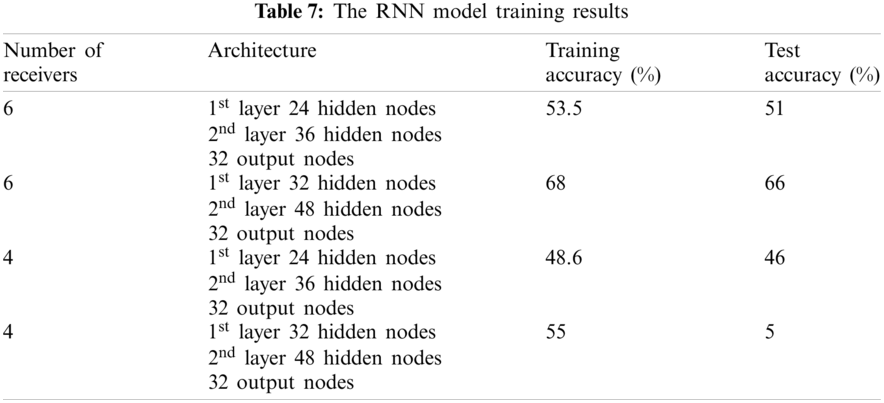
The RNN model training results are shown in Table 7. From the result, it can be seen that the learning effect is undesirable. The RNN’s strength lies in its ability to retain the previous calculation features, and the model cannot be used fully when the data is input only once. Since each hidden node is divided into the input weight and historical calculation weight, the data representing the history is 0, leading to a calculated value of 0 and no memorized historical features. As a result, the accuracy of the calculation is very low.
4.2.3 The Indoor Positioning Model Comparison
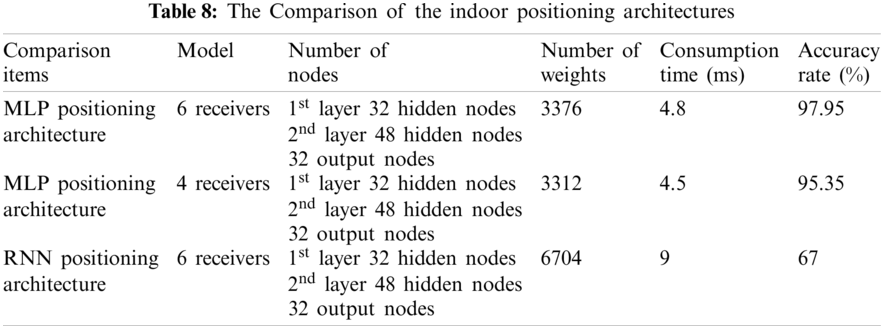
The comparisons of the three architectures are shown in Table 8. In the MLP implementation, the architectures with six receivers and four receivers are selected; and in the RNN implementation, the architecture with the best effect is selected for comparison. The accuracy rate of the MLP’s user positioning architecture with six receivers is about 2.5% higher than that of the four receivers architecture, with just slightly more resource consumption of weights and calculation times. The accuracy rate of the RNN’s user positioning architecture is about 30% lower than that of the MLP, with significantly more weights and calculation times. According to the comparison result, the MLP’s user positioning architecture is chosen for the proposed system. The cost can be reduced using the four receivers implementation; otherwise, six receivers will be used.
This paper proposes a novel indoor positioning system using artificial intelligence algorithms and various neural network models for learning a low-resource, high-accuracy algorithm. The proposed algorithm can build effective and resource-efficient models to be used in different applications. Furthermore, experiments have shown that the number of receivers can vary according to the field’s size to implement the system at low costs. The system also provides a convenient user interface for the management personnel to quickly and effectively solve abnormal user problems.
According to comparisons of various indoor positioning frameworks, we have found that the MLP architecture is superior to the RNN architecture regardless of whether four or six receivers are used. Therefore, we have decided to use the MLP for the indoor positioning framework in this work. The proposed system has achieved a 95% positioning accuracy with four receivers and close to 98% accuracy with six receivers. In conclusion, the proposed indoor positioning system has significantly improved accuracy compared to previous indoor positioning systems.
Funding Statement: The authors received no specific funding for this study.
Conflicts of Interest: The authors declare that they have no conflicts of interest to report regarding the present study.
1. Estrin, D., Culler, D., Pister, K., Sukhatme, G. (2002). Connecting the physical world with pervasive networks. IEEE Pervasive Computing, 1(1), 59–69. DOI 10.1109/MPRV.2002.993145. [Google Scholar] [CrossRef]
2. Pottie, G. J., Kaiser, W. J. (2000). Wireless integrated network sensors. Communications of the ACM, 43(5), 51–58. DOI 10.1145/332833.332838. [Google Scholar] [CrossRef]
3. Tsuboi, T., Ueda, H. (2013). Indoor trace tracking algorithm with pattern-based positioning technique of UHF band RFID. 19th Asia-Pacific Conference on Communications, pp. 339–344, Bali Island, Indonesia. [Google Scholar]
4. Schafermeyer, E. R., Wan, E. A., Samin, S., Zentzis, N., Preiser, N. et al. (2015). Multi-resident identification using device-free IR and RF fingerprinting. Annual International Conference of the IEEE Engineering in Medicine and Biology Society, pp. 5481–5484. Milan, Italy. [Google Scholar]
5. Ma, W., Zhu, X., Huang, J., Shou, G. (2015). Detecting pedestrians behavior in building based on Wi-Fi signals. IEEE International Conference on Smart City/SocialCom/SustainCom, pp. 1–8. Chengdu, China. [Google Scholar]
6. Kim, J., Ji, M., Jeon, J. I., Park, S., Cho, Y. (2016). K-NN based positioning performance estimation for fingerprinting localization. Eighth International Conference on Ubiquitous and Future Networks, pp. 468–470. Vienna, Austria. [Google Scholar]
7. Alkandari, M., Basu, D., Hasan, S. F. (2017). A Wi-Fi based passive technique for speed estimation in indoor environments. Workshop on recent trends in telecommunications research. pp. 1–3. [Google Scholar]
8. Kosba, A. E., Saeed, A., Youssef, M. (2012). Robust WLAN device-free passive motion detection. IEEE Wireless Communications and Networking Conference, pp. 3284–3289. Paris, France. [Google Scholar]
9. Oguntala, G., Obeidat, H., Al Khambashi, M., Elmegri, F., Abd-Alhameed, R. A. et al. (2017). Design framework for unobtrusive patient location recognition using passive RFID and particle filtering. Internet Technologies and Applications, pp. 212–217. Wrexham, UK. [Google Scholar]
10. Cui, Y., Gao, S., Zheng, Y. (2018). Application of ZigBee location fingerprint method in positioning of railway tunnel staff. Chinese Automation Congress, pp. 3283–3287. Xi'an, China. [Google Scholar]
11. Al-Khaleefa, A. S., Ahmad, M. R., Isa, A. A. M., Al-Saffar, A., Esa, M. R. M. et al. (2019). MFA-OSELM algorithm for WiFi-based indoor positioning system. Information-An International Interdisciplinary Journal, 10(4), 146. DOI 10.3390/info10040146. [Google Scholar] [CrossRef]
12. Xue, M., Sun, W., Yu, H., Tang, H., Lin, A. et al. (2019). Locate the mobile device by enhancing the WiFi-based indoor localization model. IEEE Internet of Things Journal, 6(5), 8792–8803. DOI 10.1109/JIOT.2019.2923433. [Google Scholar] [CrossRef]
13. Hopfield, J. J. (1982). Neural networks and physical systems with emergent collective computational abilities. Proceedings of the National Academy of Sciences of the United States of America, 79(8), 2554–2558. DOI 10.1073/pnas.79.8.2554. [Google Scholar] [CrossRef]
14. Jordan, M. I. (1986). Serial order: A parallel distributed processing approach (No. 8604 ICS Technical Report). University of California at San Diego, La Jolla, CA. [Google Scholar]
15. Xu, P., Aamir, M., Shabri, A., Ishaq, M., Aslam, A. et al. (2020). A new approach for reconstruction of IMFs of decomposition and ensemble model for forecasting crude oil prices. Mathematical Problems in Engineering, 2020(3), 1–23. DOI 10.1155/2020/1325071. [Google Scholar] [CrossRef]
 | This work is licensed under a Creative Commons Attribution 4.0 International License, which permits unrestricted use, distribution, and reproduction in any medium, provided the original work is properly cited. |