| Computer Modeling in Engineering & Sciences |
DOI: 10.32604/cmes.2022.018763
ARTICLE
Deep Neural Network with Strip Pooling for Image Classification of Yarn-Dyed Plaid Fabrics
1School of Artificial Intelligence and Computer Science, Jiangnan University, Wuxi, 214122, China
2College of Textile and Science Engineering, Jiangnan University, Wuxi, 214122, China
*Corresponding Author: Weidong Gao. Email: gaowd3@163.com
Received: 16 August 2021; Accepted: 27 September 2021
Abstract: Historically, yarn-dyed plaid fabrics (YDPFs) have enjoyed enduring popularity with many rich plaid patterns, but production data are still classified and searched only according to production parameters. The process does not satisfy the visual needs of sample order production, fabric design, and stock management. This study produced an image dataset for YDPFs, collected from 10,661 fabric samples. The authors believe that the dataset will have significant utility in further research into YDPFs. Convolutional neural networks, such as VGG, ResNet, and DenseNet, with different hyperparameter groups, seemed the most promising tools for the study. This paper reports on the authors’ exhaustive evaluation of the YDPF dataset. With an overall accuracy of 88.78%, CNNs proved to be effective in YDPF image classification. This was true even for the low accuracy of Windowpane fabrics, which often mistakenly includes the Prince of Wales pattern. Image classification of traditional patterns is also improved by utilizing the strip pooling model to extract local detail features and horizontal and vertical directions. The strip pooling model characterizes the horizontal and vertical crisscross patterns of YDPFs with considerable success. The proposed method using the strip pooling model (SPM) improves the classification performance on the YDPF dataset by 2.64% for ResNet18, by 3.66% for VGG16, and by 3.54% for DenseNet121. The results reveal that the SPM significantly improves YDPF classification accuracy and reduces the error rate of Windowpane patterns as well.
Keywords: Yarn-dyed plaid fabric; image classification; image dataset; deep neural network; strip pooling model
With rich visual aesthetic characteristics, yarn-dyed plaid fabric (YDPF), interwoven with colored yarns horizontally and vertically, has increasingly attracted consumers’ attention. Statistically, hundreds of millions of meters of YDPF are produced worldwide annually, including different plaid types. Historical mass-production data have been accumulated for textile production over the years and are useful for sample order production and textile product design. For example, factories often receive samples from customers that can be efficiently reproduced by visually comparing them with the same or similar products of the past. These abundant plaid patterns also inspire textile product designers.
Currently, the parameters of textile samples are analyzed by engineers, but this is inefficient. Historical production data are classified and searched only according to production parameters, such as warp and weft density, yarn count, structure, and finishing process. This process cannot manage any information for plaid fabrics and cannot satisfy the visual needs of sample order production, fabric design, or stock management. Image classification techniques solve this restriction by learning and extracting image features, expressing them abstractly, and then providing the results. Extracting these features more effectively is an intense research topic in image classification and the subject of this paper.
Features are usually obtained through manual extractors and include the underlying visual features, such as color, texture, and shape. They also determine locally invariant features such as the direction gradient histogram or HOG [1], the scale-invariant feature transform, SIFT [2], and the local binary pattern, LBP [3]. Next, a support vector machine [4], random forest [5], K nearest neighbor [6], or other classifier determines the category that the image belongs to. This approach has achieved some success, but methods based on low-level features have obvious limitations because they heavily rely on traditional feature extraction technology. There is a significant difference between these low-level features and the high-level semantic features now needed.
Recently, deep neural networks (DNNs) have shown notable accuracy in describing visual features. They can identify complex features approaching human visual perception. The target image is presented directly to the DNN; then, sets of convolution and pooling are performed. Convolutional filtering reduces the number of connections, and the speed of network training is improved. In addition, the higher-level features can be captured from the image data. This method effectively avoids the dependence on feature extraction algorithms used in traditional machine learning techniques. The LeNet model [7], developed in 1994 by He et al., achieved notable results on the MNIST [8]. However, due to limited computing power, its organization and depth were primitive. In 2012, the AlexNet model of Hinton et al. [9] adopted the ReLU [10] activation function and dropout operation, which speed up the gradient descent method, but the computational limitations had not changed. The VGGNet model of Simonyan et al. [11] improved upon AlexNet and attempted to determine how deep the learning network can be. Their study found this to range from 7 to 16 layers. The ResNet model [7] proposed in 2015 had a residual structure that allowed a neural network to reach over 1000 layers, a true milestone; DenseNet, a model [12] that used densely connected modules for better results, was proposed in 2017, but it also had an excessive memory footprint. This paper describes the three most promising convolutional neural networks (CNNs): VGG, ResNet, and DenseNet.
Much recent research has focused on applying CNNs to classification in different fields. Applying a CNN to lung cytological images, Atsushi Teramoto automatically classified the malignant and benign cells. His results had a classification sensitivity of 89.3% and a specificity of 83.3%, which reaches the cytopathologist level [13]. Zarie developed a DNN for classifying froth images with results that demonstrated the CNNs’ potential for analyzing froth images [14]. Anabel Gómez-Ríos introduced CNNs to coral texture image classification, which had excellent accuracy [15]. Previous research has also been conducted on textile and garment classification using CNNs. CNNs classified the grayscale fiber images into seven types of shapes of fibers [16]. Based on the integrated CNN model, a visual long short-term memory was proposed by Zhao et al. [17] to classify yarn-dyed fabric defects. Xiang et al. [18] proposed a novel approach for fabric image retrieval based on multi-task learning and deep hashing.
However, there has been no research on the classification of YDPFs yet or the use of CNNs. This paper introduces the latest CNN image classification technology for YDPF image classification and describes the performance of this approach. CNNs are shown to be effective for YDPF image classification. The challenging Windowpane pattern was easily separated into the Prince of Wales pattern, showing how traditional CNNs are improved by adding the strip pooling model (SPM) [19]. This technique can extract the local details of horizontal and vertical features needed to identify the horizontal and vertical crisscross pattern. Using the SPM improves the performance of ResNet18 by 2.64%, VGG16 by 3.66%, and DenseNet1213 by 54% on the YDPF dataset, revealing that strip pooling improves YDPF classification accuracy and reduces the error rate of the Windowpane patterns effectively.
The remainder of this paper is organized as follows, Section 2 introduces the CNN classification models, CNN optimization techniques, and the SPM in related works. The dataset for the YDPF images is proposed in Section 3. Section 4 describes the framework of a DNN with SPM for YDPF image classification. Then, the experiment and results are provided in Section 5. The conclusions are given in Section 6.
Three of the most promising CNN models, VGG, ResNet, and DenseNet, are considered to classify YDPF images. Brief introductions of the CNNs are given in this section.
The Visual Geoffrey Group from Oxford University in 2014 applied a 3 × 3 convolution kernel and 2 × 2 maximum pooling to the VGG network and proved that several small 3 × 3 filter convolution layers were better than a single 5 × 5 or 7 × 7 layer. Deepening the VGG network improved performance, but the increase in computing resource consumption and parameters led to increased memory usage.
To solve vanishing or exploding gradients, ResNet uses residual mapping and adds connections between layers [7]. Repeatedly used in the network, one particular building block plays a significant role, and the number of these building blocks decides the network depth. A 3 × 3 convolution layer followed by another 3 × 3 convolution layer comprises the building block for 152 layers, and the connection is joined from the first convolution input to the second one. The ResNet structure accelerated the training of the DNN tremendously and increased the model's accuracy greatly.
With the skip connection, the Dense Convolutional Network allows each layer to accept the outputs of all the preceding layers. The L layer has L connections in the usual convolution structure, while DenseNet has L(L-1)/2 connections. Unlike the ResNet block, the connections in the Dense block incorporate the previous layers’ outputs, which are added to the following layers before computation. The number of Dense blocks decides the network depth, like ResNet. DenseNet alleviates gradient disappearance, strengthens feature propagation, encourages feature reuse, and reduces computation.
2.2 CNN Optimization Techniques
Massive training data are required to detect potential patterns in deep learning. Large, high-quality datasets are difficult to build because of the complexity and high cost of the data collection; so, insufficient training data are usually a troublesome problem in deep learning. This paper shows two optimization techniques with transfer learning and data augmentation to overcome these difficulties.
We define a domain and a task. A domain can be expressed as D = {χ, P (X)}. It contains two parts: the feature space χ and the marginal probability distribution P(X), X = {x1,…,xn} ∈ χ. A task can be represented as T = {y, f(x)}. It consists of a label space y and a target prediction function f(x). The f(x) can also be regarded as a conditional probability function P(y|x). Thus, transfer learning can be formally defined as a given target domain (Dt)-based learning task Tt; it can be helped by the source domain (Ds) of the learning task Ts. Transfer learning aims to improve the performance of the predictive function fT(⋅) by discovering and migrating the potentially transferable knowledge of Ds and Ts for the learning task Tt, where Ds is not equal to Dt and T is not equal to Tt. In most cases, the scale of Ds is much larger than that of Dt, Ns≫Nt, such as that of the massive common objects dataset, ImageNet [20].
Through data augmentation, several distortions of the original images were applied to artificially increase the volume of the training dataset, such as changing the brightness, scaling or zooming, rotating, and vertical or horizontal mirroring. Not altering the spatial pattern of target classes, the distortions are usually performed during the training time, which allows the process to occur without saving the new images.
By sampling, pooling selects a method to reduce the dimensionality and compress the space needed for the input feature map and thus speeds up computations. General pooling includes average pooling and maximum pooling. The SPM is used to extract local detail features along the horizontal or vertical directions of the YDPFs to achieve a better classification effect.
Mathematically, the two-dimensional input tensor is
After horizontal strip pooling, the output in the horizontal direction is
After vertical strip pooling, the output in the vertical direction is
Unlike traditional pooling, the SPM with a narrow, long core easily establishes remote dependencies between the area of discrete distribution and the strip shape's encoding area. In addition, the SPM's narrow core shape in other dimensions can capture local details.
3.1 Image Capture and Preprocessing
There have been no public datasets for the YDPF image classification. In this paper, the YDPF dataset is created from data obtained from the Jiangsu Sunshine Group and Jiangsu Lianfa Textile Group. The potential value of YDPF image classification for sample order production, fabric design, and stock management is considerable. There are 10,661 fabric samples in the YDPF dataset.
We used the Canon 9000F Mark II scanner to capture YDPF images in the RGB mode. The white LED of the scanner guarantees a stable capture environment. The resolution has an important influence on the quality of the captured image and the number of capture calculations; the scanner's resolution was set to 200 dpi.
The quality of image labeling has a considerable influence on the accuracy of classification. Usually, the yarn-dyed plaid is divided into five types: windowpane, color block, college, Prince of Wales, and houndstooth. The classifications developed over the history of plaid fabrics through the efforts of fabric design engineers and subject-matter experts. These five types include 95% of all YDPFs. This paper reports on the screening and labeling of 10,661 collected images by five experts with extensive experience in the field. Images other than YDPFs were removed, and the remainder were classified into five types. The labeling process includes task distribution, task recovery, and result optimization. A program was used to obtain most of the labeling results from the five experts after result optimization. Examples of the five types of YDPF are shown in Fig. 1. Table 1 presents the number of images used for each of the five types.

Figure 1: The examples of five types of YDPF (a) Windowpane (b) Color block (c) College (d) Prince of wales (e) Houndstooth
The characteristics of the five types of YDPF are as follows:
Windowpane fabric is woven in two parallel lines across the horizontal and the vertical to
form a large grid like a divided window frame.
Color block fabric is based on two or three colors, and the thicknesses of the horizontal and
vertical stripes usually equal or nearly equal in width and separation.
College pattern is formed by the combination of color blocks and lines.
Prince of Wales indicates a particular cross square.
Houndstooth, also known as dog's teeth, is woven by the arrangement of fine patterns.

4 Deep Neural Network with Strip Pooling Model for YDPF Image Classification
Section 4.1 describes the proposed DNN framework with strip pooling for YDPF image classification. The details of two optimization techniques with transfer learning and data augmentation are provided in Sections 4.2 and 4.3, respectively.
We first built DNNs specifically for classifying YDPF images. Given the horizontal and vertical crisscross of the YDPF pattern, an SPM was added to the standard CNN to extract the horizontal and vertical local detail features to improve classification.
4.1.1 Strip Pooling Module for YDPF Image Classification
Unlike conventional spatial pooling, the strip pooling layer extracts the local detail features along the horizontal or vertical directions in the YDPF image more easily, establishing remote dependencies between the area of discrete distribution and the strip shape's encoding area due to its long, narrow core shape. The schematic diagram of the SPM for YDPF image classification is shown in Fig. 2.

Figure 2: The schematic diagram of the strip pooling module
The details of the strip pooling module for YDPF image classification are as follows. If x is the input:
The final output is
where
Compared to attention-based modules, much computing power is required to establish a relationship between each pair of locations. A lightly weighted SPM can be easily embedded into any building block to capture remote spatial dependencies and leverage interchannel dependencies.
4.1.2 Deep Neural Network with Strip Pooling for YDPF Image Classification
This study added an SPM to the CNN networks for YDPF image classification to improve performance.
The strip pooling layer is the optimization layer that enhances feature representation. Specifically, the corresponding averaging operation is applied to each row and column of the previous layer's feature map input to fuse the horizontal features for each row and the vertical features for each column. Small convolution and normalization operations adjust the averaging of each row and column to obtain better back-propagation training. Then, the adjusted averaging of each row and column is extended in two dimensions, copying multiple rows to the same size with the original feature map and copying multiple columns to the same size with the original feature map. The two extension feature maps are then added to find the global features. After a ReLU activation, the obtained feature map is sent to the sigmoid function to obtain the probability; the higher the probability, the more prominent the feature. This probability is multiplied by the original feature map, and the output feature map would more likely determine long, narrow features. The improved architecture is shown in Fig. 3.

Figure 3: The schematic diagram of a deep neural network with SPM Note: Class A, Class B, Class C, Class D, and Class E correspond to the windowpane, color block, college, Prince of Wales, and houndstooth patterns, respectively. SPM is the strip pooling model.
In this paper, we use transfer learning on the small YDPF dataset. The CNNs were initialized using the pretrained weights of the networks on ImageNet.
The last fully connected layer, which classified the images into ImageNet classes, was removed in each network; then, two FC layers were added to each model. The ReLu layer followed the first fully connected layer; then, the softmax layer followed the second fully connected layer with five neurons (the classes in the YDPF dataset). We trained only the last two FC layers; we froze the other layers.
From the previous labeling result, the YDPF image dataset became too small to achieve good generalization for CNN-based models. An imbalance also existed between the categories within the dataset, but it could be overcome by data augmentation. With random zoom, rotation, shift, and horizontal flip, each category is expanded to 3500 pieces for the YDPF image dataset.
Since there was no research on classifying YDPF images using CNNs, we needed to build a CNN structure for yarn-dyed plaid image classification first. The software and hardware details of the experiment and the evaluation metric are given in Section 5.1. With different hyperparameter groups, the most promising CNNs, VGG, ResNet, and DenseNet, are described in detail in Section 5.2. In Section 5.3, the effectiveness of the proposed method with SPM is compared with the original network without SPM.
We implemented all the experiments in Python with the Tensorflow 1.13 package on a computer with an Intel i9 9300 K CPU, an NVIDIA RTX TITAN GPU, 32 Gb memory, and the Ubuntu 18.01 OS.
This paper employs accuracy to evaluate the classification of YDPF images. The values ranged from [0,1]. The higher values of this coefficient mean that the classification by the model is highly accurate. Accuracy was defined as the ratio of the number of correct decisions to the total number of decisions. The number of correct decisions was (TP + TN), and the total number of decisions was (TP + TN + FP + FN); so, we have
where TP is the true positive, in which the positive example is correctly judged. FP refers to the false positive, in which the positive example is incorrectly judged. TN refers to the true negative, in which a negative example is correctly judged, and FN refers to the false negative, in which a negative example is incorrectly judged.
5.2 Classification of the YDPF Images with the Most Promising CNNs
The most promising CNNs, VGG, ResNet, and DenseNet, were evaluated using the YDPF dataset discussed in this subsection. The paper presents the results of the analysis to find the optimal networks for YDPF image classification.
Specifically, we considered different network depths for VGG with 11 and 16 layers, ResNet with 18 and 152 layers, and DenseNet with 121 and 169 layers; so, six CNN models (VGG11, VGG16, ResNet-18, ResNet-152, DenseNet-121, and DenseNet-169) were evaluated. Learning models were trained with the labeled data from the YDPF dataset. We distributed 80% of the data as the training set for each learning model, leaving 20% of the data as the testing set for testing. By the model pretrained on ImageNet, transfer learning was used to initialize the previous convolutional layer. A batch size of 16, 32, 64, and 128 and a learning rate of 0.00005 and 0.0001 were used for the six CNNs. We used the Adam optimizer. For each group of parameters, three experiments were conducted to obtain the average value. Table 2 presents the accuracies obtained by VGG11, VGG16, ResNet-18, ResNet-152, DenseNet-121, and DenseNet-169 with the best hyperparameters on the YDPF dataset; the best results are shown in bold. The hyperparameters for each best performing CNN are presented in Table 3.


As shown in Table 2, ResNet-18 outperforms the other CNN models with an accuracy of 90.90%, a 4.82% improvement over VGG11, which has a poorer performance of 86.08%. VGG16 and DenseNet 121 achieve comparable accuracies, and they outperform VGG11 by more than 3%. The results also show that ResNet-18, a simple network, had better results than ResNet-152 or DenseNet-169 with more complex networks on the YDPF dataset. With an overall accuracy of 88.78%, it is proved that CNNs can be effective in YDPF image classification tasks.
As shown in Table 3, the CNNs had similar execution times for the training. The hyperparameter groups’ results show that smaller batch sizes, more network depth, and larger epoch numbers require longer execution times. In addition, with the same hyperparameters, DenseNet169 with a complex network takes a little more time. The optimal VGG, ResNet, and DenseNet for the YDPF image classification are VGG16 with learning rate 0.00005 and Batchsize16, ResNet18 with Batchsize 16 and learning rate 0.0001, and DenseNet121 with Batchsize16 and learning rate 0.00005, respectively. Table 4 presents the accuracy of each class (windowpane, color block, college, Prince of Wales, and houndstooth) from the optimal networks.

Table 4 shows that, although the overall accuracy was higher, the windowpane accuracy was low, with 81.21% for ResNet18%, 80.26% for VGG16%, and 80.01% for DenseNet121. From an analysis of the misclassified images, we found that windowpane was always incorrectly classified as Prince of Wales, which might be due to the local detail features of windowpane and Prince of Wales not being fully learned. The networks need to be improved to enhance the local detail extraction.
5.3 Classification of the YDPF Images with SPM
‘Yarn-dyed plaid’ refers to a fabric of colored yarns interwoven horizontally and vertically, such as windowpane, color block, college, Prince of Wales, and houndstooth. For this visual feature, SPM, which performs pooling horizontally or vertically, is added to the CNNs to extract the corresponding local detail features of the YDPF image successfully.
Unlike the pooling of two-dimensional averages, strip pooling averages all eigenvalues in the horizontal or vertical directions, considering them as narrow or long range, rather than applying them to the entire feature graph, thus avoiding making the most unnecessary distant connections. Considerable computation is required to establish relationships for each pair of locations in attention-based modules. However, a lightly weighted SPM can be easily embedded into the building block to promote the ability to capture the dependencies.
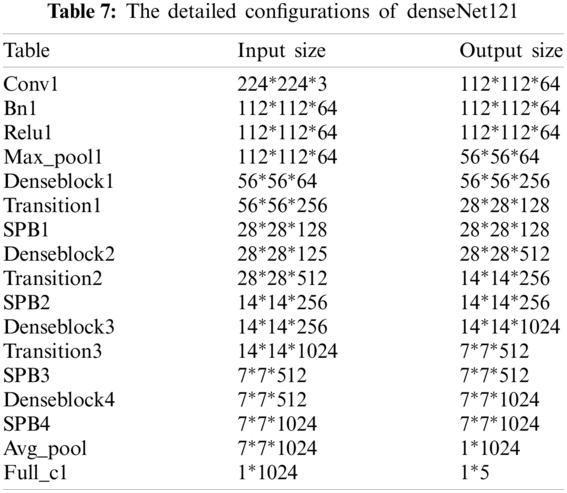
This paper adds an SPM to the three earlier optimized CNNs (ResNet18, VGG16, and DenseNet121) for superior performance in YDPF image classification. Tables 5–7 present the detailed configurations of each deep neural network with SPM for YDPF image classification.


The results of the proposed method with an SPM on ResNet18, VGG16, and DenseNet121 are presented in Table 8. The best results are in bold.
From Table 8, it can be seen that our proposed method with an SPM improves performance by 2.64% for ResNet18, by 3.66% for VGG16, and by 3.54% for DenseNet121 on the YDPF dataset over the previous original optimized CNNs. This result reveals that an SPM improves YDPF classification accuracy. Moreover, ResNet18 still performs best with an accuracy of 93.54%, while VGG16 and DenseNet121 are slightly weaker. Furthermore, the SPM has the most noticeable improvement for VGG16, with a 3.66% promotion.

Meanwhile, the accuracy of each class (windowpane, color block, college, Prince of Wales, and houndstooth) from the proposed networks with strip pooling is shown in Table 9.

Compared the results of the five classes for the YDPF image in Tables 4 and 9, with our proposed networks with an SPM, the windowpane accuracy was improved by 2.84% for ResNet18 from 81.21% to 84.05%, by 8.59% for VGG16 from 80.26% to 88.85%, and by 5.05% for DenseNet121 from 80.01% to 85.06%. This result demonstrates the effectiveness of an SPM in extracting local detail features along the horizontal or vertical directions. Note that the accuracy of windowpanes was greatly improved on VGG16.
Currently, the classification and search of historical production data for YDPFs do not satisfy the visual needs of sample order production, fabric design, and stock management, which can be solved by image classification. However, there is no research on the classification of YDPFs, a YDPF image dataset, or the use of convolutional neural networks.
This study collected 10,661 fabric samples to create a YDPF image dataset, which has significant potential for related research on YDPF, using the five plaid types of windowpane, color block, college, Prince of Wales, and houndstooth. With an overall accuracy of 88.78%, CNNs proved effective in YDPF image classification. ResNet-18 outperforms the rest of the CNN models with an accuracy of 90.90%. Even for the low-accuracy windowpane pattern, traditional CNNs were also improved by adding an SPM to extract the local horizontal or vertical detail features of the YDPFs. Compared with the CNNs without an SPM, the improvement was noted: 2.64% for ResNet18%, 3.66% for VGG16%, and 3.54% for DenseNet121. The proposed CNNs with an SPM achieved a better classification effect. Windowpane accuracy also greatly improved, by 2.84% for ResNet18, by 8.59% for VGG16, and by 5.05% for DenseNet121, which further proves the effectiveness of the SPM for YDPF image classification.
Funding Statement: This work was supported by China Social Science Foundation under Grant [17CG209]; The fabric samples were supported by Jiangsu Sunshine Group and Jiangsu Lianfa Textile Group.
Conflicts of Interest: The authors declare that they have no conflicts of interest to report regarding the present study.
1. Dalal, N., Triggs, B. (2005). Histograms of oriented gradients for human detection. IEEE Computer Society Conference on Computer Vision and Pattern Recognition, vol. 1, pp. 886–893. San Diego, USA, IEEE. DOI 10.1109/CVPR.2005.177. [Google Scholar] [CrossRef]
2. Lowe, D. G. (1999). Object recognition from local scale-invariant features. Proceedings of the Seventh IEEE International Conference on Computer Vision, vol. 2, pp. 1150–1157. Kerkyra, Greece, IEEE. DOI 10.1109/ICCV.1999.790410. [Google Scholar] [CrossRef]
3. Ojala, T., Pietikainen, M., Maenpaa, T. (2002). Multiresolution gray-scale and rotation invariant texture classification with local binary patterns. IEEE Transactions on Pattern Analysis and Machine Intelligence, 24(7), 971–987. DOI 10.1109/TPAMI.2002.1017623. [Google Scholar] [CrossRef]
4. Noble, W. S. (2006). What is a support vector machine? Nature Biotechnology, 24(12), 1565–1567. DOI 10.1038/nbt1206-1565. [Google Scholar] [CrossRef]
5. Pavlov, Y. L. (2000). Random forests. Probabilistic methods in discrete mathematics, pp. 11–18. De Gruyter. DOI 10.1515/9783110941975. [Google Scholar] [CrossRef]
6. Kramer, O. (2013). Dimensionality reduction with unsupervised nearest neighbors, pp. 13–23. Berlin: Springer. [Google Scholar]
7. He, K. M., Zhang, X. Y., Ren, S. Q., Sun, J. (2016). Deep residual learning for image recognition. IEEE Conference on Computer Vision and Pattern Recognition, pp. 770–778. Las Vegas, USA, IEEE. DOI 10.1109/CVPR.2016.90. [Google Scholar] [CrossRef]
8. Miramontes-de Leon, G., Valdez-Cepeda, R. D. (2011). Assessment in subsets of MNIST handwritten digits and their effect in the recognition rate. Journal of Pattern Recognition Research, 2(2), 244–252. DOI 10.13176/11.348. [Google Scholar] [CrossRef]
9. Krizhevsky, A., Sutskever, I., Hinton, G. E. (2012). Imagenet classification with deep convolutional neural networks. Proceedings of the 25th International Conference on Neural Information Processing Systems, vol. 1, pp. 1097–1105. USA: Curran Associates Inc. [Google Scholar]
10. Jiang, A. B., Wang, W. W. (2018). Research on optimization of ReLU activation function. Transducer and Microsystem Technologies, 37(2), 50–52. DOI 10.13873/J.1000-9787(2018)02-0050-03. [Google Scholar] [CrossRef]
11. Simonyan, K., Zisserman, A. (2014). Very deep convolutional networks for large-scale image recognition. https://arxiv.org/pdf/1409.1556.pdf. [Google Scholar]
12. Huang, G., Liu, Z., van der Maaten, L., Weinberger, K. Q. (2017). Densely connected convolutional networks. IEEE Conference on Computer Vision and Pattern Recognition, pp. 4700–4708. Honolulu, USA, IEEE. DOI 10.1109/CVPR.2017.243. [Google Scholar] [CrossRef]
13. Teramoto, A., Yamada, A., Kiriyama, Y., Tsukamoto, T., Yan, K. et al. (2019). Automated classification of benign and malignant cells from lung cytological images using deep convolutional neural network. Informatics in Medicine Unlocked, 16, 100205. DOI 10.1016/j.imu.2019.100205. [Google Scholar] [CrossRef]
14. Zarie, M., Jahedsaravani, A., Massinaei, M. (2020). Flotation froth image classification using convolutional neural networks. Minerals Engineering, 155, 106443. DOI 10.1016/j.mineng.2020.106443. [Google Scholar] [CrossRef]
15. Gómez-Ríos, A., Tabik, S., Luengo, J., Shihavuddin, A. S. M., Krawczyk, B. et al. (2019). Towards highly accurate coral texture images classification using deep convolutional neural networks and data augmentation. Expert Systems with Applications, 118, 315–328. DOI 10.1016/j.eswa.2018.10.010. [Google Scholar] [CrossRef]
16. Wang, X. X., Chen, Z., Liu, G. H., Wan, Y. (2017). Fiber image classification using convolutional neural networks. 4th International Conference on Systems and Informatics, pp. 1214–1218. Hangzhou, China, IEEE. DOI 10.1109/ICSAI.2017.8248470. [Google Scholar] [CrossRef]
17. Zhao, Y. D., Hao, K. R., He, H. B., Tang, X. S., Wei, B. (2020). A visual long-short-term memory based integrated CNN model for fabric defect image classification. Neurocomputing, 380, 259–270. DOI 10.1016/j.neucom.2019.10.067. [Google Scholar] [CrossRef]
18. Xiang, J., Zhang, N., Pan, R. R., Gao, W. D. (2021). Fabric retrieval based on multi-task learning. IEEE Transactions on Image Processing, 30, 1570–1582. DOI 10.1109/TIP.2020.3043877. [Google Scholar] [CrossRef]
19. Hou, Q. B., Zhang, L., Cheng, M. M., Feng, J. S. (2020). Strip pooling: Rethinking spatial pooling for scene parsing. IEEE/CVF Conference on Computer Vision and Pattern Recognition, pp. 4003–4012. Seattle, USA, IEEE. DOI 10.1109/CVPR42600.2020.00406. [Google Scholar] [CrossRef]
20. Deng, J., Dong, W., Socher, R., Li, L. J., Li, K. et al. (2009). Imagenet: A large-scale hierarchical image database. IEEE Conference on Computer Vision and Pattern Recognition, pp. 248–255. Miami, USA, IEEE. DOI 10.1109/CVPR.2009.5206848. [Google Scholar] [CrossRef]
 | This work is licensed under a Creative Commons Attribution 4.0 International License, which permits unrestricted use, distribution, and reproduction in any medium, provided the original work is properly cited. |