| Computer Modeling in Engineering & Sciences |
DOI: 10.32604/cmes.2022.018015
ARTICLE
Complex Network Formation and Analysis of Online Social Media Systems
Faculty of Computer Studies, Arab Open University, A'ali, Kingdom of Bahrain
*Corresponding Author: Hafiz Abid Mahmood Malik. Email: hafiz.malik@aou.org.bh
Received: 23 June 2021; Accepted: 10 September 2021
Abstract: To discover and identify the influential nodes in any complex network has been an important issue. It is a significant factor in order to control over the network. Through control on a network, any information can be spread and stopped in a short span of time. Both targets can be achieved, since network of information can be extended and as well destroyed. So, information spread and community formation have become one of the most crucial issues in the world of SNA (Social Network Analysis). In this work, the complex network of twitter social network has been formalized and results are analyzed. For this purpose, different network metrics have been utilized. Visualization of the network is provided in its original form and then filter out (different percentages) from the network to eliminate the less impacting nodes and edges for better analysis. This network is analyzed according to different centrality measures, like edge-betweenness, betweenness centrality, closeness centrality and eigenvector centrality. Influential nodes are detected and their impact is observed on the network. The communities are analyzed in terms of network coverage considering the Minimum Spanning Tree, shortest path distribution and network diameter. It is found that these are the very effective ways to find influential and central nodes from such big social networks like Facebook, Instagram, Twitter, LinkedIn, etc.
Keywords: Complex network; data extraction; nodes and edges; network visualization; social media network; main hubs; centrality measures
The recent era has marked great development in network science. Especially, after the concepts of Scale-free and Small-world models, complex systems are analyzed. The progress in network science led to the concepts of expressing complex systems in the form of networks by representing the elements/entities of the system. Network is formed with nodes, and those nodes are linked with edges. Network science has totally changed the way, where networks were looked upon providing methods and tools for modelling, analyzing and solving conventional problems. If we talk about the World Wide Web, it can be represented as a complex network considering the systems or devices as the nodes and the communication between those systems, as ‘edges’ with the frequency of communication representing weights. The robustness of the network can then be studied through dynamic processes based on network science [1,2]. Considering the Scale-free and Small-world phenomena, the social networks began to be analyzed in the context of complex networks. The users are the nodes and the edges are the relationship/friendship between those nodes in this network [3–5].
Nowadays, social media networks are very famous, a big number of people are attached with SNS (Social Networking Services); such as Twitter, Instagram, Facebook, LinkedIn, etc. While analyzing online social media systems, it is of significant practice and great concern to find out the influential nodes. Those nodes can prove to be a critical factor in assuring information spreading using limited and efficient resources [6]. In very large scale SNS such as Twitter, ranking of nodes is done based on centrality to recognize the most influential and popular nodes (users). So that, other less influential resources can connect to these highly renowned ones in lesser time, thus increasing the influence circle. These results also aid in marketing and advertisement to target the best influential users. It can get the marketing and advertisement done with fewer efforts, low cost and high coverage.
Identifying central and influential nodes in a complex network system has become one of the main problems in data mining and information retrieval [7]. Considering the increasing tendency of research in Network Science, various centrality measures were proposed to find the growth and spreading of users in a network [8]. These measures have a large variety but a few of the most used ones are Betweenness centrality measure, Degree centrality measure, Closeness centrality measure and k-shell centrality measure [9–12].
The increasing number of users and online communities in social networks has attracted large amount of research and interest of organizations. This is to discover the information dissemination patterns in large scale networks, leading to a wide range of research and much work to be done in this field. The proposition of the Small-world and Scale-free model, lead to the conceptual analysis of the complex systems, in terms of networks with certain essential characteristics. In fact, research work led to the formation of networks from almost any problem, with the basic system elements as nodes and the relation between those elements represented by edges. This could be then analyzed systematically to find the appropriate feasible solution. The edges can be used to reflect different types of relations such as, one or two-way communication and the strength of relations represented as weights. The network approach makes use of different models and methods to understand the system and propose the solution [13–15].
As the complex network approach continued to grow, numerous methods and centrality metrics have been proposed to calculate the spreading ability of users in a network [16–18]. People have worked and contributed greatly towards the network science field. When working on such large-scale networks many problems arise, such as isolated nodes that break the network, nodes that act as single means of connection between different network clusters, and elements that concentrate on more than one relationship [19,20].
In general practice, the social media analytics is based on an inherent and implicit concept of associations that is represented by metrics and network factor indicators, such as sentiment analysis, communication keywords, network reach, informational flow, brand associations, etc. [21–25].
In this study the following research patterns are utilized (3.1–3.3).
This is used to find the relational dependence among the participating instances, mostly it defines the degree of linear dependency among variables. User-Tweet network is studied by considering the influential nodes and their connections. In addition, how a tweet from a single user creates impact by dividing the network into two separate components. One of those, who support the views expressed in tweet and the other of those, who stand against it. This is found by using different algorithms and observing correlation between them [26–28]. Mathematically, correlation coefficient has been calculated by (1)
where:
x–the values of the x-variable in a sample
y–the values of the y-variable in a sample
Observational strategy is followed to model the network according to different community formation strategies and then the results are observed to deduce the best method to detect community formation in such a way that the network ensures maximum coverage and guaranteed information propagation throughout the network. The observational study focuses on drawing conclusions for the population of data by performing analysis on a sample. The graphical results are observed from different algorithms and compared in terms of network coverage, path existence from a random node to any other given random node, the weight/strength of connections etc. The observational study draws conclusions based on a random sample taken from a population where the independent variables are not controlled by the user but by the system constraints. In the User-Tweet network, we have generated graphs using different algorithms on the data and performed the observational research methodology to find the impact of different community formation algorithms [26,29].
The meta-analytic strategy focuses on identifying these features to find the ones that offer the least trade off and offer the maximum network coverage in the least possible cost, hence, providing feasible routes within the network for information propagation of desired facts, and setting trends. This is done by using statistical techniques to find estimates based on the above factors. In this way, all methods have a weighted degree average according to the individual algorithm results and they are distinguished according to the allocation of the weights [30]. Mathematical formulation is given below (2):
where:
A dataset of 5,000 tweets is gathered about an issue. From this population (5,000 tweets), 54 nodes are selected and their tweets are formed to a network. A simple ‘random sample technique’ is utilized for this purpose.
3.5 Specification Nodes and Edges
Fifty-four nodes are considered for the network and its analysis purpose. There are 669 connections between those nodes called ‘edges’. Connections are based upon the people who tweet, their followers and the ones who retweeted showing the diameter of network in which the tweet information propagated.
3.6 Weighted Degree Distribution of Nodes
The weighted degree distribution of nodes represents the sum of different weighted connections linked to a node. Table 1 is the weighted degree distribution for the studied network.
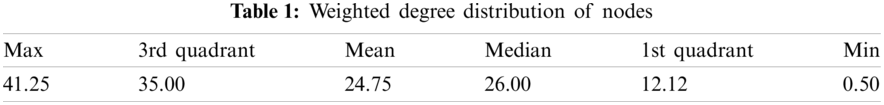
Fig. 1 makes the influential user nodes clearly visible by displaying the weighted association. The influential nodes have maximum coverage of the network with bold associations to the other user nodes. Considering the above network, it is now concerned about the centrality analysis to find further structured influence of the user nodes.
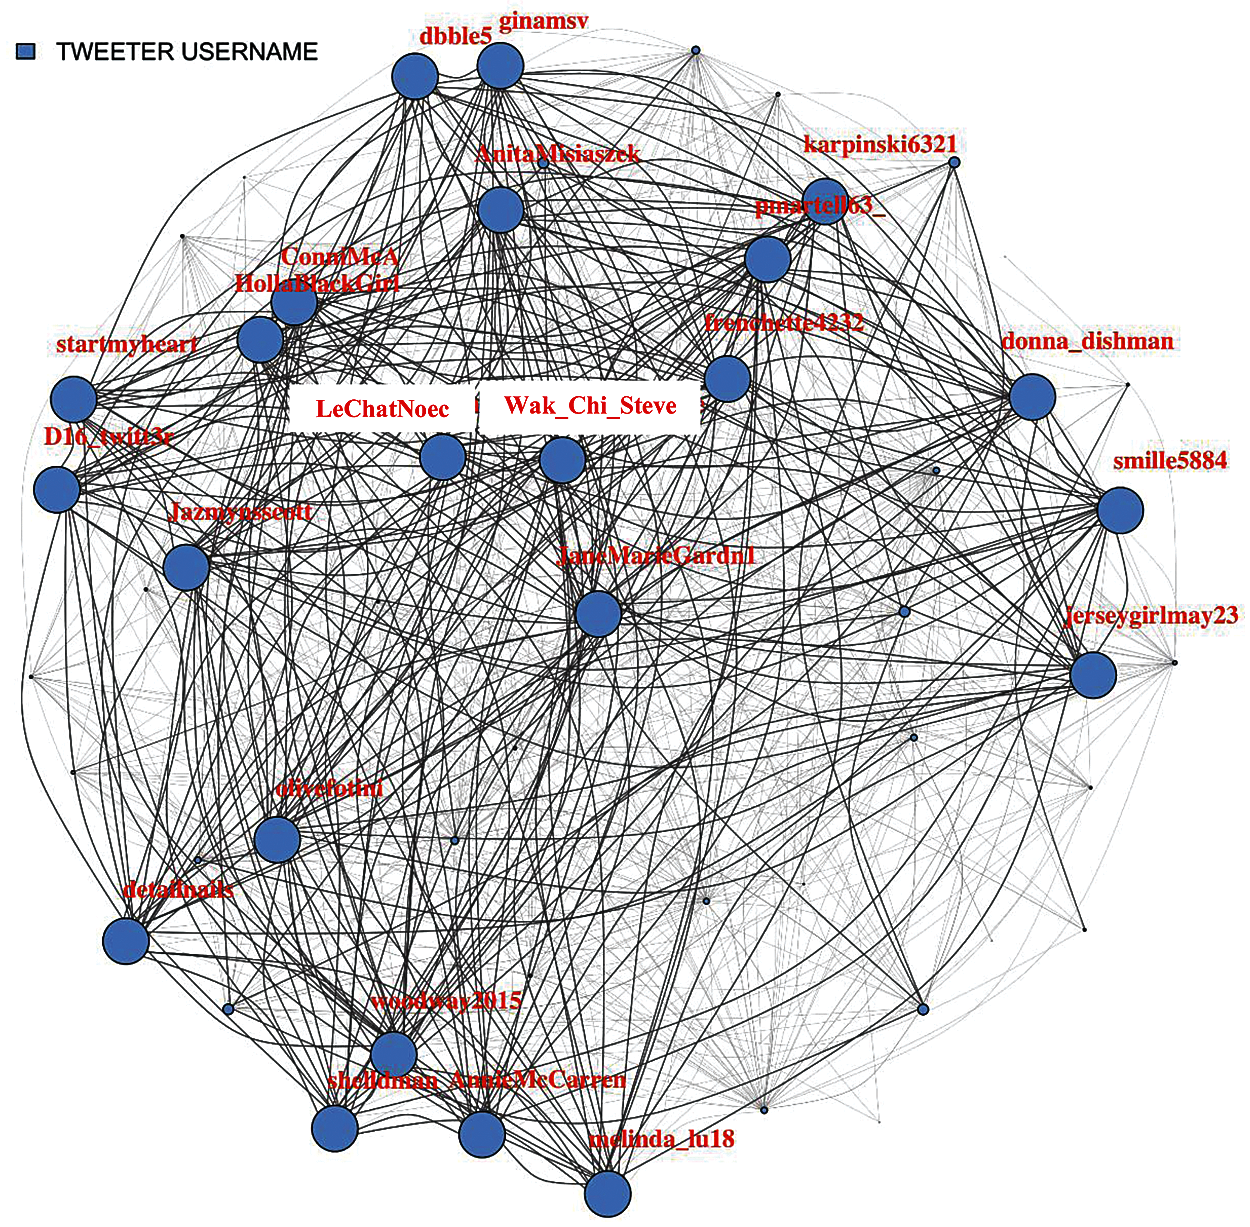
Figure 1: Tweet association network
4.2 Network Analysis: Centrality Measures
A centrality analysis is performed to find the most influential nodes. Thus, it is started by filtering out the nodes that have less coverage (not connected to maximum possible nodes in the network). Different percentages (Fig. 2 (75%), Fig. 3 (85%), Fig. 4 (95%), Fig. 5 (98%)) have been considered, up to which filtration of the network is performed to make visualization easier.
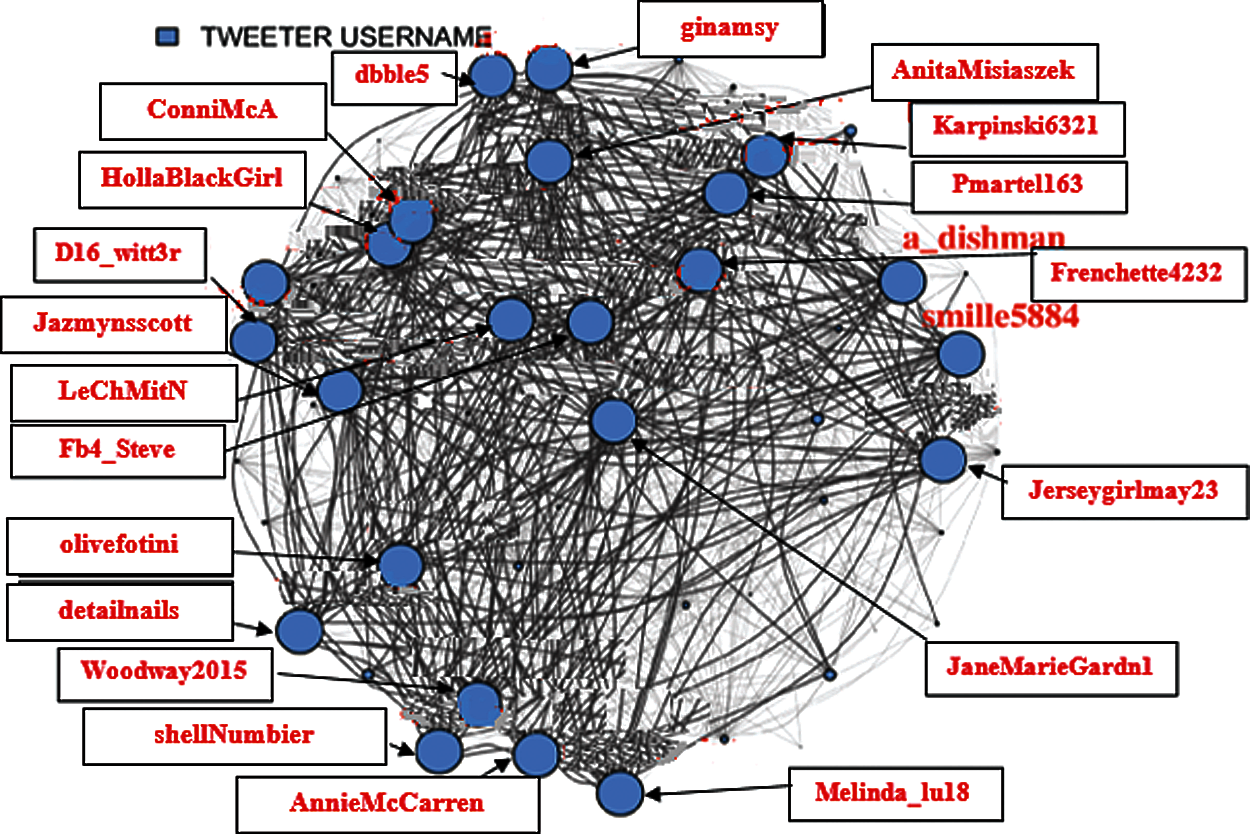
Figure 2: 75% Filtered user tweets network
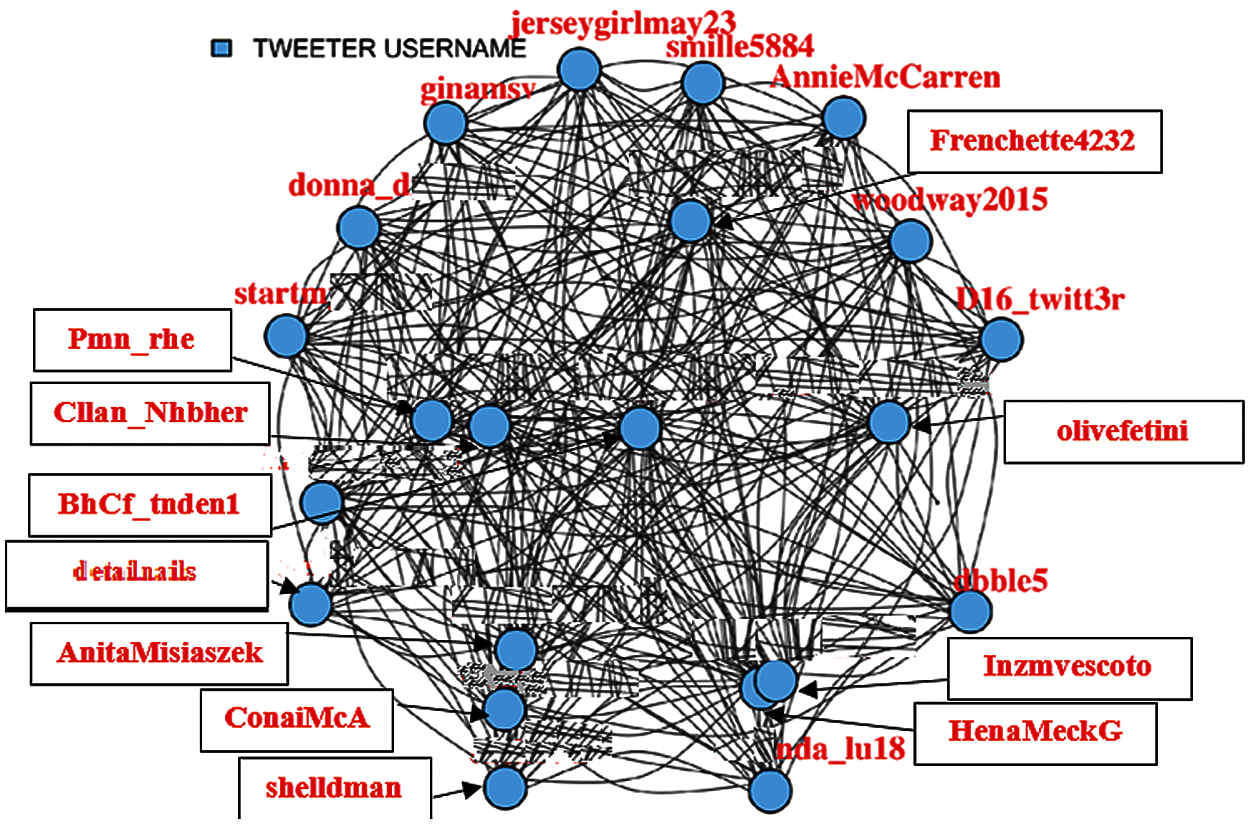
Figure 3: 85% Filtered user tweets network
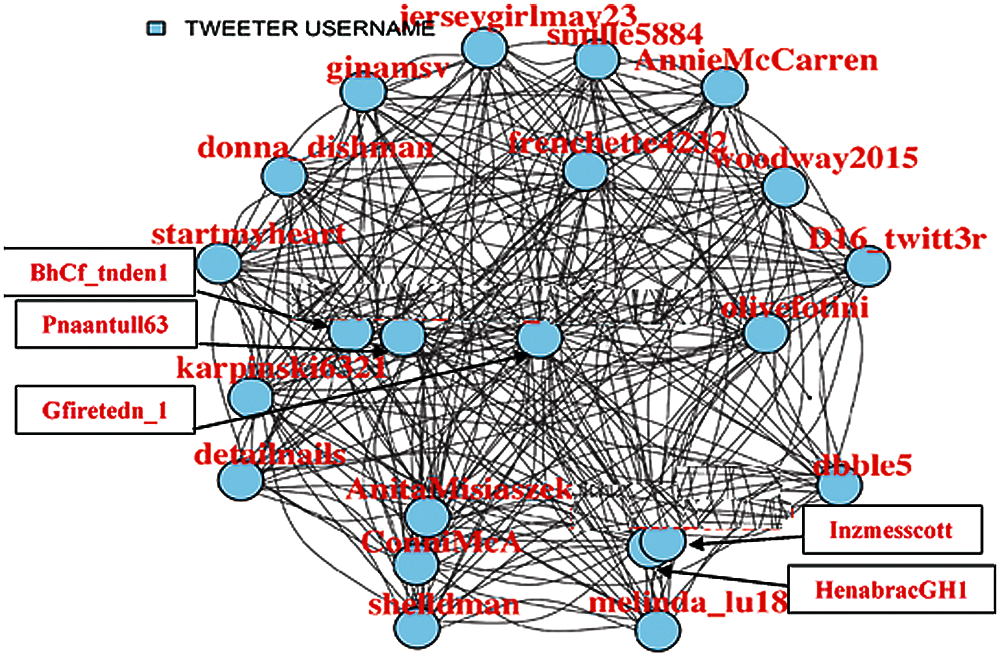
Figure 4: 95% Filtered user tweets network
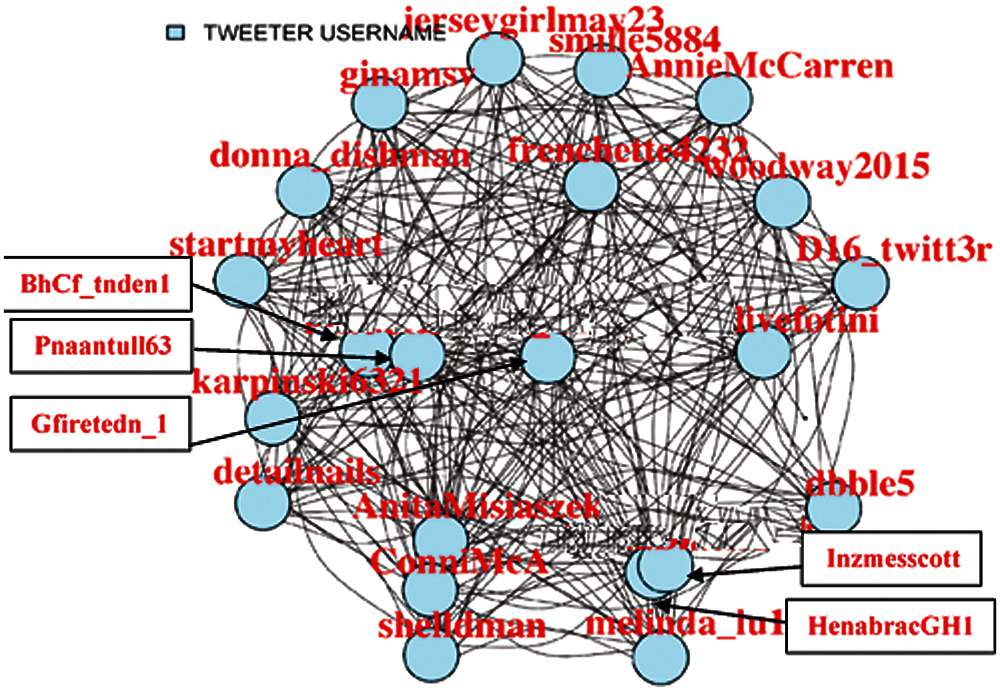
Figure 5: 98% Filtered user tweets network
In Fig. 6, user tweet network has been shown with edge size denoting degree. Here, it can be observed that how these users controlled the network.
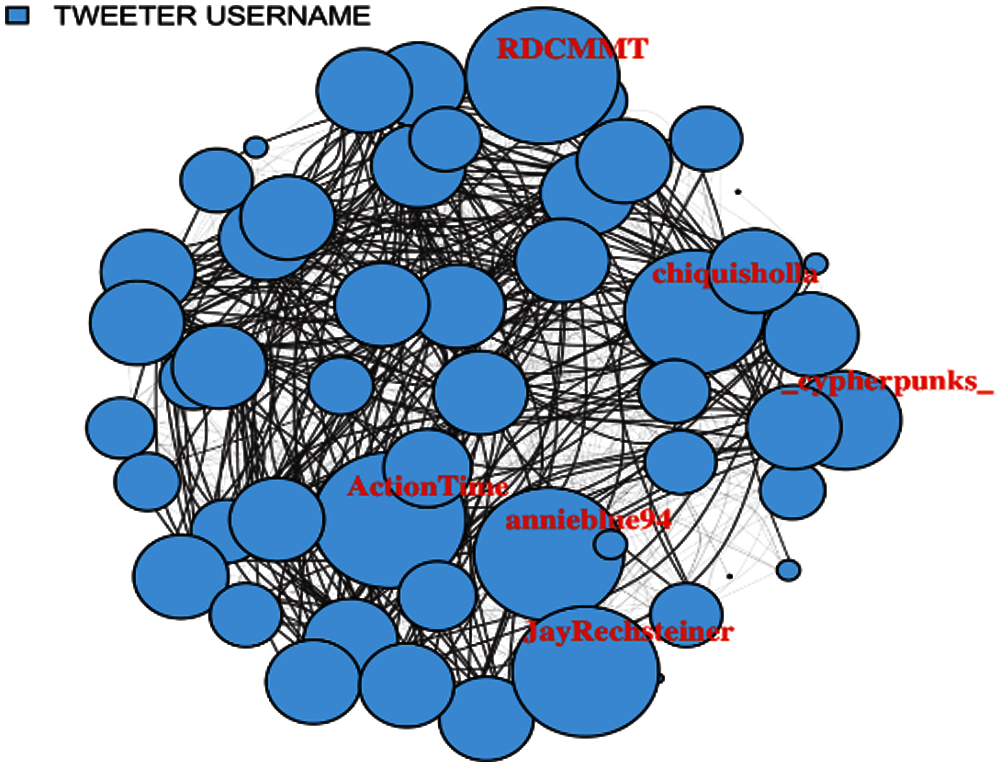
Figure 6: User tweet network with edge size denoting degree
Fig. 7 shows the user tweet network with edge size denoting the weighted degree. It be observed that these nodes have strong network.
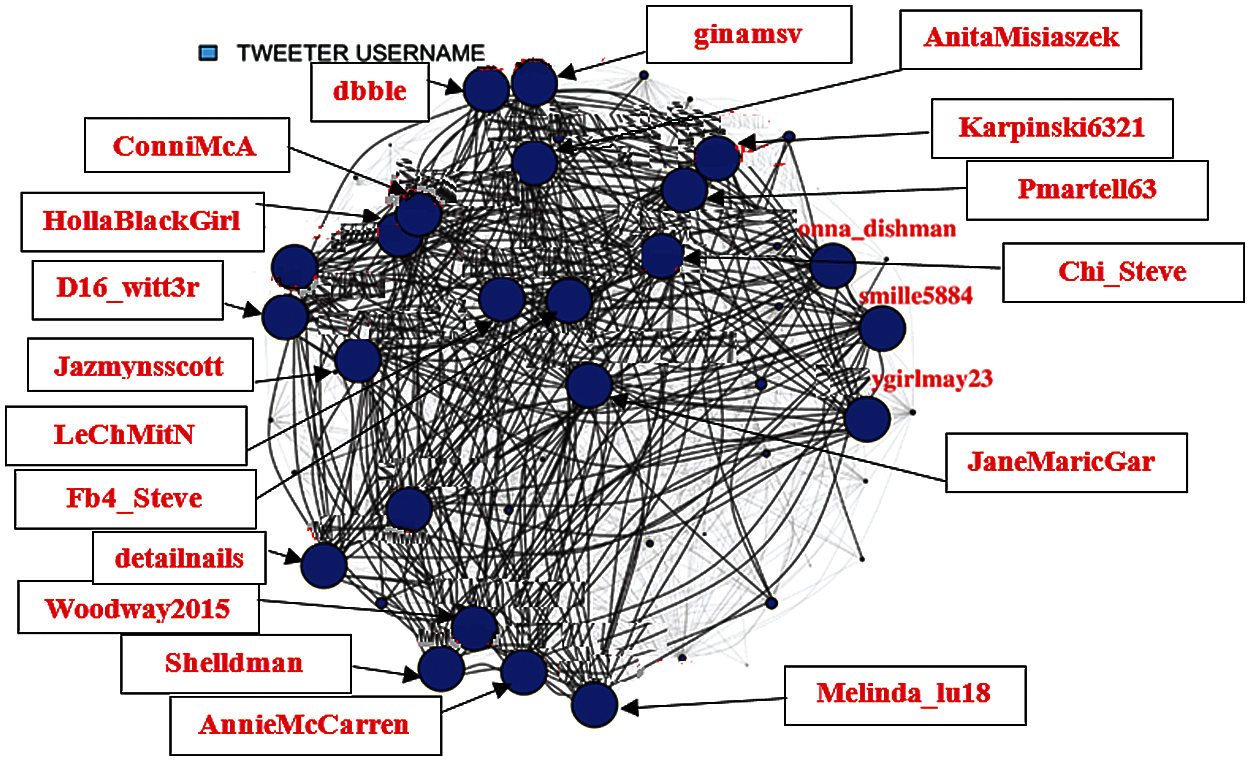
Figure 7: User tweet network with edge size denoting weighted degree
4.3 Centrality Distribution Measures
The Betweenness centrality and Edge betweenness centrality is found for the original network, which highlights the top user names. Both the measures estimate too nearly equal. Unlike this, closeness centrality is a differentiator as the paths are weighted and represent the significance in a network. Similarly, eigenvector centrality includes local clustering to compare the results of different measures used.
In Fig. 8, it can be noticed that both the betweenness and edge-betweenness measures are rigid for dense networks, that is what the original network. It is observed that in both measures, only the top few usernames stand out as outliers while remaining are nearly equal. From Fig. 9, a very strong differentiator is shown in closeness centrality, mostly since the paths are weighted paths.
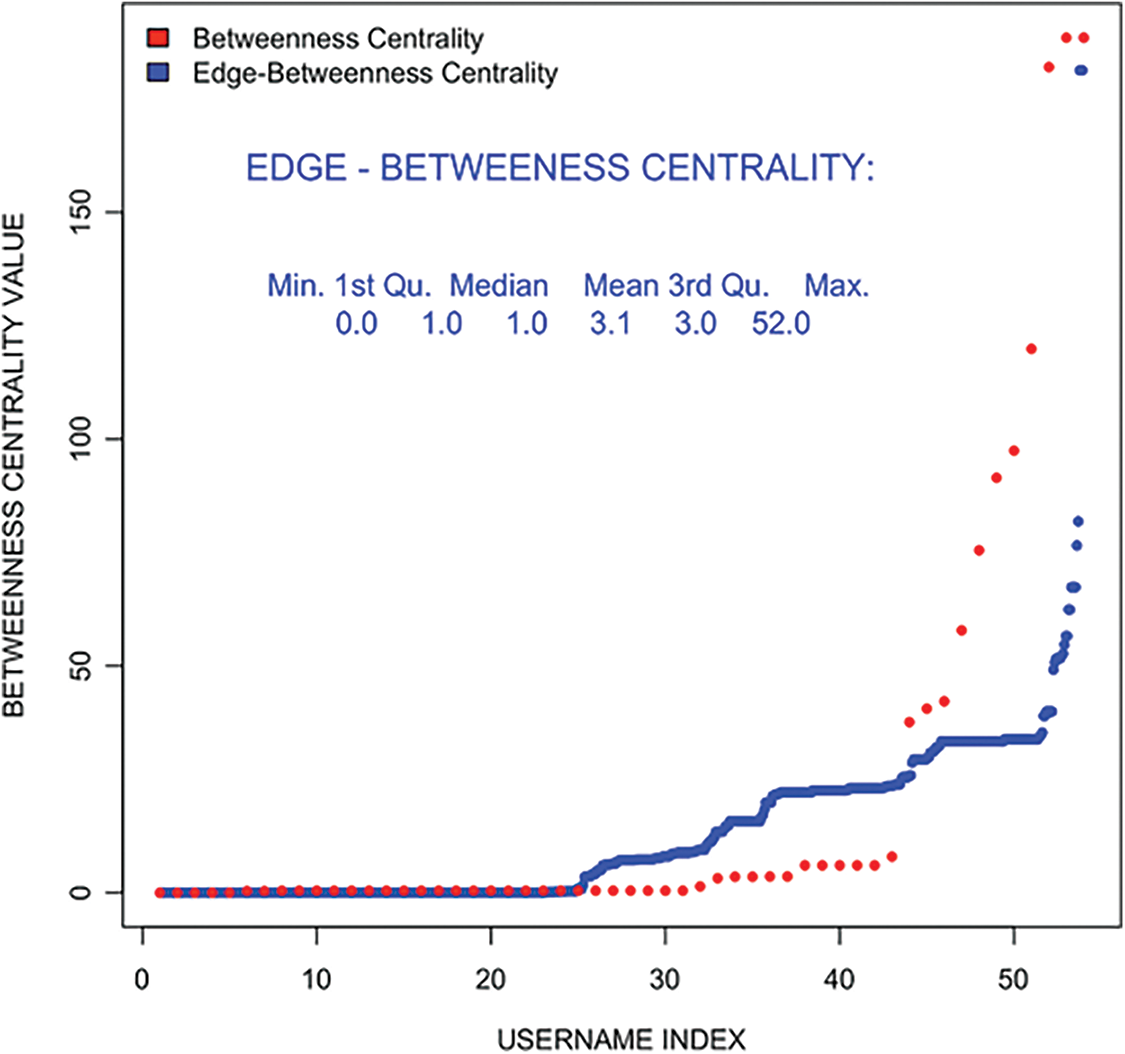
Figure 8: Edge-Betweenness and betweenness centralit–filtered user tweet network
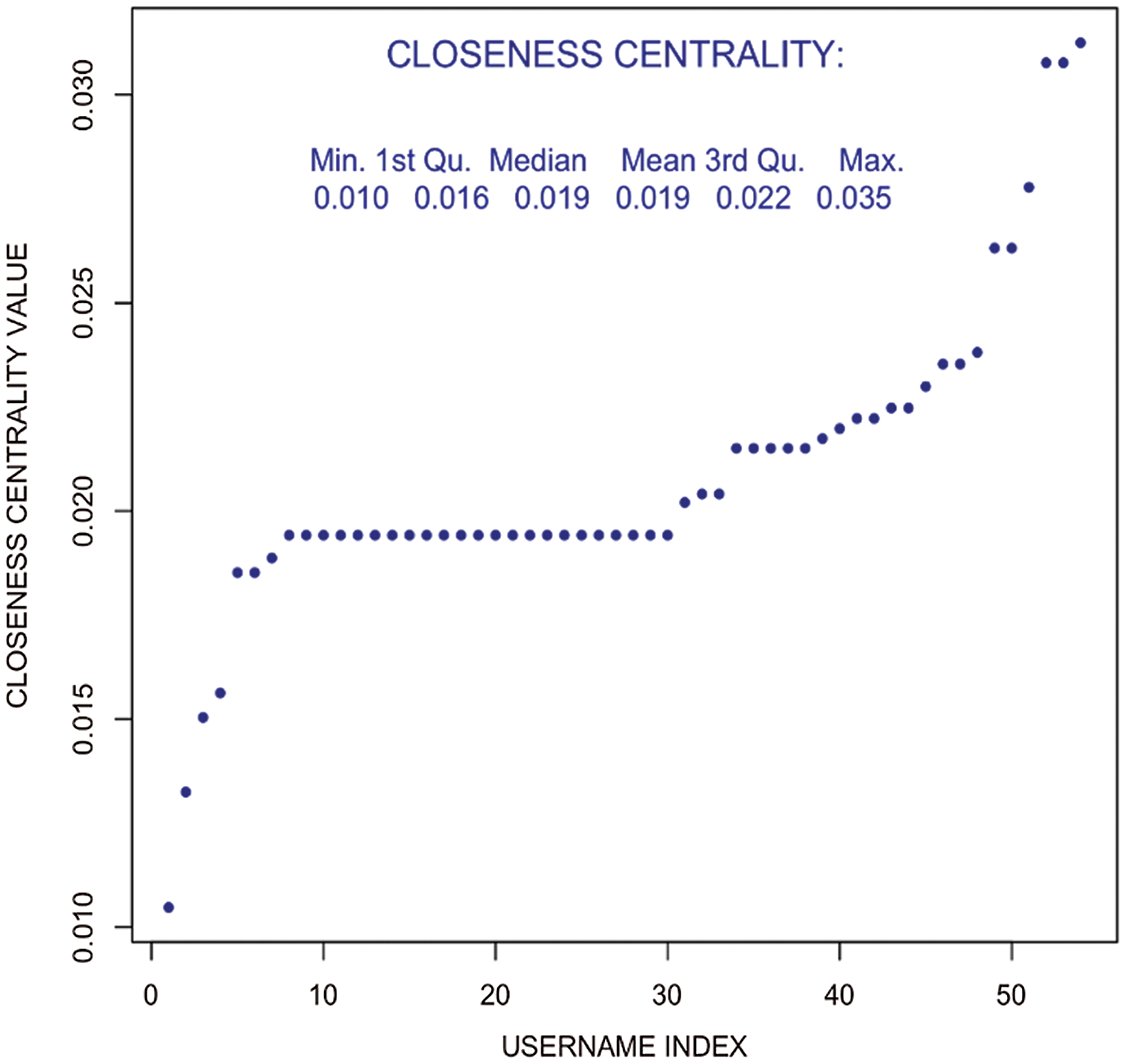
Figure 9: Closeness centrality–weighted user tweet network
In Fig. 10, Eigenvector centrality showed strong association. Furthermore, from Fig. 11 local clustering can be compared, the outcomes with other centrality measures.
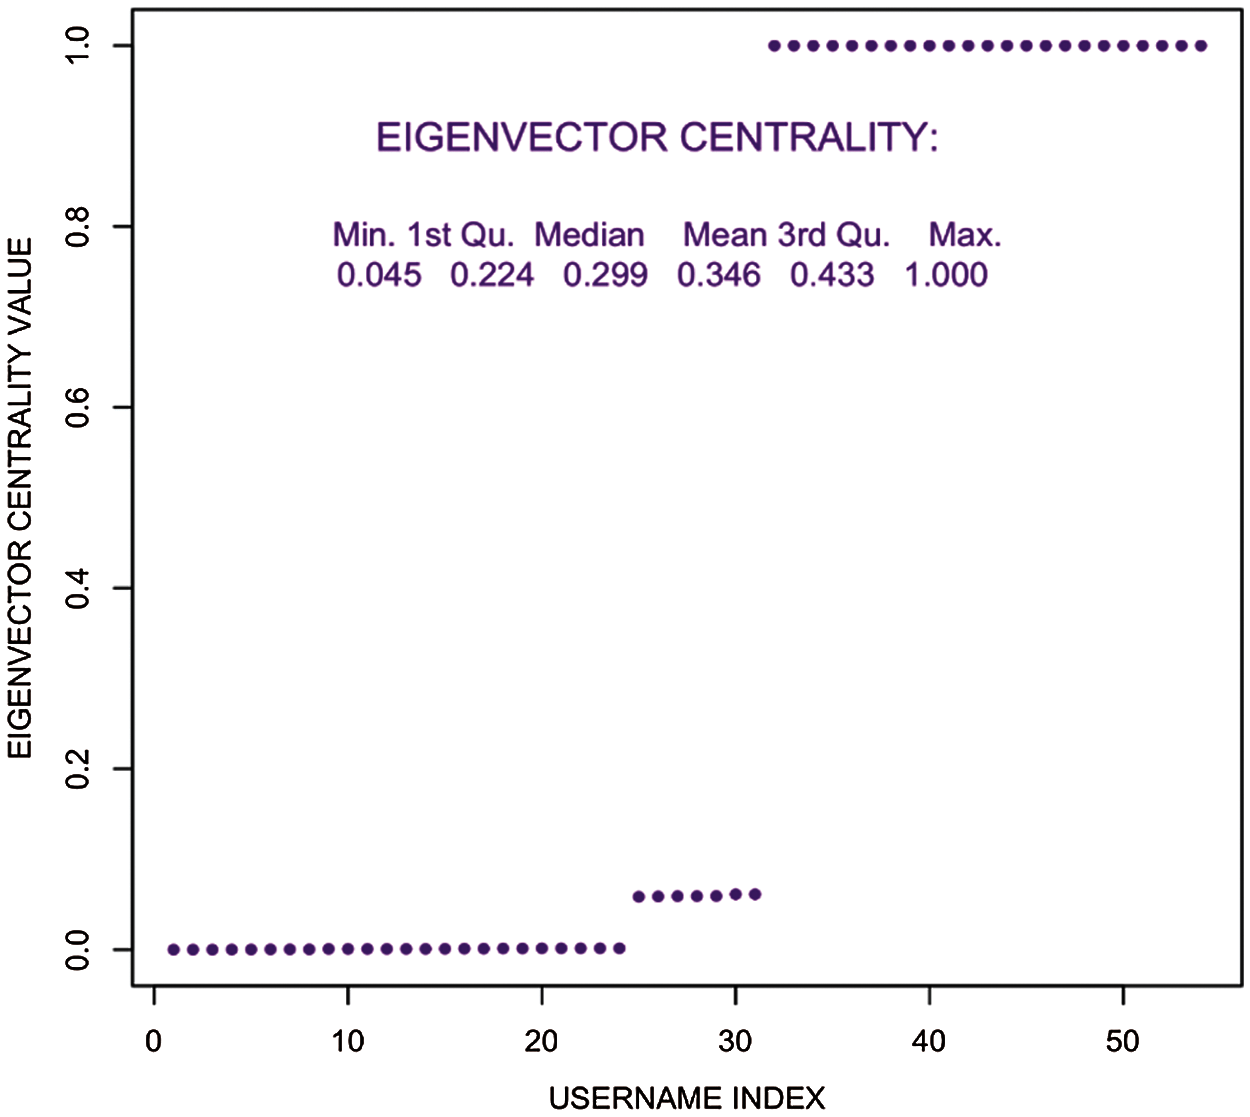
Figure 10: Eigenvector centrality distribution–user tweet association network
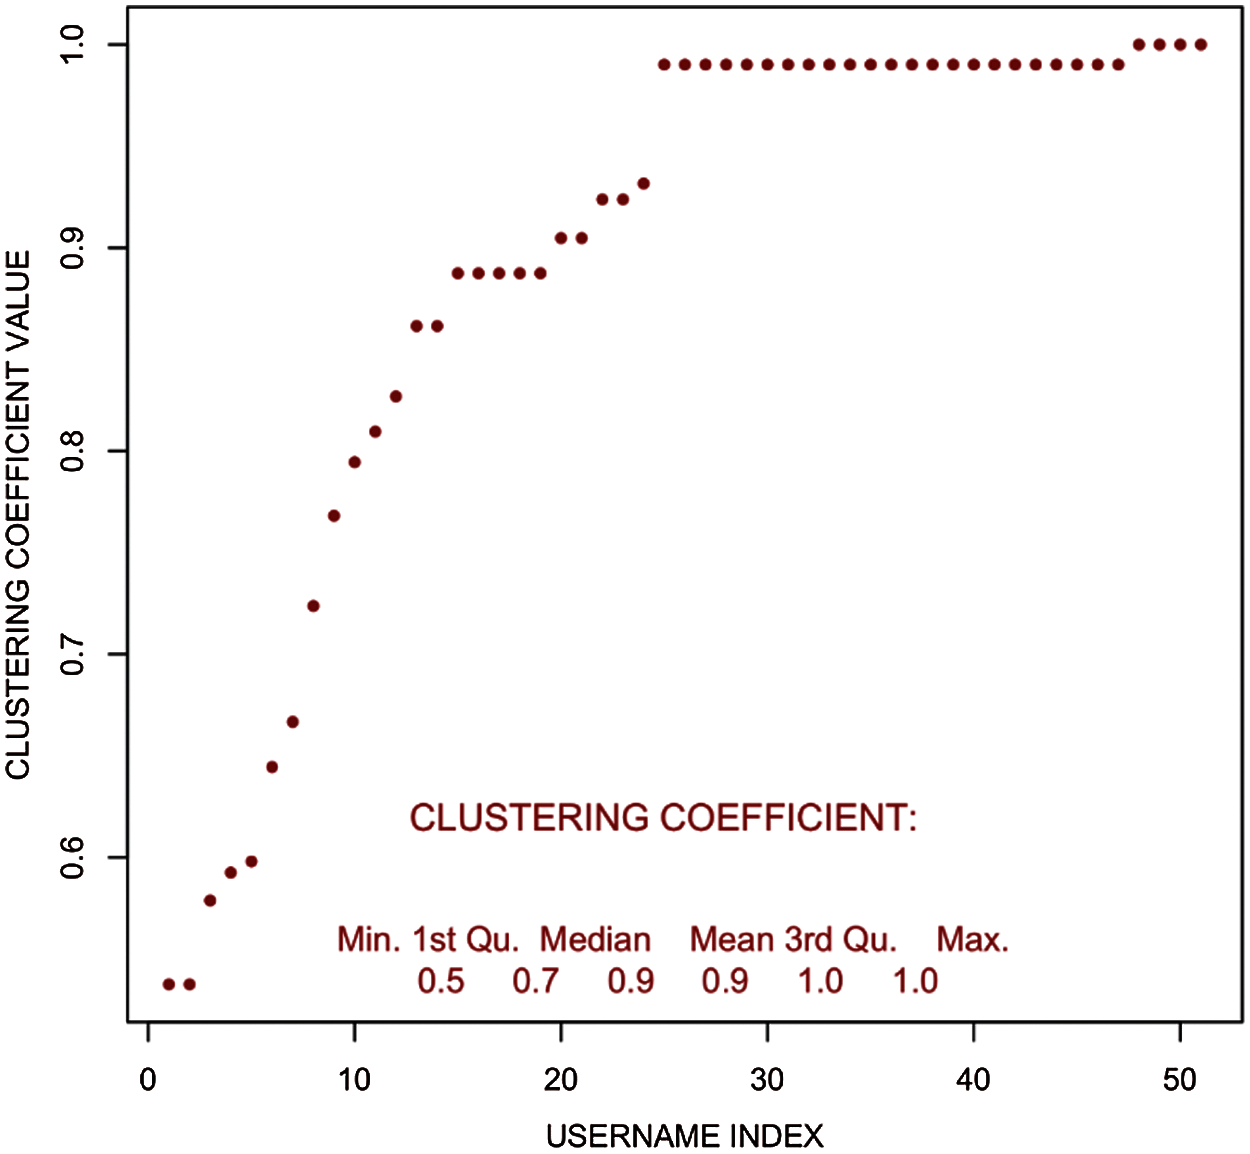
Figure 11: Clustering coefficient distribution–filtered user tweet network
In the complex network theory, the diameter is something that is described as the longest route to reach from one node to another. It is the highest weighted sum of edges going from one node to another. For this it is considered a starting node and then keep adding the edges with the highest weights and thus leading to the largest weighted edge path in the network. In Fig. 12, the diameter can be observed.
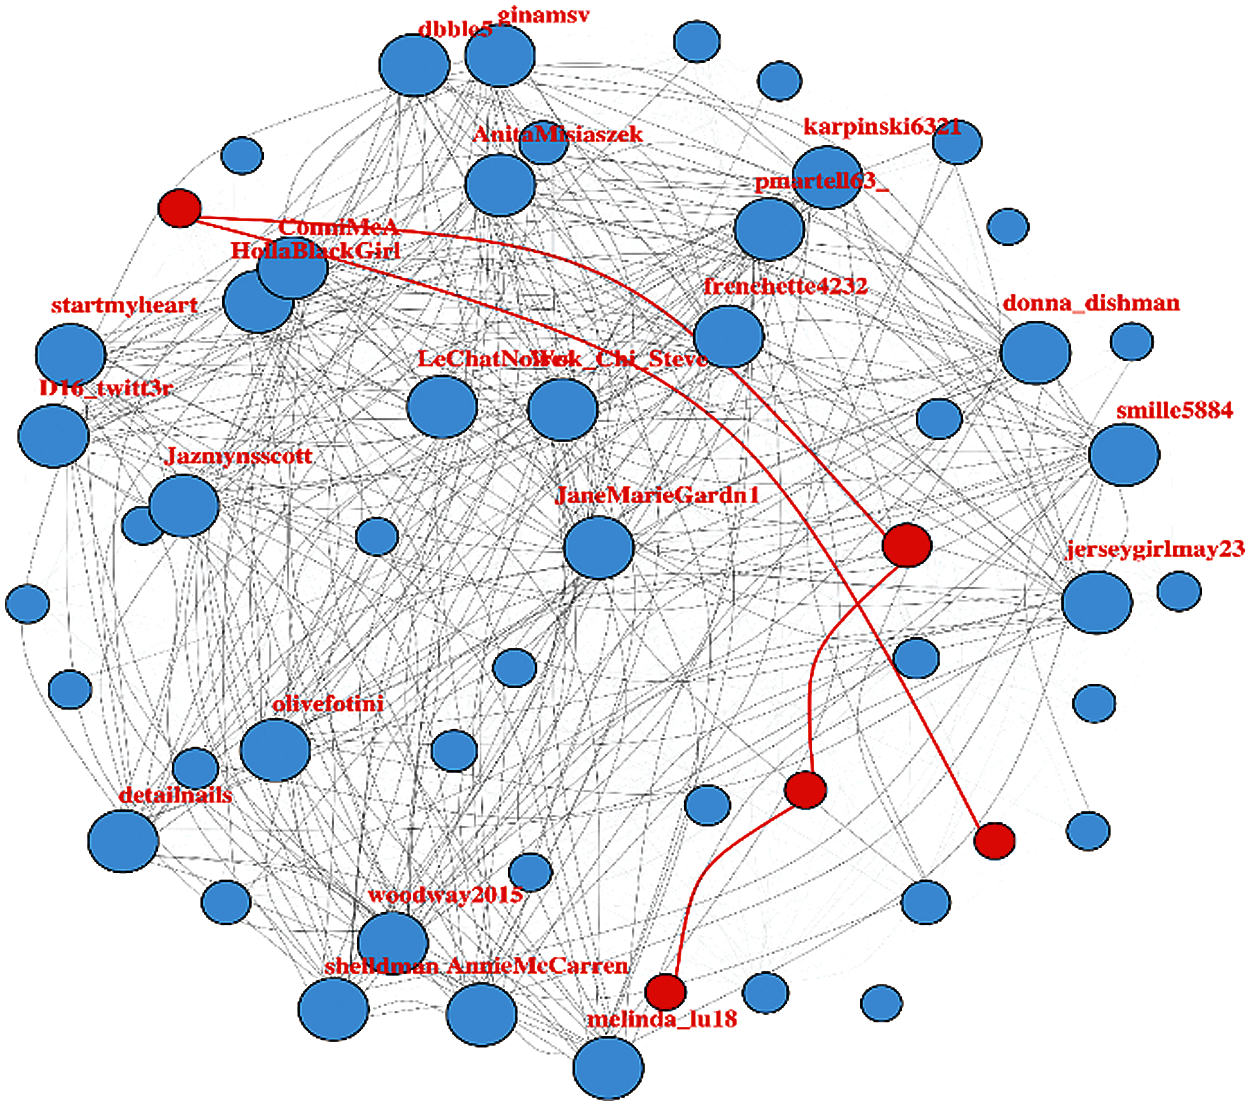
Figure 12: Weighted user tweet network with the network diameter (highlighted in red color)
Minimum spanning tree gives the concept of keeping the network connected with the minimum possible number of edges. In this way, the path cost to reach from one node to any other given node is minimized to the lowest limit possible. It has been used to determine the minimum cost of information spread throughout the network within the least time possible. This is to get the idea of how long does it take for a piece of information to propagate within a network. In any highly-connected graph, most of the edges act as essential edges and need to be present to keep the graph connected. Although the minimum spanning tree can be used to identify the spine of the network on which the whole network structure is based, these are the paths that are means of connection of different clusters within the network. Fig. 13 shows the weighted user tweet network with minimum spanning tree displayed in red color lines.
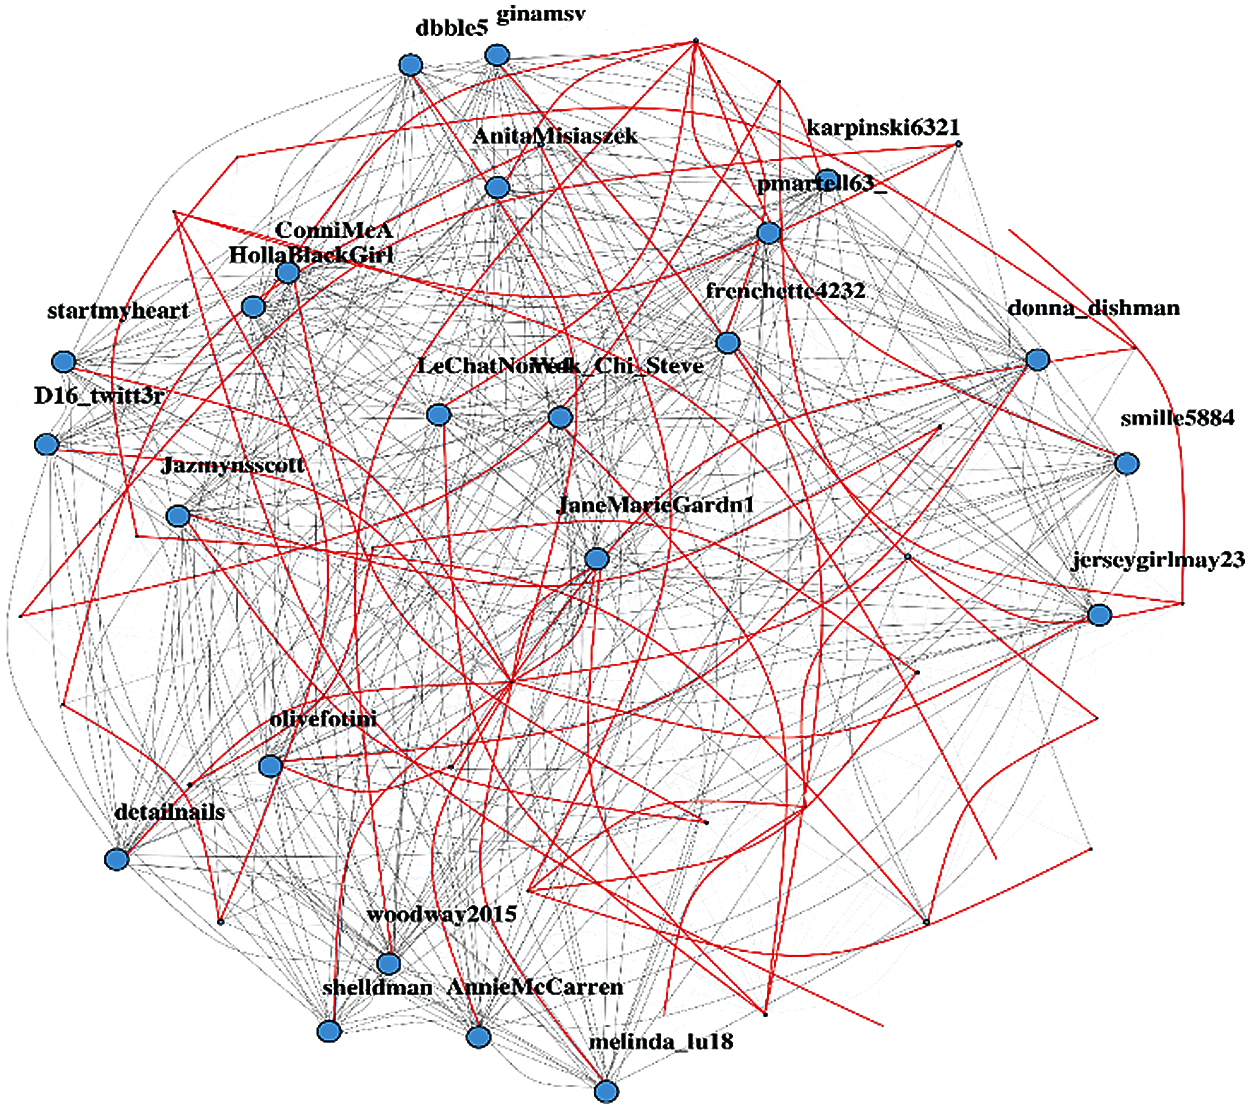
Figure 13: Weighted user tweet network with minimum spanning tree displayed in red color lines
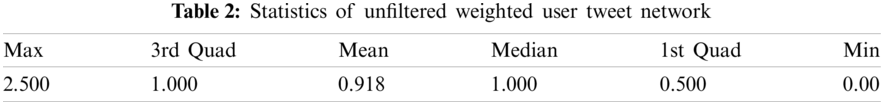
4.6 Shortest Path Distribution
To better understand the network patterns, a statistical analysis of the geodesic paths has been performed. Table 2 classifies the statistics of unfiltered weighted paths in user tweet network. Here it can be seen that minimum value is ‘0’ and the maximum distance is 2.5 mean value is 0.918 while median is 1. It defines all possible paths considering the ones connecting separate components as infinite or non-existent. It can be clearly observed from the below path length distribution that the user tweet network is a highly traversable and connected graph with almost all nodes having a direct or indirect influence on the other nodes in the network. Fig. 14 shows the different tweet network path while Fig. 15 represents path length distribution for the tweet network. In these both figures, different lengths of shortest paths can be seen.
This research clearly provides a comprehensive visualization of the social network (tweeter) formation and connectivity. The concept of graph theory, including various centrality measures (Sections 4.2, 4.3) have been utilized in this research. Using the user-tweet dataset the concept of different models (Scale-free and Small-world) and ‘minimum spanning tree’ algorithm are applied. This is to analyze the data in terms of network formation, detection, growth, network coverage and connectivity, to reach within the network. Various centrality measures are calculated and compared in the study. Diameter of the network has been calculated to see and measure the route from one node to another. Network formation for this dataset is done and the most influential nodes are successfully observed in this network analysis.
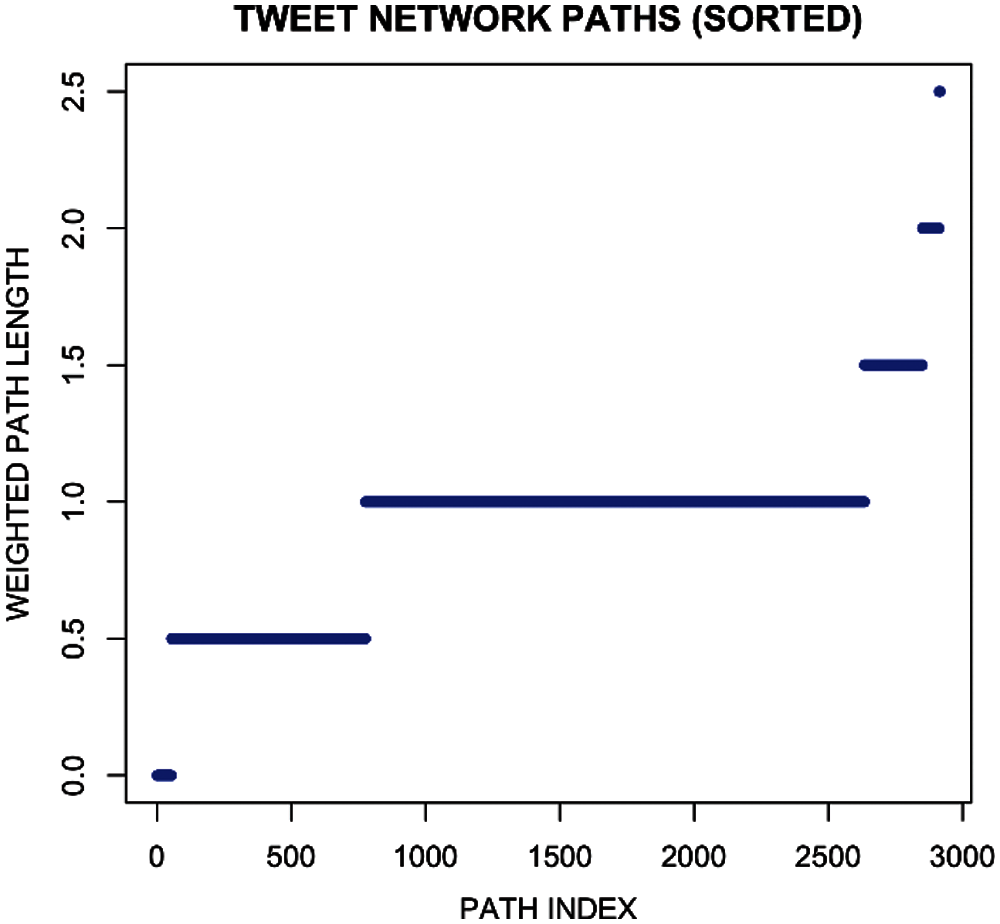
Figure 14: Tweet network paths
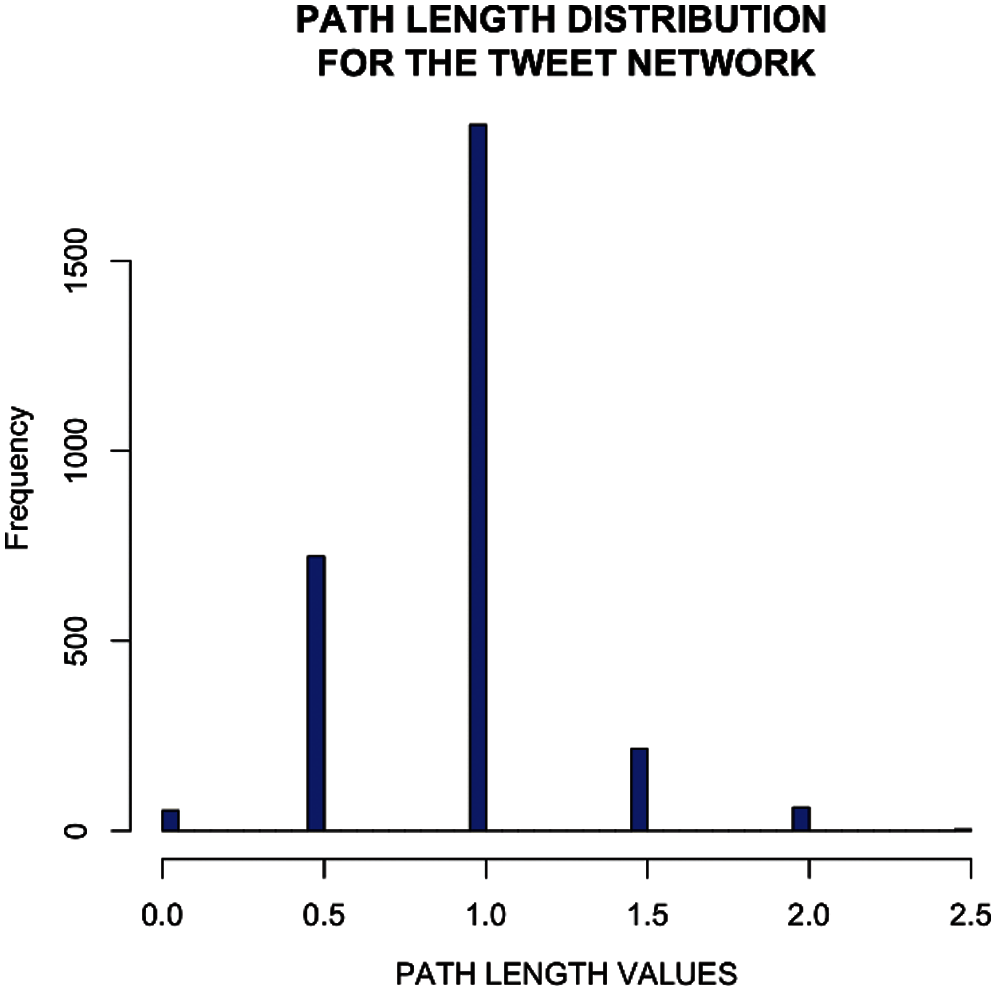
Figure 15: Path length distribution for the tweet network
The graphical illustrations clearly highlight the network structure formed when following the algorithms. The colors of nodes represent different clusters within the network where it can be clearly observed that most of the influential nodes tend to lie in the big clusters. While, the other lesser or insignificant nodes having a low impact factor lie in the small clusters. This indicates the fact that influential users have a high tendency to connect to other influential users rather than connecting to the less influential ones. This also shows that it follows the scale-free model. Different network metrics are utilized to analyze the data and results are shown, which are best suited to study such large-scale complex networks. An analysis of the minimum spanning tree algorithm has been provided. Outcomes of the study point out the community persistence, network coverage, link strength (edge weights), and shortest path in the network. Nodes with a large number of links have a significant impact on the entire network in terms of information propagation and prevention. Moreover, social networks have also become a major means of marketing and advertisement. Big corporations and organizations devote resources to research in order to better understand large networks. So, in this way they can find the influential nodes and spread their message efficiently and effectively in less time. On the other side, in this way, large network can be controlled/destroyed as well. In future, other social networks (Facebook, Instagram, etc.) can also be analyzed in this way.
Funding Statement: The author received no specific funding for this study.
Conflicts of Interest: The author declares that he has no conflicts of interest to report regarding the present study.
1. Albert, R., Jeong, H., Barabási, A. L. (2000). Error and attack tolerance of complex networks. Nature, 406(6794), 378–382. DOI 10.1038/35019019. [Google Scholar] [CrossRef]
2. Malik, H. A. M., Abid, F., Wahiddin, M. R., Bhatti, Z. (2017). Robustness of dengue complex network under targeted versus random attack. Complexity, 2017, 12. DOI 10.1155/2017/2515928. [Google Scholar] [CrossRef]
3. Boccaletti, S., Latora, V., Moreno, Y., Chavez, M., Hwang, D. U. (2006). Complex networks: Structure and dynamics. Physics Reports, 424(4–5), 175–308. DOI 10.1016/j.physrep.2005.10.009. [Google Scholar] [CrossRef]
4. Malik, H. A. M., Abid, F., Mahmood, N., Wahiddin, M. R., Malik, A. (2019). Nature of complex network of dengue epidemic as a scale-free network. Healthcare Informatics Research, 25(3), 182–192. DOI 10.4258/hir.2019.25.3.182. [Google Scholar] [CrossRef]
5. Gubanov, D. A., Chkhartishvili, A. G. (2015). A conceptual approach to online social networks analysis. Automation and Remote Control, 76(8), 1455–1462. DOI 10.1134/S000511791508010X. [Google Scholar] [CrossRef]
6. Kitsak, M., Gallos, L. K., Havlin, S., Liljeros, F., Muchnik, L. et al. (2010). Identification of influential spreaders in complex networks. Nature Physics, 6(11), 888–893. DOI 10.1038/nphys1746. [Google Scholar] [CrossRef]
7. Ren, X. L., Lü, L. (2014). Review of ranking nodes in complex networks. Chinese Science Bulletin, 59(13), 1175–1197. DOI 10.1360/972013-1280. [Google Scholar] [CrossRef]
8. Xia, Y., Ren, X., Peng, Z., Zhang, J., She, L. (2016). Effectively identifying the influential spreaders in large-scale social networks. Multimedia Tools and Applications, 75(15), 8829–8841. DOI 10.1007/s11042-014-2256-z. [Google Scholar] [CrossRef]
9. Chen, H. W. (2010). Applying social networking to construct an elementary science learning community. Sixth IEEE International Conference on e-Science Workshops, pp. 130–135. Brisbane, Queensland, Australia. [Google Scholar]
10. van, P., Arentze, T., Timmermans, H. (2012). A multilevel path analysis of contact frequency between social network members. Journal of Geographical Systems, 14(2), 125–141. DOI 10.1007/s10109-010-0138-0. [Google Scholar] [CrossRef]
11. Malik, H. A. M., Mahesar, A. W., Abid, F., Waqas, A., Wahiddin, M. R. (2017). Two-mode network modeling and analysis of dengue epidemic behavior in gombak, Malaysia. Applied Mathematical Modelling, 43, 207–220. DOI 10.1016/j.apm.2016.10.060. [Google Scholar] [CrossRef]
12. Kumar, R., Novak, J., Tomkins, A. (2010). Structure and evolution of online social networks. In: Link mining: Models, algorithms, and applications, pp. 337–357. New York, USA: Springer. [Google Scholar]
13. Milo, R., Shen-Orr, S., Itzkovitz, S., Kashtan, N., Chklovskii, D. et al. (2002). Network motifs: Simple building blocks of complex networks. Science, 298(5594), 824–827. DOI 10.1126/science.298.5594.824. [Google Scholar] [CrossRef]
14. Newman, M. E. (2003). The structure and function of complex networks. SIAM Review, 45(2), 167–256. DOI 10.1137/S003614450342480. [Google Scholar] [CrossRef]
15. Malik, H. A. M., Mahesar, A. W., Abid, F., Wahiddin, M. R. (2014). Two-mode complex network modeling of dengue epidemic in selangor, Malaysia. 5th International Conference on Information and Communication Technology for the Muslim World, pp. 1–6. Kuching, Malaysia. [Google Scholar]
16. Malik, H. A. M., Abid, F., Wahiddin, M. R., Bhatti, Z. (2017). Robustness of dengue complex network under targeted versus random attack. Complexity, 2017, 1–12. DOI 10.1155/2017/2515928. [Google Scholar] [CrossRef]
17. Kitsak, M., Gallos, L. K., Havlin, S., Liljeros, F., Muchnik, L. et al. (2010). Identification of influential spreaders in complex networks. Nature Physics, 6(11), 888–893. DOI 10.1038/nphys1746. [Google Scholar] [CrossRef]
18. Malik, H. A. M., Abid, F., Gilal, A. R., Raja, A. S. (2017). Use of cloud computing in hajj crowed management and complex systems. 4th IEEE International Conference on Engineering Technologies and Applied Sciences, pp. 1–5. New York. [Google Scholar]
19. Monclar, R. S., Oliveira, J., de Faria, F. F., Ventura, L., de Souza, J. M. et al. (2011). Using social networks analysis for collaboration and team formation identification. Proceedings of the 2011 15th International Conference on Computer Supported Cooperative Work in Design, pp. 562–569. Laussane, Switzerland. [Google Scholar]
20. Flesch, B., Vatrapu, R., Mukkamala, R. R., Hussain, A. (2015). Social set visualizer: A set theoretical approach to big social data analytics of real-world events. In 2015 IEEE International Conference on Big Data (Big Data), pp. 2418–2427. Santa Clara, CA, USA. [Google Scholar]
21. Malik, H. A. M., Abid, F., Wahiddin, M. R., Waqas, A. (2021). Modeling of internal and external factors affecting a complex dengue network. Chaos Solitons & Fractals, 144, 110694. DOI 10.1016/j.chaos.2021.110694. [Google Scholar] [CrossRef]
22. Sponder, M. (2011). Social media analytics: Effective tools for building, interpreting, and using metrics. McGraw Hill Professional, New York, USA. [Google Scholar]
23. Malik, H. A. M., Mahmood, N., Usman, M. H., Abid, F. (2019). Un-weighted network study of Pakistani airports. 2nd International Conference on Computing, Mathematics and Engineering Technologies, pp. 1–6. Pakistan. [Google Scholar]
24. Liu, L., Zhu, F., Jiang, M., Han, J., Sun, L. et al. (2012). Mining diversity on social media networks. Multimedia Tools and Applications, 56(1), 179–205. DOI 10.1007/s11042-010-0568-1. [Google Scholar] [CrossRef]
25. Wang, P., Xu, B., Wu, Y., Zhou, X. (2015). Link prediction in social networks: The state-of-the-art. Science China Information Sciences, 58(1), 1–38. DOI 10.1007/s11432-014-5237-y. [Google Scholar] [CrossRef]
26. Gospodinov, G. D. (2016). ISIS tweet network analysis. kaggle. https://www.kaggle.com/ggospodinov/tweet-analysis2/notebook. [Google Scholar]
27. Mantzaris, A. V. (2014). Uncovering nodes that spread information between communities in social networks. EPJ Data Science, 3, 1–17. DOI 10.1140/epjds/s13688-014-0026-9. [Google Scholar] [CrossRef]
28. Howe, A. C., Tindall, D. B., Stoddart, M. C. (2021). Drivers of tie formation in the Canadian climate change policy network: Belief homophily and social structural processes. Social Networks (in Press). DOI 10.1016/j.socnet.2021.06.004. [Google Scholar] [CrossRef]
29. Tischer, D. (2020). Collecting network data from documents to reach non-participatory populations. Social Networks (in Press). DOI 10.1016/j.socnet.2020.09.004. [Google Scholar] [CrossRef]
30. Liu, Y., Liu, W., Obaid, M. A., Abbas, I. A. (2016). Exponential stability of markovian jumping cohen–Grossberg neural networks with mixed mode-dependent time-delays. Neurocomputing, 177, 409–415. DOI 10.1016/j.neucom.2015.11.046. [Google Scholar] [CrossRef]
 | This work is licensed under a Creative Commons Attribution 4.0 International License, which permits unrestricted use, distribution, and reproduction in any medium, provided the original work is properly cited. |