| Computer Modeling in Engineering & Sciences |
DOI: 10.32604/cmes.2022.019040
ARTICLE
Spectral Matching Classification Method of Multi-State Similar Pigments Based on Feature Differences
1Xi'an University of Architecture and Technology, Xi'an, 710055, China
2Shaanxi Provincial Institute of Cultural Relics Protection, Xi'an, 710075, China
*Corresponding Author: Huiqin Wang. Email: hqwang@xauat.edu.cn
Received: 31 August 2021; Accepted: 13 October 2021
Abstract: The properties of the same pigments in murals are affected by different concentrations and particle diameters, which cause the shape of the spectral reflectance data curve to vary, thus influencing the outcome of matching calculations. This paper proposes a spectral matching classification method of multi-state similar pigments based on feature differences. Fast principal component analysis (FPCA) was used to calculate the eigenvalue variance of pigment spectral reflectance, then applied to the original reflectance values for parameter characterization. We first projected the original spectral reflectance from the spectral space to the characteristic variance space to identify the spectral curve. Secondly, the relative distance between the eigenvalues in the eigen variance space is combined with the JS (Jensen-Shannon) divergence to express the difference between the two spectral distributions. The JS information divergence calculates the relative distance between the eigenvalues. Experimental results show that our classification method can be used to identify the spectral curves of the same pigment under different states. The value of the root means square error (RMSE) decreased by 12.0817, while the mean values of the mean absolute percentage error (MAPE) and R2 increased by 0.0965 and 0.2849, respectively. Compared with the traditional spectral matching algorithm, the recognition error was effectively reduced.
Keywords: Fast principal component analysis; paint samples; reflectivity; information divergence; feature variance
The pigment of protection and restoration are essential content of ancient mural protection. It is the precondition of murals for protection and restoration is identifying the material surface paint murals [1]. The methods of detection and identification for Traditional mural pigment will cause irreversible damage to the mural. Using the reflection spectrum of mural pigment in situ analysis is a new nondestructive and efficient detection method that does not need a sample of mural painting ontology. Now it has become a hot research topic in cultural relics protection for home and abroad [2,3]. Wang used her own diffuse reflectance fiber-optic reflectance spectrometer to identify the pigments in the painted murals from the Dazu stone carvings in Sichuan province and the tomb of king Qianyang of the Ming Dynasty in Xi'an [4]. Fan Yuquan used Shimadzu spectrophotometer to non-destructively analyze the pigments on the south wall of Mogao Grottoes 285 [5]. Wang et al. [6] took the murals of the Jokhang Temple in Lhasa, Tibet as an example, and analyzed the pigments of two simulated murals using spectral technology, and obtained relatively satisfactory results. Wu et al. [7] performed spectral imaging of ancient paintings using visible light hyperspectral with infrared hyperspectral imaging technology. Based on the spectral feature fitting (SFF) method, they matched and identified the old paintings. Gong Mengting had proceeded with the pigments of classification and identification for the hyperspectral images of ancient Chinese murals using the Spectral Angle Mapping (SAM) [8].
The matching similarity value of reflection spectrum data between unknown pigments and known pigments is the core of identifying mural pigments based on reflection spectrum information analysis [9]. Because of relatively similar for the same pigment with the spectral reflectance curves of different concentrations and particle sizes, the traditional algorithm will have mismatched in the calculation process. The traditional spectral matching algorithm is improved in this paper. The variance in the characteristic value of pigment spectral reflectance is calculated by FPCA, which is used to replace the original reflectance value of parameter characterization. During spectral curve matching, the original spectral reflectance is projected from spectral space to characteristic variance space. It is calculated the relative distance difference by using the JS divergence method in the feature space of variance, that between the eigenvalue spectral information. It can solve the same pigment under the condition of the different spectral curve of amplitude difference smaller and reflectance curve is close to the problem that is difficult to identify, the matching similarity value of the different pigment samples can be calculated quickly.
2.1 Spectral Angel Mapping (SAM)
Spectral Angel Mapping (SAM) algorithm measures the similarity between the two spectral curves by calculating the cosine angle between the spectral reflectance curves.
The smaller the Angle between two spectra, the more similar they are. As shown in Eq. (1):
Although spectral Angle matching algorithm can obtain the similarity with the overall shape of spectral curves, it is difficult to distinguish the differences in local characteristics of spectral curves.
2.2 Spectral Correlation Fitting (SCF)
Spectral Similarity Fitting (SCF) [10,11] is an algorithm to measure the Spectral similarity with the whole measured wavelength range of the correlation coefficient index. The correlation coefficient formula is defined as follows:
In which, x,
2.3 Spectral Information Divergence (SID)
The algorithm of Spectral Information Divergence (SID) [12,13] measures the differences between two spectra based on the information theory.
The theory based on information theory measures the difference between two spectra. The larger the value of information divergence is, the more similar the spectral curves of two pigments are.
By comprehensively analyzing the above three algorithms, SAM is difficult to distinguish the local characteristics of the spectral curve. SCF is highly dependent on the correlation coefficient, and SID is too sensitive to a band with prominent spectral intensity. When matching and classifying the approximate spectral reflectance curves under different conditions of the same pigment, the traditional spectral matching algorithm has large error.
KL divergence [14], also known as KL distance, is used to describe the distance between two distributions. It is also an asymmetric metric
KL divergence analyzes the degree of difference between two distributions of the perspective of information entropy, so it is also called relative entropy. If the two distributions are identical, then
KL divergence is asymmetric, JS divergence is improved based on KL divergence.
JS divergence range is [0, 1], the same is 1, the opposite is 0. Compared with KL, the discrimination of similarity is more accurate. At the same time, JS divergence is symmetric, namely
3 The Calculation Method of Pigment Spectral Information Dispersion Matching Based on Characteristic Variance
It is highly similar for the same pigment under the spectral reflectance data in different conditions, and the JS divergence calculated by direct distance that cannot effectively characterize the relative difference of the spectral data, which is prone to mismatch. Therefore, it introduces the spectral matching classig-1cation method of multi-state similar pigments based on feature differences. Due to the large number and dimension of pigment spectral bands, FPCA is used to process spectral reflectance data. Compared with the traditional PCA method, FPCA can quickly calculate the variance in the eigenvalues of the reflectance, improve the calculation efficiency, and save time. Using the eigenvalues variance of calculation as a parameter, and the JS divergence distance is used to measure the eigenvalues effectively. The distance is the smaller, the correlation is the greater.
Firstly, the orthogonal vector of pigment spectral reflectance is calculated by FPCA, and the linear combination of these orthogonal vectors is used to represent the original data. The Minium mean square error between the new data and the original data is obtained, which is reduced to the eigenvector problem of the overall matrix A of the original data. The definition is as follows:
where m is the number of vectors,
The variance in the vector is used to express the relationship between the original variables, and the FPCA is introduced to represent the feature attributes of the unknown pigment. Then, it is combined with the JS divergence algorithm. The specific process is as follows:
Given a sample of
The matrix operation of the original features of the sample is mainly to subtract the mean (centralization) to make the mean of vectors
Calculation of correlation coefficient matrix
The eigenvalue
The characteristic vector information divergence formula for the known spectrum is as follows:
The characteristic vector information divergence formula for the spectrum to be measured is as follows:
After transformation JS divergence distance formula:
The variance in FPCA in feature space is more obvious to represent the change of original features. At the same time, the JS divergence is used to calculate the vector distance, which improves the problem that the original vector distance cannot better reflect the correlation between the measured data and the known data. Therefore, the combination of FPCA and JS divergence can improve the accuracy and matching accuracy of spectral similarity matching values. The flow chart of FPCAJS algorithm is shown in Fig. 1.

Figure 1: The technical block diagram of pigment spectral information divergence matching method combined with characteristic variance
4 Analysis of Experimental Results
Experimental equipment includes: computer program control terminal, marine optical SpectroSuite spectrophotometer, standard halogen lamp lighting source, diffuse reflection standard plate, UV/SR-VIS high hydroxyl fiber, ISP-R integrating sphere. Spectral data acquisition wavelength ranges 380–900 nm.
Using MATLAB simulation, the computer hardware environment is: Windows 1,064-bit system, I5 processor, 4 GB memory. The experimental data were collected in the range of 380–900 nm, and the spectral information on pigments in this band was less affected by noise and other factors.
Mineral pigment color blocks commonly used in ancient Chinese murals were selected to make experiments. Minium, Vermilion, Green and Cyan were selected from red, blue, and green series. The color blocks of pigments for difference are mixed by the condition of the different concentration of water glue and particle sizes. Drawn on the white plasterboard, the spectral reflectance data onto pigments were collected by spectrometer and other equipment. Each pigment has more than three groups of control samples. The pigment samples of different states are shown in Table 1 (1, 2, 3 means pigment concentration, 1 means water or glue is 10 ml, in turn, the larger the value shows that the lower the proportion of pigment, particle size is 40, 30, 20, 10

(1) Root Mean Square Error (RMSE)
Root Mean Square Error refers to the expected value of the square of the difference between the estimated value of the parameter and the true value of the parameter. The smaller the value is, the higher the matching recognition accuracy is, and the better the recognition and classification effected are. The definition is as follows:
(2) Mean Absolute Percentage Error (MAPE)
MAPE is a percentage value, indicating the percentage of the average deviation between the sample results and the real results. The larger the value is, the better the matching classification effect of the model is. The definition is as follows:
(3) Coefficient of determination (R²)
The coefficient of determination is generally used for regression model, which is used to evaluate the consistency between the predicted value and the actual value. The higher the coefficient of determination, the higher the matching accuracy, the better the recognition and classification effects. The definition is as follows:
4.2 Matching Experiment of Pigment Spectral Data under Different Conditions
The ratio of different concentration of water and glue as well as the difference in particle size will cause the similar spectral curves of the same pigment in different conditions. Therefore, SAM, SID, SCF and FPCAJS are used for the pigments comparing and identifying. Carry out three groups of experiment comparison for the same pigment in different conditions and states.
(1) Calculation experiment of pigment spectral data onto different water concentrations
As shown in Figs. 2 and 3, the curves of S-type pigment Vermilion and Bell-type pigment Green were compared before and after FPCA treatment. The curve morphology of Vermilion and Bell-type pigment Green changed under different water concentrations by FPCA transformation. In the wavelength range of 400–700 nm, the peak-valley characteristics of similar spectral data were effectively enhanced, and there were significant differences. The spectral curves of the same pigment in different states were significantly distinguished. Table 2 shows the comparison of the matching results of Vermilion and Green in different states. The closer the matching value of the Table 1, the more similar it is.
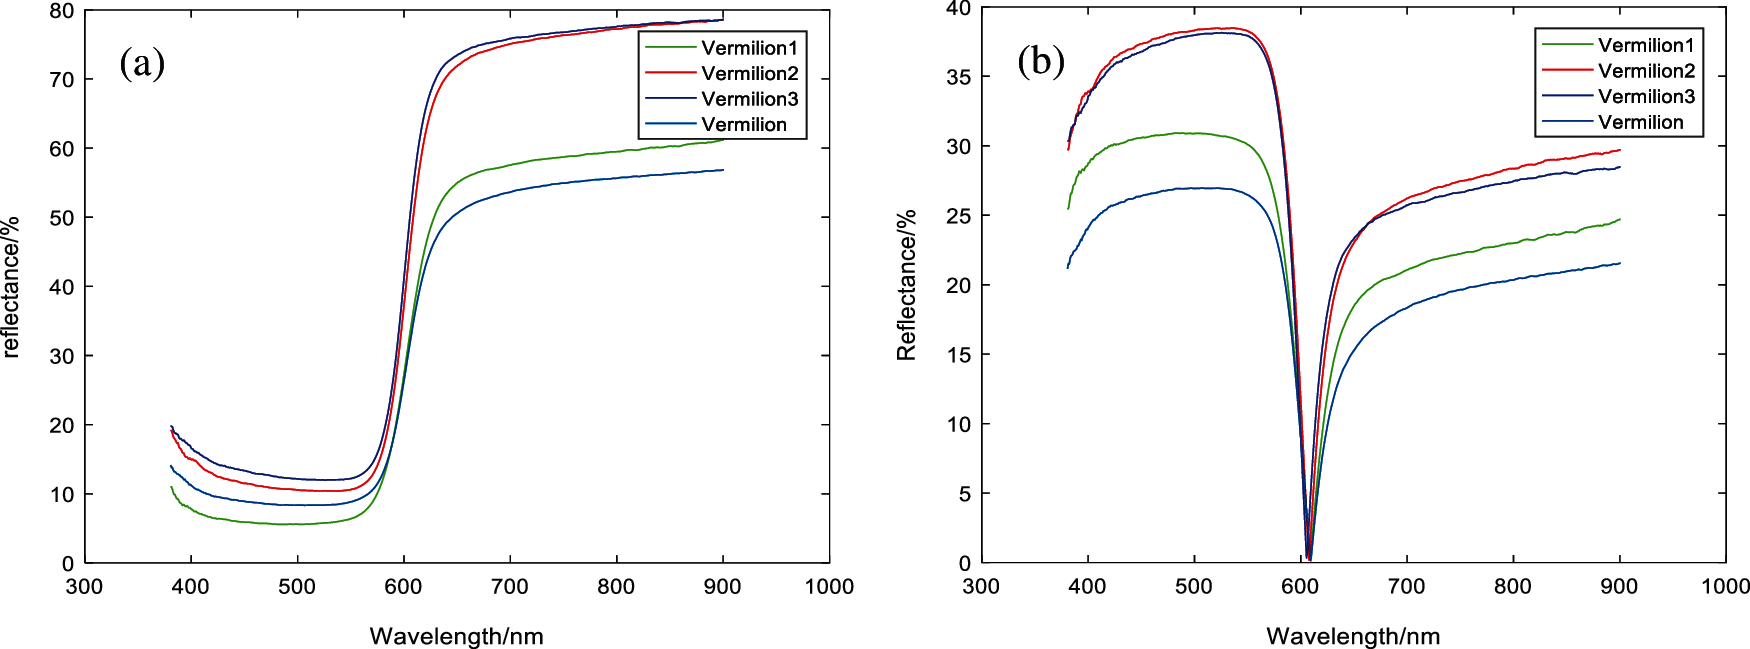
Figure 2: Vermilion with different water ratio spectral reflectance (a) Reflectance (b) FPCA result
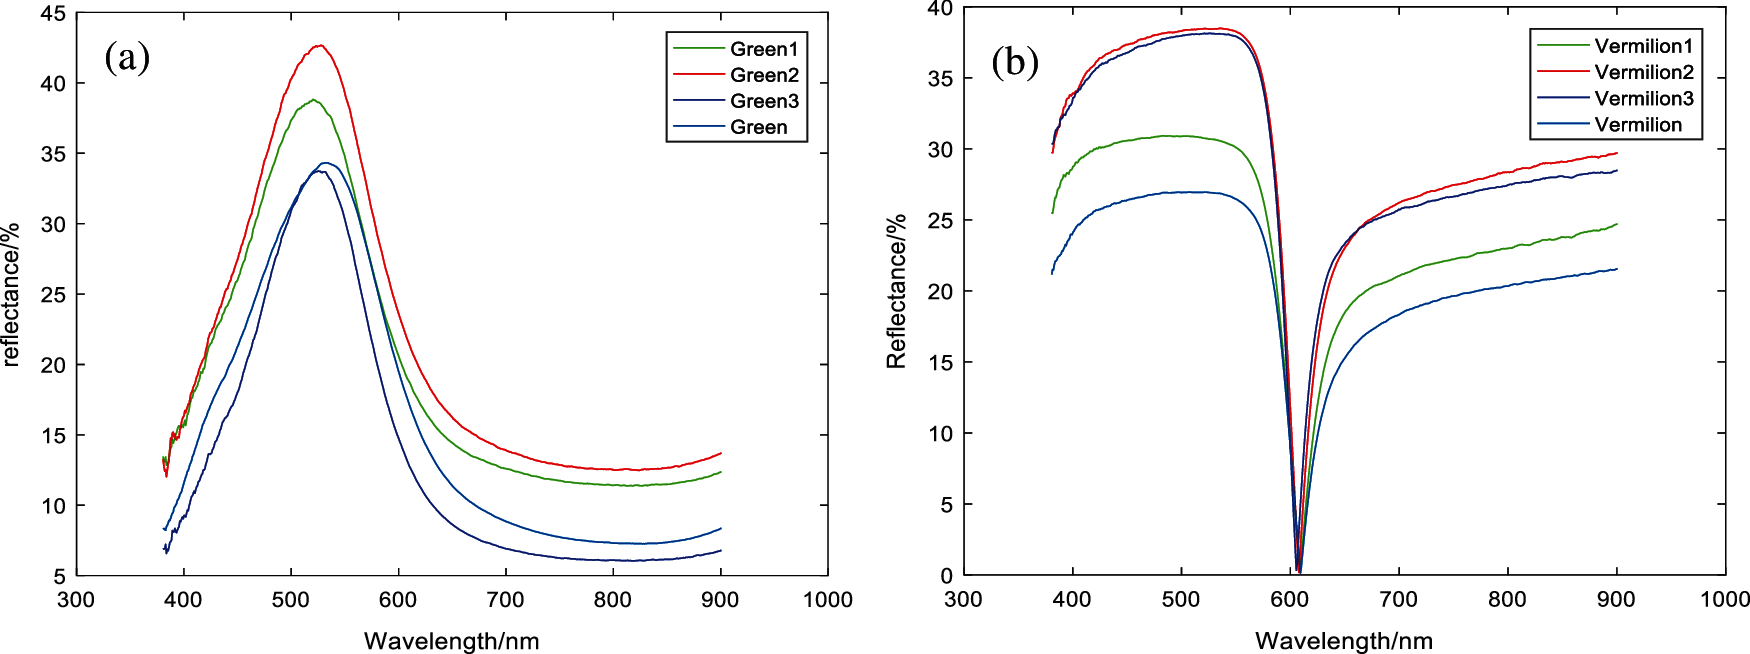
Figure 3: Green with different water ratio spectral reflectance (a) Reflectance (b) FPCA result

Comparing the matching results of Tables 2 and 3, compared with the traditional matching algorithm, the FPCAJS matching results of pigment spectral data curves under different water concentrations are more obvious, which can clearly and accurately distinguish pigments under different water concentrations.

(2) Calculation experiment of pigment spectral data onto different particle sizes
As shown in Fig. 4, the comparison results of blue pigments before and after FPCA treatment under different particle sizes are shown. The curve morphology of blue pigments under different particle sizes has changed by FPCA transformation. There are significant differences in the wavelength range of 390, 450, 550, 650 and 890 nm. Table 4 shows the comparison of the matching results of blue pigments under different particle sizes. The closer the matching value is to 1, the more similar it is.
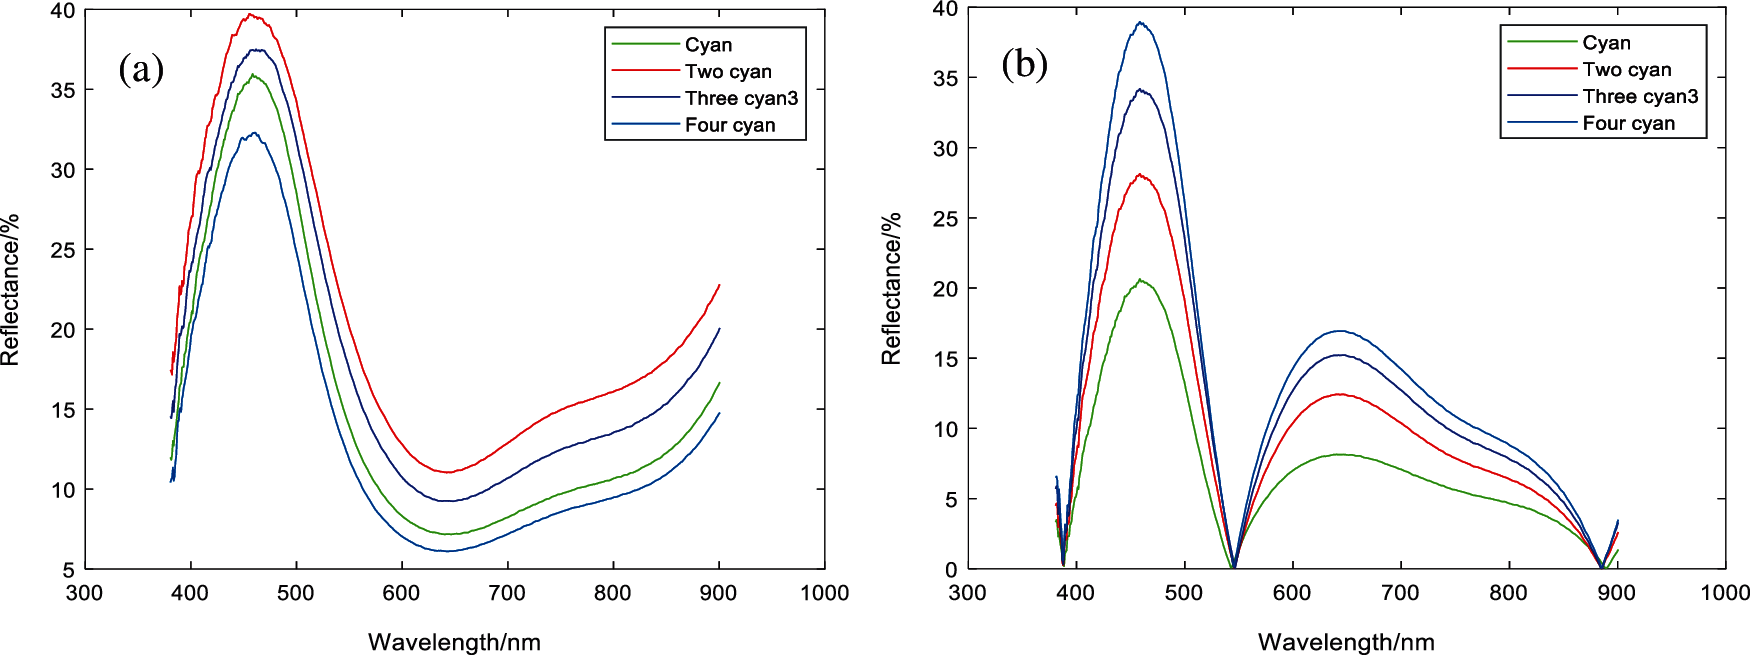
Figure 4: Blue with different water ratio spectral reflectance (a) Reflectance (b) FPCA result

Compared with the matching results of Table 3, Compared with the traditional matching algorithm, the FPCAJS matching results obtained from the spectral data curve of blue pigments under different particle sizes is more obvious, and the pigments with different particle sizes can be accurately obtained. The smaller the particle size difference is, the closer the similarity values are.
(3) Calculation experiment of pigment spectral data with different glue concentration
In the drawing of mineral pigment images, the adhesive can be used as a binder to facilitate the color of the pigment to be not easy to fall off. In this experiment, granular gelatin was selected and used after foaming. As shown in Fig. 5, for the comparison results before and after FPCA treatment, the amplitude of the curve waveform of the Minium pigment after adding glue increases. The difference in the curve morphology under different glue concentrations is changed by FPCA transformation. In the wavelength range of 500−600 nm, the peak-valley characteristics are effectively enhanced, and there are significant differences. Table 5 shows the comparison between the Minium pigment after adding glue and the Minium pigment without adding glue. The closer the matching value of Table 1 is, the more similar it is.
The experiments show that the concentration of glue has an impact on the pigment. Comparing the matching results of Table 5, Compared with the traditional matching algorithm, the FPCAJS matching results of the pigment spectral data curve under different glue concentrations is more obvious, and FPCAJS can more accurately distinguish pigments under different glue concentrations.
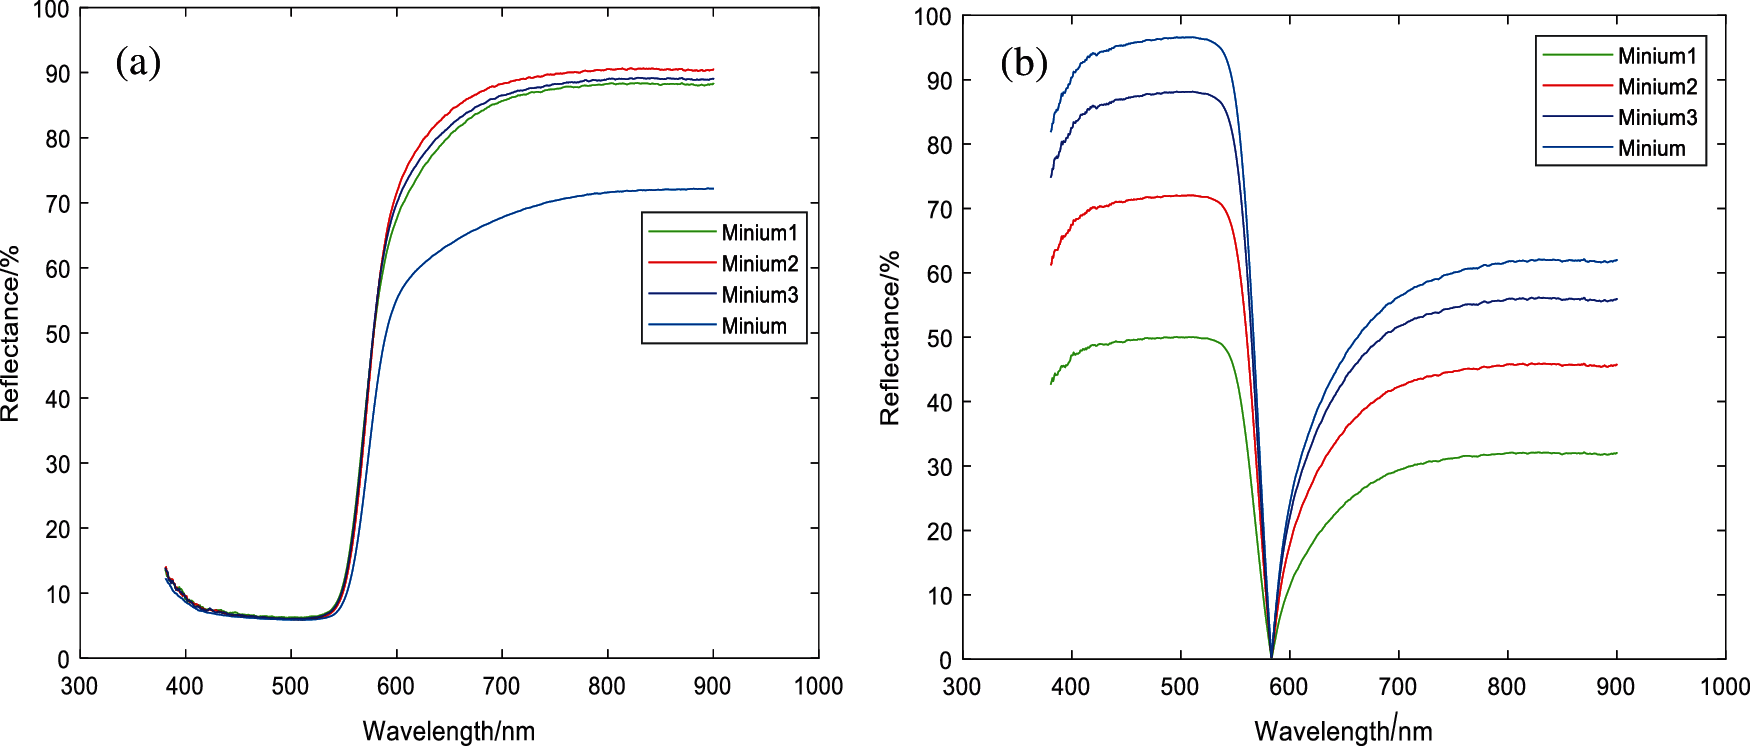
Figure 5: Spectral reflectivity of different concentrations of minium (a) Reflectance (b) FPCA result

Through the above three groups of control experiments, the pigment concentration of the same pigment under different conditions was distinguished from the results, and the threshold interval was divided into the matching results, as shown in Table 6.

Since the number of particle sizes divided by blue pigments is different, it is impossible to judge blue pigments with different particle sizes according to the threshold during matching. Therefore, the matching algorithm can only be further used to distinguish different particle sizes of blue pigments, which will be further studied in the follow-up work.
In order to further to verify the algorithm proposed to this paper, this algorithm is applied to the pigment recognition of actual temple murals. (The actual temple murals are obtained from the experimental data collection of a temple in China). The pigment reflectance data onto temple murals to be detected are compared with the spectral reflectance sample library established by this method. The pigments with obvious color and green color in temple murals are mainly studied, as shown in Fig. 6.
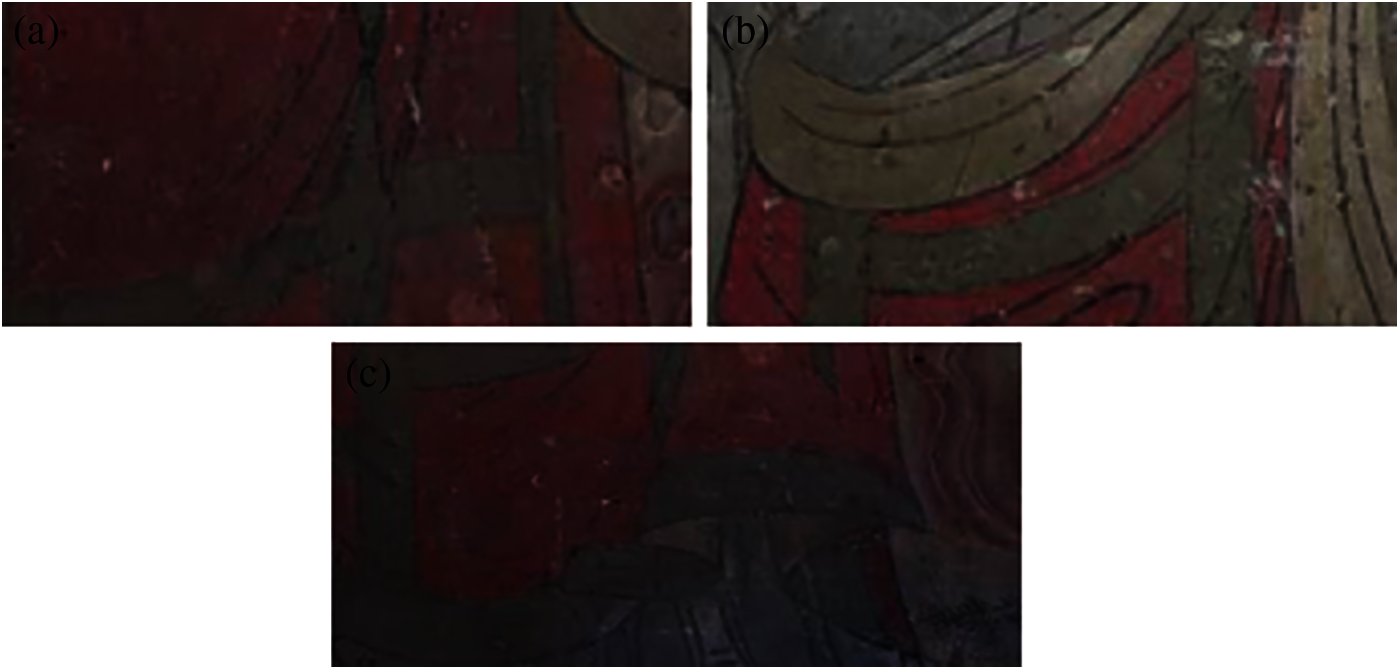
Figure 6: A partial cut of a temple mural (a) Red 1 (b) Green (c) Red 2
Firstly, the spectral matching algorithm studied in this paper was used to match and identify the reflectance spectral data onto the color block pigments in murals. Then, the XRF (ultraviolet fluorescence) detection method was used to verify and determine that the Red 1 in murals was Minium, the Red 2 was Vermilion, and the green pigment were Green. The following is the matching recognition results of the reflection spectrum data onto mural color blocks and the samples of different concentrations of standard pigments.
Contrast Tables 7–9 can be seen according to the mural known pigments to determine the different concentrations of pigments taken at different locations in the murals close to which concentration. In Table 7, Minium a is close to Concentration 2, Minium b is close to Concentration 1. State similarity in Green a is low in Table 8, considering whether it is another state of concentration, Green b is close to the state of Concentration 2. The concentrations of Vermilion a and b in Table 9 were close to the concentration state of Vermilion 1.

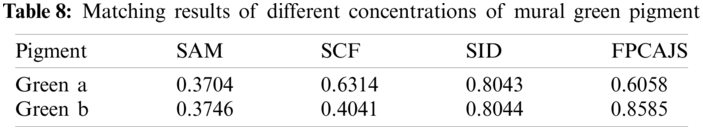
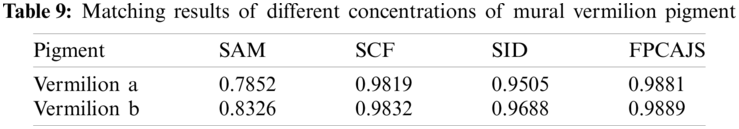
Table 10 is the matching evaluation results of laboratory pigments based on three evaluation indexes of RMSE, MAPE and R². Compared with the direct calculation of spectral reflectance similarity, the accuracy and accuracy of the similarity matching results characterized by eigenvalues is significantly improved. The average value of RMSE is reduced by 12.0817, the average value of MAPE is increased by 0.0965, and the average value of R² is increased by 0.2849, which can more accurately identify the types of pigments.

Studying the spectral matching algorithms of mural pigments is of great significance in the protection and research of cultural relics. This is because traditional methods have the problem of recognition errors in the same color pigments. The enhanced spectral matching algorithm evaluated in this paper is based on different water concentrations, particle sizes, and glue concentrations. It can be applied to the recognition and classification of pigments under most conditions. According to the preprocessing of the spectral data, the projection of the data feature in the feature variance space more clearly characterizes the changes in the original features. Use the relative distance of the eigenvalues in the eigen variance space to perform spectral curve matching. The problem caused by the unobvious amplitude and few features of the same color pigments is improved. Compared with the similarity values calculated by the traditional SAM, SCF, and SID algorithms, the multi-state similar spectral matching classification calculation method based on feature differences substantially improves calculation accuracy. It has a positive effect on the identification and detection of mural pigments. In future work, a quantitative analysis of mixed colors will be considered due to mixed colors often being used in mural painting, leading to an increased number of data samples and more difficulties in analyzing the specific components of mixed pigment colors. The unknown pigment data of mixed colors will be compared with the sample database, and classifiers will be added for categorization.
Funding Statement: This work was supported in part by the National Science Foundation of China: Shaanxi Natural Science Basic Research Project (2021JM-377), Science and Technology Cooperation Project of Shaanxi Provincial Department of Science and Technology (2020KW-012), University Talent Service Enterprise Project of Xi'an Science and Technology Bureau (GXYD10.1)
Conflicts of Interest: The authors declare that they have no conflicts of interest to report regarding the present study.
1. Liang, J. X., Wan, X. X., (2017). Non-destructive pigment identification method of ancient murals based on visible spectrum. Spectroscopy and Spectral Analysis, 37(8), 2519–2526. DOI 10.3964/j.issn.1000-0593(2017)08-2519-08. [Google Scholar] [CrossRef]
2. Chen, X., Wang, W. Y., Liu, Y., Xia, J. J., Jiang, J. X. et al. (2013). Quality control of tobacco top flavor by NIR spectral similarity match analysis. Laser & Infrared, 43(1), 44–48. DOI 10.3969/j.issn.1001-5078.2013.01.009. [Google Scholar] [CrossRef]
3. Oommen, T., Misra, D., Twarakavi, N. K., Prakash, A., Sahoo, B. et al. (2008). An objective analysis of support vector machine based classification for remote sensing. Mathematical Geosciences, 40(4), 409–424. DOI 10.1007/s11004-008-9156-6. [Google Scholar] [CrossRef]
4. Wang, L. Q., Liang, G. Z., Dang, G. C. (2005). Studies on relics conservation by diffuse reflectance spectroscopy. Spectroscopy and Spectral Analysis, 25(8), 1293–1296. DOI 10.3321/j.issn:1000-0593.2005.08.034. [Google Scholar] [CrossRef]
5. Fan, Y. Q., Li, Y. F., Yu, Z. R., Zhao, L. Y., Su, B. M. et al. (2007). Multi-spectral imaging and non-invasive investigation on the south wall of the cave 258 at mogao grottoes. Dunhuang Research, 27(5), 49–53+114+118. DOI 10.3969/j.issn.1000-4106.2007.05.011. [Google Scholar] [CrossRef]
6. Wang, L. L., Li, Z. M., Ma, Q. L., Mei, J. (2015). Non-destructive and in-situ identification of pigments in wall paintings using hyperspectral technology. Dunhuang Research, 35(3), 122–128. DOI 10.13584/j.cnki.issn1000-4106.2015.03.019. [Google Scholar] [CrossRef]
7. Wu, F. Q., Yang, W. N., Li, D. (2014). Research on art painting pigment composition recognition based on spectra feature fitting. The Journal of Light Scattering, 26(1), 88–92. DOI 10.3969/j.issn.1004-5929.2014.01.018. [Google Scholar] [CrossRef]
8. Gong, M. T., Feng, P. L. (2014). Preliminary study on the application of hyperspectral imaging in the classification of and identification Chinese traditional pigments classification–A case study of spectral angle mapper. Sciences of Conservation and Archaeology, 26(4), 76–83. DOI 10.3969/j.issn.1005-1538.2014.04.011. [Google Scholar] [CrossRef]
9. Zhang, Y., Liu, Y. D., Ji, Z. (2009). Vector similarity measurement method. Technical Acoustics, 28(4), 532–536. DOI 10.3969/j.issn1000-3630.2009.04.021. [Google Scholar] [CrossRef]
10. Yang, S. W., Liu, Z., Wu, M. G., Zhang, Z. J. (2014). Research on characteristic spectrum extracting and matching for high-fidelity reproduction. Spectroscopy and Spectral Analysis, 34(6), 1635–1639. DOI 10.3964/j.issn.1000-0593(2014)06-1635-05. [Google Scholar] [CrossRef]
11. Yang, S., Liu, Z., Wu, M. (2015). Color separation method based on characteristic spectrum matching for multi-color reproduction. Geomatics and Information Science of Wuhan University, 40(4), 563–568. DOI 10.13203/j.whugis20130345. [Google Scholar] [CrossRef]
12. Yang, P., Liao, X., Cheng, H., Shuai, M., Xie, Y. (2018). A comparative study of remote sensing image fusion methods based on spectral gradient angle and spectral information divergence index. Engineering of Surveying and Mapping, 27(11), 51–55. DOI 10.19349/j.cnki.issn1006-7949.2018.11.010. [Google Scholar] [CrossRef]
13. Liu, W. J., Yang, X. H., Qu, H. C., Meng, Y. (2015). Hyperspectral unmixing algorithm based on spectral information divergence and spectral angle mapping. Journal of Computer Applications, 35(3), 844–848. DOI 10.11772/j.issn.1001-9081.2015.03.844. [Google Scholar] [CrossRef]
14. Qin, L., Tang, W. Q., Tao, Q. H., Yan, Q. J., Li, S. C. (2020). Similarity calculation between process plant equipment collections based on Gaussian mixture models. Computer Integrated Manufacturing Systems, 26(3), 732–746. DOI 10.13196/j.cims.2020.03.016. [Google Scholar] [CrossRef]
 | This work is licensed under a Creative Commons Attribution 4.0 International License, which permits unrestricted use, distribution, and reproduction in any medium, provided the original work is properly cited. |