| Computer Modeling in Engineering & Sciences |
DOI: 10.32604/cmes.2022.018413
ARTICLE
Game Outlier Behavior Detection System Based on Dynamic Time Warp Algorithm
1School of Games, Hongik University, Sejong, 30016, Korea
2Department of Computer Engineering, Jeju National University, Jeju, 63243, Korea
*Corresponding Author: Soo Kyun Kim. Email: kimsk@jejunu.ac.kr
Received: 23 July 2021; Accepted: 02 November 2021
Abstract: This paper proposes a methodology for using multi-modal data in gameplay to detect outlier behavior. The proposed methodology collects, synchronizes, and quantifies time-series data from webcams, mouses, and keyboards. Facial expressions are varied on a one-dimensional pleasure axis, and changes in expression in the mouth and eye areas are detected separately. Furthermore, the keyboard and mouse input frequencies are tracked to determine the interaction intensity of users. Then, we apply a dynamic time warp algorithm to detect outlier behavior. The detected outlier behavior graph patterns were the play patterns that the game designer did not intend or play patterns that differed greatly from those of other users. These outlier patterns can provide game designers with feedback on the actual play experiences of users of the game. Our results can be applied to the game industry as game user experience analysis, enabling a quantitative evaluation of the excitement of a game.
Keywords: Facial expression recognition; webcam; behavior analysis; affective computing
The analysis of game user data in a commercial game is a field that has become increasingly developed and used in the game market. Game user data are usually obtained from the following two sources: survey-based opinion data and log data of the user’s play gathered within the game. Survey-based methodology is usually employed in research fields that require subjective judgment, such as excitement. Games are software packages intended to satisfy an abstract standard called excitement. However, the standards for assessing emotions such as excitement are difficult to define objectively. Various emotion models have been proposed to quantify emotions [1], but because the accuracy is not high, the level of excitement is still determined based on user feedback in the industry. Log-based analytical methods are usually applied in the game publishing area where quantification is feasible [2], user attrition measurement [3], bot detection [4], etc. In the log-based analysis field, the quantification and analysis methods of the collected data are advanced, providing practical services at the game platform level.
In this paper, we aim to adopt a log analysis method in the gameplay evaluation process, which was performed based on a survey. We used a log analysis to detect outlier behavior in a game. Because the excitement in a game is based on the subjective experience of individual users, we expect that it will be difficult to quantify and evaluate in the short term. However, the outlier behavior analysis of users while playing games can indicate the game content of the game development team, which requires further attention. On the academic side, we aimed to detect outliers with unusual behavior based on the time axis by applying a time-series pattern-matching algorithm to multi-modal data. Fig. 1 shows the difference between the existing gameplay evaluation process and our proposed gameplay evaluation process.
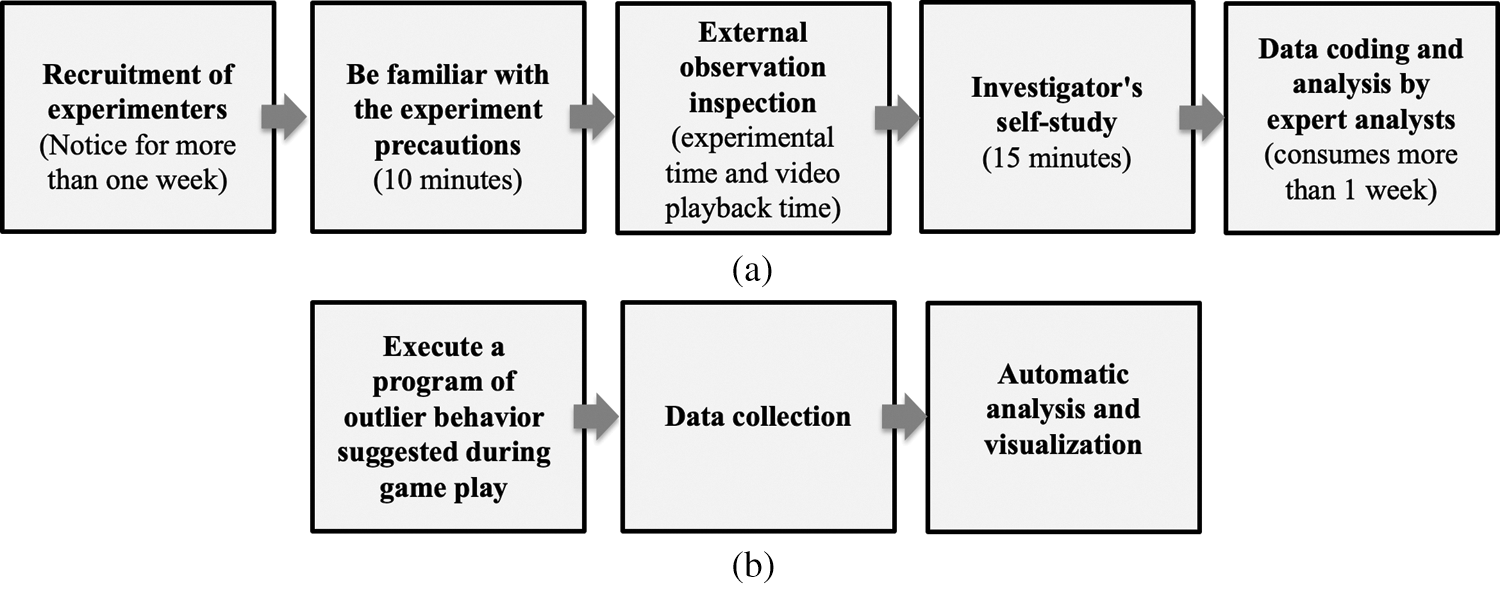
Figure 1: System overview. (a) Existing gameplay evaluation process (b) Proposed gameplay process
To analyze the outlier behavior of users, we used three devices (mouse, keyboard, and webcam) used by the game players in a typical personal computer (PC) gaming environment, without adding special devices. Because these devices have non-intrusive properties, they have an advantage in that the users are unaware of the data collection stage. We have developed a dynamic time warp (DTW)-based outlier behavior analyzer using multi-modal data collected naturally from these devices during gameplay. Our proposed methodology has the following characteristics compared with conventional studies.
Low-cost, non-intrusive hardware-based multi-modal data collection system: a system that collects input data in real time from the primary devices used in the typical gaming environment and processes them for use in gameplay analysis.
Automated gameplay evaluation system: A system that automatically provides feedback information on outlier behavior occurring in gameplays through outlier behavior detection based on a time-series algorithm.
Emotion recognition is an important topic in the field of affective computing. Emotions are expressed through various physical and biological signals, and many attempts have been made to measure them using various sensing devices. Bänziger et al. outlined the requirements for a systematic corpus of actor portrayal and described the development, recording, editing, and validation of a corpus called the Geneva Multimodal Emotion Portrayal (GEMEP) [5]. They defined a user’s emotional behaviors as multi-modal, and user behavior was understood through various multi-modal data. Petrantonakis et al. processed electroencephalography (EEG) data with a data classification process using k-nearest neighbor and a support vector machine (SVM) [6]. Wang et al. [7] were able to recognize emotions by performing an analysis of reactions of the cardiovascular system, which were measured using an electrocardiogram (ECG). Their system could classify elements extracted from the ECG that reflected emotion and recognized two kinds of emotions (joy and sadness) by using the genetic simulated annealing process and genetic process. Wagner et al. [8] identified four kinds of emotions (anger, sadness, joy, and pleasure) by measuring data from an electromyogram (EMG), ECG, skin conductivity, and respiration change, as well as by using k-NN, linear discriminant function, and multilayer perceptrons. Leon et al. [9] measured heart rate, skin resistance, and blood volume pressure and recognized three kinds of emotions (neutral, negative, and positive). McDuff et al. [10] measured variations in heartbeat, and by checking changes in the regular heart rate, he was able to measure the level of cognitive stress of the user. This system was able to deduce exact values based on the heartbeat; however, the nature of the experimental environment makes it inappropriate for general use. Hernandez et al. [11] introduced a technique whereby users can determine their current state by themselves using Google Glass. This technique not only enables the user to check their state, but it also allows users to continually control their state based on the data. However, additional equipment is required, and because it is difficult to obtain a response regarding a change in a prolonged state, it becomes difficult to assess emotions. Although studies that are based on these types of bodily signals can directly measure the immediate response of bodily signals in the external environment, it is difficult to process the inherent noise of bodily signals and accurately detect emotions that have multi-modal properties without recognizable observation.
Among multimodal signals, facial expressions are important non-verbal affective cues that are displayed by humans to infer affective status. They can supplement bodily signals using a non-introversive webcam device. The facial action coding system (FACS), introduced by Ekman et al. [12], enables an objective and comprehensive description. Many studies have been proposed based on this approach, especially in the fields of cognitive psychology and human–computer interaction. Kapoor et al. [13] developed a system for the detection of frustration in learning environments by analyzing facial expression, head movement, posture, skin conductance, and mouse pressure. Kaliouby et al. [14] developed a computational model that detects high-level impacts, such as agreeing, concentrating, disagreeing, being interested, etc., from facial expressions and head movement recognition. Littlewort et al. [15] used an automatic system for facial expression detection systems for pain. Yeasin et al. [16] developed a system that recognizes six universal facial expressions to compute the level of interest. Kang et al. [17] proposed an outlier detection system based on a visual-physiology multi-modal data system for a Korean reality TV show.
In the game industry, affective computing based on a multi-modal interface is the initial stage of adaptation. Various studies on gaming have been introduced in the areas of emotion diagnosis in video game players [18,19], game addiction [20], stress detection [21], player experience in a first-person shooting game [22], facial expression recognition during a racing game [23], Microsoft’s Kinect-based feedback system [24,25], and a commercial telemetry feedback system [26]. In a recent study, Martinez used a deep learning algorithm to recognize four types of emotions within a game [27]. This technique, in part, adopted the emotion model of psychology and measured user emotion via its own machine-learning techniques.
Recently, Wang et al. [28] proposed text analytics to automatically elicit components of the game experience from online reviews and examined the relative importance of each component to user satisfaction. Maman et al. [29] presented a Group Analysis of Multimodal Expression of cohesion (GAME-ON), which is a multi-modal dataset specifically designed for studying group cohesion and for explicitly controlling its variation over time. Song et al. proposed an automatic recognition of frustration by analyzing facial and vocal expressions. They presented a novel audiovisual database: the multimodal game frustration database (MGFD) and LSTM-RNN network for frustration classification [30]. Ringer et al. proposed a method for analyzing player behavior and discovering correlations with a game context to model and understand important aspects of livestreams. They present a data set of League of Legends livestreams, annotated for both the streamer affect and game context. In addition, they proposed a method that exploits tensor decompositions for high-order fusion of multi-modal representations [31]. Olalere et al. [32] proposed an automated system to focus on estimating the levels of board game experience by analyzing a player’s confidence and anxiety from visual cues. They used a board game setting to induce relevant interactions and investigate facial expressions during critical game events. Semenova et al. proposed a multi-modal system to characterize pro E-Sports team players regarding their personality traits and coping strategies. They collected data from pro players of different teams, as well as from amateur players, and found significant discrepancies in coping strategies between professional and amateur gamers to identify behavioral differences [33]. Elor et al. [34] presented a playable VR experience in which the user evaluates the emotion of images based on the Pleasure-Arousal-Dominance (PAD) emotional model using personalized deep learning. Sentiment analysis technology in games tends to spread to board games and VR games in addition to general PC and console games from an academic point of view. However, the industry does not actively introduce these evaluation results in game development.
In this study, we adopted an emotion analysis method for the analysis of outlier behavior in games. We propose a methodology in which sentiment analysis technology can be applied to game development. Our proposed method uses the camera as the primary device, and the keyboard and mouse as secondary devices to analyze the user’s play experiences, and it focuses on detecting the outlier behavior parts only. Compared to the recent game multi-modal sentiment analysis systems [31–34], our system is different in that it can detect an outlier behavior at a specific point in time by comparing the behavior with other users on the game level. This feature has the advantage of being able to inform the game designer when the emotional feedback of users changes significantly during the game level design process.
Outlier behavior in games is an important reference when designing games. In general, there are play responses intended by the game designer at the game level (stage) during game development. If a player provides play feedback that is different from the designer’s intention, it means that there is an unexpected problem in the play section, which should be identified and corrected. This feedback process is particularly important for maintaining the access of game players. If a player feels that the game is difficult or not interested while playing the game, he/she will stop the game. Therefore, accurate play experience feedback to the development team is required, especially in the early gameplay stages.
With this background, outlier behavior in games can be defined in two ways. The first way of classifying outlier behavior defines outlier behavior as a case where there are play experiences other than those intended by the game designer. For example, suppose the game designer has placed a clown character in a certain zone within a stage, expecting a surprised response; if the player feels scared upon seeing it, it is an outlier behavior. To detect such outlier behavior, tasks are required to designate the expected emotion distribution to the corresponding space and to analyze the difference between the detected emotion of the player and the expected emotion. The second method of classifying outlier behavior involves extracting the experiences of users that are different from the average experience of the users. If most users have felt the same play experience (e.g., surprise) in a certain zone, it can be interpreted that the pertinent zone contents have provided a consistent play experience irrespective of the game designer’s intention. However, if various play experiences (e.g., fear, anger, etc.) occur among the players, it indicates that various outlier behaviors that are difficult to predict may occur owing to the difference in the experience of individual users.
In this study, these two types are all defined as outlier behaviors. For the first type of outlier behavior, which is the difference between the game designer’s intended experience and the actual game player’s experience, the player’s feedback is defined using a one-dimensional (1D) axis, and the play tension graph defined on the playtime axis is used as a key graph. We compared the difference between the designer’s expected tension graph and the player’s experienced tension graph, and defined the section where the difference was large as an outlier behavior different from the intention (OBDI) section. The second type of outlier behavior is an outlier behavior different from the average (OBDA), which is “a play pattern that is different from the average play pattern of users”. That is, the tension graph of the user showing the biggest difference from the average tension graph of players is classified as an outlier behavior pattern. Fig. 2 shows an overview of the two outlier behavior patterns that we defined.
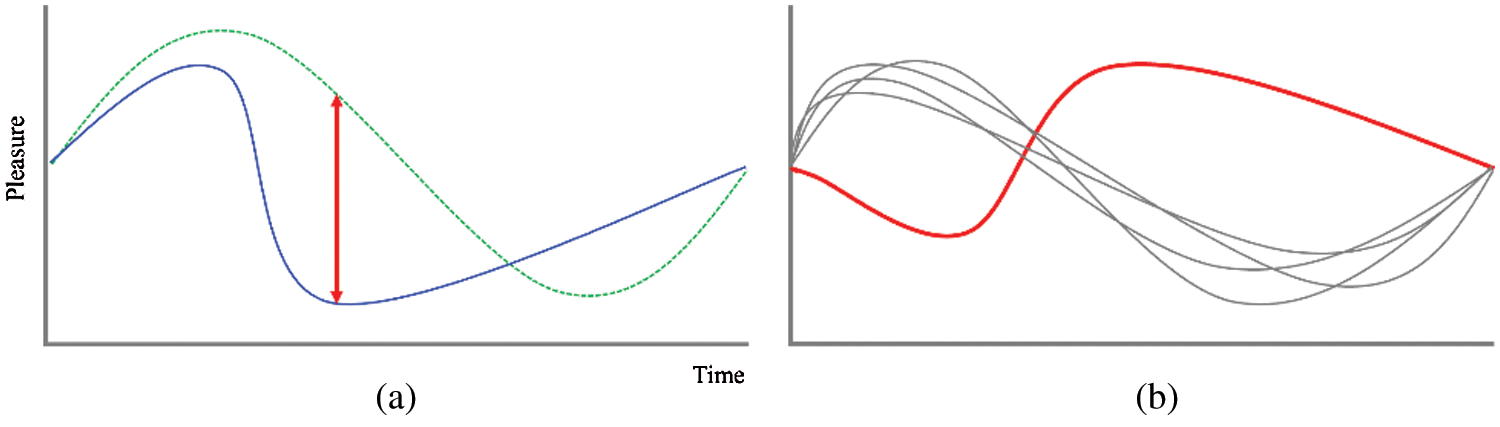
Figure 2: (a) Outlier behavior different from intention (OBDI): expected tension graph (green dotted line), experienced tension graph (blue solid line); (b) Outlier behavior different from average (OBDA): tension graph of the outlier behavior different from the average of all players (red solid line)
In this study, a multi-modal emotion analysis platform was constructed, consisting of three modules: 1) a multi-modal parameter sampler, 2) a CNN-based facial expression detection module, and 3) an outlier behavior detector based on the DTW algorithm. This system is an extension of our previous research systems [17,19,25]. Unlike previous systems, in this study, we focused on finding outlier behaviors in time-series data using only devices in the general PC environments. The choice of sensing device is an important factor in the evaluation of the level of excitement of a game because it can affect the recognition of test participation. To this end, we used three non-introversive hardware devices: webcam, keyboard, and mouse. The data collected from the three devices were collected by an in-house-developed multi-modal parameter sampler and synchronized to the time axis. The basic parameters are visualized in real time in the form of graphs. The collected data can be outputted to a csv format file, and for comparison with the actual gameplay video, the played video was recorded using a separate screen recording program. The system user can examine the finally generated csv file and watch the recorded play video to determine the interaction behavior the player performed in certain gameplay. Fig. 3 shows the data collection environment used.
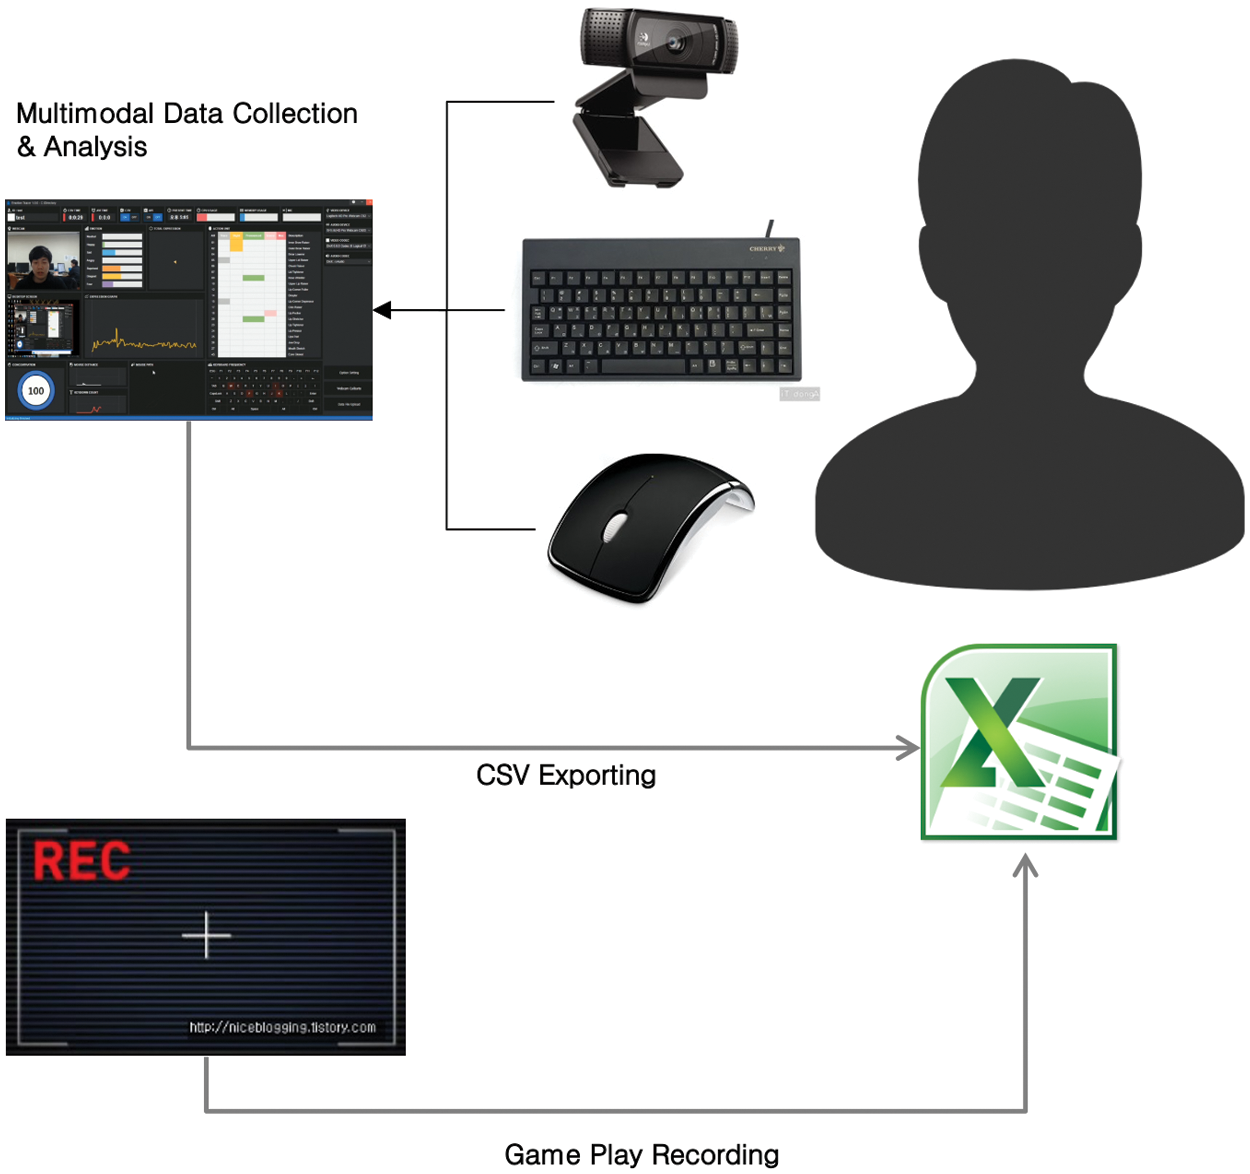
Figure 3: Data collection and output environment used
4.1 Multi-Modal Parameter Sampler
The webcam captures the user’s face images at a normal HD resolution. The input video images are delivered to the convolutional neural network (CNN)-based facial expression detection module and used to detect facial expressions and micro-features. For the keyboard input data, all the user’s key input information is saved in the format of an ASCII data list. The system can construct a keyboard heatmap from the input keyboard information list. Furthermore, it can be determined which keyboard the user is mainly used. The mouse input data record the position value on the screen whenever a left or right mouse button is clicked. Based on this record, the system can generate the mouse trajectory information. The mouse trajectory information shows the zone in the game where the user has intensive interactions. Mouse movement information can also be used to generate a heatmap for mouse clicks on the screen. The mouse trajectory heatmap is helpful for checking the major clicking zones on the game screen.
Our system can collect and analyzing a variety of information from the mouse and keyboard, but in our experiments, we mainly defined a time-series graph, where the Y value has an average input frequency for 30 s against the time axis. We defined this graph as a mouse and keyboard interactive graph. This was because for the outlier behavior analysis, we expected that meaningful analyses could be performed by determining whether pertinent inputs had occurred, rather than the keyboard and mouse input contents. Furthermore, this pertained to universal mouse and keyboard input responses, irrespective of the content in the game.
4.2 Facial Expression Detection Module
Our CNN-based facial expression classifier is an extension of the facial expression classifier used in Gu’s work (2016) [35]. The dataset used to train the model was from the Kaggle Facial Expression Recognition Challenge (FER2013). It comprises 35,887, 48-by-48-pixel grayscale images of faces each labeled with one of the seven emotion classes (anger, disgust, fear, happiness, sadness, surprise, and neutral). The model consists of three sequential convolution layers (32, 64, and 128 feature maps). The softmax activation function was used at the output layer. The model performs well in terms of classifying positive emotions, resulting in relatively high precision scores for happy (76.7%) and low precision of sad (39.7%). Our goal is to map the major facial expressions detected in gameplays to a 1D pleasure axis. To this end, the results of the seven detected expressions must be mapped to the pleasure axis. We assigned two emotions (happy and surprise) as positive change values, Facepositive, and the remaining four emotions (anger, disgust, fear, and sadness) as negative change values, Facenegative. These assignments were intended to configure a similar number of positive and negative training data in the overall data distribution. When the emotion was neutral, the corresponding values were not reflected. The tension graphs can be discretized with the average value of pleasure collected during the pertinent period at arbitrary time intervals. This reflects a characteristic of gameplay in that major play sections are not continuous but discrete. Eq. (1) is the tension graph calculation formula. Facepositive and Facenegative are reflected as much as the weight values w1, w2.
4.3 Micro Expression Detection
The interpretation of facial expressions in terms of emotions has been a rich topic of research in the field of psychology. For emotion analysis, higher-level knowledge is required. Facial expressions can convey emotions, but interpretation is aided by context, body gestures, voice, individual differences, and cultural factors. Many microfacial expression studies have been conducted since the study by Eckman [36]. Among these, polygraph detection [37] is the most widely used micro-behavior detection technology. We believe that the automatic detection of specific micro-behaviors in the broadcast could provide additional information to the production team.
We used Dlib [38] to extract the feature points from the face. From these, we selected major change elements that are believed to be necessary for outlier behavior analysis. Based on experience, we defined the mouth as a facial component that has the greatest influence on the facial expressions of the user. This is because when the mouth is opened, it occupies the largest area on the face, at which point changes in facial expressions are very large. Because the shape of the mouth, among different facial components (eyes, nose, mouth, and eyebrows) fluctuates widely during the game, it needs to be monitored with greater interest. We defined the amount of change in micro-expression as the sum of changes in the angles of the eyes, nose, mouth, and eyebrows (Expeyes,
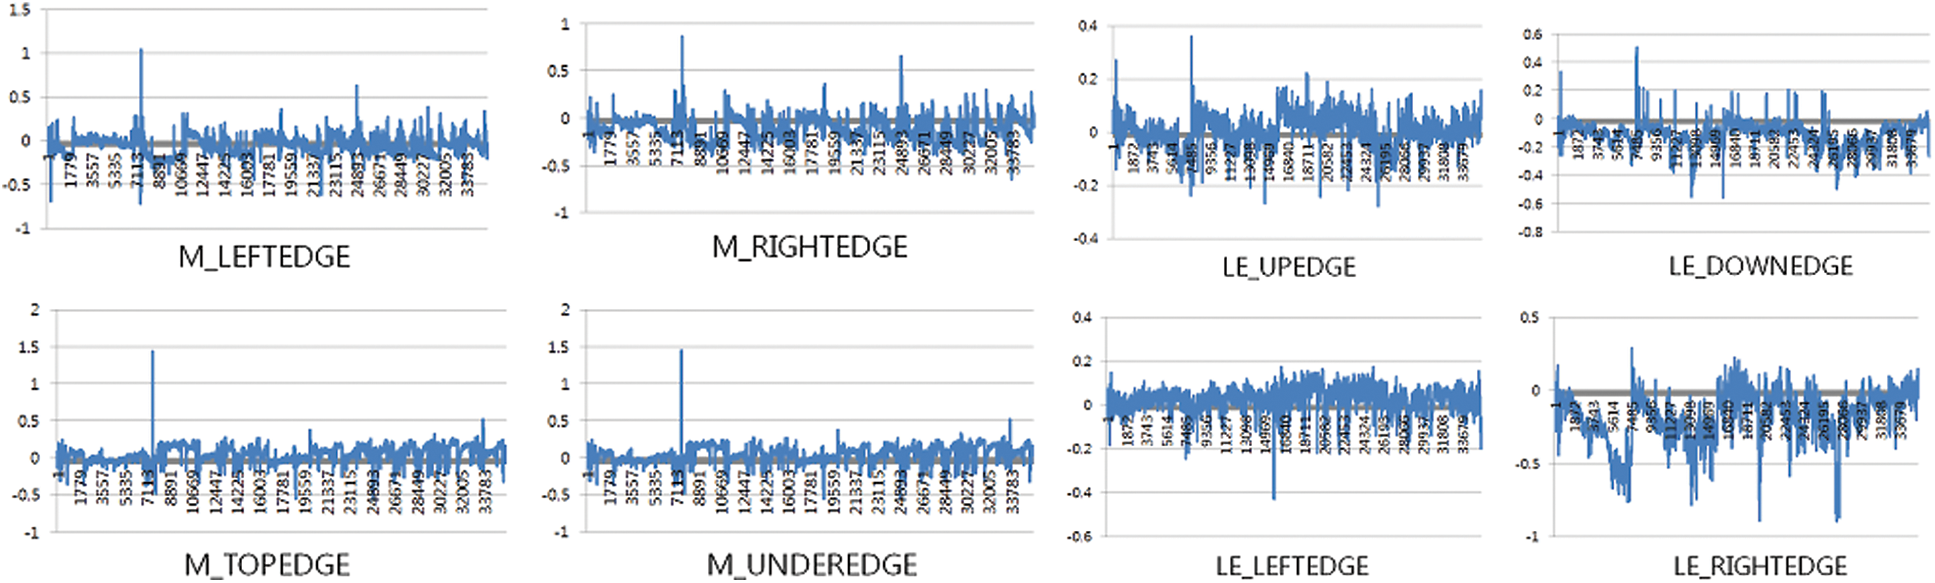
Figure 4: Micro expression graphs of eye and mouth areas
In typical console/PC gameplays, events occur sequentially at the levels intended by the game designer. Here, players sequentially experience a series of important events. These play situations indicate that the user’s response may show certain patterns based on the time axis. For example, suppose there is a play for experiencing a mission of infiltrating an enemy base and rescuing hostages, then the user experiences the events of infiltration–breaking in–hostage rescue–enemy pursuit–escape sequentially. Here, the emotional intensity of the user starts with low tension at the beginning, such as in the structure of the introduction-development-turn-conclusion. Furthermore, the most dramatic experience can be expected in the highlight scene, followed by a decrease in excitement. This pattern shows that when the user’s time-series response patterns are visualized at certain time intervals, their similarities can be quantified and compared. The order of event experiences may be the same, but the playtime of each event may differ between players. Therefore, a similarity measurement algorithm that corrects the time length difference is required to accurately measure the similarity.
We used a DTW algorithm [39] to compare the similarity of the time-series data. In time-series analysis, DTW is an algorithm for measuring the similarity between two temporal sequences, which may vary in speed. DTW has been applied to temporal sequences of video, audio, and graphics data. In normal gameplays, the start of the game is the same, but the ending time of the game varies by user. However, DTW compensates for these differences in play length.
We created a tension graph (TensionGraph), micro expression graph (MicroGraph), and mouse and key-board-interactive graphs
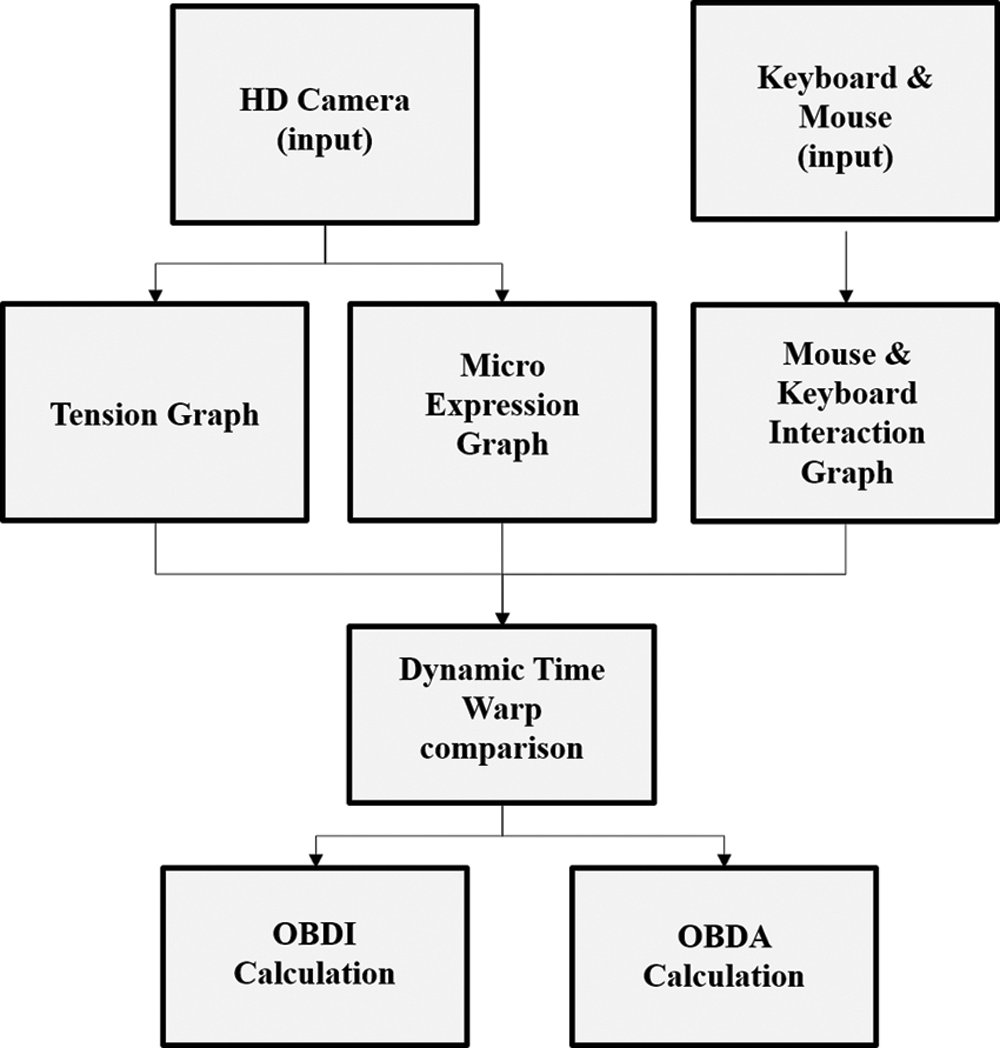
Figure 5: System flowchart
To investigate the usefulness of our system, we conducted experiments using two games: BioShock Infinite and League of Legends. BioShock Infinite is a single-player-oriented first-person shooter (FPS) game, and League of Legends is a multi-player-oriented third-person action game. Fig. 6 shows a screenshot of each game.

Figure 6: Bioshock infinite (left) and league of legend screenshots (right)
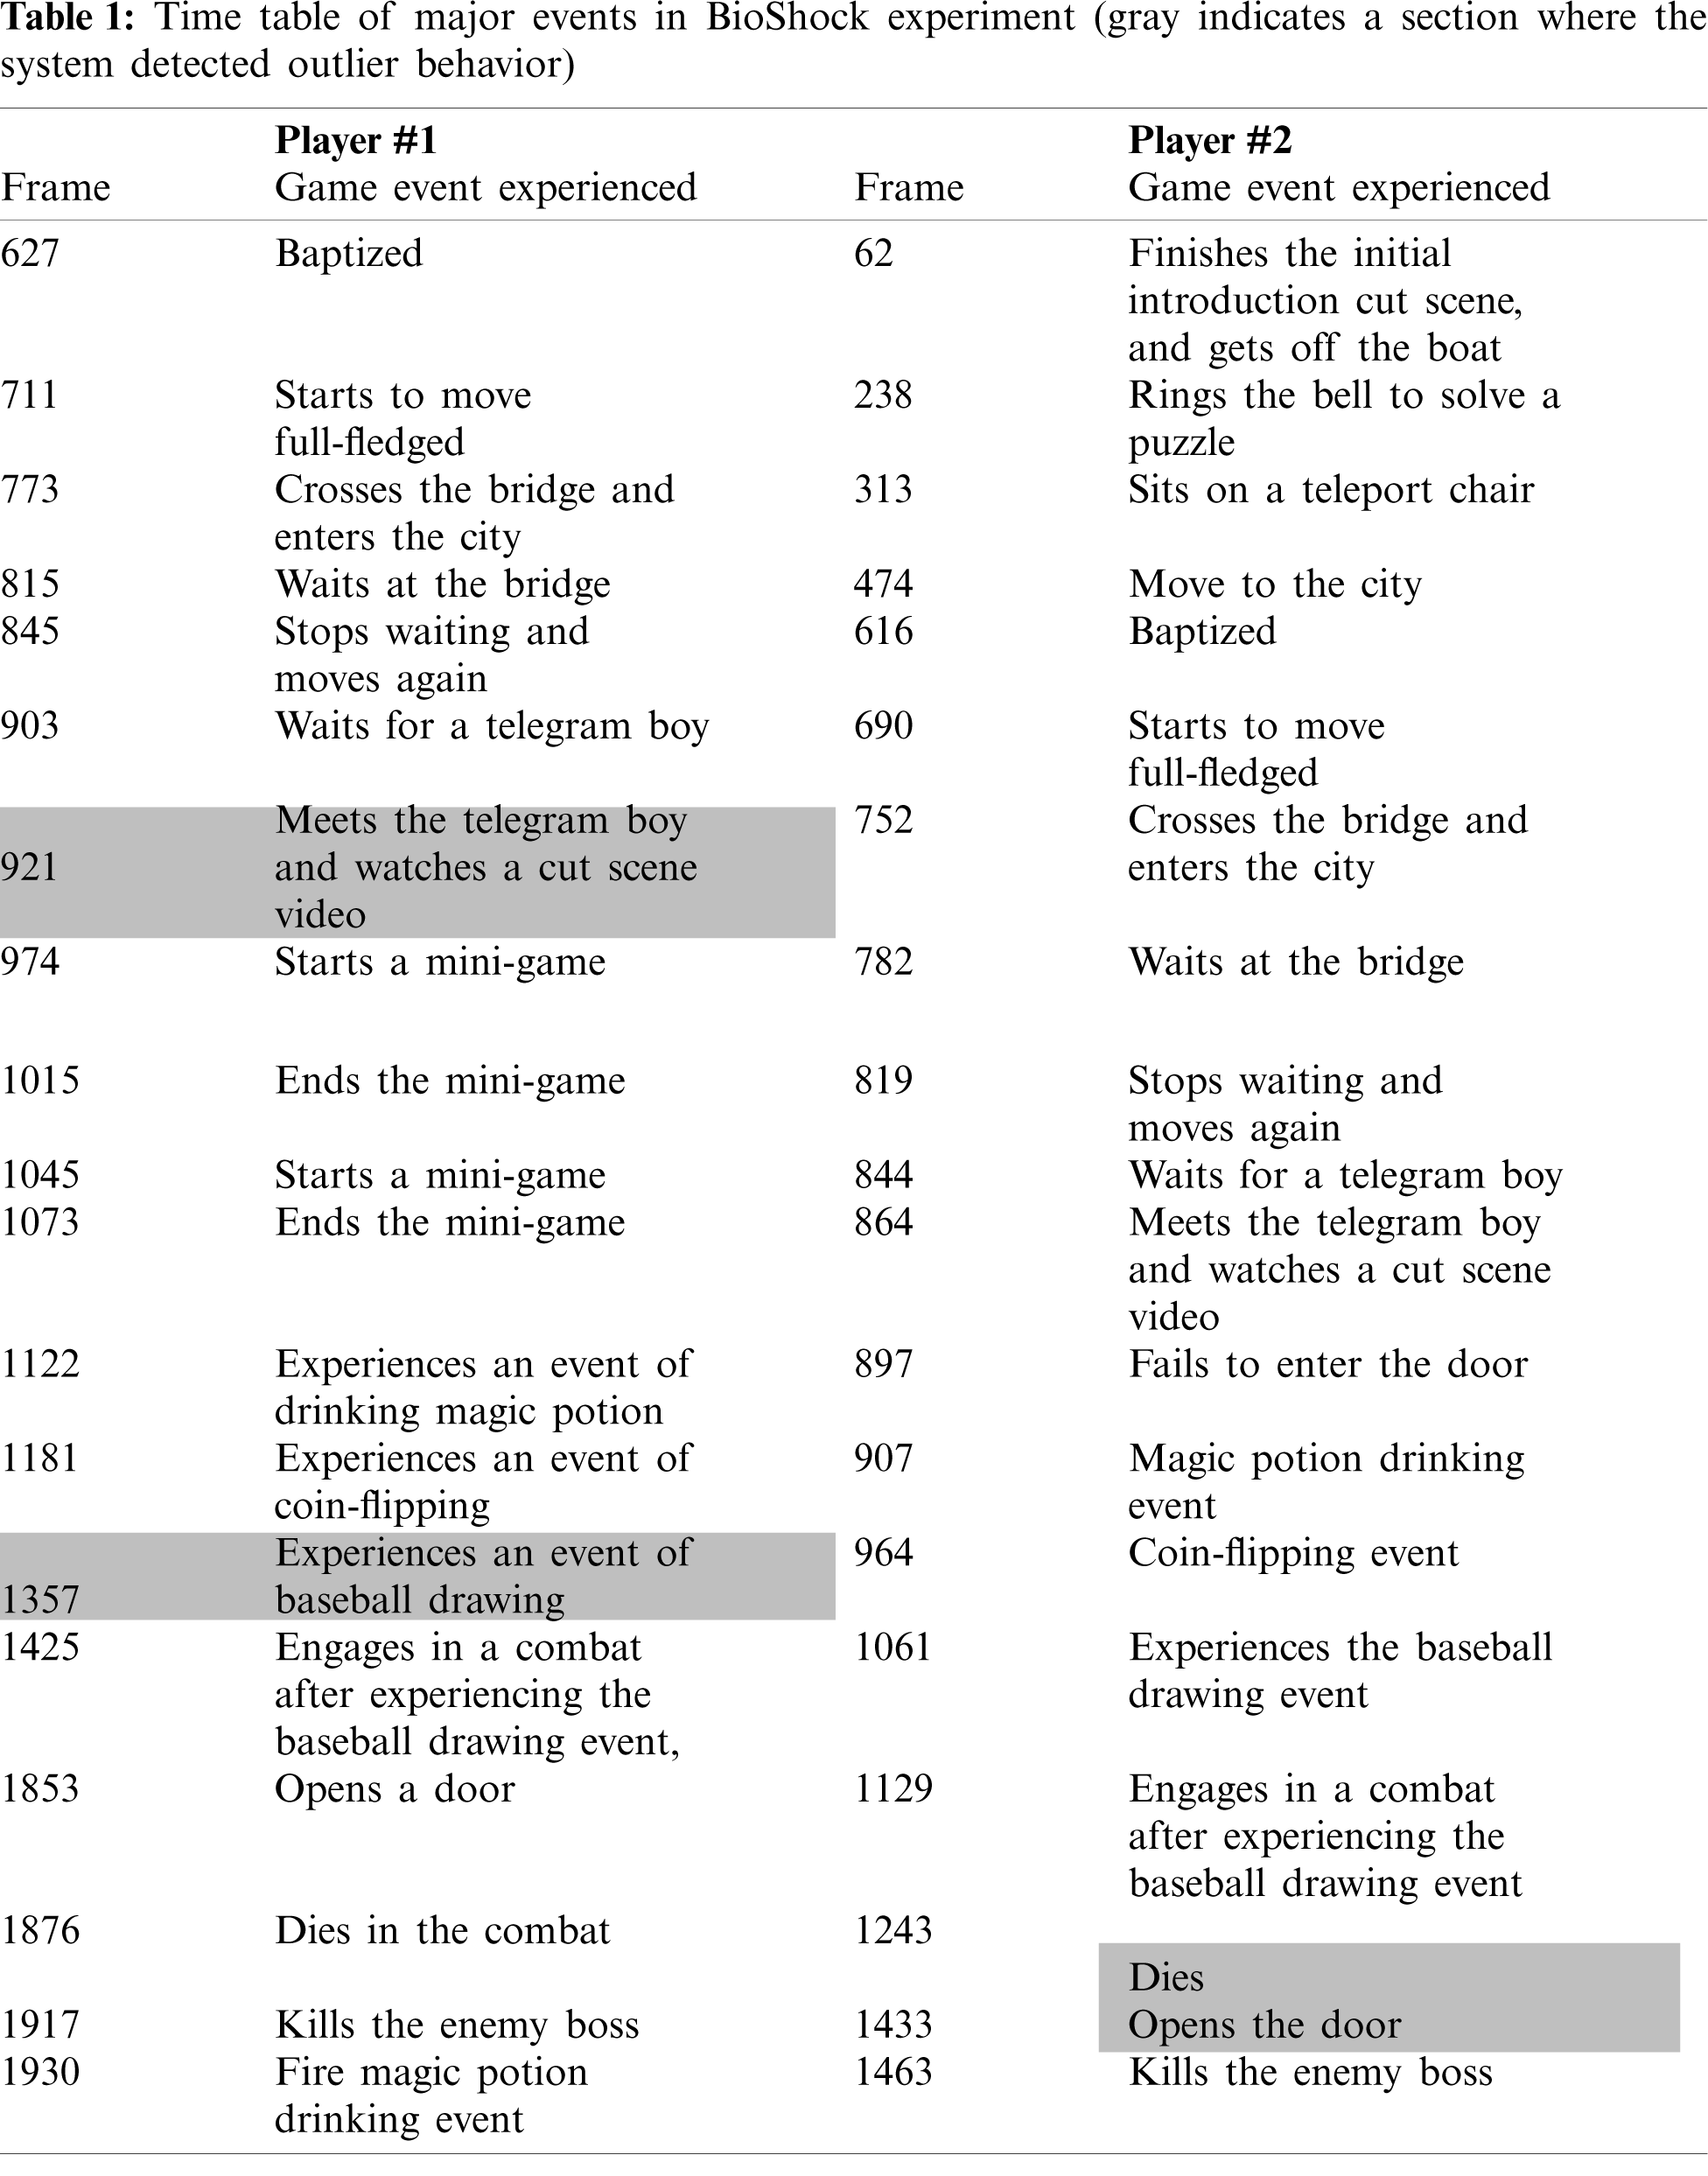
The first experiment was conducted to check whether the OBDI that we defined was meaningfully detected. BioShock is a stage with a dramatic storyline. Table 1 shows the sequences of the major events in that stage. This table shows that while the events occurred in similar sequences in the game, two players experienced them at different times.
First, we designated an arbitrary game designer and requested to enter a typical tension graph pattern expected from the perspective of the game designer. The game designer’s role was performed by the player who had played BioShock the longest. Then, we checked to determine whether it was possible to detect a pattern of the experiment subject that showed the most similar play pattern to the pertinent play pattern. Fig. 7 shows the intended tension graph of the designer, the tension graph, and the zero area of the user with the highest similarity score. In this graph, the positions of the two most dramatic scenes in the middle and second halves of the game are accurately detected. There were many more sections with no interaction for this player compared to other users. The interview with the player after the experiment revealed that the user had a beginner experience with FPS games and played the game with immersion in all the major event sections. The experimental results confirmed that 60% of all users showed a tension graph containing two intended peaks within the defined similarity range. The pattern showing the biggest difference for distinguishing them is the number of peaks, at which the emotional change is the highest in the game. The game designer expected that the peak would appear on the graph at the two video cut scenes, but in the actual results, one or more peaks occurred in some cases. This demonstrates that users have a wider range of play patterns than the game designer’s intention.
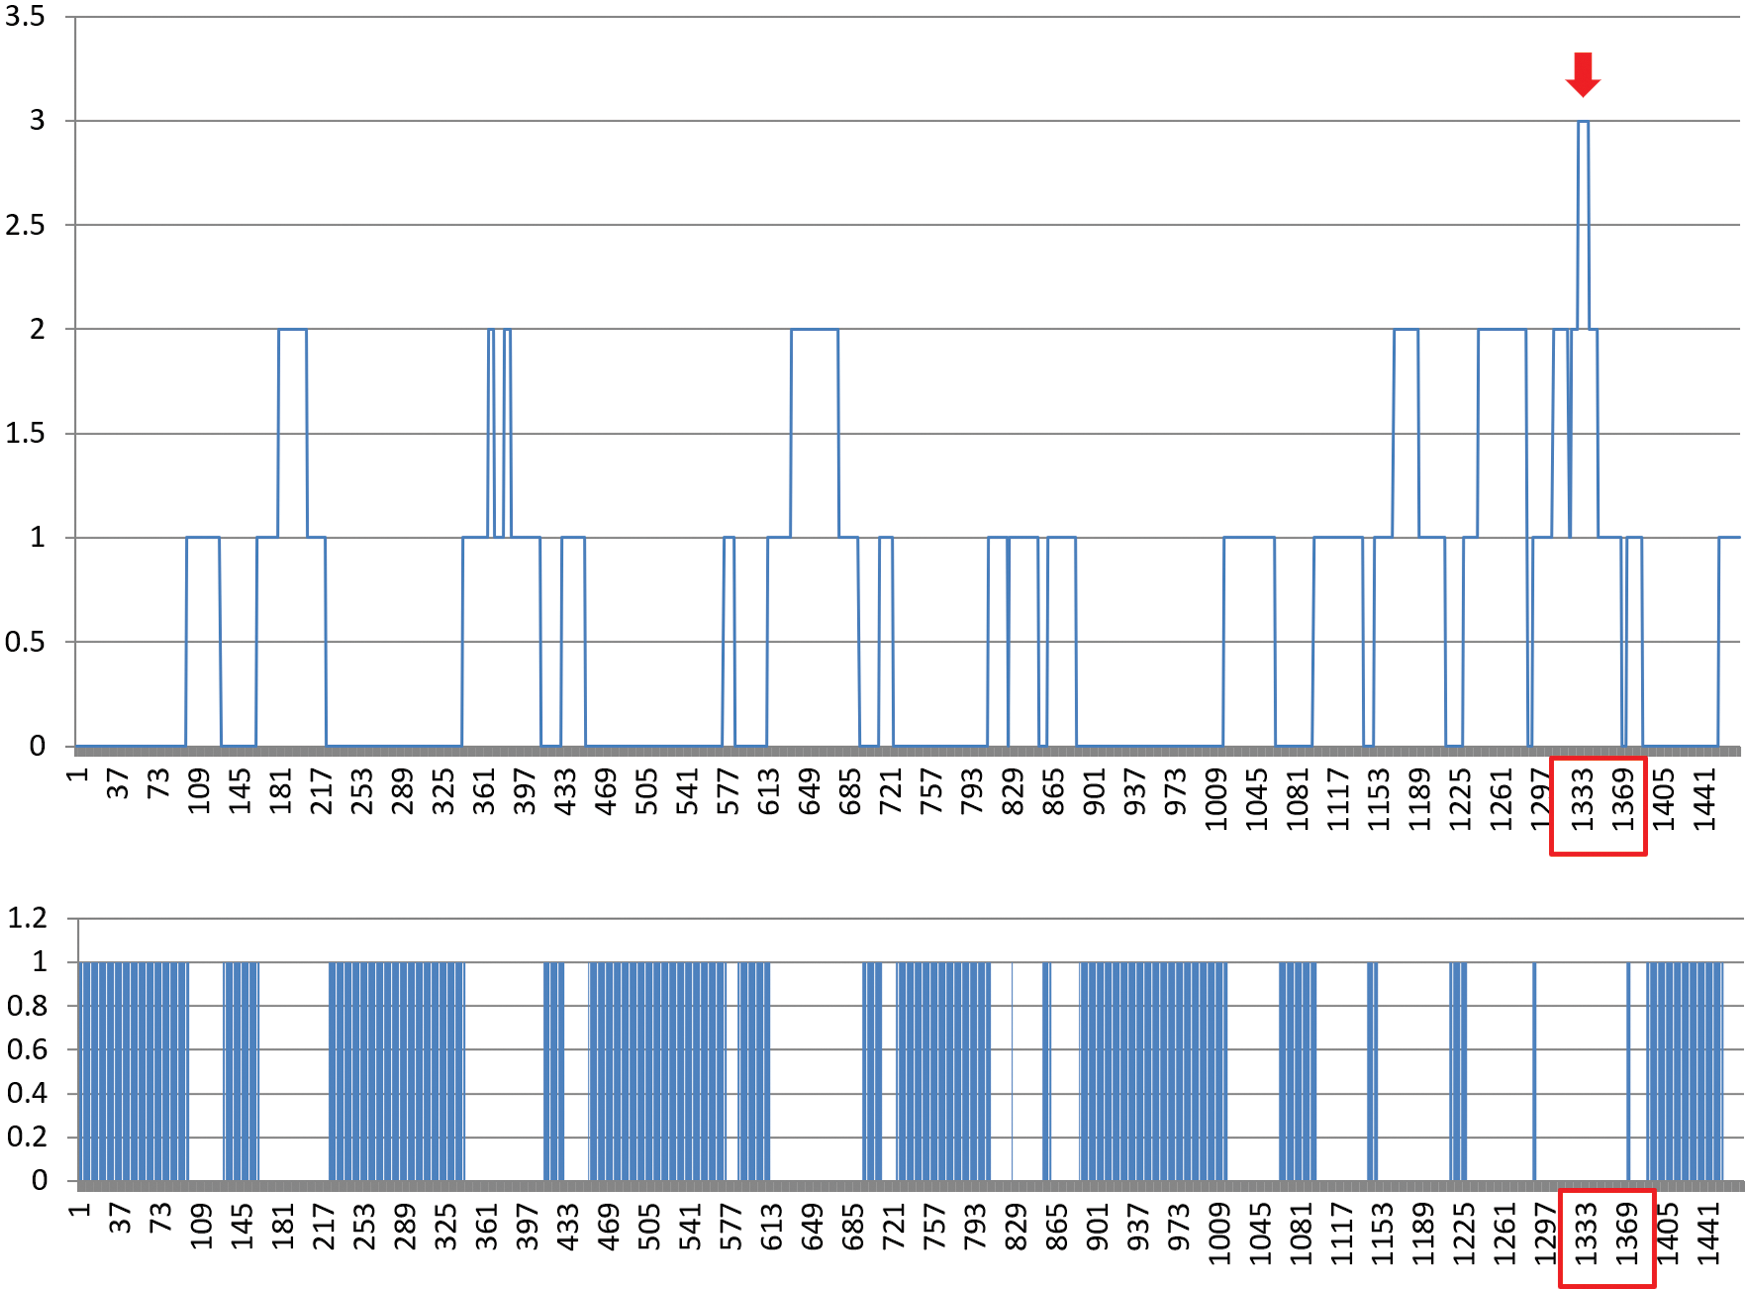
Figure 7: Tension graph (above) and zero area (below) of a player showing the highest similarity to Outlier Behavior Different from Intention (OBDI)
Figs. 8 and 9 show the keyboard and mouse interaction graphs of Player #1, respectively. In typical FPS games, the WASD keys on the keyboard are usually used to move, and the mouse button is usually used as an interface for aiming at enemies and firing the gun. The level of overall interaction was initially low, and then the most dramatic peak point appeared between 1400 and 1800 when the final highlight combat occurred, after which the level decreased. This can be seen as a change in the interaction intensity intended by the game designer. The Min and Max differences of the input intensity are large in frames above 1000 because a very large number of input and input pause periods occur alternately during the process of playing various mini-games. The tension graph of Player #1 was like the expected tension graph of the game designer, but the input frequency graph showed different patterns. This phenomenon occurred because, in contrast to the designer’s intention, the player played many mini-games of the event nature in the middle. These mini-game plays did not have a significant impact on the emotional tension of the user, but they affected the physical behavior outcome.
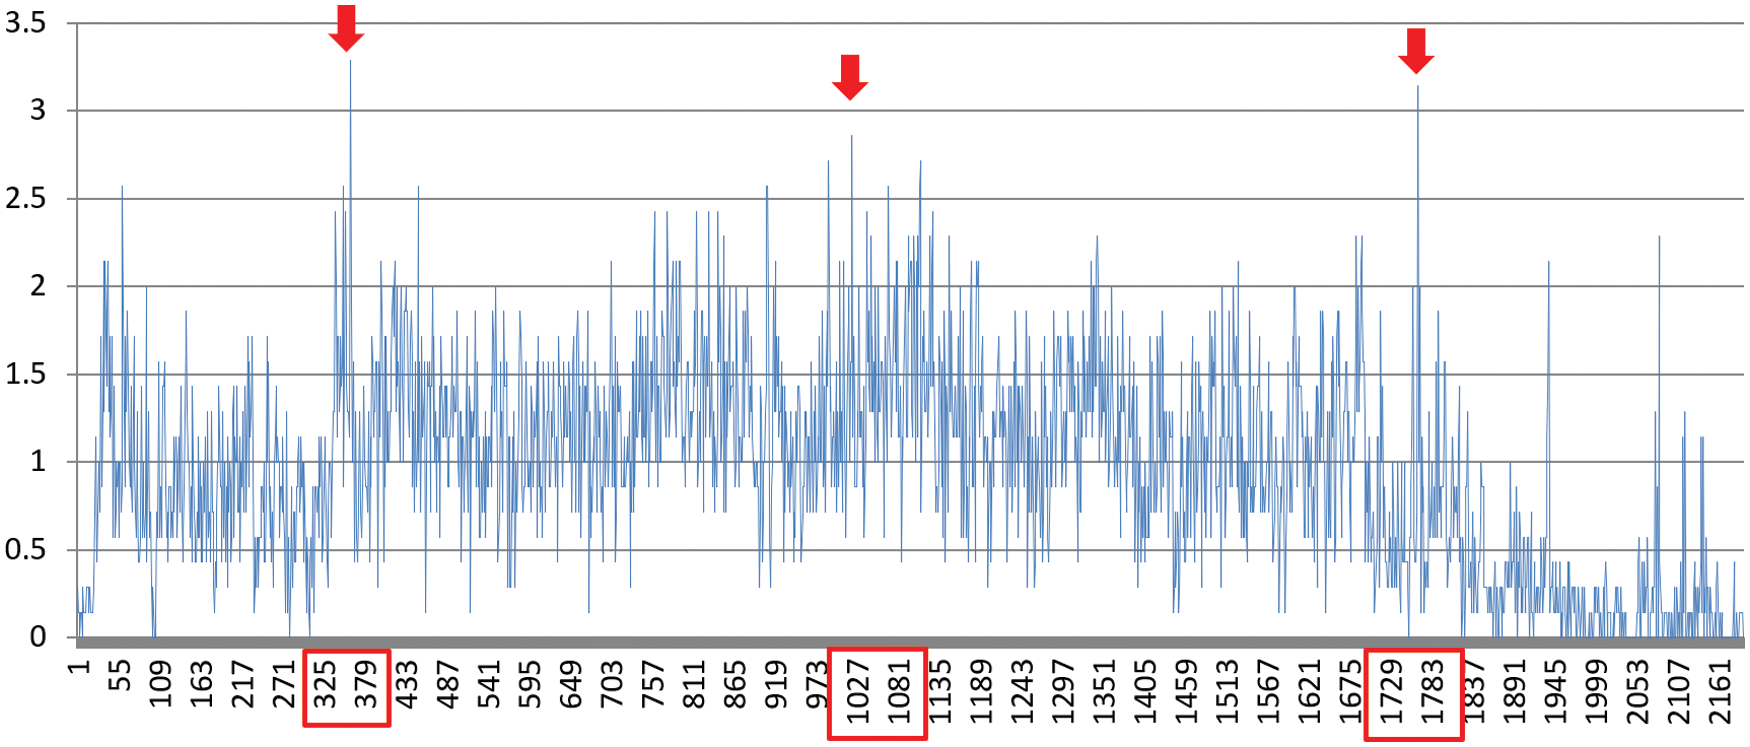
Figure 8: Average number of inputs per second graph for all keyboards
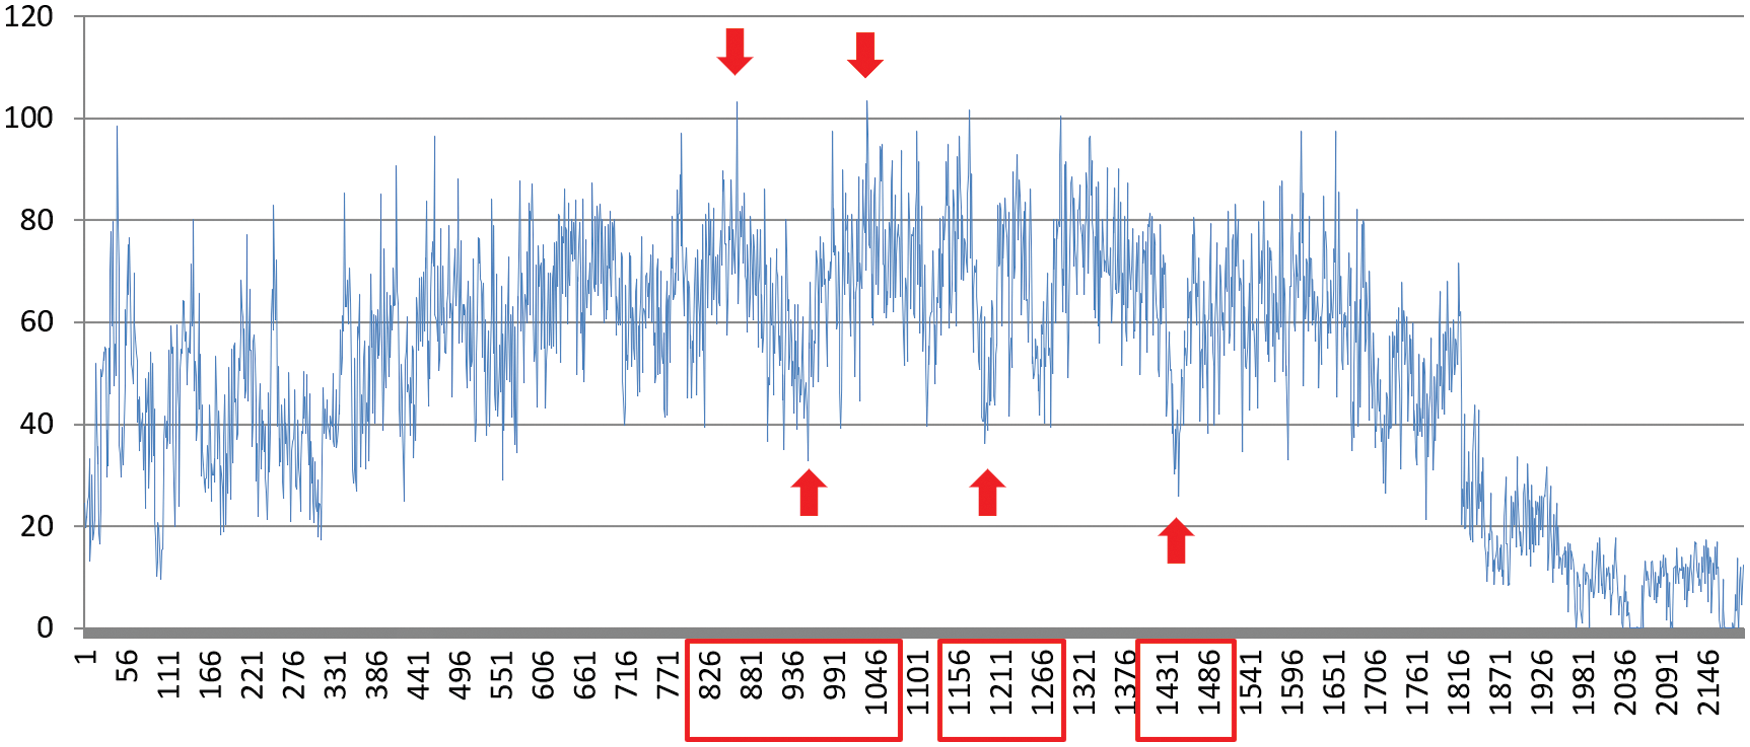
Figure 9: Graph showing average distance moved by all mouses
We examined OBDA detection results. Fig. 10 shows the resulting graph of OBDA detected by our system. The number of peaks for this experimental subject (Player #2 in Table 1) was 1. This experimental subject showed no response in the two cut scenes in the game. The user’s response was the greatest in the section where the game was confirmed to be cleared. Furthermore, the zero areas are almost fragmented. This implies that the user showed specific facial expression changes in the majority of sections. The results of the interview conducted after the experiment confirmed that the user had a lot of experience playing FPS games. The experiment subjects were more interested in the game itself than the cut scene video, and it appeared that the greatest response was shown in the part where the sense of achievement was felt after clearing the game. This pattern was visualized in fragmented zero areas.
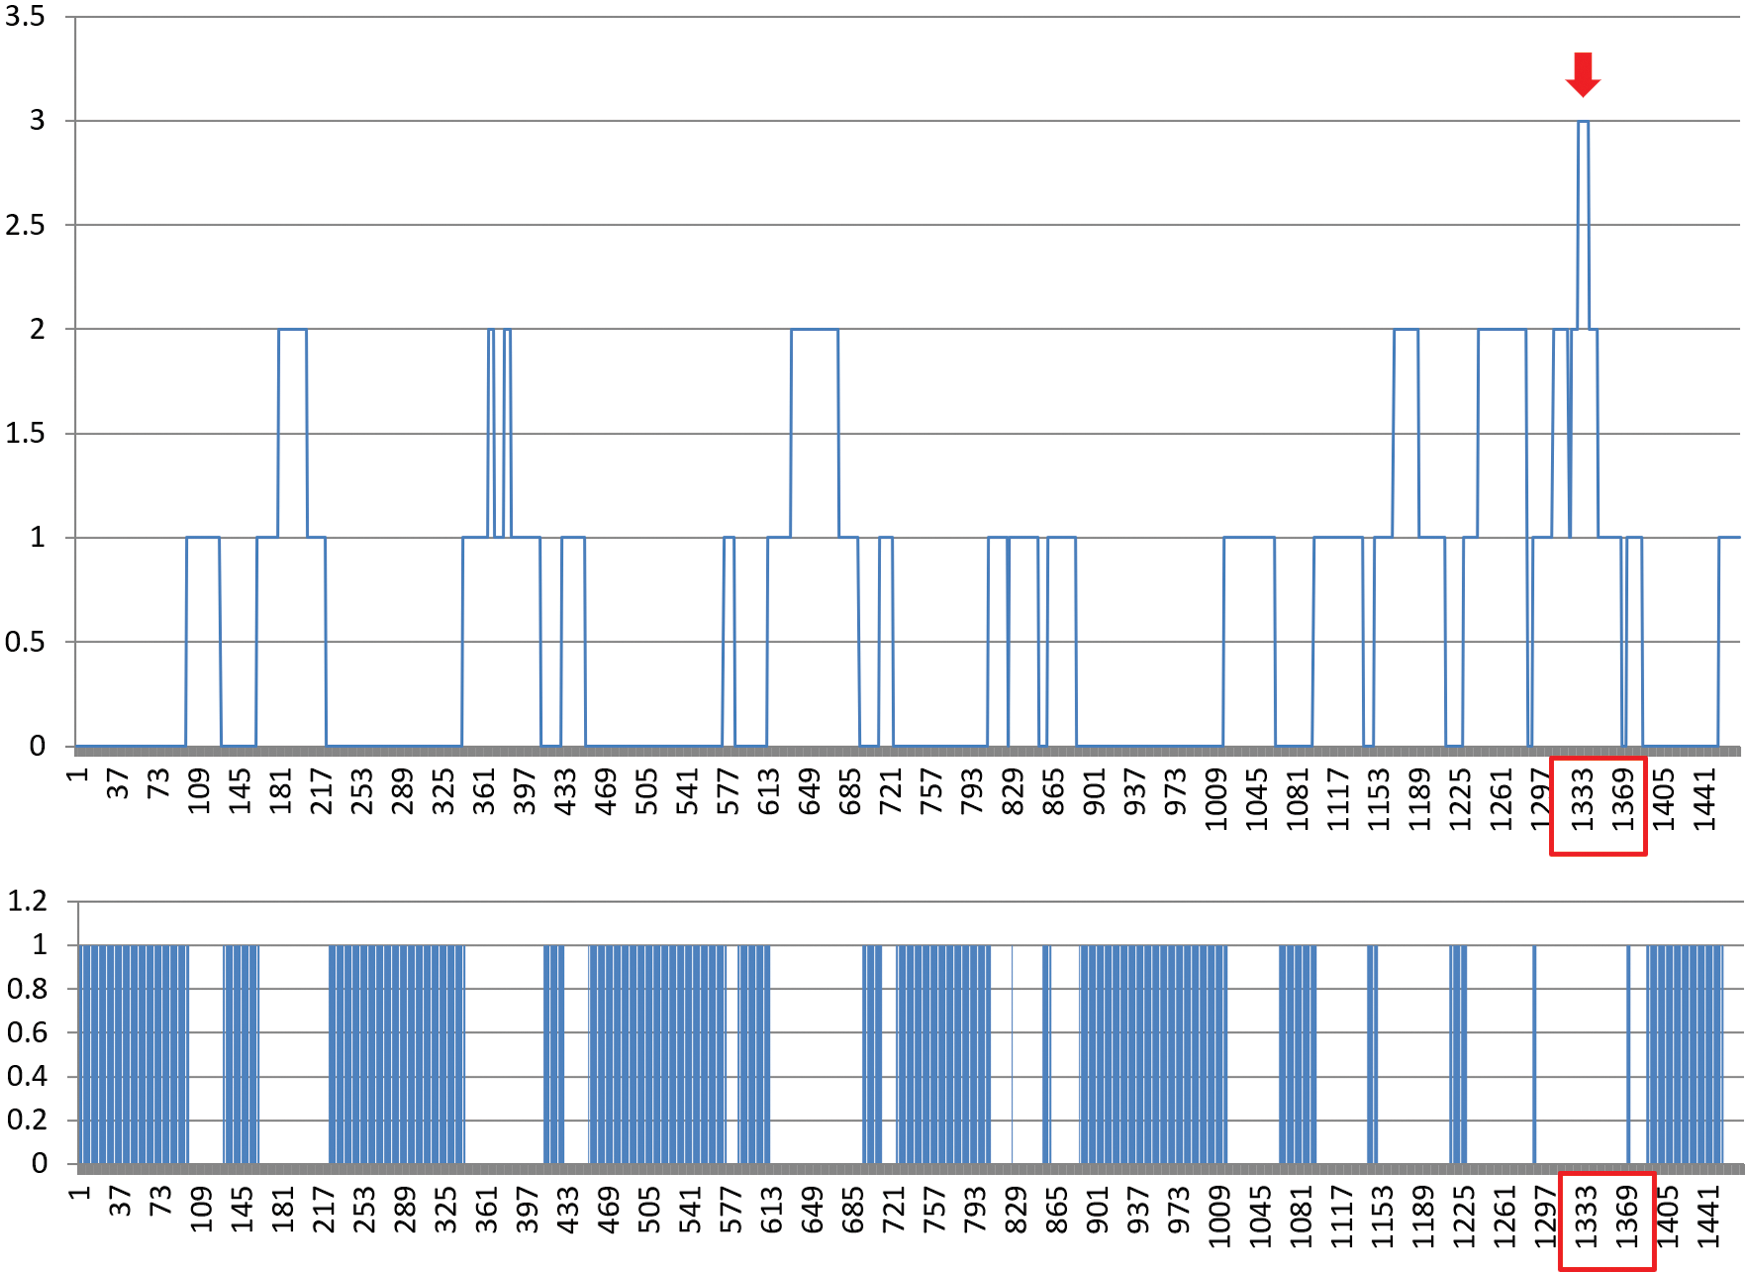
Figure 10: Analysis results in BioShock experiment (tension graph (above) and zero area (below))
The next experiment was conducted using the League of Legend (LOL) game. LOL is a player vs. player (PvP) game in which players compete in real time. In these games, events occur based on the interactions between users, rather than based on the game designer’s intention. As a result, nonlinear events occur, as opposed to linear events. In this play environment, sequential events intended by the game designer do not occur. Therefore, unlike linear gameplays such as those of BioShock Infinite, it is very difficult to predict LOL plays.
From the experimental results, we confirmed that the OBDA can also be defined in a nonlinear event play environment. This is because the following play pattern exists owing to the characteristics of the LOL game: the leveling-up gameplays occur at the beginning of the game, in which the player fights non-player characters (NPCs); afterward, PvP games occur, in which the player fights other players. If a player has a PvP gameplay with another player during the leveling-up gameplay, it is detected as OBDA. Fig. 11 shows an OBDA result detected in LOL by our system; the number of peaks for this user is three. When the play video was checked, it was found that peaks occurred when the player died. According to the interview results, the player was a beginner in the LOL game and was afraid of dying during the game, thereby playing single-player-oriented gameplays while avoiding almost all combats. When the user was playing LOL, the zero areas were highly fragmented. This occurred because of the continuous combat. Unlike BioShock Infinite, the PvP-oriented LOL allowed the OBDI to be defined in two stages: level-up and combat. Peaks often occur mainly before and after killing. This was because the greatest emotional change occurred when the player killed an enemy or when the player’s character died, while a very low level of interaction occurred for a while owing to the waiting time, increasing the potential of a zero-area occurring in that area. Fig. 12 shows the results of visualizing the input patterns in the frequency domain. Overall, the difference in the input frequency is more evident in the frequency domain. Therefore, the visualization technique in the frequency domain can more intuitively show the frequency of deaths during gameplay and the frequency of zero areas triggered by death.
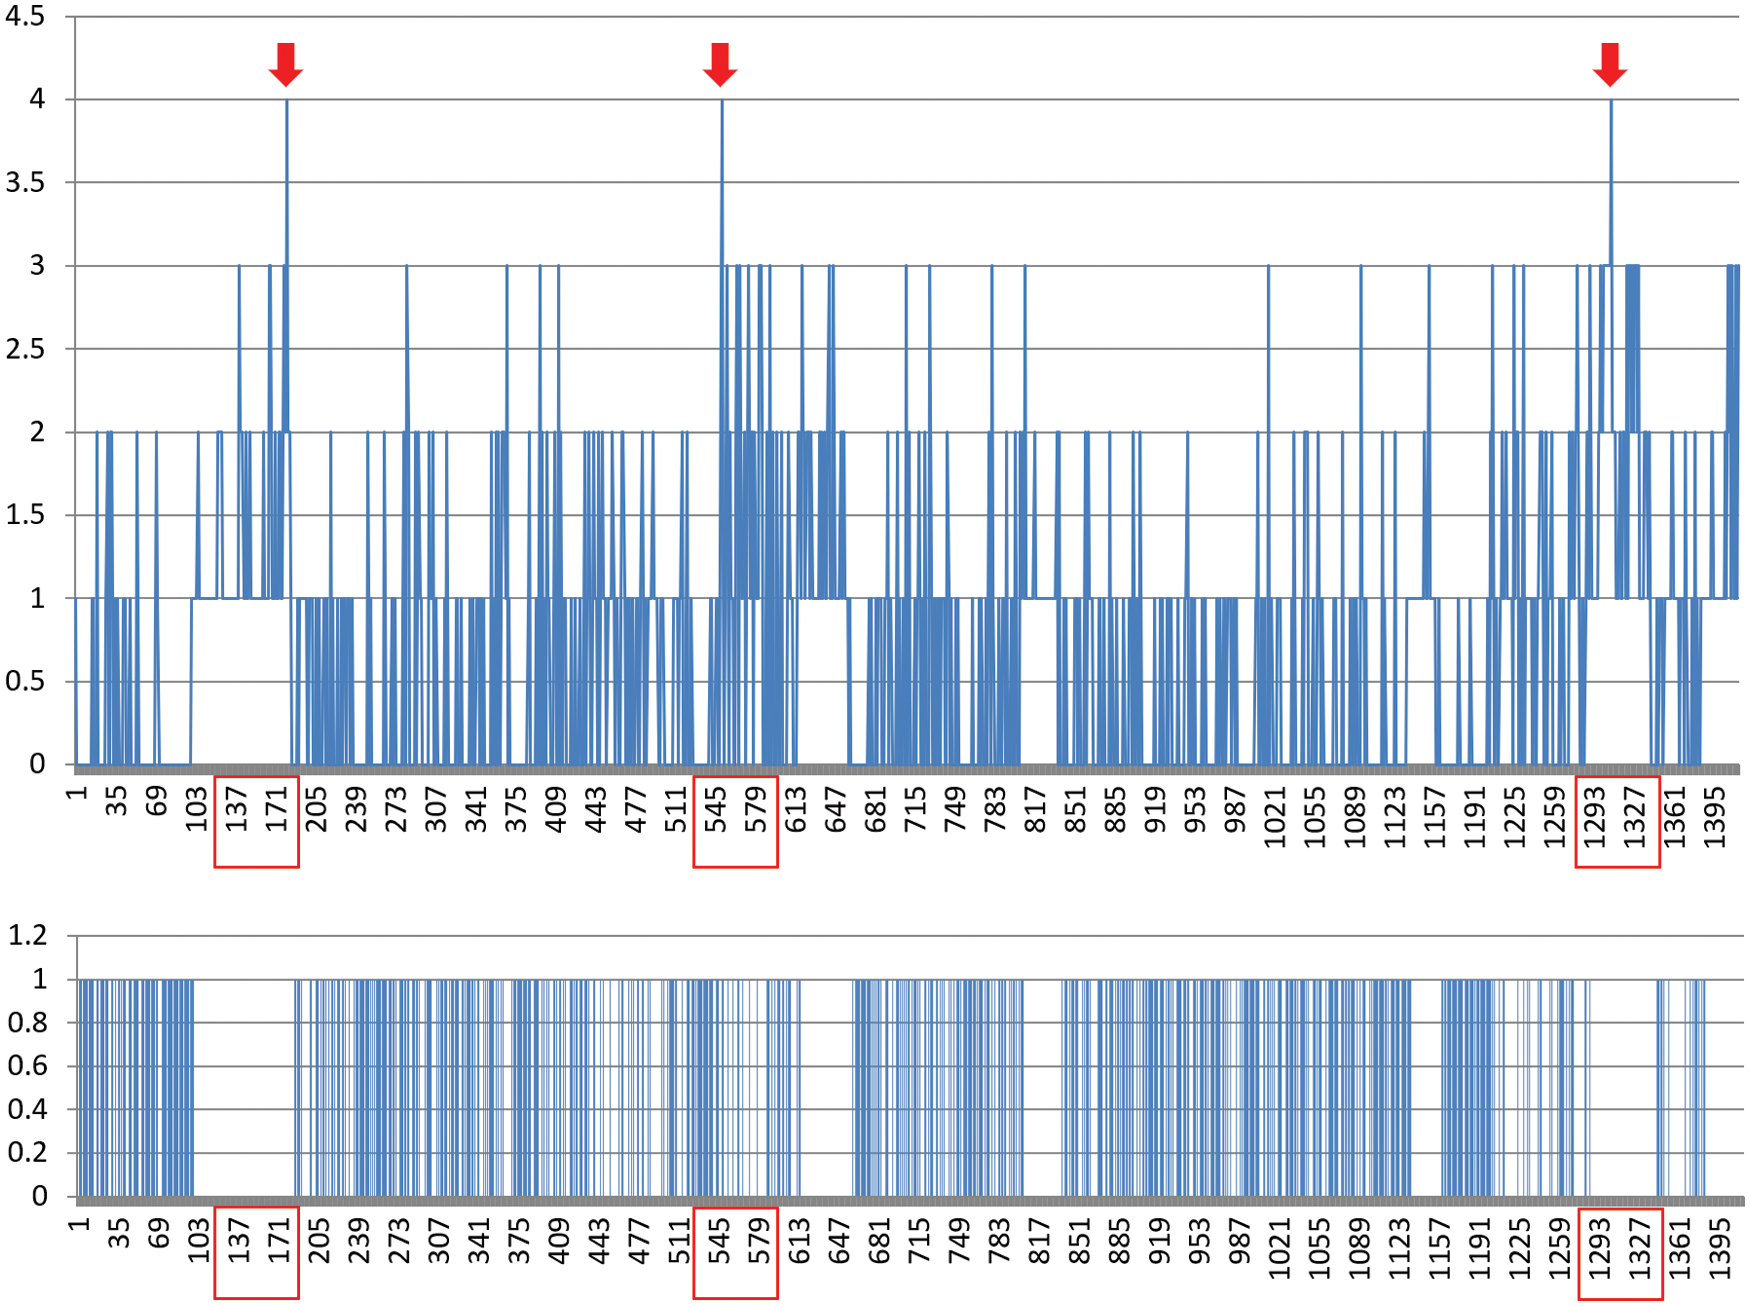
Figure 11: Analysis results in league of legend (Tension graph (above) and zero area (below))
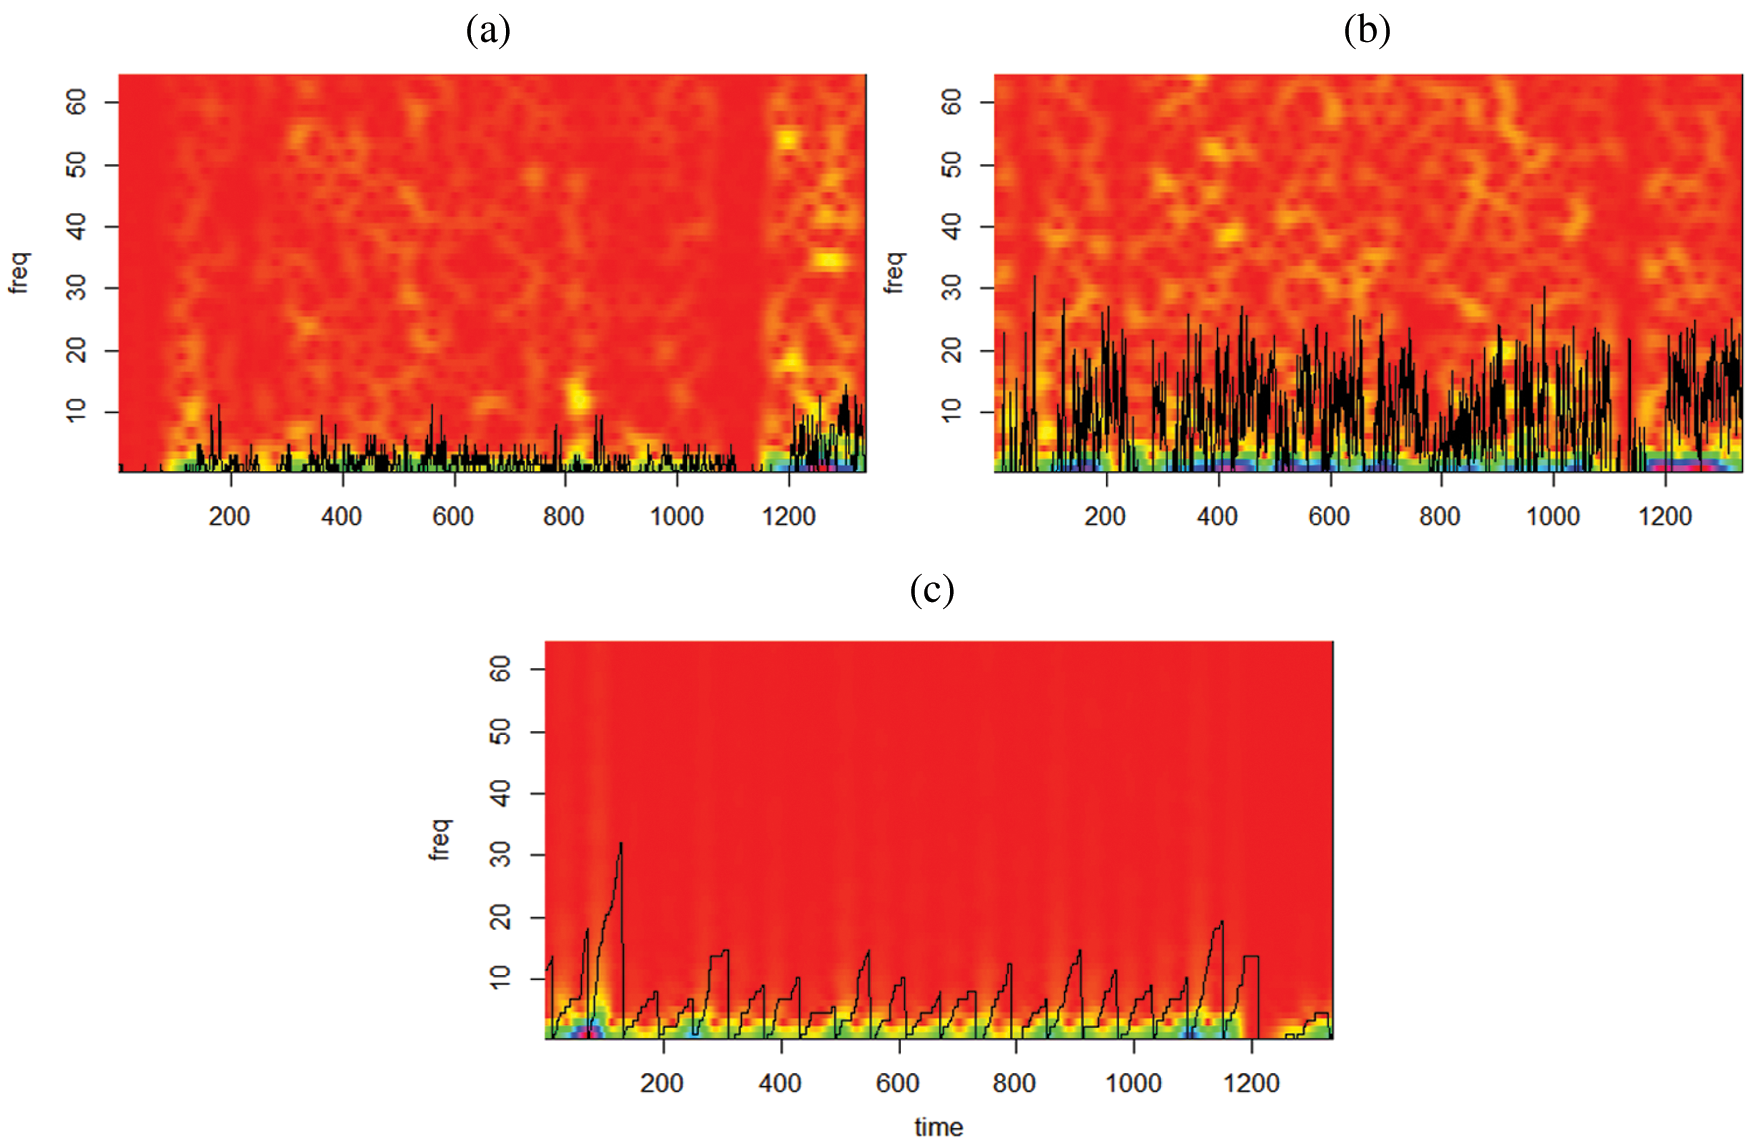
Figure 12: Input pattern visualization results in the frequency domain (a) STFT spectrum result of low-level input frequency graph, (b) STFT spectrum result of high-level input frequency graph, (c) STFT spectrum result of eye-blinking
We examined the usefulness of the proposed system based on two games. The DTW algorithm-based outlier behavior detection system operated relatively more stably in a game that provided linear events. This is because the DTW algorithm calculates the similarity based on the graph shape. When the events occurred in a nonlinear manner in the game, repetition and periodicity played a more important role than the shape of the graph. Here, it was confirmed that the analysis in the frequency domain yielded more useful results than the time-series-based algorithm.
Our system has the advantage of being able to analyze unusual behavior in a game using a general PC device, but it also has the following disadvantages. The first disadvantage is that it is necessary to set the optimal value for the reflection weight between multi-modal data through a lot of trial and error. Because these values are affected by various external factors such as game genre, interaction requirement level, system complexity, party play, and chat/voice availability, it may be difficult to find an optimal value. The second disadvantage is that some of the behaviors of outliers detected may be the user’s repetitive habit or may be unrelated to the game, such as sudden shifts. This occurs very conspicuously when the experiment is conducted in a real living space, rather than in a laboratory environment. To solve this problem, personalized repetitive behavior detection technology based on machine learning should be studied further.
In this paper, we proposed a system for detecting two outlier behaviors in gameplays. We synchronized and used the multi-modal data input from the camera, keyboard, and mouse and used a DTW algorithm and frequency analysis to compare the similarity between time-series data. To verify the users’ responses, existing game user surveys and user surveys from experiments were used in the gaming field. These surveys either rely on user self-reports (interview, inquiry, focus group, etc.) or are often conducted through an analysis report of user video monitoring. This kind of study is easy to conduct because as more user data is collected, it becomes more substantial, and it becomes easier to infer reactions properly. However, in order to perform a self-report, the users must invest time outside gameplay, their subjectivity can easily be compromised, and the analysis of user self-reports is quite time-consuming.
The proposed system runs an independent detection program together with the game client and collects data on a server, which allows for automatic analysis and visualization. This form of simplification greatly reduces the need for temporal and human resources. In addition, there is no need for additional physical equipment, which saves time and space. Our methodology shows that the feedback on the experience can be received quantitatively for the gameplay intended by the game designer at the game level. Our results suggest a methodology that can introduce emotion analysis technology, which has been studied mainly in academia, into the game development process, which helps to accelerate the application of emotion analysis technology to game players and game players in the future.
Funding Statement: This research was supported by the Basic Science Research Program through the National Research Foundation of Korea (NRF) funded by the Ministry of Education (2021R1I1A3058103).
Conflicts of Interest: The authors declare that they have no conflicts of interest to report regarding the present study.
1. Hudlicka, E. (2008). Affective computing for game design. Proceedings of the 4th International North American Conference on Intelligent Games and Simulation, pp. 5–12. Montreal, Canada. [Google Scholar]
2. Lee, E., Jang, Y., Yoon, D., Jeon, J., Yang, S. I. et al. (2008). Game data mining competition on churn prediction and survival analysis using commercial game log data. IEEE Transactions on Games, 11(3), 215–226. DOI 10.1109/TG.2018.2888863. [Google Scholar] [CrossRef]
3. Ahn, J., Hwang, J., Kim, D., Choi, H., Kang, S. (2020). A survey on churn analysis in various business domains. IEEE Access, 8, 220816–220839. DOI 10.1109/ACCESS.2020.3042657. [Google Scholar] [CrossRef]
4. Chung, Y., Park, C. Y., Kim, N. R., Cho, H., Yoon, T. et al. (2013). Game bot detection approach based on behavior analysis and consideration of various play styles. ETRI Journal, 35(6), 1058–1067. DOI 10.4218/etrij.13.2013.0049. [Google Scholar] [CrossRef]
5. Bänziger, T., Scherer, K. R. (2007). Using actor portrayals to systematically study multimodal emotion expression: The GEMEP corpus. Lecture Notes in Computer Science, 4738, 476–487. DOI 10.1007/978-3-540-74889-2_42. [Google Scholar] [CrossRef]
6. Petrantonakis, P. C., Leontios, J. (2014). EEG-Based emotion recognition using advanced signal processing techniques. In: Emotion recognition: A pattern analysis approach, pp. 269–293. [Google Scholar]
7. Wang, Y., Agrafioti, F., Hatzinakos, D., Plataniotis, K. N. (2008). Analysis of human electrocardiogram for biometric recognition. EURASIP Journal on Advances in Signal Processing, 1–11, 148658, DOI 10.1155/2008/148658. [Google Scholar] [CrossRef]
8. Wagner, J., Kim, J. H., Andre, E. (2005). From physiological signals to emotions: Implementing and comparing selected methods for feature extraction and classification. IEEE International Conference on Multimedia and Expo, pp. 940–943. Amsterdam, Netherlands. DOI 10.1109/ICME.2005.1521579. [Google Scholar] [CrossRef]
9. Leon, E., Clarke, G., Callaghan, V., Sepulveda, F. (2007). A user-independent real-time emotion recognition system for software agents in domestic environments. Engineering Applications of Artificial Intelligence, 20(3), 337–345. DOI 10.1016/j.engappai.2006.06.001. [Google Scholar] [CrossRef]
10. McDuff, D., Gontarek, S., Picard, R. W. (2014). Remote measurement of cognitive stress via heart rate variability. 36th Annual International Conference of the IEEE Engineering in Medicine and Biology Society, Chicago, IL, USA. DOI 10.1109/EMBC.2014.6944243. [Google Scholar] [CrossRef]
11. Hernandez, J., Picard, R. W. (2014). Senseglass: Using google glass to sense daily emotions. Proceedings of the Adjunct Publication of the 27th Annual ACM Symposium on User Interface Software and Technology, pp. 77–78. Honolulu, Hawaii. [Google Scholar]
12. Ekman, P., Rosenberg, E. L. (1997). What the face reveals: Basic and applied studies of spontaneous expression using the facial action coding system (FACS). England: Oxford University Press. DOI 10.1093/acprof:oso/9780195179644.001.0001. [Google Scholar] [CrossRef]
13. Kapoor, A., Burleson, W., Picard, R. W. (2005). Multimodal affect recognition in learning environments. ACM International Conference on Multimedia, pp. 672–682. Hilton, Singapore. DOI 10.1145/1101149.1101300. [Google Scholar] [CrossRef]
14. Kaliouby, E., Teeters, R., Picard, A., W, R. (2006). An exploratory social-emotional prosthetic for autism spectrum disorders, Wearable and Implantable Body Sensor Networks, International Workshop on Wearable and Implantable Body Sensor Networks, pp. 2–4. Cambridge, MA, USA. DOI 10.1109/BSN.2006.34. [Google Scholar] [CrossRef]
15. Littlewort, G. C., Bartlett, M. S., Lee, K. (2007). Faces of pain: Automated measurement of spontaneous facial expressions of genuine and posed pain. Proceedings of the 9th International Conference on Multimodal Interfaces, pp. 15–21. Nagoya Aichi, Japan. DOI 10.1145/1322192.1322198. [Google Scholar] [CrossRef]
16. Yeasin, M., Bullot, B., Sharma, R. (2006). Recognition of facial expressions and measurement of levels of interest from video. IEEE Transactions on Multimedia, 8(3), 500–507. DOI 10.1109/TMM.2006.870737. [Google Scholar] [CrossRef]
17. Kang, S., Kim, D., Kim, Y. (2019). A visual-physiology multimodal system for detecting outlier behavior of participants in a reality TV show. International Journal of Distributed Sensor Networks, 15(7), 1550147719864886. DOI 10.1177/1550147719864886. [Google Scholar] [CrossRef]
18. Nosu, K., Kurokawa, T., Horita, H., Ohhazama, Y. (2007). Real time emotion-diagnosis of video game players from their facial expressions and its applications to voice feed-backing to game players. Proceeding of International Conference on Machine Learning and Cybernetics, vol. 4, pp. 2208–2212. Hong Kong, China. DOI 10.1109/ICMLC.2007.4370512. [Google Scholar] [CrossRef]
19. Kim, Y. B., Kang, S. J., Lee, S. H., Jung, J. Y., Kam, H. R. et al. (2015). Efficiently detecting outlying behavior in video-game players. PeerJ, 3, e1502. DOI 10.7717/peerj.1502/supp-1. [Google Scholar] [CrossRef]
20. Vachirapanang, K., Tuisima, S., Sinthupinyo, S., Sirivunnabood, P. (2012). The classification of the realtime interaction-based behavior of online game addiction in children and early adolescents in Thailand. International Journal of Advanced Research in Artificial Intelligence, 1(7), 7–13. DOI 10.14569/issn.2165-4069. [Google Scholar] [CrossRef]
21. Yun, C., Shastri, D., Pavlidis, I., Deng, Z. (2009). O’ game, can you feel my frustration? Improving user’s gaming experience via stressCam. Proceedings of the SIGCHI Conference on Human Factors in Computing Systems, pp. 2195–2204. Boston, MA, USA. DOI 10.1145/1518701.1519036. [Google Scholar] [CrossRef]
22. Tan, C. T., Rosser, D., Bakkes, S., Pisan, Y. (2012). A feasibility study in using facial expressions analysis to evaluate player experiences. Australasian Conference on Interactive Entertainment, 5, 1–10. DOI 10.1145/2336727.2336732. [Google Scholar] [CrossRef]
23. Hazelett, R. L. (2003). Measurement of user frustration: A biologic approach. Proceedings of the Conference on Human Factors in Computing Systems, 734–735. Ft. Lauderdale, Florida, USA. DOI 10.1145/765891.765958. [Google Scholar] [CrossRef]
24. Tan, C. S. S., Schöning, J., Barnes, J. S., Luyten, K., Coninx, K. (2013). Bro-cam: Improving game experience with empathic feedback using posture tracking. In: Persuasive technology, lecture notes in computer science, vol. 7822, pp. 222–233. DOI 10.1007/978-3-642-37157-8_27. [Google Scholar] [CrossRef]
25. Kang, S. J., Kim, Y. B., Kim, S. K. (2014). Analyzing repetitive action in game based on sequence pattern matching. Journal of Real-Time Image Processing, 9(3), 523–530. DOI 10.1007/s11554-013-0347-0. [Google Scholar] [CrossRef]
26. Zoeller, G. (2010). Game development telemetry. Proceedings of the Game Developers Conference, San Francisco, CA. [Google Scholar]
27. Martinez, H. P., Bengio, Y., Yannakakis, G. N. (2013). Learning deep physiological models of affect. IEEE Computational Intelligence Magazine, 8(2), 20–33. DOI 10.1109/MCI.2013.2247823. [Google Scholar] [CrossRef]
28. Wang, X., Goh, D. H. L. (2020). Components of game experience: An automatic text analysis of online reviews. Entertainment Computing, 33, 100338. DOI 10.1016/j.entcom.2019.100338. [Google Scholar] [CrossRef]
29. Maman, L., Ceccaldi, E., Lehmann-Willenbrock, N., Likforman-Sulem, L., Chetouani, M. et al. (2020). GAME-ON: A multimodal dataset for cohesion and group analysis. IEEE Access, 8, 124185–124203. DOI 10.1109/ACCESS.2020.3005719. [Google Scholar] [CrossRef]
30. Song, M., Yang, Z., Baird, A., Parada-Cabaleiro, E., Zhang, Z. et al. (2019). Audiovisual analysis for recognizing frustration during game-play: introducing the multimodal game frustration database. 8th International Conference on Affective Computing and Intelligent Interaction, pp. 517–523. Cambridge, UK. [Google Scholar]
31. Ringer, C., Walker, J. A., Nicolaou, M. A. (2019). Multimodal joint emotion and game context recognition in league of legends livestreams. IEEE Conference on Games, pp. 1–8. London, UK. [Google Scholar]
32. Olalere, F., Doyran, M., Poppe, R., Salah, A. A. (2021). Geeks and guests: estimating player’s level of experience from board game behaviors. IEEE Winter Conference on Applications of Computer Vision Workshops, pp. 22–30. [Google Scholar]
33. Semenova, M., Lange, A., Koposov, D., Somov, A., Burnaev, E. (2020). Personality traits and coping strategies of eSports players. 7th International Conference on Behavioural and Social Computing, pp. 1–5. Bournemouth, UK. DOI 10.1109/BESC51023.2020.9348280. [Google Scholar] [CrossRef]
34. Elor, A., Song, A. (2020). Isam: personalizing an artificial intelligence model for emotion with pleasure-arousal-dominance in immersive virtual reality. 15th IEEE International Conference on Automatic Face and Gesture Recognition, pp. 572–576. Buenos Aires, AR. DOI 10.1109/FG47880.2020.00091. [Google Scholar] [CrossRef]
35. Gu, H., Ji, Q. (2004). An automated face reader for fatigue detection. 6th IEEE International Conference on Automatic Face and Gesture Recognition, pp. 111–116. Seoul, Korea (South). DOI 10.1109/AFGR.2004.1301517. [Google Scholar] [CrossRef]
36. Andelin, E. I., Rusu, A. S. (2015). Investigation of facial micro-expressions of emotions in psychopathy-a case study of an individual in detention. Procedia-Social and Behavioral Sciences, 209, 46–52. DOI 10.1016/j.sbspro.2015.11.230. [Google Scholar] [CrossRef]
37. Warren, G., Schertler, E., Bull, P. (2009). Detecting deception from emotional and unemotional cues. Journal of Nonverbal Behavior, 33(1), 59–69. DOI 10.1007/s10919-008-0057-7. [Google Scholar] [CrossRef]
38. Dlib C++ Library (2021). http://dlib.net/. [Google Scholar]
39. Weste, N., Burr, D. J., Ackland, B. D. (1983). Dynamic time warp pattern matching using an integrated multiprocessing array. IEEE Transactions Computers, 32(8), 731–744. DOI 10.1109/TC.1983.1676311. [Google Scholar] [CrossRef]
 | This work is licensed under a Creative Commons Attribution 4.0 International License, which permits unrestricted use, distribution, and reproduction in any medium, provided the original work is properly cited. |