| Computer Modeling in Engineering & Sciences |
DOI: 10.32604/cmes.2022.018964
ARTICLE
Crashworthiness Design and Multi-Objective Optimization for Bio-Inspired Hierarchical Thin-Walled Structures
1School of Transportation and Vehicle Engineering, Shandong University of Technology, Zibo, 255049, China
2School of Mathematics and Statistics, Shandong University of Technology, Zibo, 255049, China
*Corresponding Author: Weiwei Li. Email: liwwsg@163.com
Received: 26 August 2021; Accepted: 15 November 2021
Abstract: Thin-walled structures have been used in many fields due to their superior mechanical properties. In this paper, two types of hierarchical multi-cell tubes, inspired by the self-similarity of Pinus sylvestris, are proposed to enhance structural energy absorption performance. The finite element models of the hierarchical structures are established to validate the crashworthiness performance under axial dynamic load. The theoretical model of the mean crushing force is also derived based on the simplified super folded element theory. The finite element results demonstrate that the energy absorption characteristics and deformation mode of the bionic hierarchical thin-walled tubes are further improved with the increase of hierarchical sub-structures. It can be also obtained that the energy absorption performance of corner self-similar tubes is better than edge self-similar tubes. Furthermore, multi-objective optimization of the hierarchical tubes is constructed by employing the response surface method and genetic algorithm, and the corresponding Pareto front diagram is obtained. This research provides a new idea for the crashworthiness design of thin-walled structures.
Keywords: Bionic structure; crashworthiness design; hierarchical tube; multi-objective optimization
Thin-walled structures are widely used in automobiles, high-speed railways, aviation equipment, and other anti-collision structures as energy absorptions due to their excellent crashworthiness performance [1,2]. Therefore, there has been a growing interest in thin-walled structures with different section shapes over the past decades. Alexander [3] experimented with the thin-walled metal tubes under axial crushing and proposed an approximate theoretical model for the deformation. Wierzbicki et al. [4] proposed a theoretical prediction model for thin-walled square tubes based on the theory of super folded elements (SFEs). Based on Wierzbicki's research, Abramowicz et al. [5,6] found that the deformation stability of thin-walled square tubes is greatly affected by the wall thickness, length-width ratio, and other geometric dimensions. Otubushin [7] employed the finite element (FE) numerical simulation technology to analyze the thin-walled tubes. The results were compared with the experimental and theoretical prediction values, which verified the effectiveness of the numerical simulation technology. Nia et al. [8,9] investigated the crashworthiness of the simple and multi-cell thin-walled structures with various section shapes, and found that the energy absorption capacity will gradually improve as the number of cells increases within a certain range.
According to the super folded element or the simplified super folded element (SSFE), as more corner parts are employed in the thin-walled structures, the more crushing energy can be absorbed. Kim [10] constructed a special tube with four square cells at the corners of the square tube, and found that the energy absorption characteristics had significantly improved as compared to the traditional square tube. Zhang et al. [11,12] proposed a nine-cell square tube structure by adding several cross elements inside, and derived the formula for calculating the membrane deformation energy of right angle element, T-shaped angle element, and cross angle element. They carried out a large amount of research on the deformation modes of different angle elements, which guided the crashworthiness design of the multi-cell thin-walled tubes. These studies mainly focus on improving the energy absorption capacity by increasing the edges or internal corner elements of thin-walled structures.
Recently, the introduction of bionic ideas into the design of engineering structures aroused the interest of researchers [13,14]. As shown in Fig. 1a, Yin et al. [15] investigated the structural characteristics of the rhizome of Horsetail grass and designed six bionic thin-walled structures with different cross-sections. The research showed that the crashworthiness of bionic thin-walled tubes is better than that of the traditional square and circular thin-walled tubes. Inspired by the microstructure of bamboo joint in Fig. 1b, Song et al. [16] proposed a bionic energy-absorbing structure with bionic joints and a bionic section, which is gradient distribution along the radial direction. The FE simulation and experimental results demonstrated that the bamboo-like microstructure can improve the energy absorption characteristics of the thin-walled tube, and joints can significantly improve the load and deformation stabilities of the thin-walled structure under axial impact. Based on the structural characteristics of antler bone in Fig. 1c, Huo et al. [17] designed a bionic thin-walled tube with the same inner diameter, and outer diameter with equal gradient decreasing layer by layer. Based on the multi-objective particle swarm optimization (MOPSO), the multi-objective optimization design was also carried out, and the optimal results showed that the deformation stability of the structure was progressive compression layer by layer, and the energy absorption effect was excellent.
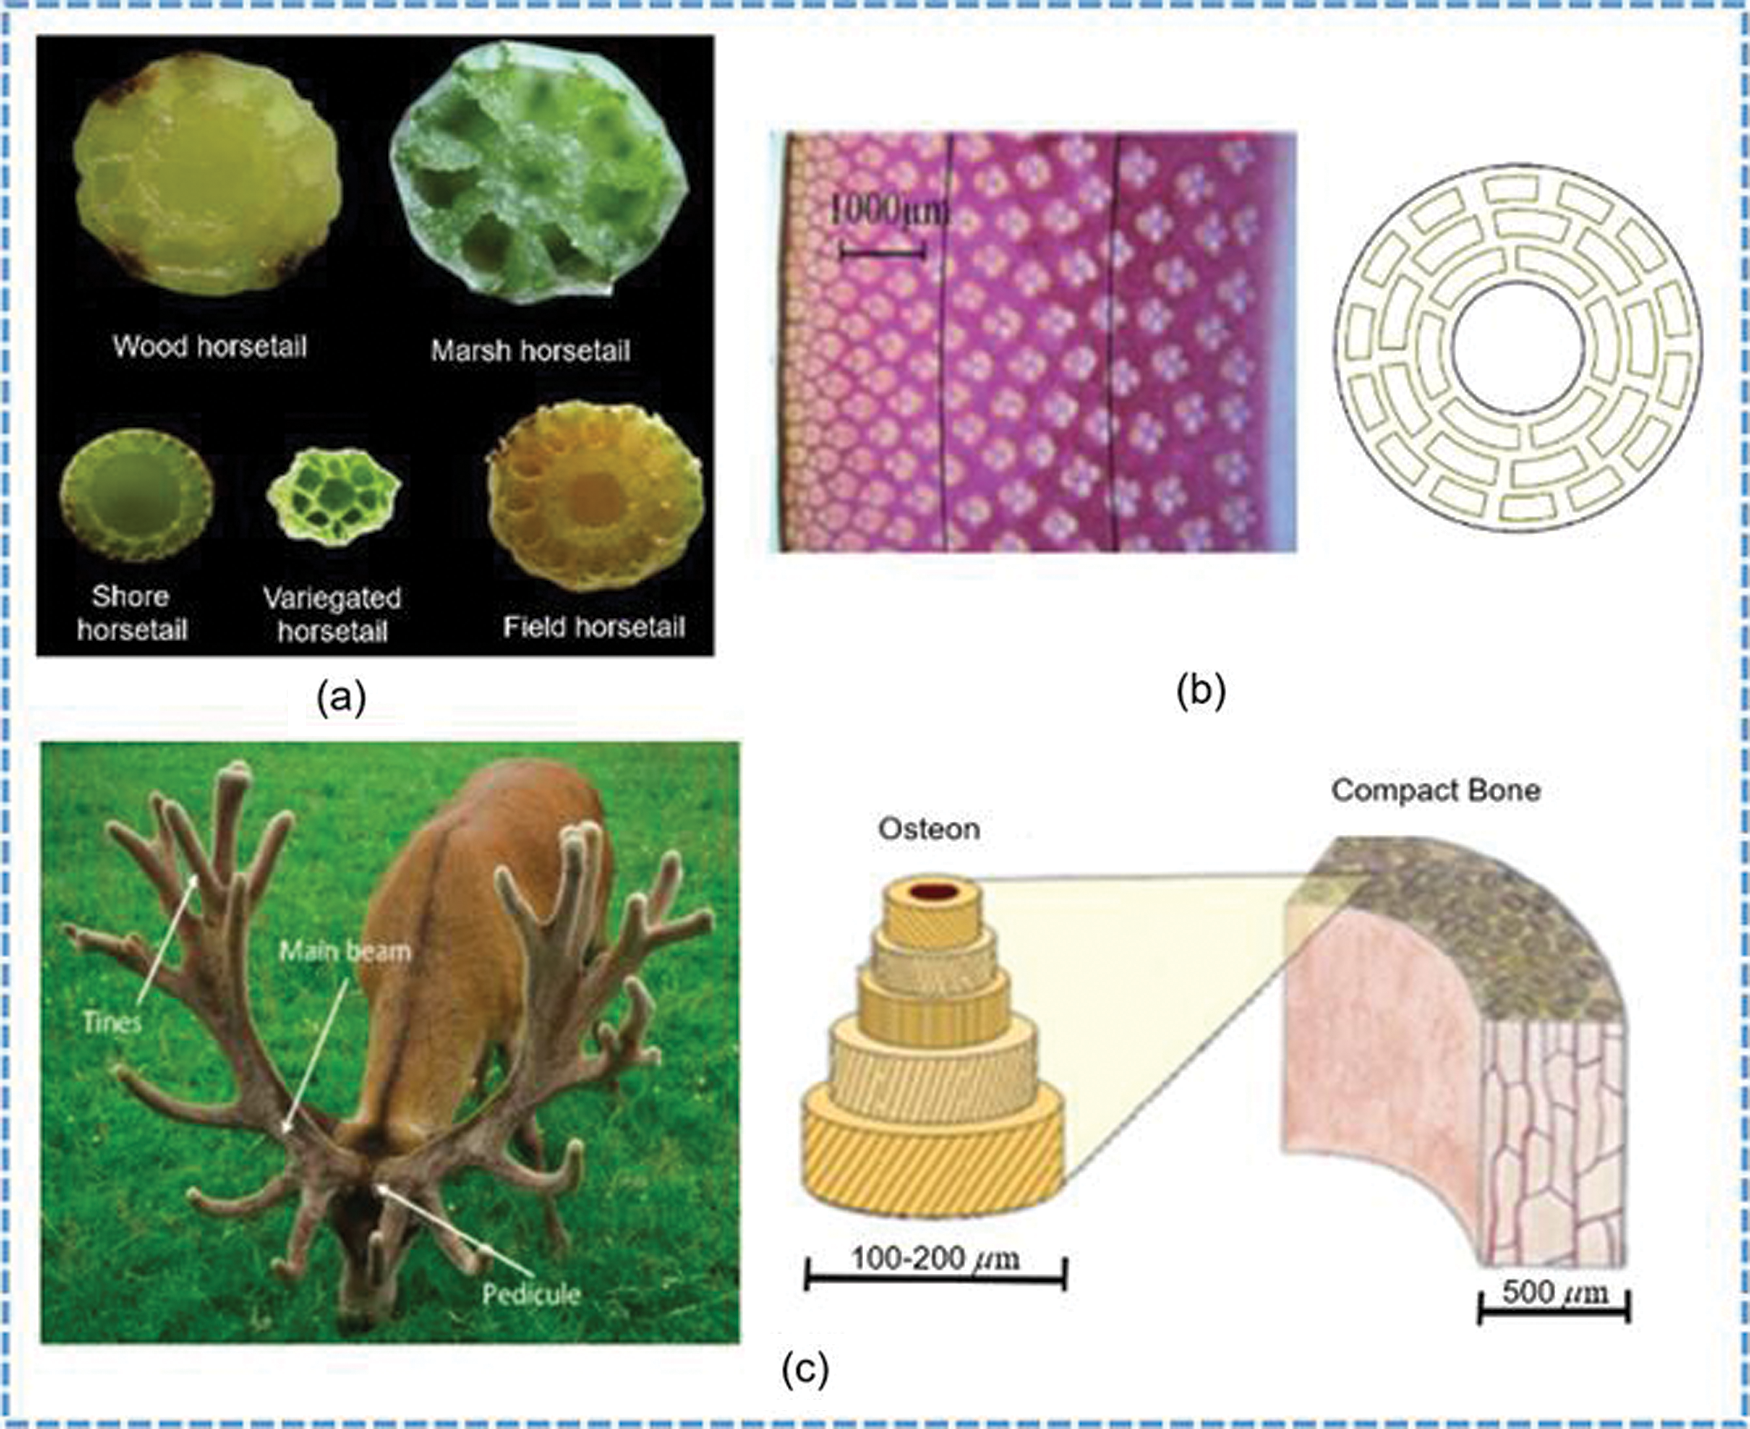
Figure 1: Bionic structures: (a) the cross sections of the five horsetails; (b) the micro-structures of bamboo and the simplified bionic structure; (c) the antlers, osteon, and compact bone of a Red Deer
In this paper, two types of bionic hierarchical tubes are proposed to improve the crashworthiness of the square tubes. The organization of this paper is as follows: In Section 2, the bionic structure prototype is analyzed, and the model parameters of the thin-walled structure are given. Then, the FE models of the tubes are established and the theoretical analysis is constructed in Section 3. Section 4 discusses the theory and simulation results of the bionic hierarchical tubes with different hierarchies. In Section 5, the multi-objective optimization design is employed for the proposed tubes. Finally, the conclusions are summarized.
2.1 Analysis of Bionic Prototype
Pinus sylvestris (as shown in Fig. 2a) is commonly used as afforestation tree species in the Greater Khingan Range of Northeast China and the dune area of Western China. The simplified structure diagram of Pinus sylvestris is shown in Fig. 2b, and the drawing of partial enlargement in Fig. 2c. It can be seen that the Pinus sylvestris can be regarded as a self-similar hierarchical structure, in which the small substructures are similar to the main structure. This structural behavior effectively improves the windbreak and sand-fixation effect of the Pinus sylvestris.
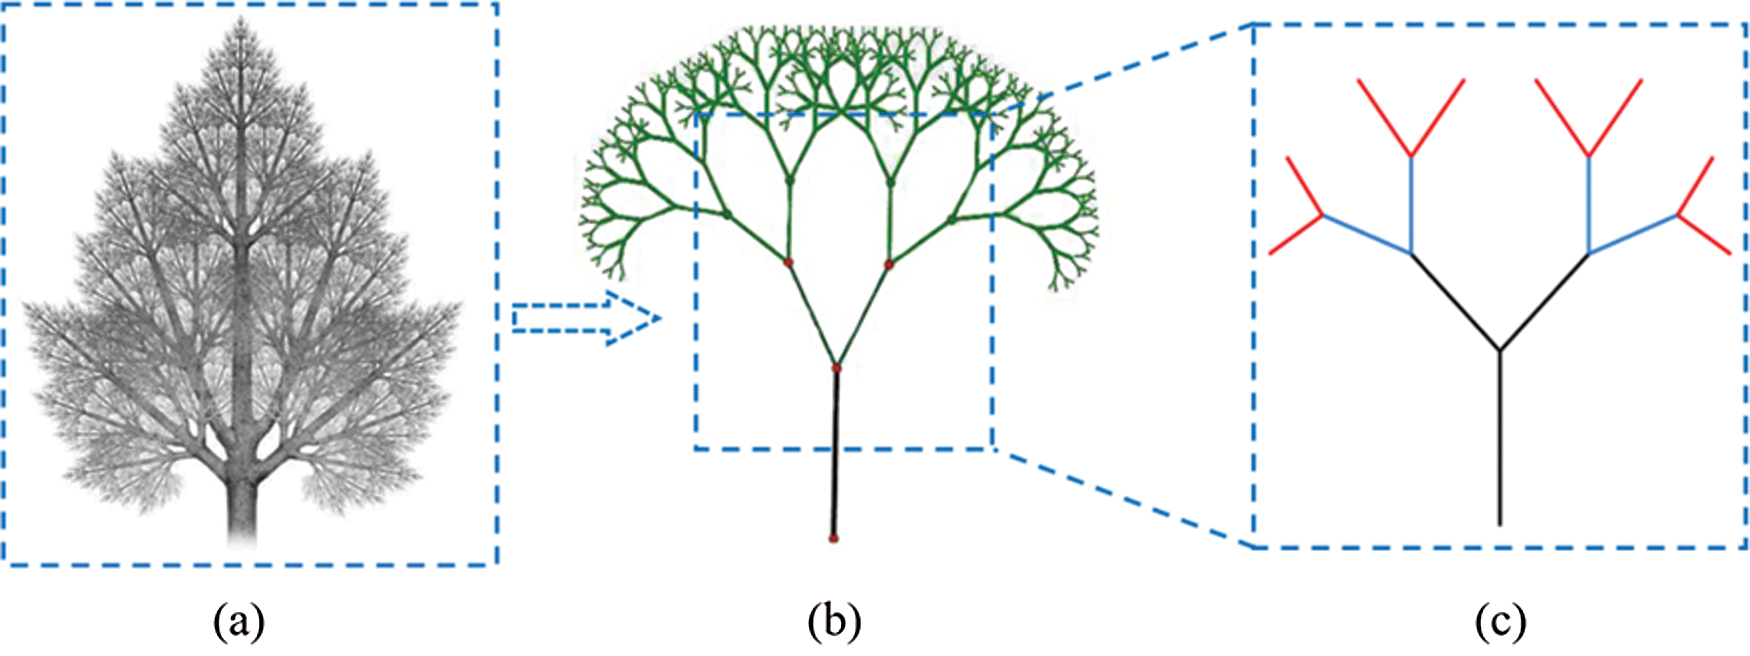
Figure 2: Simplified structure of Pinus sylvestris: (a) the canopy of Pinus sylvestris; (b) the simplified structure; (c) the sub-structure
According to the self-similar feature of Pinus sylvestris, two types of hierarchical multi-cell tubes are proposed. The evolution process is shown in Fig. 3. The cross-section shape of the high-order structure is formed by using small but similar sub-squares to replace the specific parts of the low-order structure. In the first type of structure, the intersections of internal ribs and plates in the tube are replaced by the sub-squares. Therefore, this type of tubes is named EST, which is abbreviated from “Edge Self-similar Tube”. In the second kind of structure, the corners of the tube are replaced by the sub-squares. It is called CST, which is abbreviated from “Corner Self-similar Tube”. In Fig. 3, the suffix numbers 1∼3 represent the order of the hierarchies.
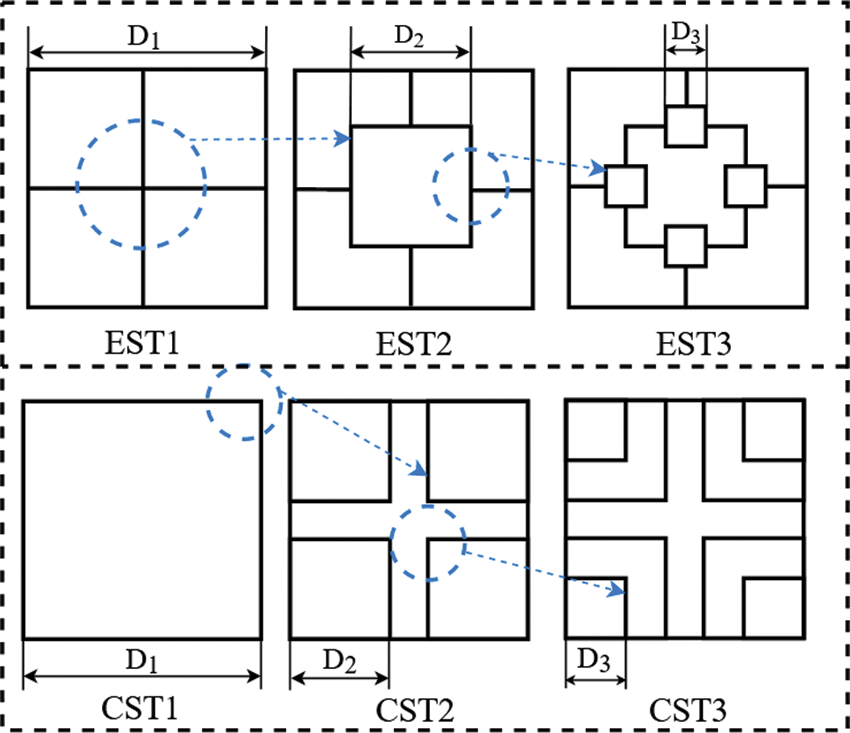
Figure 3: Section evolution of the hierarchical tubes
The dimensions of the structures are shown in Fig. 3. To avoid the mutual influence between sub-structures and maintain the stability of the structures in the crushing process, the distance between all adjacent walls should be no less than 5 mm to avoid the geometric overlap. Therefore, the constraints for the EST are defined as follows:
and for the CST are
In this paper, the dimensions D1, D2 and D3 of the structures EST1∼EST3 are selected as 80, 44 and 12 mm, respectively. Those of the structures CST1∼CST3 are 80, 35 and 20 mm, respectively. The length and the wall thickness of the tubes are both 200 and 2 mm, respectively.
2.3 Crashworthiness Indicators
In the analysis of the collision process, the commonly used indicators are specific energy absorption (SEA), mean crushing force (MCF), peak crushing force (PCF) and crush force efficiency (CFE) [18].
The SEA is defined as
where f(x) is the instantaneous crushing force, d is the compressed displacement, and M is the total mass of the tube.
The MCF is defined as
The PCF is the instantaneous maximum crushing force during the collision. In the process of a car collision, the crushing force changes every moment, and the PCF will increase the probability of occupant injury potentially.
The CFE is expressed as
It is usually used to evaluate the loading consistency of structures. The higher the CFE value, the more stable the crushing process. In the crashworthiness design of an energy-absorbing structure, the CFE value should be maximized. For an ideal energy-absorbing structure, the load efficiency is 100%.
3 The FE Model and Theoretical Prediction Analysis
In the crushing process, the elastic deformation energy is very small, and the collision kinetic energy would be stored in plastic deformation rather than by elastic energy. Therefore, for simplicity, the elastic deformation and the corresponding energy are ignored in this study.
The explicit nonlinear dynamic finite element theory is performed by using ANSYS/LS-DYNA to simulate the post-buckling deformation under axial crushing. The FE model of a tube subjected to an axial impact load is shown in Fig. 4. The model is established in the software ANSYS. The material of the tube is AA6060T4 aluminum alloy. The mechanical properties parameters of the material are as follows: Young's modulus E = 68.12 GPa, initial yield strength σ = 80 MPa, ultimate stress σu = 173 MPa, Poisson's ratio ν = 0.3, ductility 17.4%. The tensile stress-strain curve can be well fitted by a power-law curve with an exponent of n = 0.23 as shown in Fig. 5 [19].
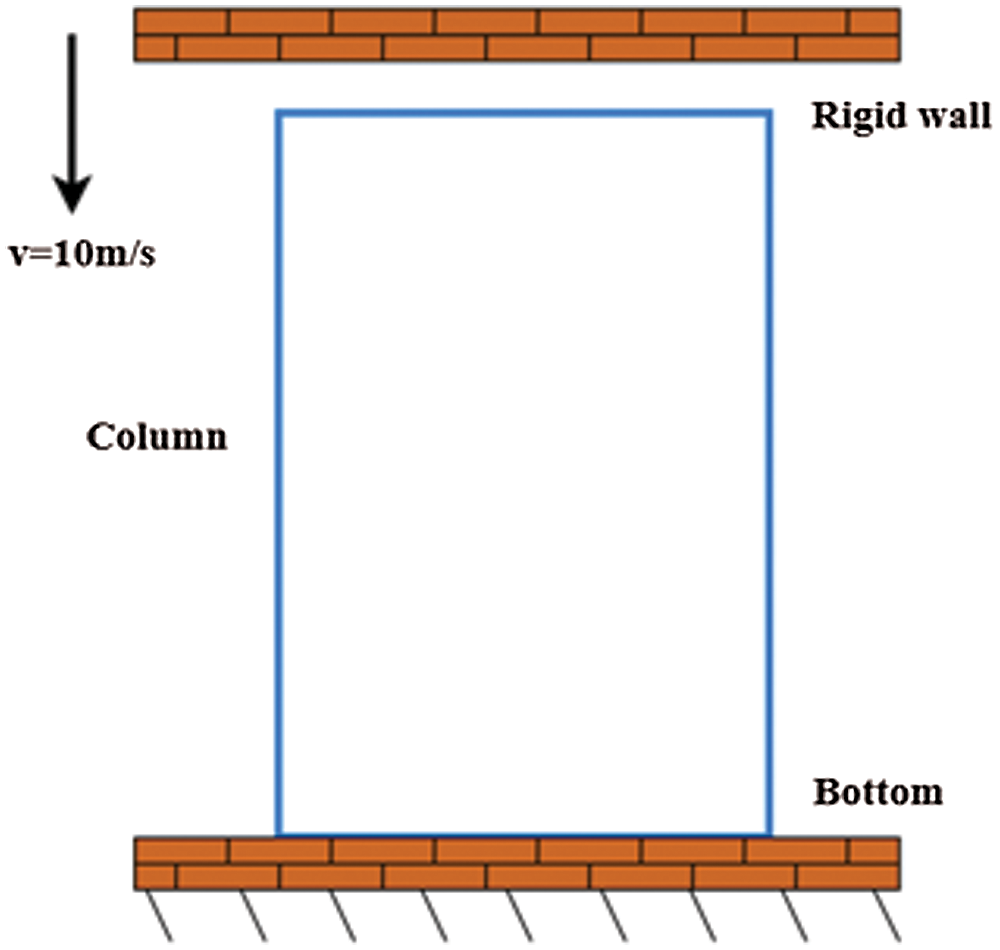
Figure 4: FE model
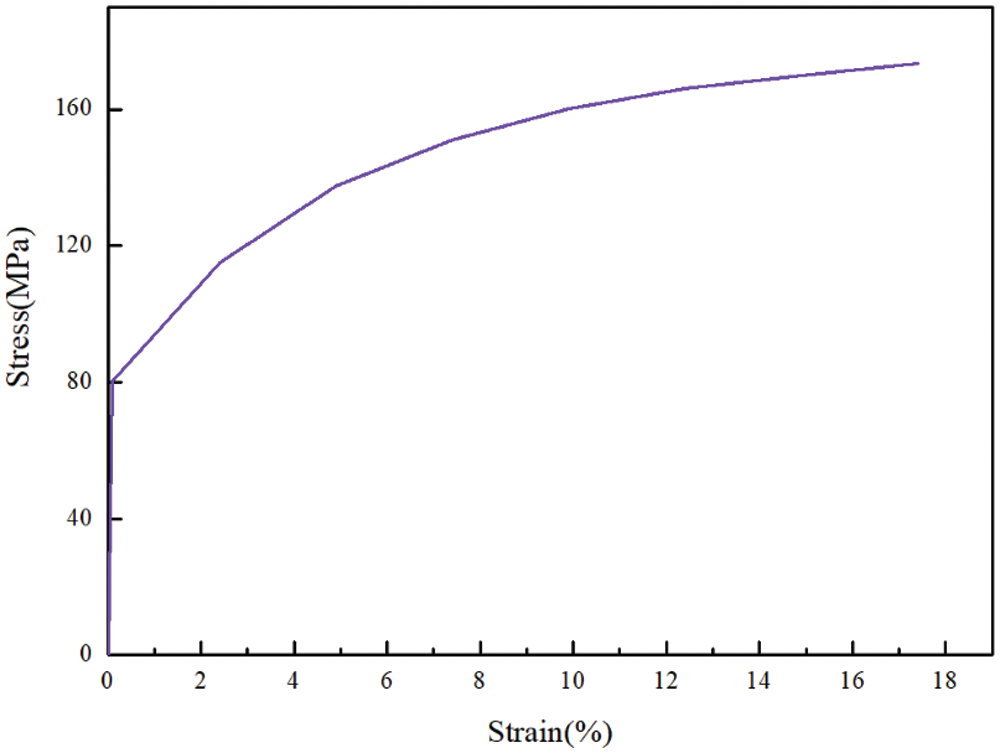
Figure 5: Stress-strain curve for AA6060 T4
The constitutive behavior of the element is based on an elastic-plastic material model with Von Mises isotropic plasticity algorithm with piecewise linear plastic hardening. Due to the weak strain sensitivity of aluminum alloy, the influence of strain rate is neglected. Material Type MAT_123 (Modified Piecewise Linear Plasticity) of LS-DYNA is adopted to characterize the mechanical behavior of the material [20]. An enhanced plasticity algorithm, which includes transverse shear effects is used to precisely update the element thickness during plastic deformation for shell elements. No failure or damage is defined in this simulation.
A fixed boundary constraint is applied to the bottom of the tube, and a rigid wall with a constant velocity
The tube and the rigid wall are meshed by the four-node Belytschko-Tsay shell elements with five integration points through the thickness and one integral point in the plane. To ensure the calculation accuracy, the element size is set to
3.2 Theoretical Prediction and Analysis
The MCF of the thin-walled structures under axial compression can usually be obtained by using the theory of SFE or SSFE. For square tubes, the MCF can be expressed as [22]
where b is the side length of the square section, t is the wall thickness of the tube, and σ0 is plastic flow stress of the material, which can be calculated by
In the SSFE theory, according to the energy balance of the system, the external work of the system is equal to the sum of the energy dissipation of bending deformation and membrane deformation during the collapse of a folded layer of a multi-cell thin-walled tube. As shown in Figs. 6a and 6b, the simplified super folding element is composed of three ductile triangular elements and three static plastic hinge lines. The folding in the crushing process is not complete, and the length δ as shown in Fig. 6b will be reserved. Therefore, the effective crushing coefficient k is introduced to calculate the external work in the crushing process. Then, the external work can be expressed as
where H represents the half wavelength of a folding process, Eb and Em are the energy dissipation of bending deformation and membrane deformation, respectively. According to the research of Wierzbicki et al. [4], the effective crushing coefficient k ranges from 0.7 to 0.75. In this study, the value of k is taken as 0.75.
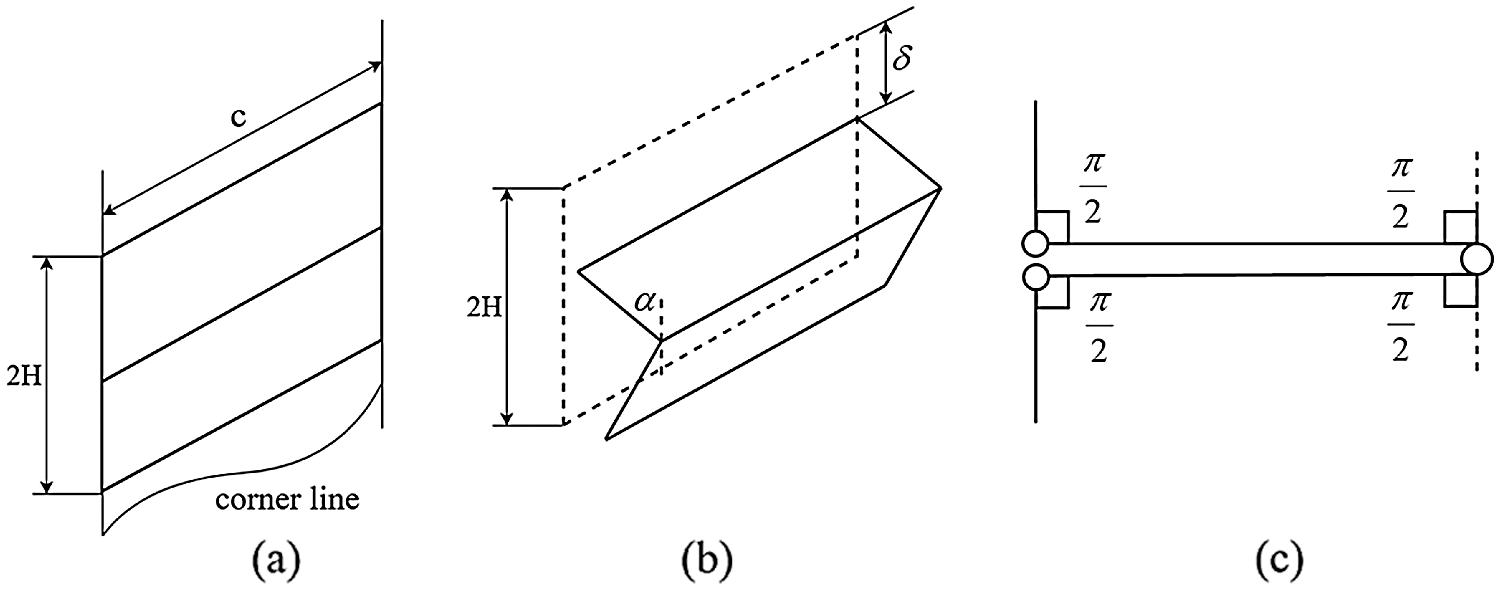
Figure 6: Simplified superfold element: (a) extensional elements; (b) bending hinge lines; (c) rotation angles
3.2.1 Bending Deformation Energy
The bending deformation energy is obtained from the energy dissipation of superimposed three fixed hinge lines:
where
As shown in Fig. 6c, it is assumed that the folded element is completely flattened, and the axial deformation distance of the folded element is 2H. Therefore, the rotation angles of the folded element at three hinge lines are
where Lc is the total length of the thin-walled tube cross-section.
3.2.2 Membrane Deformation Energy
As shown in Fig. 7, the cross-section of the multi-cell thin-walled tube can be divided into three basic folded elements: Corner element, 3-panel angle element and 4-panel angle element. Zhang et al. [11] and Qiu et al. [24] studied the membrane deformation energy of the corner element and 3-panel angle element under one folded wavelength compression condition, and proposed the following expressions:
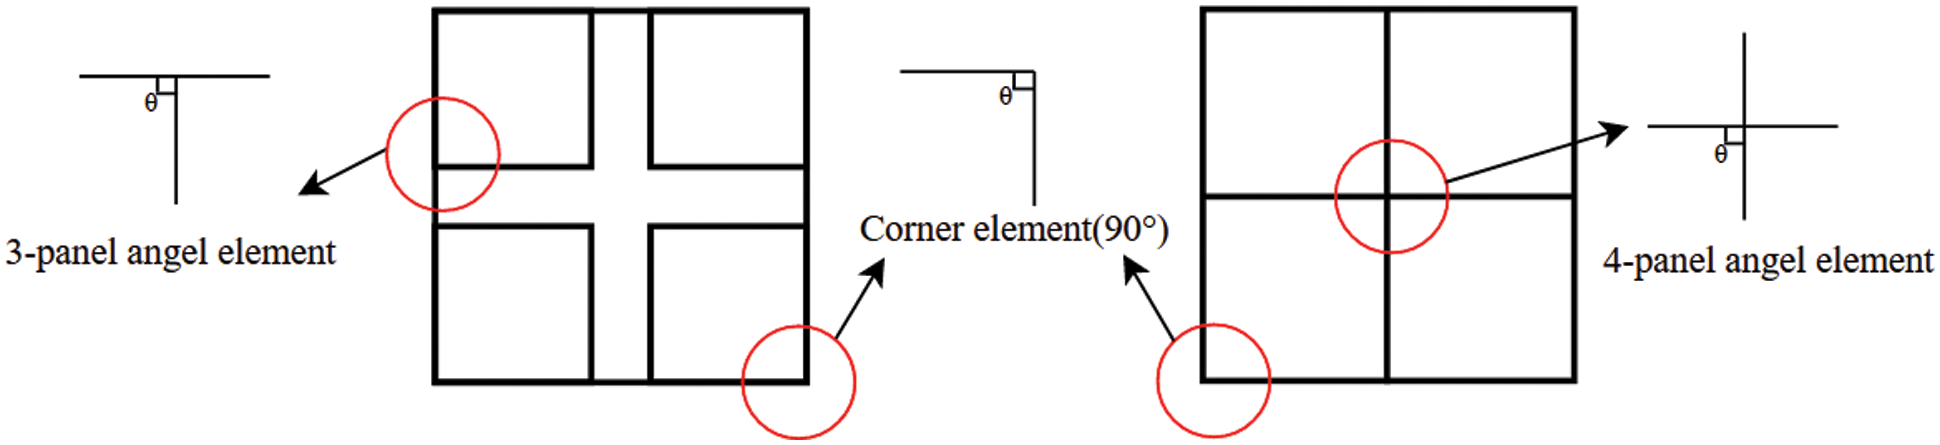
Figure 7: Types of bionic structural units
In the new bionic section proposed in this paper, the 4-panel angle element can be simplified into a cross element. Due to the symmetry of the cross element, the membrane energy of the cross element can be determined by summing the membrane energy of the two corner elements in the symmetrical mode, that is, the energy dissipation can be calculated by adding the membrane energy of all four plates.
Therefore, the membrane deformation energy of the corner element (
3.2.3 The MCF of the Bionic Tubes
By substituting Eqs. (10), and (13)–(15) into Eq. (8), we obtain
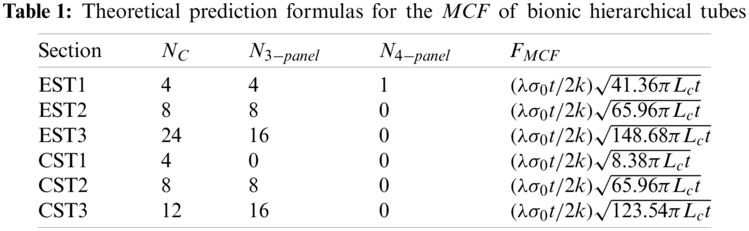
where NC, N3-panel and N4-panel represent the numbers of corner elements, 3-panel angle elements and 4-panel angle elements, respectively.
According to the stationary condition [25], the half-wavelength H can be determined as
Then,
Substituting Eq. (18) into Eq. (16), we yield
For dynamic loading, the dynamic enhancement factor λ should be introduced to consider the strain rate effect and the inertia effect. For the thin-walled structure without defect guidance, it is generally taken as 1.3–1.6 [26]. In this paper, it is selected as λ = 1.3. Then, Eq. (19) can be modified as
The prediction formulas of all the bionic hierarchical tubes are summarized as shown in Table 1.
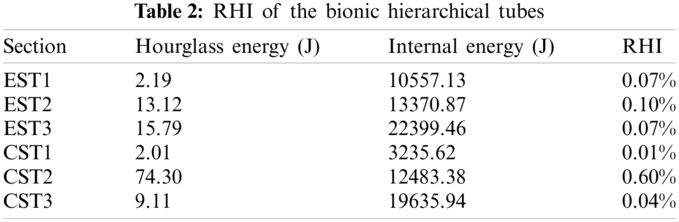
To ensure the effectiveness and accuracy of the FE model, it is necessary to verify the energy conservation problem in the whole crushing process. In the collision simulations, the use of reduced integration algorithms will lead to the generation of hourglass mode and result in energy loss. Therefore, it is necessary to ensure that the hourglass can be controlled within 5% of the total energy [27].
The corresponding results of hourglass energy and total internal energy are shown in Table 2. It can be seen that the ratios of hourglass energy to internal energy (RHIs) are less than 1%. The accuracy requirements of the models are satisfied. Therefore, the hourglass deformation is well suppressed and the calculation results are effective, which demonstrates that the FE model established in this paper has high reliability.
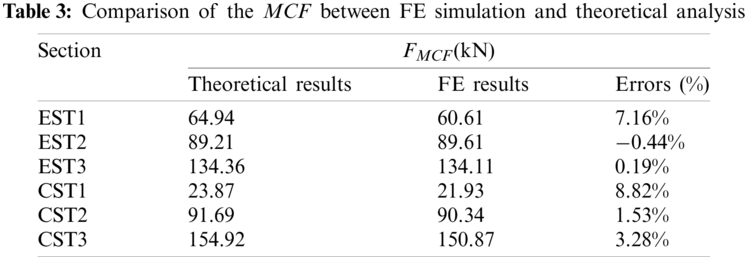
The comparison between the FE results and the theoretical prediction of the MCF is shown in Table 3. As can be seen from this table, the relative errors between the theoretical values and the simulation values are both in a reasonable range. With the increase of the hierarchical structures, the error decreases obviously. In the 2nd-order and higher-order hierarchical tubes, the errors have been reduced to less than 4%. Therefore, the theoretical model is enough accuracy to predict the MCF, which can be used for subsequent research.
4.2 Post-Buckling Deformation Analysis
The deformation mode of the bionic hierarchical tubes under axial crushing can be summarized as progressive deformation mode and local instability mode [28]. Progressive deformation mode is a folding process in which the folding elements are folded orderly according to the expected effect, and the local instability mode means that the folded elements will not deform according to the expected effect, which will lead to the reduction of the number of super folded elements.
The deformation modes of the bionic tubes are shown in Fig. 8. For the EST, it can be found that the deformation modes of EST1 and EST2 are more stable than EST3. For EST1 and EST2, the modes are both symmetric collapse mode, but for EST3, the diamond deformation mode appears. For the CST, the three tubes are both compressed with symmetric collapse mode. Besides, the number of folds of the tubes increases with the increase of the hierarchical orders, which also means that the energy absorption of the higher-order tubes is better.
In the 2nd-order hierarchical tubes, both EST2 and CST2 have the same number of corner elements and 3-panel-angel elements. The observation results show that the stability of the CSTs is better than that of the ESTs. Besides, the CST3 structure is composed of 12 corner elements and 16 3-panel angel elements, and 24 corner elements and 16 3-panel angel elements are included in EST3. As is well known, increasing the number of elements in the thin-walled tube can effectively improve its crashworthiness. It can be found that the arrangement of internal stiffeners in a multi-cell structure has an important impact on the crashworthiness of thin-walled tubes. Next, we compare the crashworthiness of the bionic hierarchical tubes by the evaluation indicators.
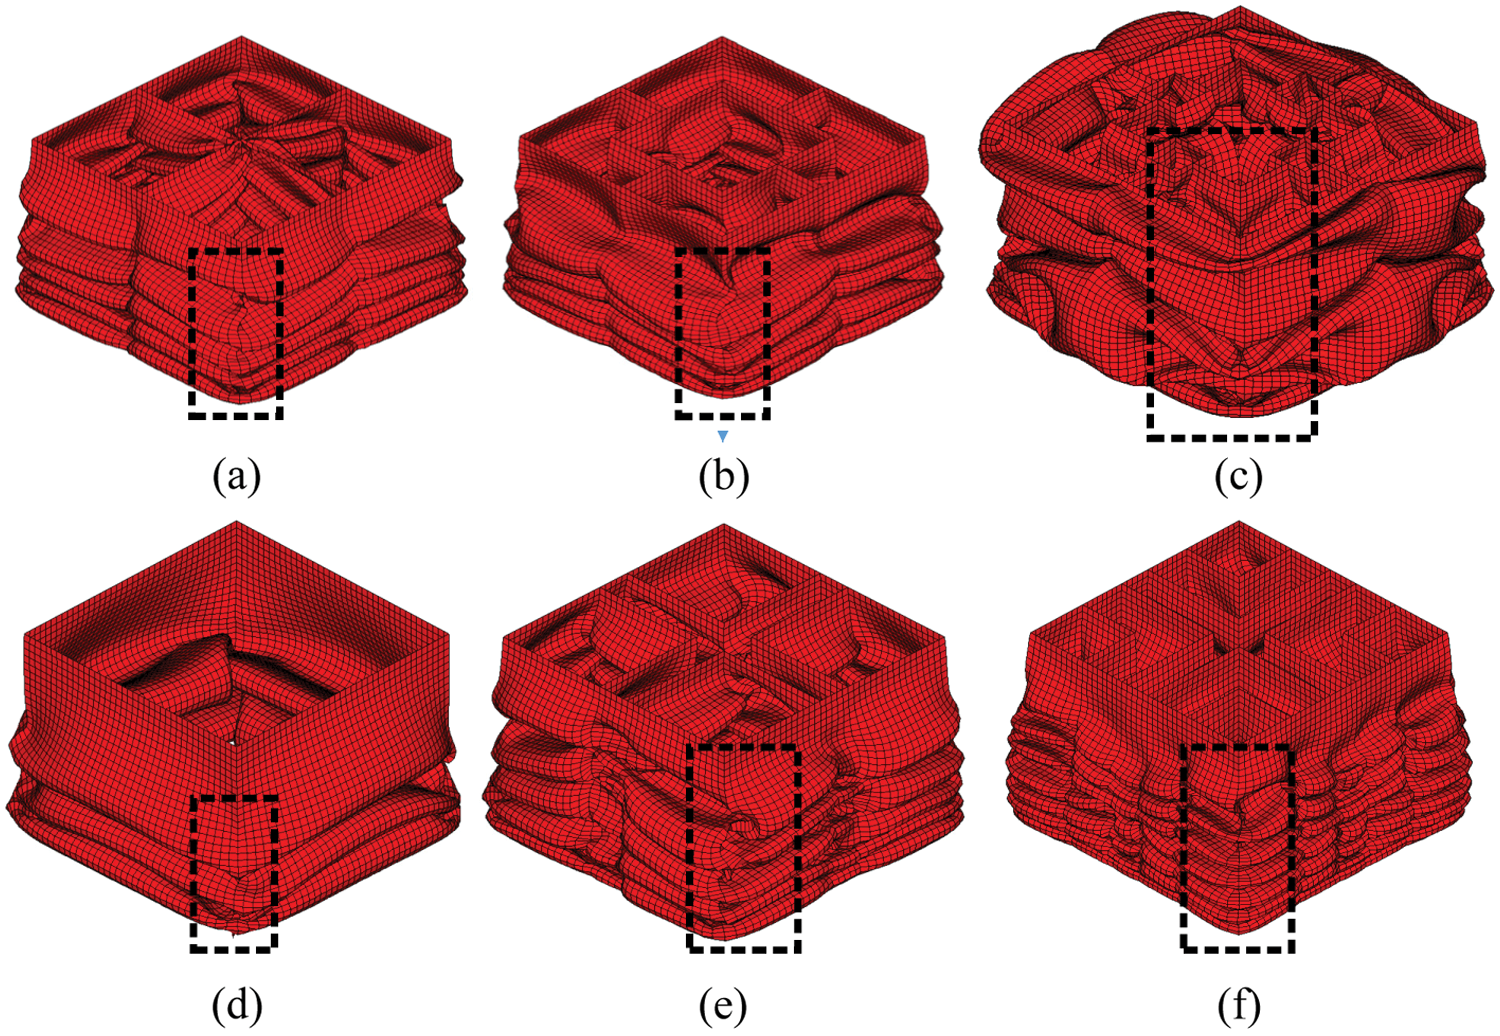
Figure 8: FE simulation deformation diagram of the tubes: (a) EST1; (b) EST2; (c) EST3; (d) CST1; (e) CST2; (f) CST3
4.3 Energy Absorption and Crush Force Efficiency
The FE simulation results of the energy absorption characteristics of the bionic hierarchical tubes are given in Fig. 9. It can be seen that in the same type of tubes, the tube with a higher-order hierarchy has better energy absorption capacity than that with a low-order structure. Compared with the similar low-order tubes, the SEA of EST3 is increased by 192% and 32%, and of CST3 by 55% and 24%, respectively. It means that the two tubes can absorb more energy per unit mass during the crushing process. The results show that the SEA and internal energy of CST2 and EST2 are close to each other in the process of crushing, but for the tubes with 3rd-order hierarchy, the difference of internal energy increases rapidly, and the number of corner elements and 3-panel angle elements in CST3 is less than that in EST3. However, the number of folds in CST3 is about 7, while that of EST3 is only 4. This is due to the interaction of internal structures in the process of crushing. The arrangement of the internal structures of EST3 is relatively less uniform than that of CST3, showing a pattern of higher middle density and the density of four corners is small.
The CFE indicator represents the load uniformity of the structure. The larger the CFE value, the better the crashworthiness of the structure. From Fig. 9, it can be observed that with the increase of hierarchies, EST3 and CST3 show the most uniform load. This is mainly due to the increase of the hierarchical structures which promote the local plastic deformation. Besides, the mechanical properties of the hierarchical tubes are better than that of the non-hierarchical tubes.
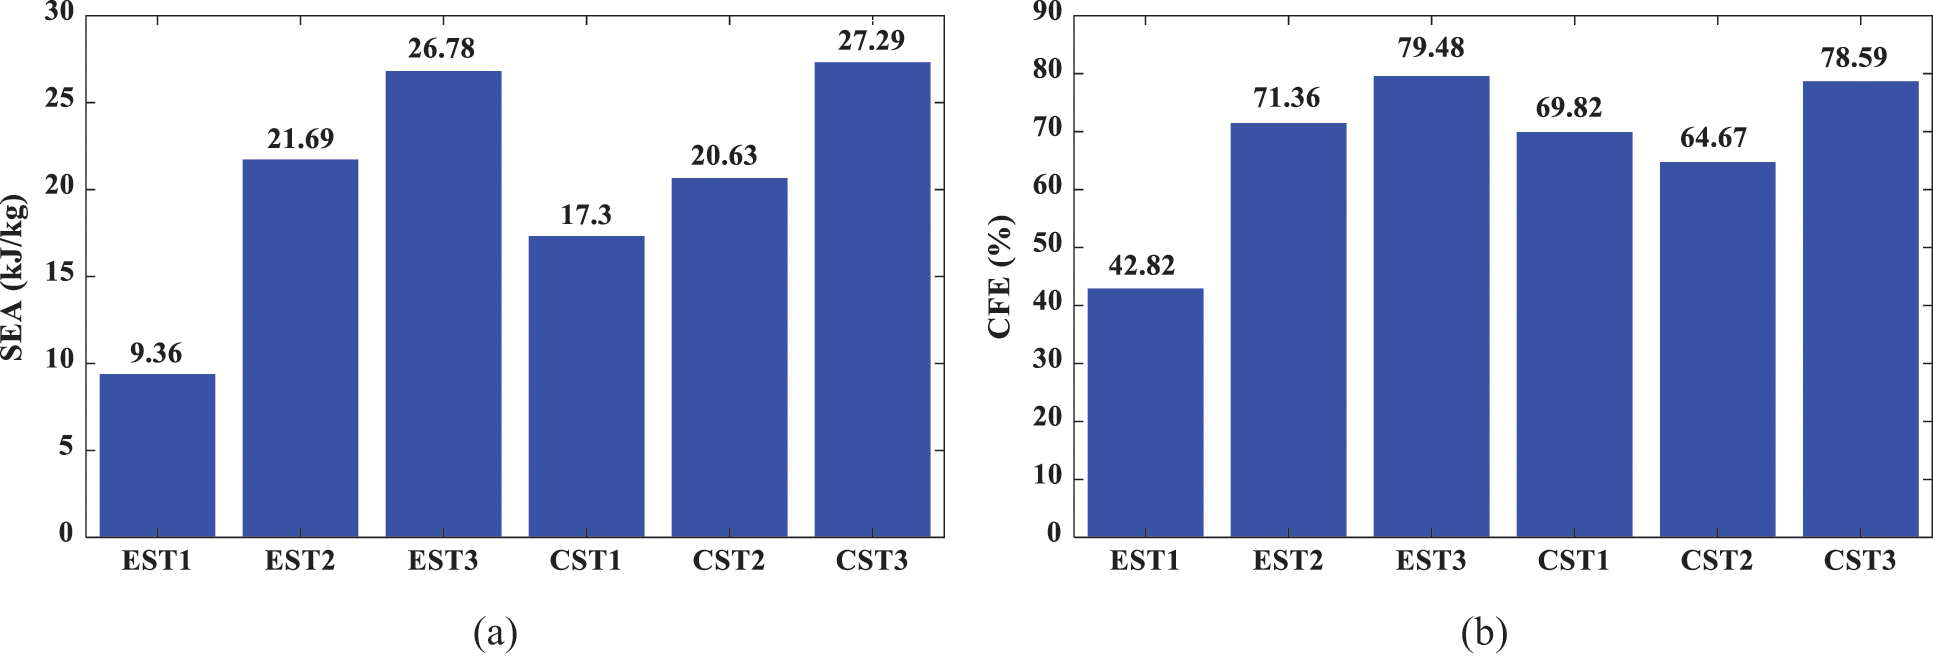
Figure 9: The energy absorption characteristics of the tubes: (a) SEA; (b) CFE
Fig. 10 shows the impact force-displacement curves of the 1st–3rd order hierarchical tubes. It can be found that the changing trend of the six tubes is similar in the collapse process. At the beginning of the collision, the curves of the six tubes increase obviously after contacting with the rigid wall, and begin to decline after reaching an extreme point, which is commonly referred to as the initial peak point. After that, there are multiple peaks in the process of impact load, and the wave peaks and troughs alternately appear, corresponding to the collapse of the hierarchical tubes layer by layer. For the EST, only EST2 shows a good periodic folding mode. During the crushing process of EST3, the distance between the two peaks of the curve appears at a large interval. It is implicit in this phenomena that the folding is incomplete and the energy absorption is not ideal. The dotted lines in show the MCFs of the tubes. It can be found that in the same order hierarchical tubes, the MCFs of the CSTs are better than those of the ESTs, and the MCF of CST3 is 15.3% higher than that of EST3. According to the above analysis, it can be found that CST3 has better crashworthiness and can be used in the following optimization research.
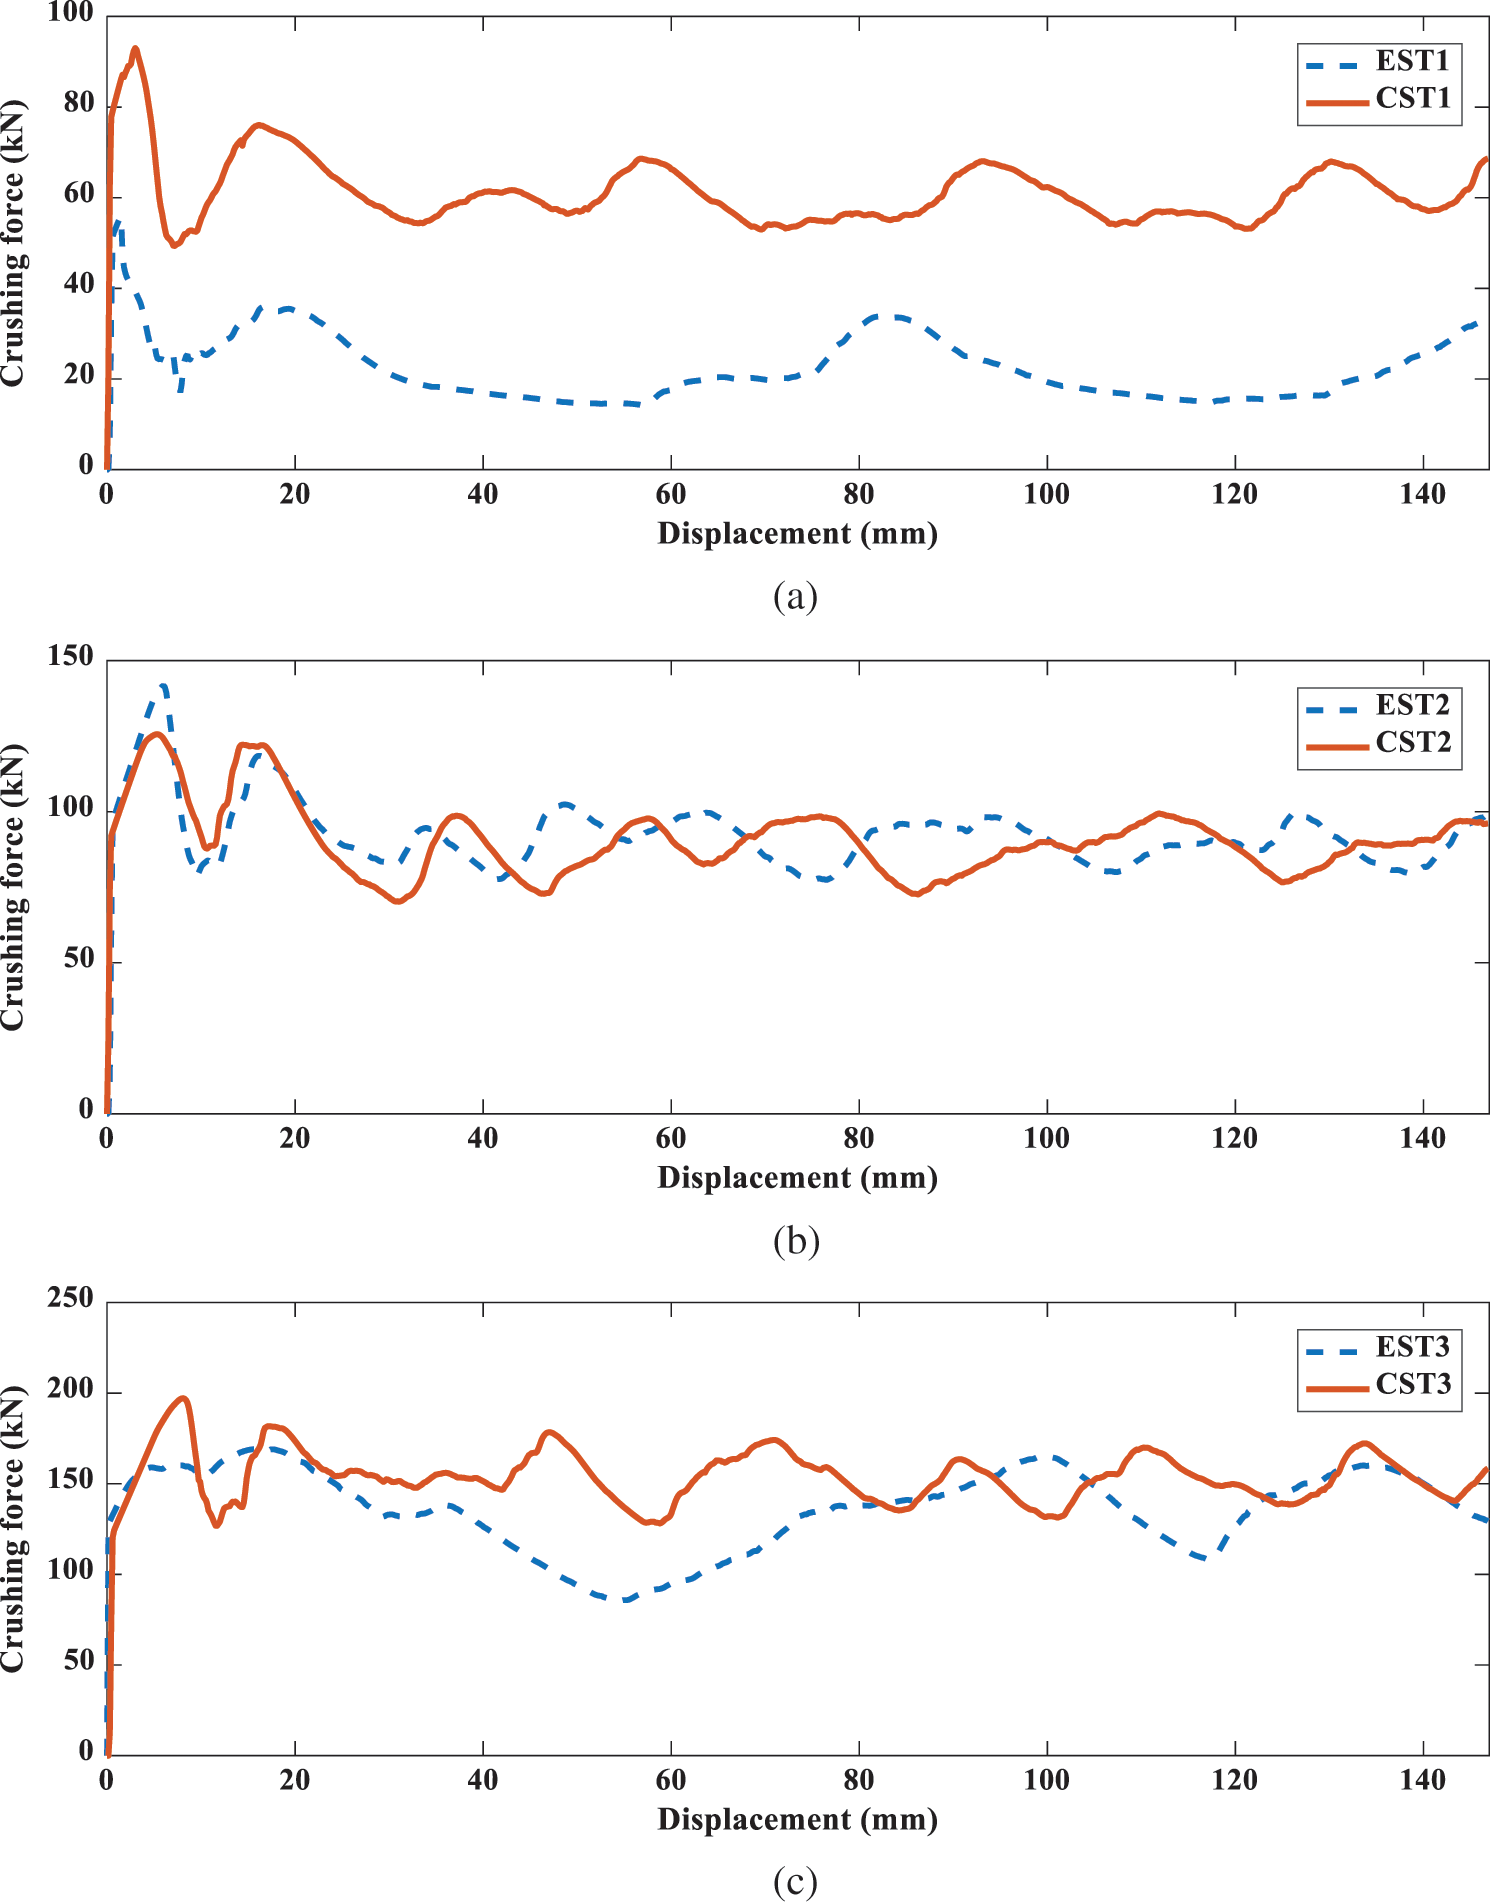
Figure 10: Crushing force-displacement curves of tubes: (a) EST1 and CST1; (b) EST2 and CST2; (c) EST3 and CST3
5 Crashworthiness Optimization
In order to design and manufacture a multi-cell thin-walled structure with better energy absorption effect, the wall thickness t, the hierarchy dimension parameters D2 and D3 of CST3 are taken as the design variables to be determined, and the FPCF and SEA of the tube are taken as the optimization performance indexes. Therefore, the multi-objective optimization of CST3 can be described by
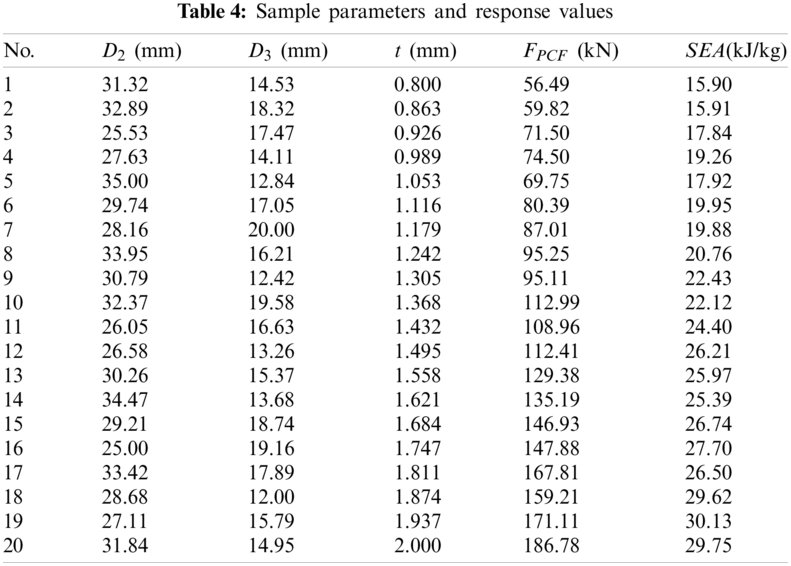
As shown in Table 4, taking the above three structural parameters as design variables, the optimal Latin hypercube test design method is used to determine 20 spatial sample points, and LS-DYNA software is used to carry out collision simulation, and the response values of corresponding models are calculated.
5.2 Construction of Approximate Model and Error Analysis
The optimization design process of the thin-walled tube requires a lot of iterative calculation, which not only takes a long time, but also often fails to obtain convergence results. Therefore, for complex FE analysis, the method of establishing approximate function through an approximate model has been widely used.
The response surface methodology (RSM) can fit the design space with a 1st–4th order polynomial function, which has good accuracy, fast calculation speed and simple calculation [29]. Therefore, in this section, the polynomial RSM is used to construct the approximate model of SEA and the PCF of the tube. Its expression is generally expressed as follows:
where k is the number of the polynomial functions
Generally, the accuracy of the surrogate model is evaluated by the coefficient of determination coefficient R2 and relative average absolute error (RAAE), which are expressed as follows:
where n is the number of sample points;
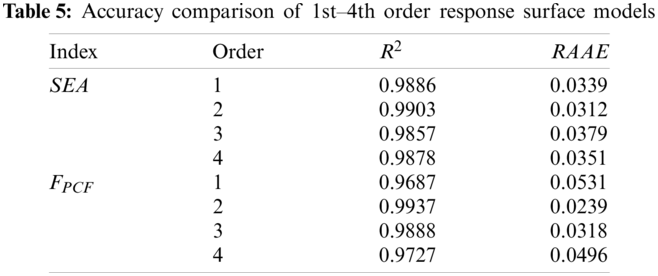
Based on the sample point parameters and response surface results in Table 4, the 1st–4th order response surface models of SEA and PCF, and the model accuracy is compared and analyzed, as shown in Table 5. Generally, the larger R2, the smaller RAAE, the higher the accuracy of the model. In Table 5, it can be found that the R2 of SEA and PCF under the 2nd-order polynomial RSM are 0.9903 and 0.9937, which are both greater than 0.9 and close to 1. The RAAE results are 0.0312 and 0.0239, respectively, which are close to 0. Therefore, the 2nd-order polynomial RSM has high accuracy and can be used for subsequent optimization analysis.
The 2nd-order approximate functions of the SEA and PCF of the tube to design variables are determined by fitting, as shown in the following formulas:
Taking the PCF and SEA as output variables, the optimization process is established in the Optimization module of Insight software. The improved non-dominated sorting genetic algorithm (NSGA-II) is adopted [30]. The population size is 12, and the genetic times are 20. After 483 calculations, 96 sets of optimal solutions are generated. The distribution of the optimal solution set and the Pareto front obtained by fitting are shown in Fig. 11.
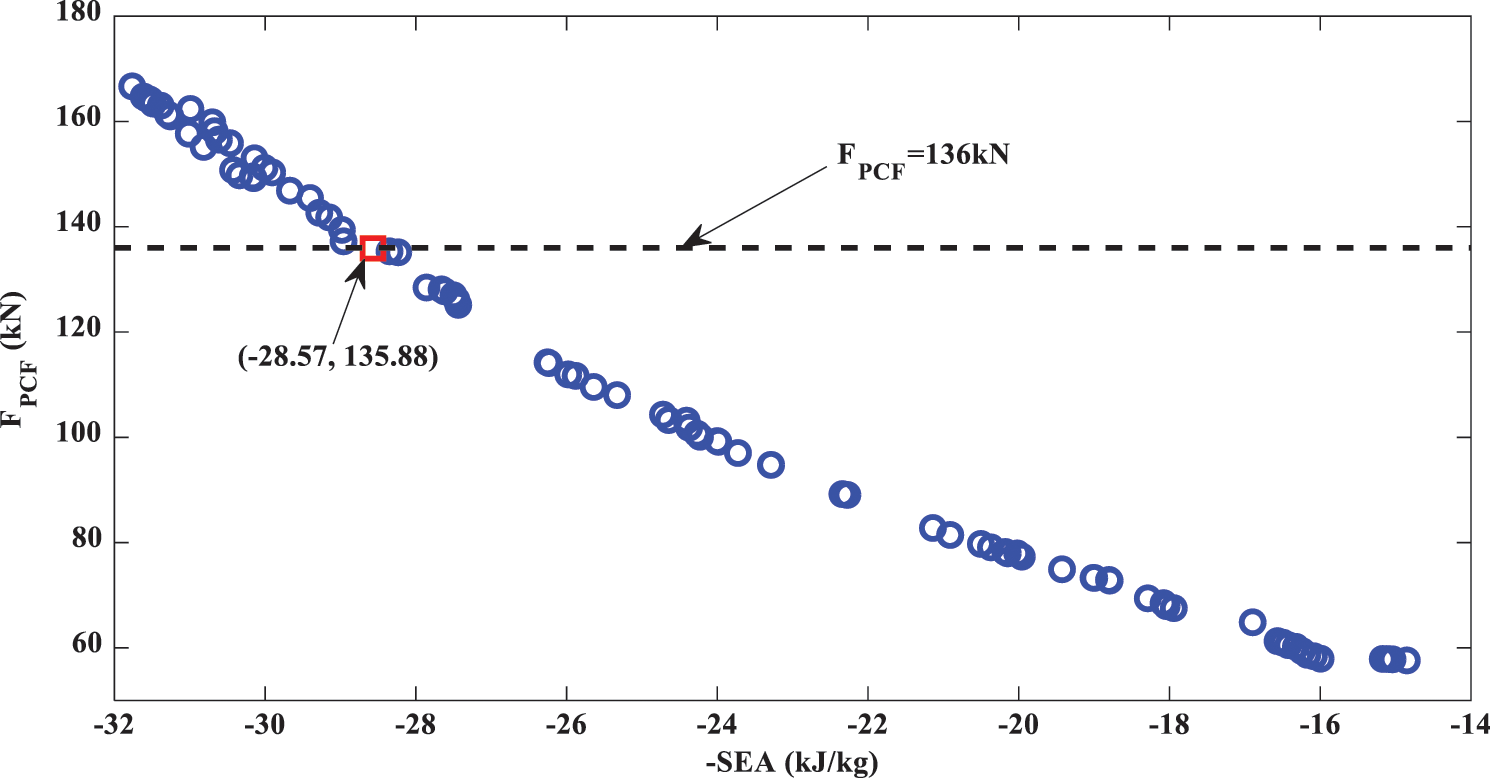
Figure 11: Pareto optimal solution set
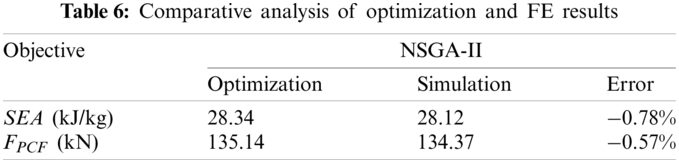
It can be seen from the figure that the changing trends of the PCF and SEA are contradictory. If we pursue a lower PCF, the SEA will inevitably decrease, and the two values will not reach the optimal solution at the same time. In fact, any solution on the Pareto front is an optimal solution, which needs to be combined with the actual engineering problems to allocate the weights of the two solutions. For example, if the design condition is that the PCF is not more than 136 kN, the satisfactory solution (−28.57, 135.88) is shown in Fig. 11. The corresponding structural parameters are D2 = 25.68 mm, D3 = 14 mm and t = 1.69 mm. The results of the RSM and those of the FE model are compared as shown in Table 6. It can be seen that the errors are kept within 1%, which indicates that the RSM has high accuracy.
Considering the constraint condition that the PCF is less than or equal to 136 kN, the energy absorption effect of the CST3 tube before and after optimization is compared as shown in Fig. 12. Fig. 12a shows the impact force-displacement curve of the CST3 before and after optimization. It can be found that the PCF of the optimized tube keeps, and the MCF increases by 4.4%. The time-SEA curve of the tube before and after optimization is shown in Fig. 12b. After 1 ms, the SEA of the optimized tube begins to exceed that of the non-optimized tube, and the SEA grows by 10.7%.
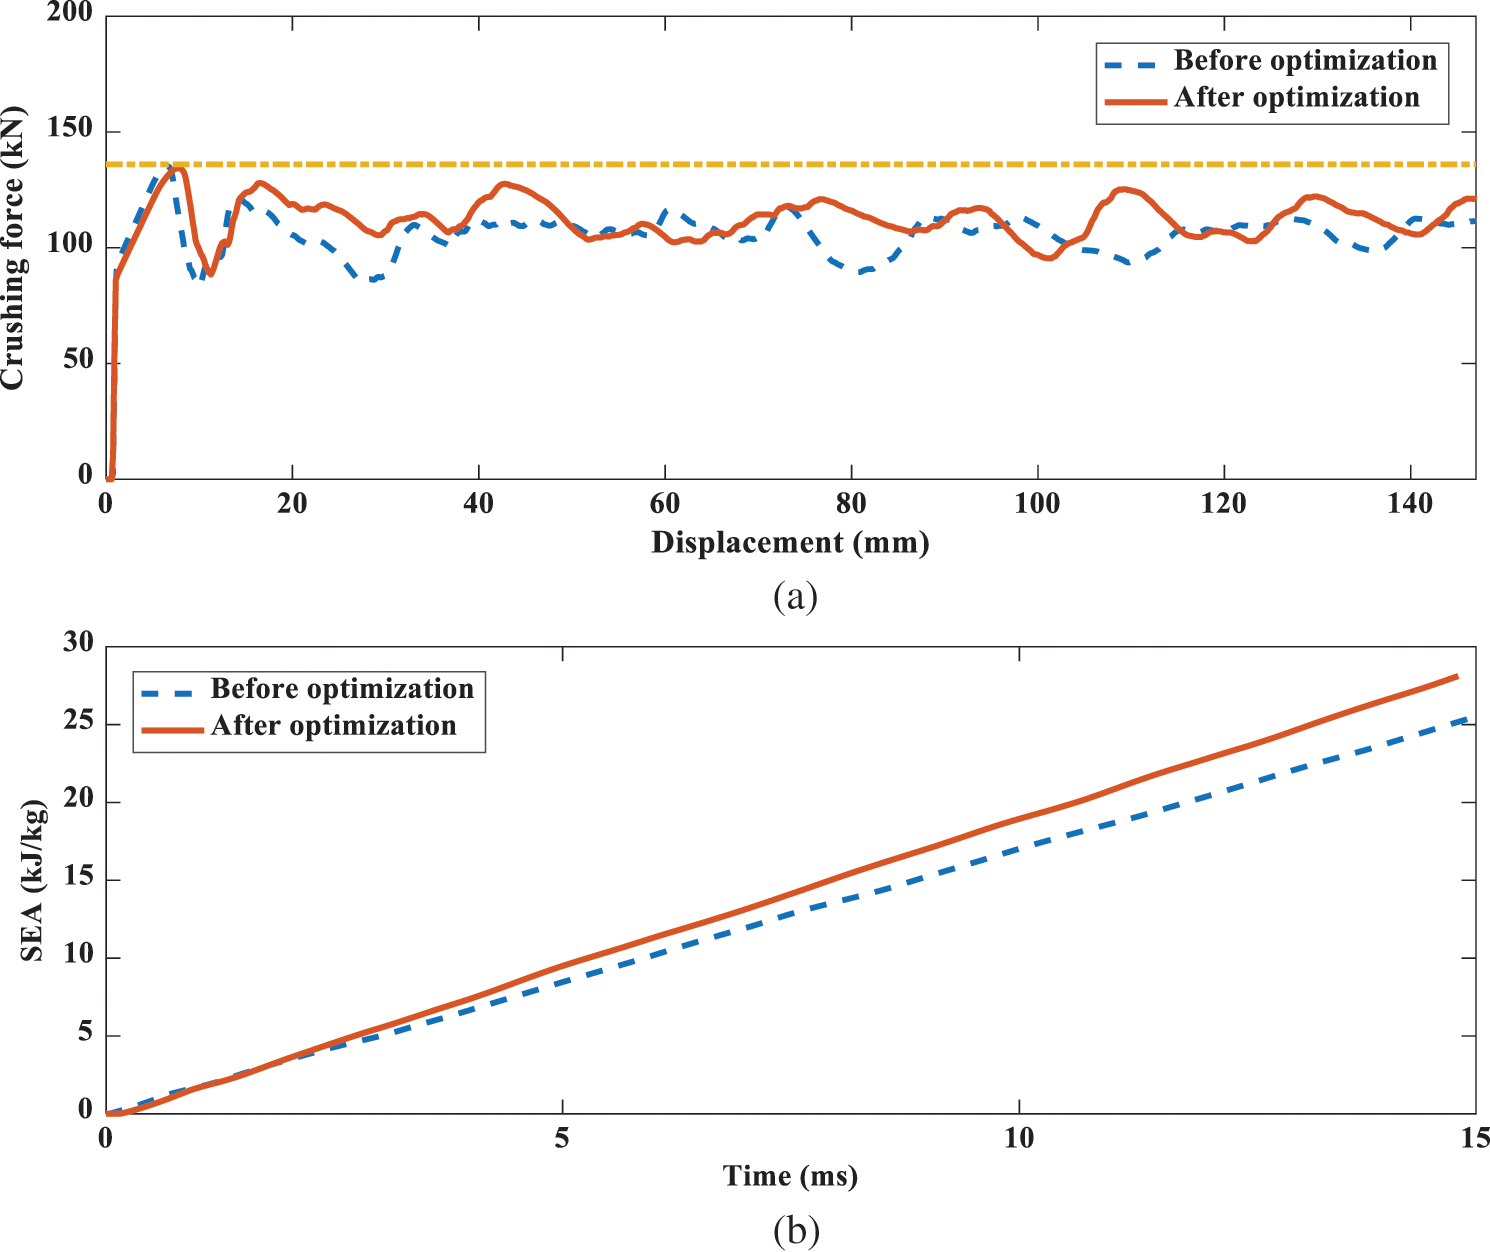
Figure 12: The energy absorption effect of the CST3 tube before and after optimization: (a) crushing force; (b) SEA
Based on the idea of bionics, two types of hierarchical tubes are proposed in this paper. According to the results of numerical simulation and theoretical prediction, it is found that the improvement of the hierarchical structures has a great impact on the crashworthiness of thin-walled tubes. In the same order hierarchical tubes, the CST is better than the EST. Comparing and analyzing six tubes, it is found that the thin-walled tube CST3 has high specific energy absorption and load efficiency, and is a good energy absorption structure. In order to find the optimal size of the hierarchical tubes, the RSM and NSGA-II algorithms are used to optimize the thin-walled tube CST3. The optimization results show that it must be a conflict result when the SEA and PCF are taken as the optimization objectives. Therefore, the Pareto front of thin-walled tubes is obtained in this paper, which provides reference values for solving practical engineering problems. In addition, the hierarchical tubes before and after optimization are selected for comparative analysis when the peak impact force is 136 kN. The optimized SEA and MCF are greatly improved, and the precision error with the RSM is within 1%, which indicates that the hierarchical tube CST3 has better crashworthiness.
Funding Statement: The authors are grateful to the National Natural Science Foundation of China (Grant No. 11902183), and the Doctoral Research Foundation of Shandong University of Technology (Grant No. 4041/418017).
Conflicts of Interest: The authors declare that they have no conflicts of interest to report regarding the present study.
1. Duddeck, F., Hunkeler, S., Lozano, P., Wehrle, E., Zeng, D. (2016). Topology optimization for crashworthiness of thin-walled structures under axial impact using hybrid cellular automata. Structural and Multidisciplinary Optimization, 54, 415–428. DOI 10.1007/s00158-016-1445-y. [Google Scholar] [CrossRef]
2. Shekari, M. R., Hekmatzadeh, A. A., Amiri, S. M. (2019). On the nonlinear dynamic analysis of base-isolated three-dimensional rectangular thin-walled steel tanks equipped with vertical baffle. Thin-Walled Structures, 138, 79–94. DOI 10.1016/j.tws.2019.01.037. [Google Scholar] [CrossRef]
3. Alexander, J. M. (1960). An approximate analysis of the collapse of thin cylindrical shells under axial loading. Quarterly Journal of Mechanics & Applied Mathematics, 13(1), 10–15. DOI 10.1093/qjmam/13.1.10. [Google Scholar] [CrossRef]
4. Wierzbicki, T., Abramowicz, W. (1983). On the crushing mechanics of thin-walled structures. Journal of Applied Mechanics, 50, 727–734. DOI 10.1115/1.3167137. [Google Scholar] [CrossRef]
5. Abramowicz, W., Jones, N. (1984). Dynamic axial crushing of square tubes. International Journal of Impact Engineering, 2(2), 179–208. DOI 10.1016/0734-743X(84)90005-8. [Google Scholar] [CrossRef]
6. Abramowicz, W., Jones, N. (1986). Dynamic progressive buckling of circular and square tubes. International Journal of Impact Engineering, 4(4), 243–270. DOI 10.1016/0734-743X(86)90017-5. [Google Scholar] [CrossRef]
7. Otubushin, A. (1998). Detailed validation of a non-linear finite element code using dynamic axial crushing of a square tube. International Journal of Impact Engineering, 21(5), 349–368. DOI 10.1016/S0734-743X(97)00041-9. [Google Scholar] [CrossRef]
8. Nia, A. A., Hamedani, J. H. (2010). Comparative analysis of energy absorption and deformations of thin-walled tubes with various section geometries. Thin-Walled Structures, 48(12), 946–954. DOI 10.1016/j.tws.2010.07.003. [Google Scholar] [CrossRef]
9. Nia, A. A., Parsapour, M. (2014). Comparative analysis of energy absorption capacity of simple and multi-cell thin-walled tubes with triangular, square, hexagonal and octagonal sections. Thin-Walled Structures, 74, 155–165. DOI 10.1016/j.tws.2013.10.005. [Google Scholar] [CrossRef]
10. Kim, H. S. (2002). New extruded multi-cell aluminum profile for maximum crash energy absorption and weight efficiency. Thin-Walled Structures, 40(4), 311–327. DOI 10.1016/S0263-8231(01)00069-6. [Google Scholar] [CrossRef]
11. Zhang, X., Zhang, H. (2012). Numerical and theoretical studies on energy absorption of three-panel angle elements. International Journal of Impact Engineering, 46, 23–40. DOI 10.1016/j.ijimpeng.2012.02.002. [Google Scholar] [CrossRef]
12. Zhang, X., Zhang, H. (2015). The crush resistance of four-panel angle elements. International Journal of Impact Engineering, 78, 81–97. DOI 10.1016/j.ijimpeng.2014.12.004. [Google Scholar] [CrossRef]
13. Sun, G., Jiang, H., Fang, J., Li, G., Li, Q. (2016). Crashworthiness of vertex based hierarchical honeycombs in out-of-plane impact. Materials & Design, 110, 705–719. DOI 10.1016/j.matdes.2016.08.032. [Google Scholar] [CrossRef]
14. Fang, J. G., Sun, G. Y., Qiu, N., Pang, T., Li, S. F. (2018). On hierarchical honeycombs under out-of-plane crushing. International Journal of Solids and Structures, 135, 1–13. DOI 10.1016/j.ijsolstr.2017.08.013. [Google Scholar] [CrossRef]
15. Yin, H., Xiao, Y., Wen, G., Qing, Q., Xin, W. (2015). Crushing analysis and multi-objective optimization design for bionic thin-walled structure. Materials & Design, 87, 825–834. DOI 10.1016/j.matdes.2015.08.095. [Google Scholar] [CrossRef]
16. Song, J. F., Wang, H. X., Gai, H. J., Liu, G. M., Zou, M. (2017). Bionic optimization design of thin-walled energy absorption tube inspired by bamboo structure. Manned Spaceflight, 23(4), 473–481 (in Chinese). DOI 10.3969/j.issn.1674-5825.2017.04.007. [Google Scholar] [CrossRef]
17. Huo, P., Xu, S. C., Fan, X. W., Li, J. P., Yang, X. et al. (2020). Oblique impact resistance of a bionic thin-walled tube based on antlers osteon. Explosion and Shock Waves, 40(11), 127–138 (in Chinese). DOI 10.11883/bzycj-2020-0035. [Google Scholar] [CrossRef]
18. Huang, H., Xu, S. C., Du, W. J., Zou, M., Song, J. F. et al. (2020). Energy absorption analysis and optimization of a bionic thin-walled tube based on shrimp chela. Transaction of Beijing Institute of Technology, 40(3), 267–274 (in Chinese). DOI 10.15918/j.tbit1001-0645.2018.342. [Google Scholar] [CrossRef]
19. Tang, Z. L., Liu, S. T., Zhang, Z. H. (2012). Energy absorption properties of non-convex multi-corner thin-walled columns. Thin-Walled Structures, 51, 112–120. DOI 10.1016/j.tws.2011.10.005. [Google Scholar] [CrossRef]
20. Hallquist, J. (2003). LS-DYNA user's manual version: (LS-DYNA 970ed). Livermore, California: Livermore Software Technology Corporation. [Google Scholar]
21. Song, J. F., Xu, S. C., Wang, H. X., Wu, X. Q., Zou, M. (2018). Bionic design and multi-objective optimization for variable wall thickness tube inspired bamboo structures. Thin-Walled Structures, 125, 76–88. DOI 10.1016/j.tws.2018.01.010. [Google Scholar] [CrossRef]
22. Ali, M., Ohioma, E., Kraft, F., Alam, K. (2015). Theoretical, numerical, and experimental study of dynamic axial crushing of thin walled pentagon and cross-shape tubes. Thin-Walled Structures, 94, 253–272. DOI 10.1016/j.tws.2015.04.007. [Google Scholar] [CrossRef]
23. Zhang, X., Cheng, G. D., Zhang, H. (2006). Theoretical prediction and numerical simulation of multi-cell square thin-walled structures. Thin-Walled Structures, 44, 1185–1191. DOI 10.1016/j.tws.2006.09.002. [Google Scholar] [CrossRef]
24. Qiu, N., Gao, Y. K., Fang, J. G., Feng, Z. X., Sun, G. Y. et al. (2016). Theoretical prediction and optimization of multi-cell hexagonal tubes under axial crashing. Thin-Walled Structures, 102, 111–121. DOI 10.1016/j.tws.2016.01.023. [Google Scholar] [CrossRef]
25. Chen, W., Wierzbicki, T. (2001). Relative merits of single-cell, multi-cell and foam-filled thin-walled structures in energy absorption. Thin-Walled Structures, 39(4), 287–306. DOI 10.1016/S0263-8231(01)00006-4. [Google Scholar] [CrossRef]
26. Tran, T., Hou, S., Han, X., Chau, M. (2015). Crushing analysis and numerical optimization of angle element structures under axial impact loading. Composite Structures, 119, 422–435. DOI 10.1016/j.compstruct.2014.09.019. [Google Scholar] [CrossRef]
27. Zhang, Y., Xu, X., Sun, G. Y., Lai, X., Li, Q. (2018). Nondeterministic optimization of tapered sandwich column for crashworthiness. Thin-Walled Structures, 122, 193–207. DOI 10.1016/j.tws.2017.09.028. [Google Scholar] [CrossRef]
28. Zhang, X., Huh, H. (2010). Crushing analysis of polygonal columns and angle elements. International Journal of Impact Engineering, 37(4), 441–451. DOI 10.1016/j.ijimpeng.2009.06.009. [Google Scholar] [CrossRef]
29. Liao, X., Li, Q., Yang, X., Zhang, W., Li, W. (2008). Multiobjective optimization for crash safety design of vehicles using stepwise regression model. Structural and Multidisciplinary Optimization, 35, 561–569. DOI 10.1007/s00158-007-0163-x. [Google Scholar] [CrossRef]
30. Sun, G. Y., Pang, T., Fang, J. G., Li, G. Y., Li, Q. (2017). Parameterization of criss-cross configurations for multiobjective crashworthiness optimization. International Journal of Mechanical Sciences, 124, 145–57. DOI 10.1016/j.ijmecsci.2017.02.027. [Google Scholar] [CrossRef]
 | This work is licensed under a Creative Commons Attribution 4.0 International License, which permits unrestricted use, distribution, and reproduction in any medium, provided the original work is properly cited. |