| Computer Modeling in Engineering & Sciences |
DOI: 10.32604/cmes.2022.019564
ARTICLE
Optimal Scheduling for Flexible Regional Integrated Energy System with Soft Open Point
1Zhejiang Huayun Electric Power Engineering Design & Consulting Co., Ltd., Hangzhou, 310026, China
2College of Information Engineering, Zhejiang University of Technology, Hangzhou, 310023, China
3Electric Power Research Institute of State Grid Zhejiang Electric Power Company, Hangzhou, 310014, China
*Corresponding Author: Youbing Zhang. Email: youbingzhang@zjut.edu.cn
Received: 29 September 2021; Accepted: 09 November 2021
Abstract: The Regional Integrated Energy System (RIES) has brought new modes of development, utilization, conversion, storage of energy. The introduction of Soft Open Point (SOP) and the application of Power to Gas (P2G) technology will greatly deepen the coupling of the electricity-gas integrated energy system, improve the flexibility and safety of the operation of the power system, and bring a deal of benefits to the power system. On this background, an optimal dispatch model of RIES combined cold, heat, gas and electricity with SOP is proposed. Firstly, RIES architecture with SOP and P2G is designed and its mathematical model also is built. Secondly, on the basis of considering the optimal scheduling of combined cold, heat, gas and electricity, the optimal scheduling model for RIES was established. After that, the original model is transformed into a mixed-integer second-order cone programming model by using linearization and second-order cone relaxation techniques, and the CPLEX solver is invoked to solve the optimization problem. Finally, the modified IEEE 33-bus system is used to analyze the benefits of SOP, P2G technology and lithium bromide absorption chillers in reducing system network loss and cost, as well as improving the system’s ability to absorb wind and solar and operating safety.
Keywords: Regional integrated energy system; power to gas; soft open point; wind and photovoltaic power permeation; lithium bromide chiller; operating cost
Entering the first year of the “14th Five-Year Plan”, “carbon peak” and “carbon neutral” have been written in the Chinese national government report. In the context of the national energy development strategy of the “two carbons” [1] vision, the energy supply method driven by traditional fossil energy is accelerating to be replaced by wind power, photovoltaic and other renewable clean energy (RCE) supply methods [2]. However, RCE, such as wind and solar, whose power generation ratio is increasing year by year, is difficult to be completely consumed due to its inherent low peak regulation ability, strong uncertainty and strong volatility. The continued high rate of abandonment of wind and photovoltaic has gradually become a bottleneck restricting the continued and healthy promotion of RCE power generation substitution [3]. At the same time, the high percentage of RCE penetration is likely to cause safety problems, such as low comprehensive energy utilization, over-limit voltage of the distribution network and power fluctuations. This also brings enormous challenges to the balance of power supply and demand, and then significantly weakens the flexible control capability of the power system for its economic and safe operation.
On the other hand, although China’s energy system construction (such as coal, oil, natural gas, power supply, heat supply, etc.) has made great progress in recent years [4], the mutual coupling and utilization between them is still in a lack of state. The partial imbalance between energy supply and demand occurs from time to time. There are also many problems such as low efficiency in the energy construction investment and the coordinated utilization of energy coupling equipment [5,6]. Regional Integrated Energy System (RIES) is widely deployed with the development and improvement in the key technologies during the past decades, which precisely provides a good solution for accommodations of wind and solar power, improvement in energy usage efficiency, and transition of traditional fossil energy to clean energy. Besides, it can be used to realize the coordinated planning, collaborative management, interactive response, mutual assistance and optimized operation among various heterogeneous energy supply systems [7]. In addition to meeting the diversified energy demands of the load in the system, it can also effectively improve its quality and efficiency of the utilization of multiple heterogeneous energies, and promote the green and sustainable development of local energy and society [8].
The current research on RIES mainly focuses on three aspects: system planning, modeling and optimal scheduling. For example, the hot issues of RIES in planning and operation optimization are summarized and analyzed, the similarities and differences between the integrated energy system and the energy Internet are generalized as well in [9]. References [10,11] established their optimization scheduling model for RIES considering energy cascade utilization and energy storage equipment, respectively. That optimized the energy supply path of RIES from various aspects, which has the effect of dropping carbon and low carbon, increasing the utilization rate of RCE and reducing the operating cost of RIES. In reference [12], an optimal day-ahead scheduling of gas-electricity integrated energy system considering bidirectional energy flow is built to achieve the complementarity of the thermal-electric system, and reduce RIES energy consumption and energy storage equipment investment costs. However, the primary problem currently faced by RIES in optimizing dispatch is how to promote the coordinated and optimized operation of various heterogeneous energy supplies within RIES, speed up the two-carbon process, improve the overall utilization of energy within RIES and further reduce the high operating costs of RIES while ensuring the safe operation of the power system within RIES and digesting RCE locally as much as possible. But, the research in [9–12] has almost nothing to do with the coordinated optimized operation and improvement of the operational safety of RIES.
With the continuous integration of large-scale wind power and photovoltaic into the grid, the research on combining them with RIES to increase their consumption is also continuing to advance. As shown in [13–16], integrated demand response (IDR) is considered for the energy flow interaction and coordination optimization scheduling of RIES’s multi-energy loads, the detailed IDR model containing various energy supplies is established. Although it makes the comprehensive utilization rate of system equipment and various energy sources enhanced, the quality, flexibility and economy of RIES’s operating status improved, and plays a positive role in local consumption of RCE while optimizing the allocation of various energy sources. However, its comprehensive promotion effect is not obvious, and there are few studies on the economic safety of its internal power system operation in spite of the balance between energy supply and demand of RIES is promoted.
Therefore, through analyzing the above-mentioned literature, it is not difficult to find that the current research on RIES cannot solve the current primary problems that RIES faces in terms of optimal scheduling well. At the same time, due to the aforementioned nature of RCE, such as high permeability wind and photovoltaic, the energy conversion, coordination and consumption capabilities of RIES have been greatly weakened, which also has led to an imbalance in the power supply and demand of RIES. However, the power to gas (P2G) technology and the new type of power electronic device named soft open point (SOP) which have emerged and developed rapidly in recent years have provided a new solution to promote of RCE consumption, reduce RIES’s high operating costs and the loss of the power system. In addition, it also can promote the system voltage level and maintain the internal power system in a safe and stable operation state.
Based on this, this article in view of the present RIES in the determination of the optimal scheduling priority, puts forward a SOP-based flexible RIES combined cold, heat, gas and electricity cogeneration optimal scheduling model. That is beneficial to further study the coordinated and optimized operation of RIES for multiple energy supplies, improve the energy utilization efficiency safety and stability of the RIES, meanwhile, lift the consumption of RCE and reduce the cost of purchasing energy from higher-level networks. In the process of the model building process, SOP, P2G two-stage operation and lithium bromide absorption chiller refrigeration technology are gradually introduced. And linearization and second-order cone transformation are used in the solution process to transform the original model into a mixed-integer second-order cone programming (MISOCP) model, so that the model is easier to solve. Besides, the objective function is set to minimize the sum of RIES’s energy purchase cost from the upper-level network and RIES power system network line loss cost. Finally, a modified IEEE 33-bus system is used to test the effectiveness of the model proposed in the article. Through a series of optimized comparative analysis based on quantitative analysis indicators, the effectiveness of the proposed scheduling model in increasing the efficiency of multi-energy coupling utilization and improving the economic operation of the system is verified.
2 RIES Combined Cold Heat Gas Electricity with P2G
2.1 Structure and Application Analysis of RIES with SOP
In this paper, as shown in Fig. 1, RIES with SOP for cold, heat, gas, electricity supply is constructed. On the supply side, distributed wind turbines (WT) and photovoltaic (PV), superior grid (SG) and superior gas grid (SGG) provide energy sources for the system. The conversion side includes the units of SOP active power transmission and reactive power compensation, electrolytic cell (EC), hydrogen storage tank (HST) and methane reactor (MR), as well as gas turbine (GT), gas boiler (GB), electric refrigerator (ER) and lithium bromide absorption chiller (LBAC) for cogeneration of cold, heat and power. The load is composed of comprehensive loads of electricity, gas, heat and cold.
On the conversion side, P2G technology is introduced in this paper. It can convert the excessive power of wind turbines and photovoltaic during the high generation period into H2 that can be stored locally and injected it into a HST for storage. Or it directly completes the two processes of hydrogen production by electricity and methanation of H2, then convert it into natural gas which is easy for large-scale storage and injected into natural gas pipelines for direct use. Whereas H2 stored in the HST can be converted into natural gas for direct use through Sabatier reaction of MR during peak period of gas and electricity consumption. Or it can be reused by cogeneration of gas units. This approach is adopted in this paper to promote the local consumption of RCE, improve the energy efficiency, reduce the phenomenon of abandoning wind and photovoltaic, and decrease the operation cost of the system by cutting down the amount of electricity (gas) purchased by RIES from the superior power (gas) network. Moreover, the access SOP can precisely control the power flow and reactive power compensation of the RIES power system, thereby reducing power system losses and improving the over-limit situation of the power system node voltage. However, since the SOP does not necessarily carry out active power transmission or reactive power compensation at every moment, the power flow through the SOP in Fig. 1 is represented by dotted lines.
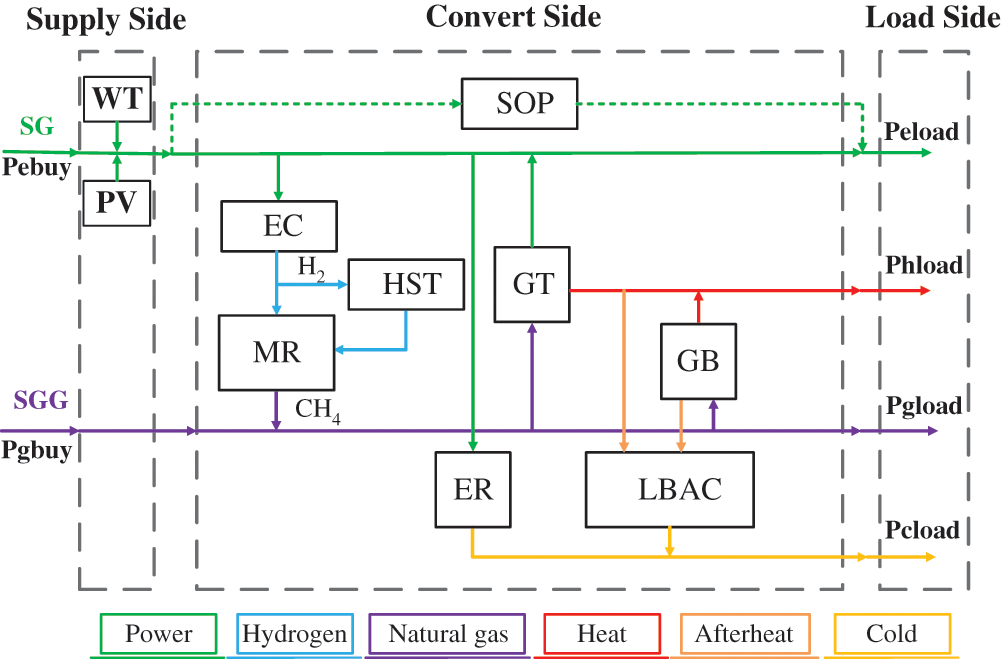
Figure 1: Schematic diagram of RIES
In addition, the paper also adopts the combined refrigeration mode of ER and LBAC on the conversion side. When there are GB and GT working, the LBAC will be preferred to absorb the waste heat and afterheat of the gas unit for refrigeration. And the remaining refrigeration needs will be completed by the ER. While ensuring the normal demand for cold load, it realizes the reuse of waste heat and afterheat, and promotes the coordinated operation of the energy supply of various equipment.
2.2 The Main Function and Mathematical Model of SOP
SOP is a new type of power electronic device installed between adjacent feeders of power system to replace the traditional normally contact switch (NOP) in distribution network [17,18], as shown in Fig. 2. Compared with the NOP operation, SOP can effectively control the active power transmitted between the two connected feeders, thereby balancing the load on the two feeders, reducing feeder line losses, improving the overall power flow distribution of the line, and providing certain reactive power support according to the demand, while weakening the risks brought by frequent NOP actions [19].
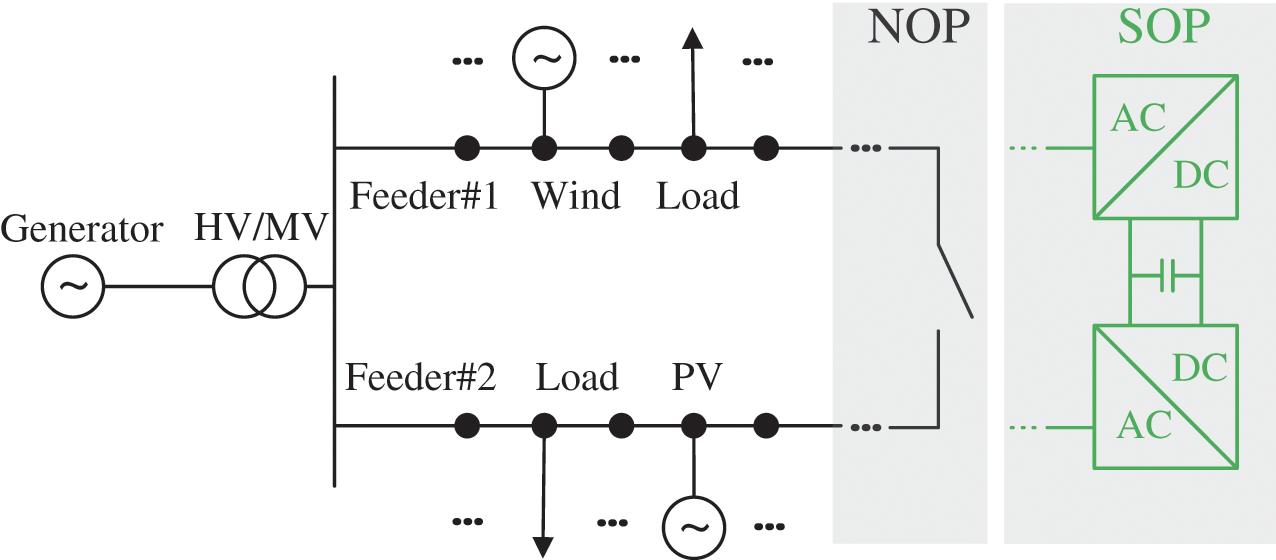
Figure 2: SOP installation position
In this paper, the common type SOP of back-to-back voltage source converter (B2B VSC) [20] is used to connect to RIES power system, and the PQ-VdcQ control method is determined as the SOP control method in the article. For SOP, its controllable variables mainly include two, which are respectively the active power transmission and the reactive power compensation provided by each B2B VSC. Because B2B VSC is a fully-controlled power electronic device, although its efficiency is high enough, when it carries out large-scale active power transmission, certain losses will inevitably occur. While for the reactive power compensation, the two B2B VSCs are independent of each other due to the isolation effect of their internal large capacitors, so they only need to meet their respective capacity limits. Therefore, the operation control of SOP needs to meet the following constraints:
1) Constrains of SOP active power:
where
2) Constrains of SOP reactive power:
where
3) Constrains of SOP capacity:
where
2.3 Construction of P2G Device Model
P2G equipment can generate H2 and O2 through water electrolysis reaction. According to needs, part of the generated H2 is stored in the HST, and then being supplied to the MR for reaction with CO2 through Sabatier reaction to produce artificial natural gas in next time period, which is injected into the RIES natural gas pipeline for use by the RIES gas equipment or load. And the other part is directly transmitted to the MR to synthesize artificial natural gas through the HST in the current scheduling period, so as to realize the conversion and utilization of surplus electric energy generated by wind power and photovoltaic to natural gas, and further deepen the coupling of electricity-gas integrated energy system, thereby realizing the bidirectional coupling of the two systems together with the GT of the system. Since P2G contains two stages of electric hydrogen production and H2 methanation, and the HST is used as the energy storage device in this paper, the efficiency of electric hydrogen production and H2 methanation is approximately fixed. The constructed models of EC, MR and HST are shown as follows:
4) EC model:
where
5) MR model:
where
6) HST model:
where
2.4 Construction of Gas Unit Model
The gas unit in this paper includes two parts: GT and gas boiler. Their energy sources is natural gas in the RIES natural gas pipeline, and they supply power (heat) to the electric (heat) load in the power (heat) system when needed. Meanwhile, they are one of the power sources in the power system, the gas load in the natural gas system and the heat source in the heat system, which promotes the coupling of electricity, gas and heat integrated energy systems to a certain extent. The constructed GT and GB models are shown as follows:
7) GT model:
where
8) GB model:
where
2.5 Construction of Combined Refrigeration Unit Model
In this paper, in order to meet the cold load requirements, the electric chiller and the LBAC are combined, in which the ER directly uses the electric energy in the RIES power system as the energy source to drive the compressor to work and refrigerate. While the lithium bromide absorption refrigeration unit uses the high-temperature flue gas and waste heat produced by GT and GB to do work, which can realize the reuse of waste heat and afterheat, promote the efficient utilization of energy and enhance the economic operation of RIES. The models of combined refrigeration units constructed in this paper are as follows:
9) ER model:
where
10) LBAC model:
where
3 Optimization Scheduling Model of RIES
Accounting for the operational cost, the combination of minimum total energy purchase cost of RIES from the superior network and minimum network line loss cost of the power system of RIES is proposed as the objective function in this paper, which is formulated as:
where
1) Purchasing cost:
where
2) System power network loss cost:
where
According to the actual operational situation of the system, combining the mutual coupling relationships among the supply side, the conversion side and the load side, the power balance constraint relationships among electricity, gas, heat and cold of RIES are given. That respectively include six parts: power system operation constraint, electric power balance constraint, gas power balance constraint, thermal power balance constraint, cold power balance constraint and interaction constraint with superior electricity (gas) network. The specific expression is as follows:
1) Constrains of power system operation:
Constrains (41) and (42) respectively represent the active and reactive power balance of node i at period t. The total active and reactive power injected of node i at period t are expressed as constrains (43) and (44), respectively. Constraint (45) is Ohm’s law on the branch
2) Constrains of electric power balance:
3) Constrains of gas power balance:
4) Constrains of heat power balance:
where
5) Constrains of cold power balance:
where
6) Constrains of interaction with superior network:
where
Since the operating model of RIES power system with SOP built in this paper is a mixed-integer nonlinear programming (MINLP) problem, which cannot be effectively solved by existing methods. Second-order cone programming, as a convex programming in higher mathematics, can be regarded as a general form of linear programming and nonlinear programming and it has been widely used to solve MINLP problems because of its outstanding performance in computational efficiency and global optimality [21]. Therefore, this paper uses linearization and conic relaxation to transmit the original model into a MISOCP model, so as to achieve rapid and accurate calculation. In addition, variable substitution is used to realize linearization, namely let
However, after substituting the variables, it is determined that the current constraint (46) is still nonlinear due to the existence of quadratic terms, so it can be relaxed to the following second-order cone constraint:
Besides, the operational constraints of SOP are all quadratic nonlinear constraints, thus they can be converted into the following rotated second-order cone constraints:
4.1 Test Platform and Test System
In this section, in order to test and verify the effectiveness of the RIES optimization scheduling model and method proposed in this paper, this paper is programmed in MATLAB R2018b software platform with YALMIP optimization toolbox [22], and solved by IBM ILOG CPLEX 12.6 algorithm package. The computation is performed on a PC with Intel (R) Core (TM) i7-8700 CPU@3.20 GHz processor and 8 GB RAM, and the software environment is Windows10 operating system.
In addition, based on the standard IEEE 33-bus system, the wind turbine, photovoltaic, P2G, electric refrigeration and GT equipment coupled with the power grid are connected into it as a test system, so as to verify the effectiveness of the scheduling model proposed in this paper in improving the utilization efficiency of multi-energy coupling and enhancing the economic operation of the system. The modified RIES IEEE 33-bus power system network is shown in Fig. 3, and its rated voltage level is 12.66 kV. As for its detailed parameters can be referred to Reference [23].
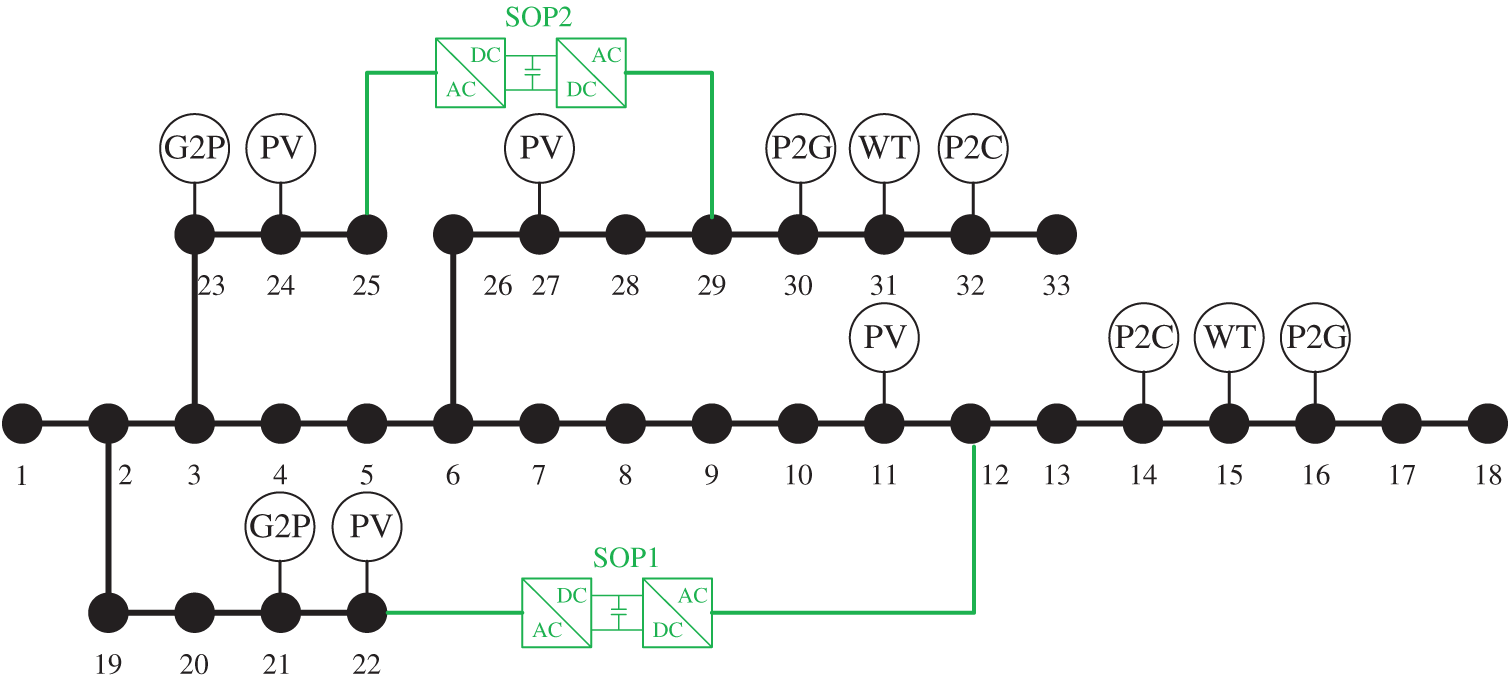
Figure 3: IEEE 33-bus system architecture after modified
In order to promote P2G equipment to absorb the electric energy generated by RCE, such as wind power and photovoltaic, two wind generators and four photovoltaic stations are connected to the power system, and all of them operate under a unit power factor, without considering the local reactive power support of them [24–26]. The basic installation parameters are shown in Table 1. In this paper, every hour in a day is taken as the stepping period, and the daily operation curves of wind turbines, photovoltaic and various loads are obtained through prediction, as shown in Fig. 4. Two sets of SOPs which have a capacity of 500 kVA are installed between nodes 25 and 29, as well as nodes 12 and 22, and the upper limit of reactive power is 400 kVar. In this paper, it is supposed that the loss coefficient of each SOP is 0.02 [21,27–29].
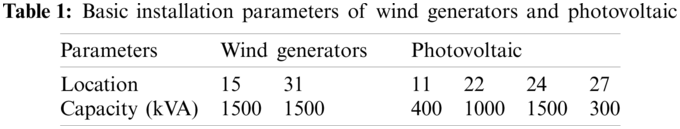
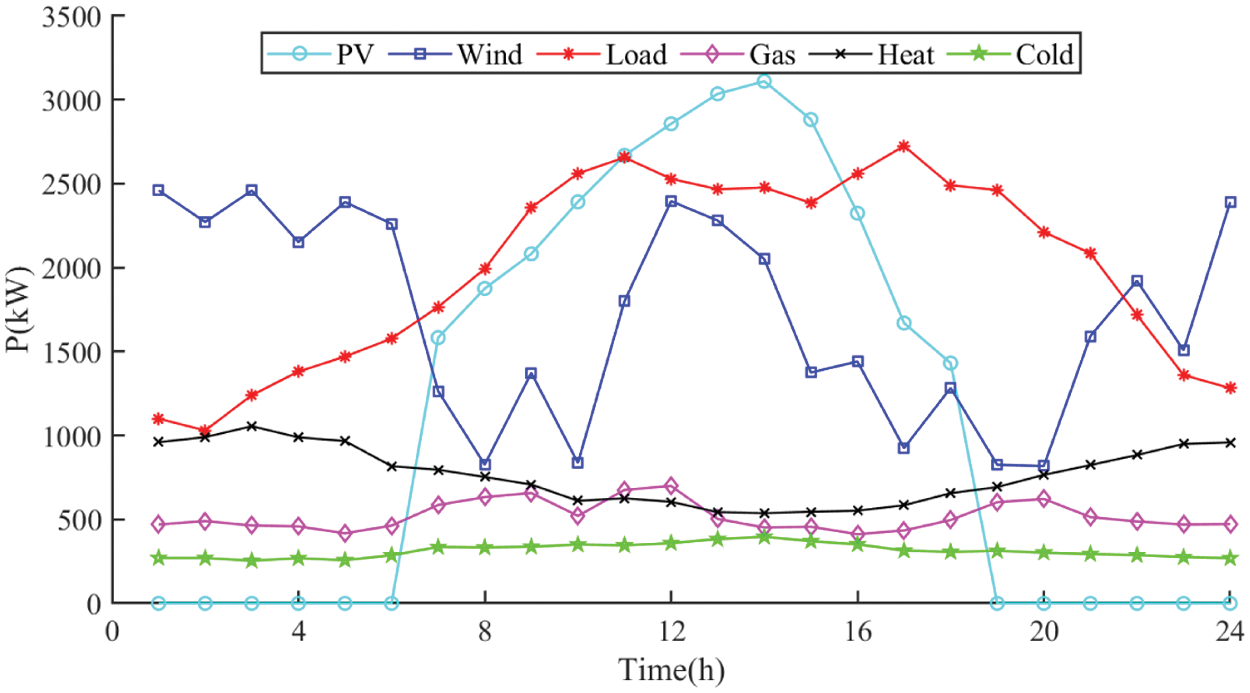
Figure 4: Daily operation curves of wind generators, photovoltaic and loads
4.2 Scheme Setting and Quantitative Analysis Indicators
So as to clearly compare the effectiveness of the optimization scheduling model built in this paper on the multi-energy coupling operation for optimizing system, the following four optimization scheduling schemes are set:
Scheme 1: Combined power supply of electricity, gas, heat and cold based on ER refrigeration, GB heating, GT, wind generator, photovoltaic and power (gas) supply of superior electric (gas) network.
Scheme 2: Adding SOP based on Scheme 1.
Scheme 3: Adding P2G equipment based on Scheme 2.
Scheme 4: Adding LBAC based on Scheme 3, that is, the optimal scheduling method proposed in this paper.
The quantitative analysis index of this paper is set as follow: 1) Power network line loss. 2) Node voltage deviation. 3) Energy purchase cost from superior network. 4) Total cost of system operation. 5) Comprehensive utilization rate of photovoltaic and wind turbines.
4.3 Analysis of Optimization Results
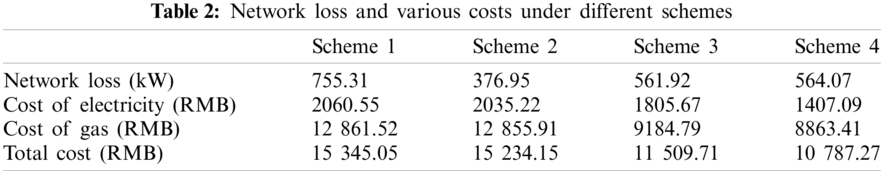
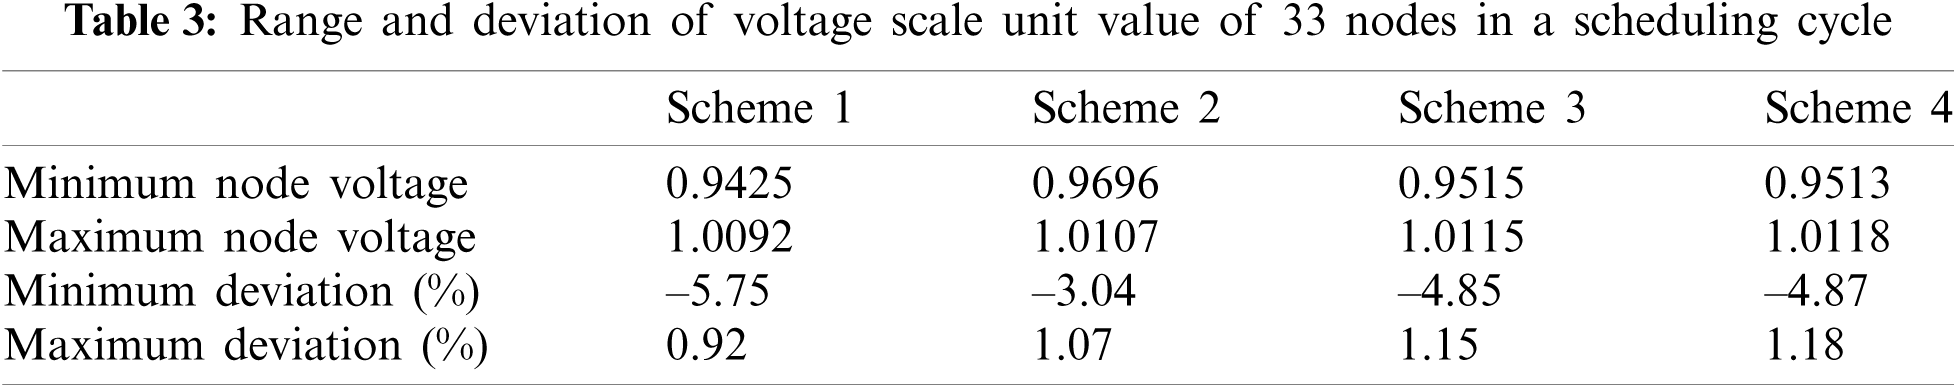
According to the quantitative analysis indexes considered, the line loss of power network, the cost of purchasing energy from superior power grid and gas network, as well as the total cost of system operation under different schemes are shown in Table 2. While the range and deviation of voltage unit values of 33 nodes in a scheduling period are shown in Table 3. The detailed analysis of optimization results is as follows:
1) Analysis of power network line loss:
According to the case analysis, the curves of active power transmission and reactive power compensation of scheme 4 in different periods are obtained after SOP was added, as shown in Figs. 5a and 5b. As for the curves of SOP for active power transmission and reactive power compensation in Scheme 2 and Scheme 3, since all SOPs have actions and are comparative schemes, they will not be described repeatedly here. For specific curves, please refer to Figs. A1 and A2. In addition, the paper also gets the power system loss curves under different schemes by comparing the simulation results of the four schemes, as shown in Fig. 6. It can be seen from Fig. 5a that the operation strategy of SOP in Scheme 4 is consistent with the power supply and demand of RIES. Between 7:00 and 20:00, wind turbines and photovoltaic cannot meet the high-power demand of the current nodes locally, thus the two SOPs transmit active power to node 12 and 29 to reduce the power demand of the system. Moreover, SOP precisely regulates the active and reactive power flows of power system by transmitting active power and providing reactive power compensation respectively, and responds to the voltage fluctuation caused by WT and PV in time, thereby reducing the network loss of power lines.
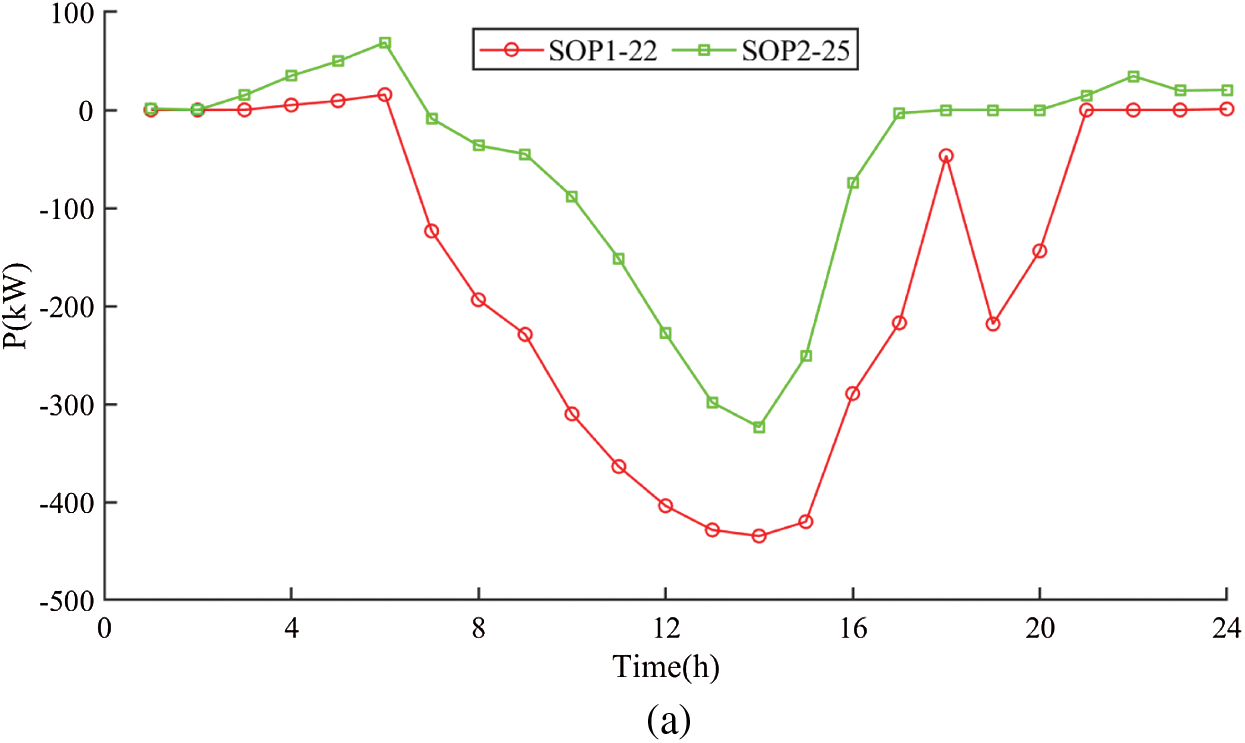
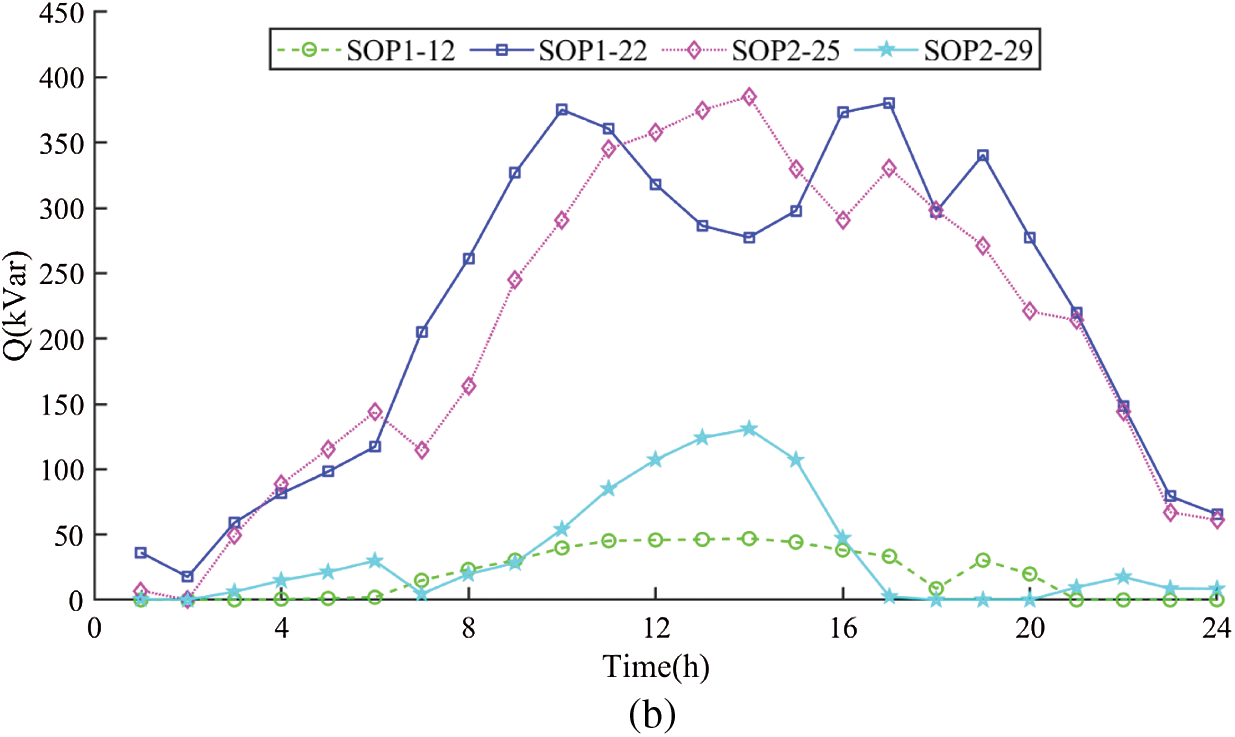
Figure 5: Scheduling strategies of SOP in Scheme 4. (a) Active power transmission of SOP (b) Reactive power compensation of SOP
It can be seen from Tables 2 and 3 and Fig. 6 that after SOP was added into Scheme 2, the power system network loss was greatly reduced from 755.31 to 376.95 kW, a decrease of 50.09%. However, after the P2G equipment is connected in Scheme 3, the active power transmission capacity of power lines increases because the energy consumption of WT and PV over-generation is promoted, which lead to the increase of network loss. But, compared with Scheme 1, the network loss of Schemes 3 and 4 is still reduced by 25.60% and 25.32%, respectively, which verified the positive effect of SOP on reducing the network loss of power system.
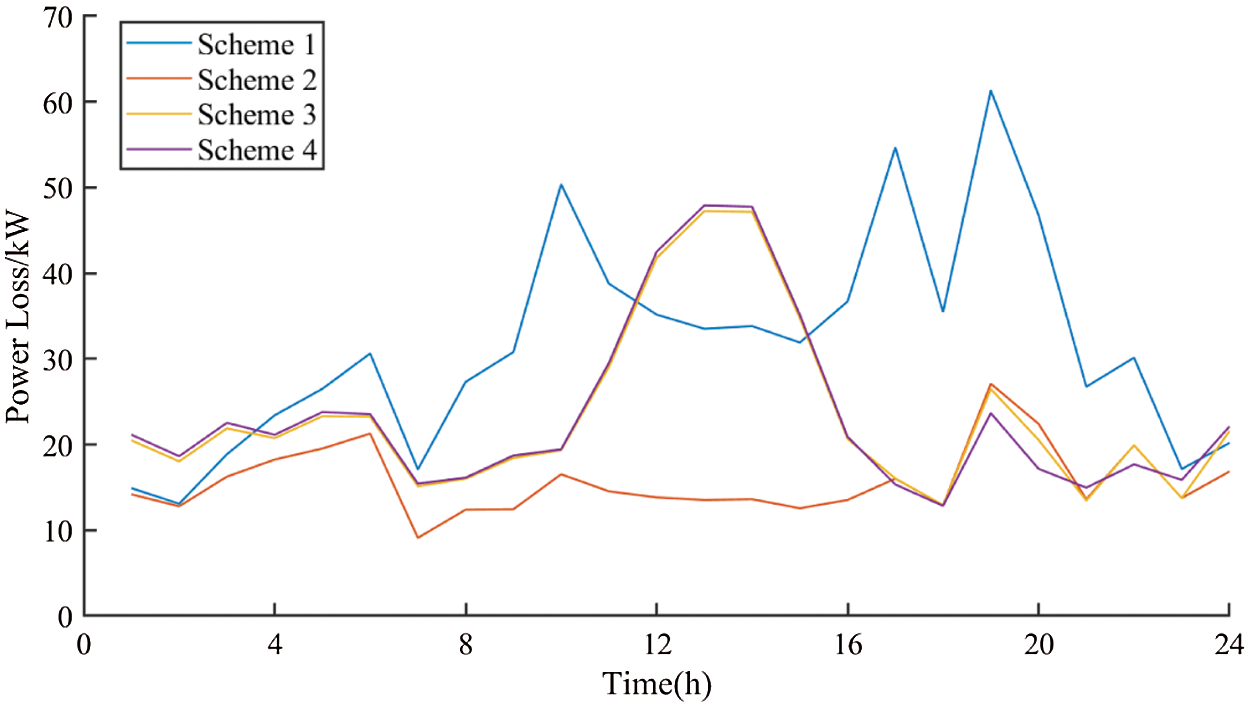
Figure 6: Power system loss under different schemes
2) Analysis of node voltage standard unit value deviation:
As can be seen from Table 3, when SOP is not added in Scheme 1, the minimum voltage nominal unit value of each node of 33 nodes within a scheduling cycle is 0.9425, which means that there is a serious voltage over-limit situation. For the specific voltage over-limit situation, please refer to Fig. A3. However, after the SOP was added in Scheme 2, the voltage standard unit value of each node of 33 nodes in a scheduling period was at least 0.9696, which was directly increased by 0.0271 from 0.9425 in Scheme 1, and the voltage over-limit situation disappeared. Although Schemes 3 and 4 increase the active power of power lines and decrease the node voltage after connecting P2G equipment, SOP provides reactive power compensation, which still keeps it in the state of not exceeding the limit, improves the economy and safety of system operation, and verifies the advantages of SOP in voltage reactive power control and improving feeder voltage level. The node voltage distribution can also refer to Fig. A3.
3) Analysis of energy cost from superior network:
According to Table 2, after SOP, P2G and lithium bromide absorption chiller are added in turn, the cost of purchasing power from the superior power grid is reduced from RMB 2,060.55 to RMB 2,035.22, RMB 1,805.67 and RMB 1,407.09 in turn, and the cost is decreased by 1.23%, 12.37% and 31.71%, respectively. At the same time, the cost of gas purchase from the superior gas network decreased from RMB 12,861.52 to RMB 12,855.91, RMB 9,184.79 and RMB 8,863.41 in turn, and the cost dropped by 0.04%, 28.59% and 31.09%, respectively. The reason why the cost reduction percentage of Scheme 2 is small is that Scheme 2 only adds SOP, and the SOP itself has losses during operation, which led that the total network loss of the system is not significantly cutting down. However, by providing reactive power compensation, SOP optimizes the node voltage of power system from the over-limit state of Scheme 1 to the non-over-limit state, which reduces the network loss of power system, balances the power flow distribution of power system, and improves the feeder voltage level of power system. Therefore, the SOP, P2G equipment and lithium bromide absorption chiller play an important role in promoting WT and PV absorption, boosting the comprehensive utilization rate of RIES energy by reusing waste heat and afterheat of GT and GB, and lifting the economical operation of RIES. While the power balance of electricity and gas before and after optimization is shown in Figs. 7a, 7b, 8a and 8b, respectively.
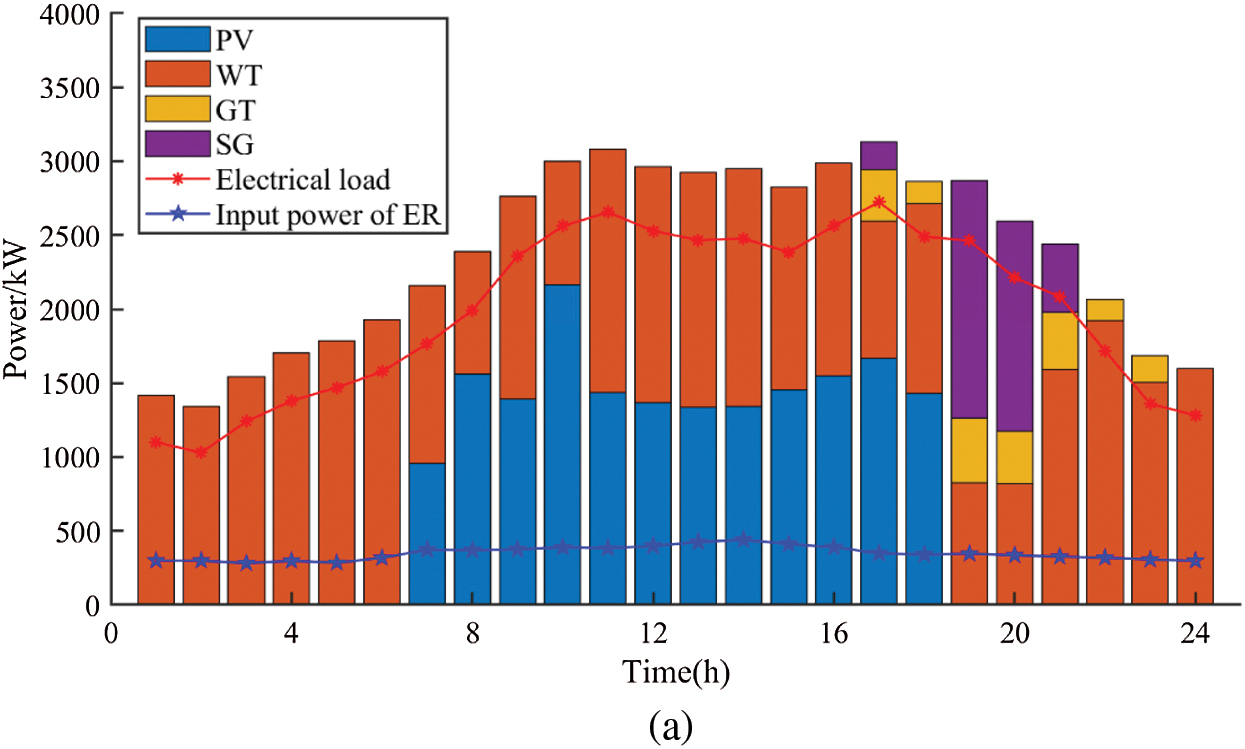
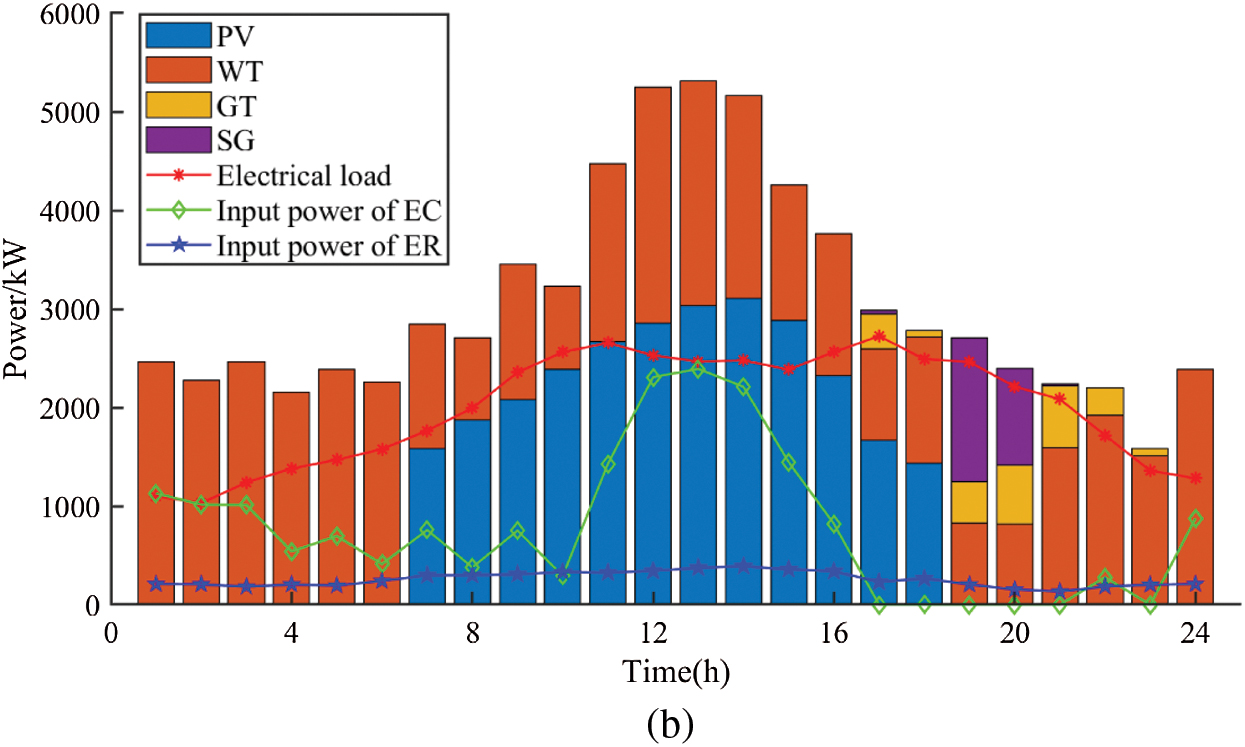
Figure 7: Electric power balance of RIES before and after optimization. (a) Before optimization (b) After optimization
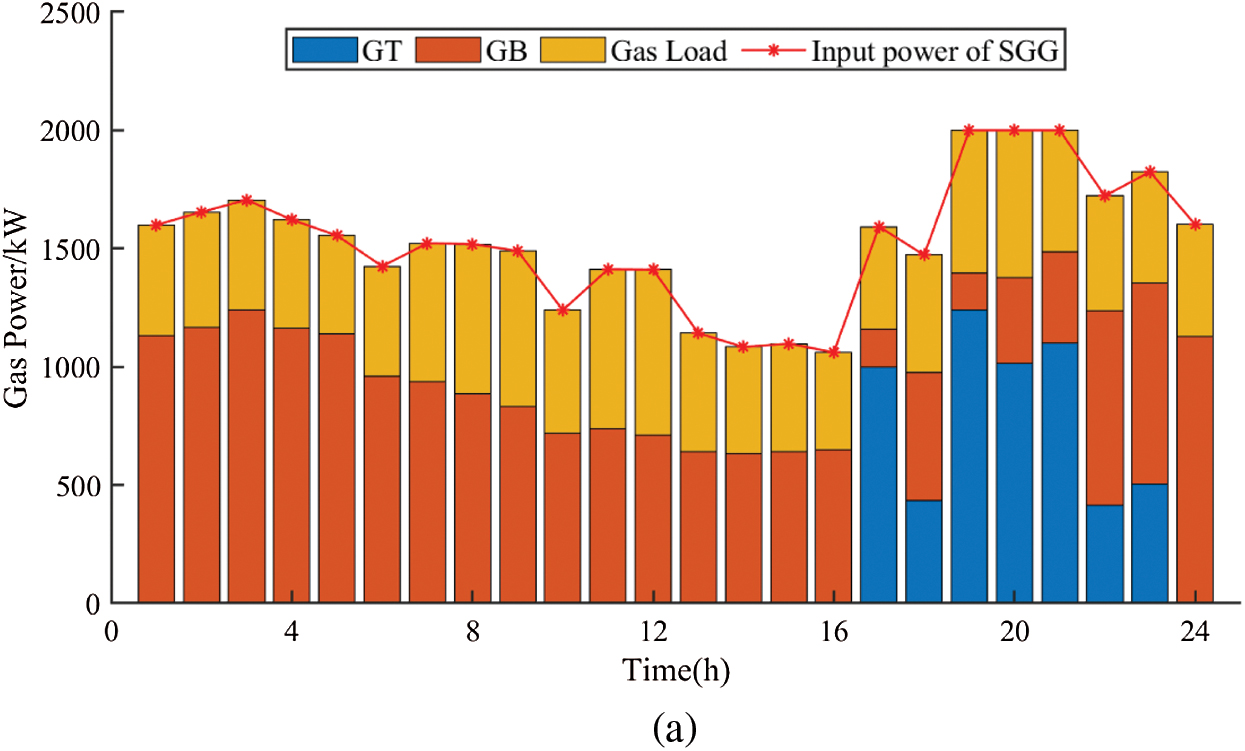
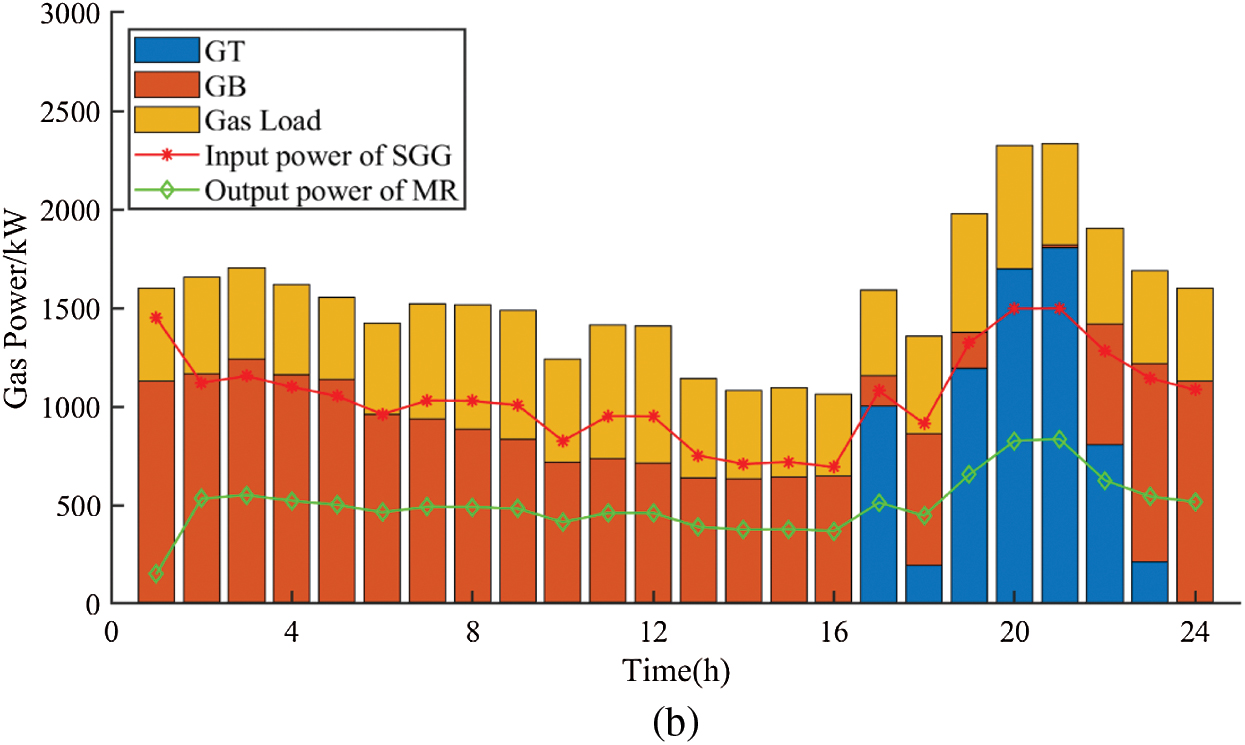
Figure 8: Gas power balance of RIES before and after optimization. (a) Before optimization (b) After optimization
4) Analysis of power network line loss:
By comparing the simulation results of the four schemes, the comprehensive utilization curves of WT and PV under different schemes are drawn as shown in Fig. 9. In this paper, P2G equipment is the most important factor to promote the consumption of wind power and photovoltaic, and adding SOP will only slightly promote the energy consumption of WT and PV due to the reduction of network losses. Therefore, the comprehensive utilization rates of wind power and photovoltaic are almost equal in Scheme 1 and Scheme 2. But after P2G equipment is added, it converts the excess electric energy of WT at night and PV during the daytime into natural gas which is easy to be stored and transmitted on a large scale, and can be inject into the natural gas network for preservation, then be reused or directly used through GT or GB during the peak hours of electricity and gas consumption. Thus, the comprehensive utilization rate of wind power and photovoltaic in Schemes 3 and 4 is 100% in each period. It can be seen from Fig. 9 that the comprehensive utilization rate of Schemes 1 and 2 is 100% except the peak period of power consumption of 17:00 to 23:00, while the comprehensive utilization rate of other periods is low. Consequently, it is verified that P2G equipment can effectively absorb large-scale wind power and photovoltaic, and realize the long-term and large-scale space-time translation of energy, which is an effective way to promote wind power consumption, reduce wind power and photovoltaic abandonment and fulfil the arbitrage of “high generation and low storage”.
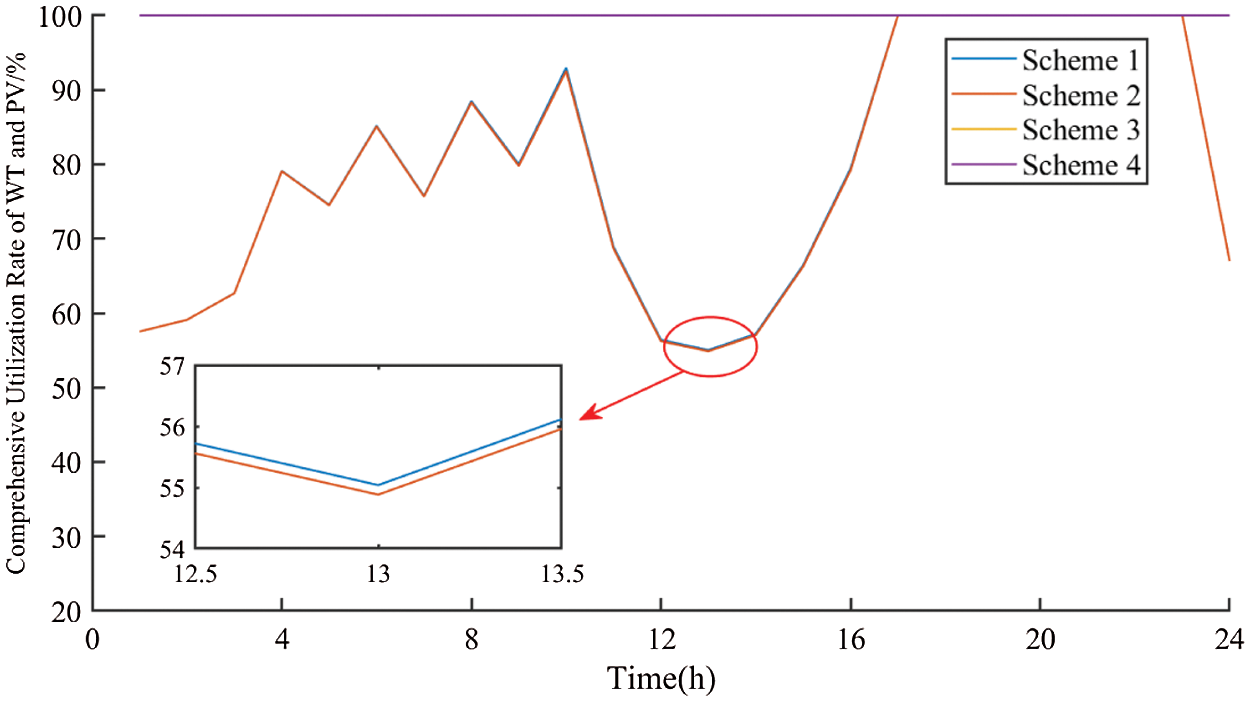
Figure 9: Comprehensive utilization rate of wind power and photovoltaic under different schemes
5) Analysis of power network line loss:
It can be seen from Table 1 that after SOP, P2G and LBAC are added in turn, the total operating cost of the system is reduced from RMB 15,345.05 to RMB 15,234.15, RMB 11,509.71 and RMB 10,787.27 in turn, and the cost is reduced by 0.72%, 24.99% and 29.70%, respectively. Besides, after adding LBAC, it reduces the cost of the system by 4.71% again through utilizing the waste heat and afterheat of the system, Therefore, it is verified that the combination of ER and LBAC can effectively enhance the comprehensive energy utilization rate and diminish the overall operating cost of the system.
In this paper, an optimal dispatch method of RIES combined cold, heat, gas and electricity with SOP and P2G is proposed. It aims at minimizing the sum of RIES operation cost and system power network line loss cost, SOP, P2G, and the combined cooling technology of ER and LBAC are introduced to optimize RIES multi-energy coupling operation. In addition, the optimal scheduling model of RIES with P2G is constructed. Then through linearization and cone relaxation, the original large-scale mixed integer nonlinear programming model of the power system is transmitted into mixed integer second-order cone programming model. Combined with the case study, the following conclusions are drawn:
1) The SOP connected to RIES can effectively reduce power system line loss, balance system power flow distribution and improve the safety of system operation. The proposed method is based on MISOCP, which can ensure global optimality, has moderate computation, and is suitable for efficient calculation of power flow of large-scale active distribution network with highly permeable RCE.
2) The EC, MR and HST in P2G equipment constitute the mutual coupling between electricity and gas. It effectively promoted the local consumption of wind power and photovoltaic, reduced the system operation cost and realized long-term and wide-range space-time translation of energy by converting the electric energy not fully consumed by WT and PV into H2 for storage and then converting it into natural gas through Sabatier reaction during peak load period and injecting it into RIES natural gas pipeline for GT/GB to use or direct use by natural gas users.
3) The combined cooling supply of ER and LBAC decreased the electricity demand and system operation cost, and improved the comprehensive utilization rate of energy.
Funding Statement: Project Supported by National Natural Science Foundation of China (51777193).
Conflicts of Interest: The authors declare that they have no conflicts of interest to report regarding the present study.
1. Liu, J., Tang, Q., Su, Y., Li, T., Wang, Y. et al. (2021). Economic analysis of solid oxide fuel cell and its role in carbon peak, carbon neutralization process. 4th International Conference on Energy, Electrical and Power Engineering, pp. 115–119. Chongqing, China. [Google Scholar]
2. Wang, K., Wang, W., Wang, L., Li, L. (2020). An improved SOC control strategy for electric vehicle hybrid energy storage systems. Energies, 13(20), 5297. DOI 10.3390/en13205297. [Google Scholar] [CrossRef]
3. Fu, G., Liu, J., Liu, J., Liu, R. (2018). Quantitative analysis of the feasibility of realizing the transformation to clean energy for china’s energy increment by 2035. International Conference on Power System Technology, pp. 510–515. Guangzhou, China. [Google Scholar]
4. Liu, D., Wang, L., Wang, W., Li, H., Liu, M. et al. (2021). Strategy of large-scale electric vehicles absorbing renewable energy abandoned electricity based on master-slave game. IEEE Access, 9, 92473–92482. DOI 10.1109/ACCESS.2021.3091725. [Google Scholar] [CrossRef]
5. Wang, K., Liu, C., Sun, J., Zhao, K., Wang, L. et al. (2021). State of charge estimation of composite energy storage systems with supercapacitors and lithium batteries. Complexity, 2021(1), 1–15. DOI 10.1155/2021/8816250. [Google Scholar] [CrossRef]
6. Wu, S., Xu, B., Lu, G., Tan, X., Zhao, Q. et al. (2018). Coordinated development evaluation on integrated energy systems in China. IEEE 2nd Conference on Energy Internet and Energy System Integration (EI2), pp. 1–6. Beijing, China. [Google Scholar]
7. Jiang, C., Ai, X. (2019). Study on optimal operation of integrated energy system considering new energy incentive mechanism. IEEE 3rd Conference on Energy Internet and Energy System Integration (EI2), pp. 301–306. Changsha, China: IEEE. [Google Scholar]
8. Zhang, D., Bai, J. H., Sun, X., You, P. (2020). Research on operational economics of the integrated energy system. 4th International Conference on Power and Energy Engineering, pp. 251–255. Xiamen, China: IEEE. [Google Scholar]
9. Wang, D., Liu, L., Jia, H., Wang, W., Zhi, Y. et al. (2018). Review of key problems related to integrated energy distribution systems. CSEE Journal of Power and Energy Systems, 4(2), 130–145. DOI 10.17775/CSEEJPES.2018.00570. [Google Scholar] [CrossRef]
10. Miao, B., Lin, J., Li, H., Liu, C., Li, B. et al. (2020). Day-ahead energy trading strategy of regional integrated energy system considering energy cascade utilization. IEEE Access, 8, 138021–138035. DOI 10.1109/ACCESS.2020.3007224. [Google Scholar] [CrossRef]
11. Zhu, X., Yang, J., Liu, Y., Liu, C., Miao, B. et al. (2019). Optimal scheduling method for a regional integrated energy system considering joint virtual energy storage. IEEE Access, 7, 138260–138272. DOI 10.1109/ACCESS.2019.2942198. [Google Scholar] [CrossRef]
12. Sun, Y., Zhang, B., Ge, L., Sidorov, D., Wang, J. et al. (2020). Day-ahead optimization schedule for gas-electric integrated energy system based on second-order cone programming. CSEE Journal of Power and Energy Systems, 6(1), 142–151. DOI 10.17775/CSEEJPES.2019.00860. [Google Scholar] [CrossRef]
13. Yang, H., Li, M., Jiang, Z., Zhang, P. (2020). Multi-time scale optimal scheduling of regional integrated energy systems considering integrated demand response. IEEE Access, 8, 5080–5090. DOI 10.1109/ACCESS.2019.2963463. [Google Scholar] [CrossRef]
14. Shao, C., Ding, Y., Siano, P., Song, Y. (2021). Optimal scheduling of the integrated electricity and natural gas systems considering the integrated demand response of energy hubs. IEEE Systems Journal, 15(3), 4545–4553. DOI 10.1109/JSYST.2020.3020063. [Google Scholar] [CrossRef]
15. Bahrami, S., Sheikhi, A. (2016). From demand response in smart grid toward integrated demand response in smart energy hub. IEEE Transactions on Smart Grid, 7(2), 650–658. DOI 10.1109/TSG.2015.2464374. [Google Scholar] [CrossRef]
16. Xiao, H., Pei, W., Dong, Z., Kong, L. (2018). Bi-level planning for integrated energy systems incorporating demand response and energy storage under uncertain environments using novel metamodel. CSEE Journal of Power and Energy Systems, 4(2), 155–167. DOI 10.17775/CSEEJPES.2017.01260. [Google Scholar] [CrossRef]
17. Bloemink, J. M., Green, T. C. (2013). Benefits of distribution-level power electronics for supporting distributed generation growth. IEEE Transactions on Power Delivery, 28(2), 911–919. DOI 10.1109/TPWRD.2012.2232313. [Google Scholar] [CrossRef]
18. Yang, X., Xu, C., Zhang, Y., Yao, W., Wen, J. et al. (2021). Real-time coordinated scheduling for ADNs with soft open points and charging stations. IEEE Transactions on Power Systems, 36(6), 5486–5499. DOI 10.1109/TPWRS.2021.3070036. [Google Scholar] [CrossRef]
19. Yang, X., Xu, C., He, H., Yao, W., Wen, J. et al. (2021). Flexibility provisions in active distribution networks with uncertainties. IEEE Transactions on Sustainable Energy, 12(1), 553–567. DOI 10.1109/TSTE.2020.3012416. [Google Scholar] [CrossRef]
20. Wang, J., Zhou, N., Chung, C. Y., Wang, Q. (2020). Coordinated planning of converter-based DG units and soft open points incorporating active management in unbalanced distribution networks. IEEE Transactions on Sustainable Energy, 11(3), 2015–2027. DOI 10.1109/TSTE.2019.2950168. [Google Scholar] [CrossRef]
21. Li, P., Ji, H., Wang, C., Zhao, J., Song, G. et al. (2017). Coordinated control method of voltage and reactive power for active distribution networks based on soft open point. IEEE Transactions on Sustainable Energy, 8(4), 1430–1442. DOI 10.1109/TSTE.2017.2686009. [Google Scholar] [CrossRef]
22. Lofberg, J. (2004). YALMIP: A toolbox for modeling and optimization in MATLAB. IEEE International Conference on Robotics and Automation (IEEE Cat. No. 04CH37508), pp. 284–289. Taipei, Taiwan. DOI 10.1109/CACSD.2004.1393890. [Google Scholar] [CrossRef]
23. Baran, M. E., Wu, F. F. (1989). Network reconfiguration in distribution systems for loss reduction and load balancing. IEEE Transactions on Power Delivery, 4(2), 1401–1407. DOI 10.1109/61.25627. [Google Scholar] [CrossRef]
24. Džafić, I., Jabr, R. A., Halilovic, E., Pal, B. C. (2014). A sensitivity approach to model local voltage controllers in distribution networks. IEEE Transactions on Power Systems, 29(3), 1419–1428. DOI 10.1109/TPWRS.2013.2290813. [Google Scholar] [CrossRef]
25. Feng, X., Li, Q., Wang, K. (2021). Waste plastic triboelectric nanogenerators using recycled plastic bags for power generation. ACS Applied Materials & Interfaces, 13(1), 400–410. DOI 10.1021/acsami.0c16489. [Google Scholar] [CrossRef]
26. Hua, Y., Wang, N., Zhao, K. (2021). Simultaneous unknown input and state estimation for the linear system with a rank-deficient distribution matrix. Mathematical Problems in Engineering, 2021(12), 1–11. DOI 10.1155/2021/6693690. [Google Scholar] [CrossRef]
27. Zheng, Z., Zhao, P., Zhou, C., Duan, H., Zheng, S. et al. (2020). The optimized configuration of four-terminal soft open point of active distribution network considering the influence of power supply capacity. IEEE Sustainable Power and Energy Conference, pp. 541–546. Chengdu, China. [Google Scholar]
28. Liu, C., Li, Q., Wang, K. (2021). State-of-charge estimation and remaining useful life prediction of supercapacitors. Renewable and Sustainable Energy Reviews, 150(2), 111408. DOI 10.1016/j.rser.2021.111408. [Google Scholar] [CrossRef]
29. Xia, G., Huang, Y., Li, F., Wang, L., Pang, J. et al. (2020). A thermally flexible and multi-site tactile sensor for remote 3D dynamic sensing imaging. Frontiers of Chemical Science and Engineering, 14(6), 1039–1051. DOI 10.1007/s11705-019-1901-5. [Google Scholar] [CrossRef]
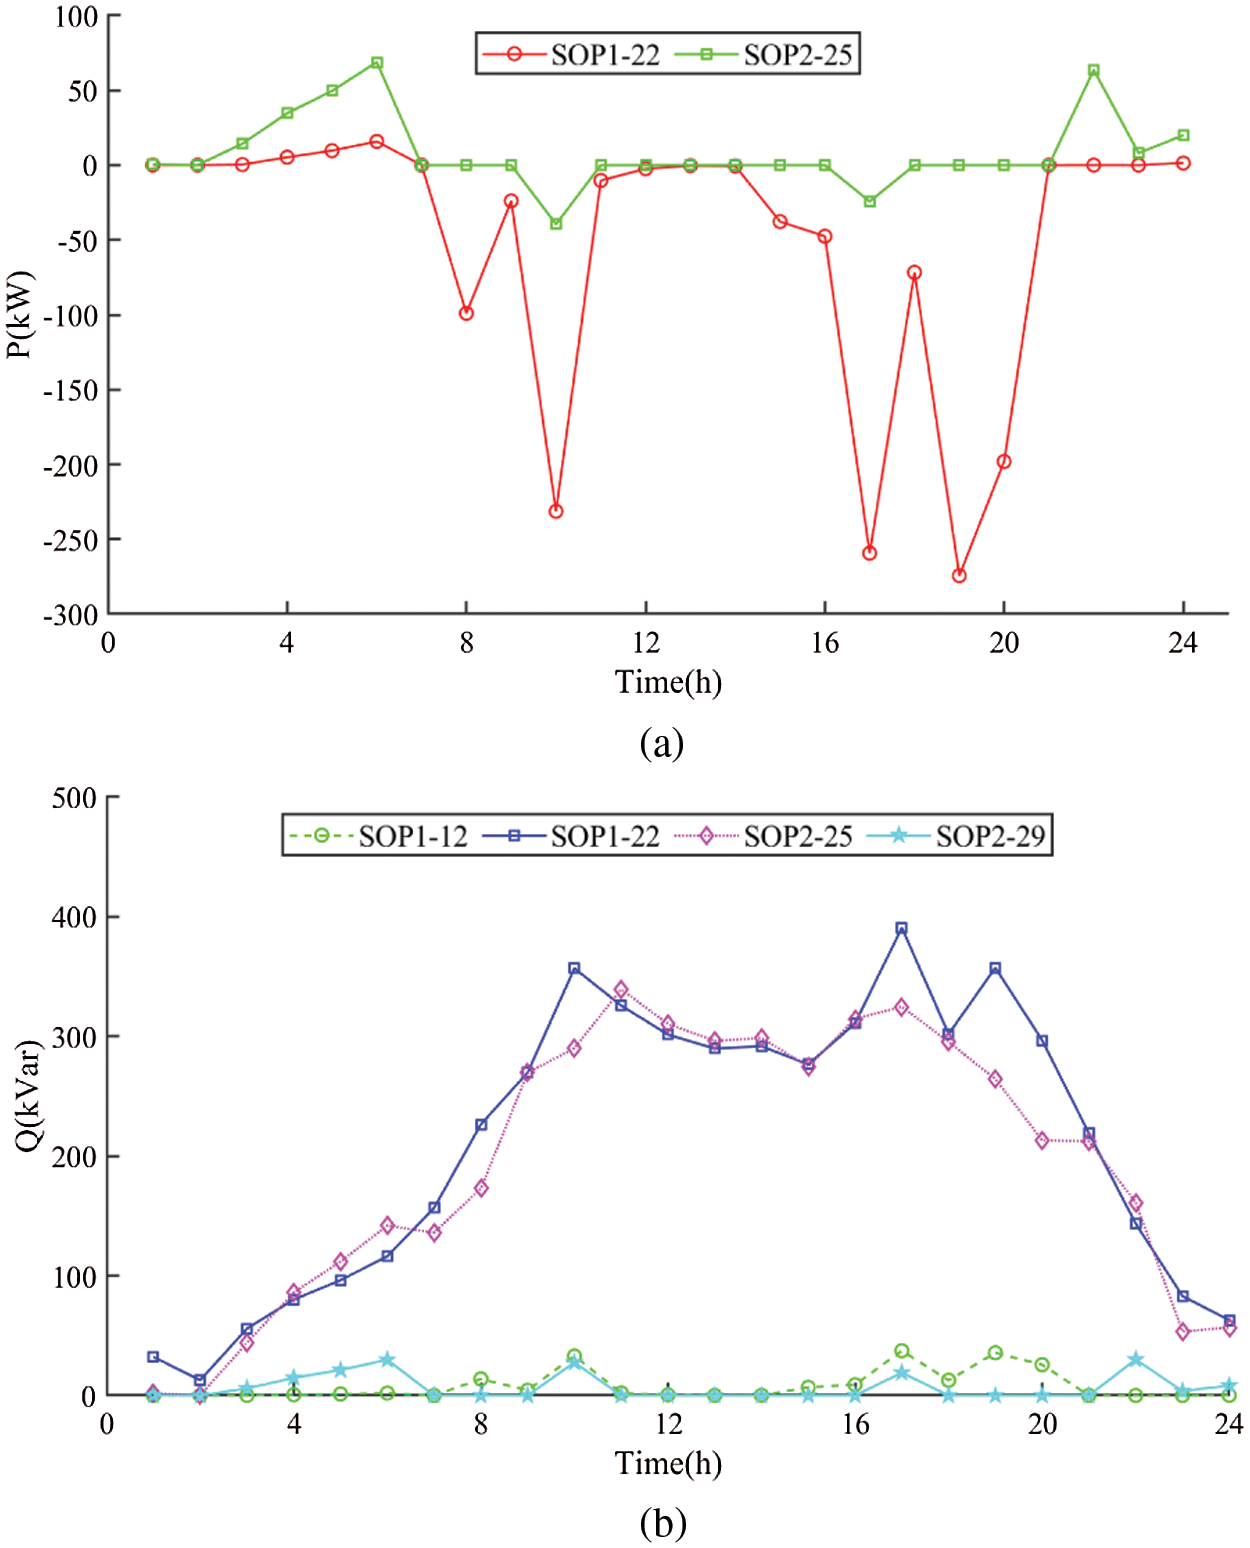
Figure A1: Scheduling strategies of SOP in Scheme 2. (a) Active power transmission of SOP (b) Reactive power compensation of SOP
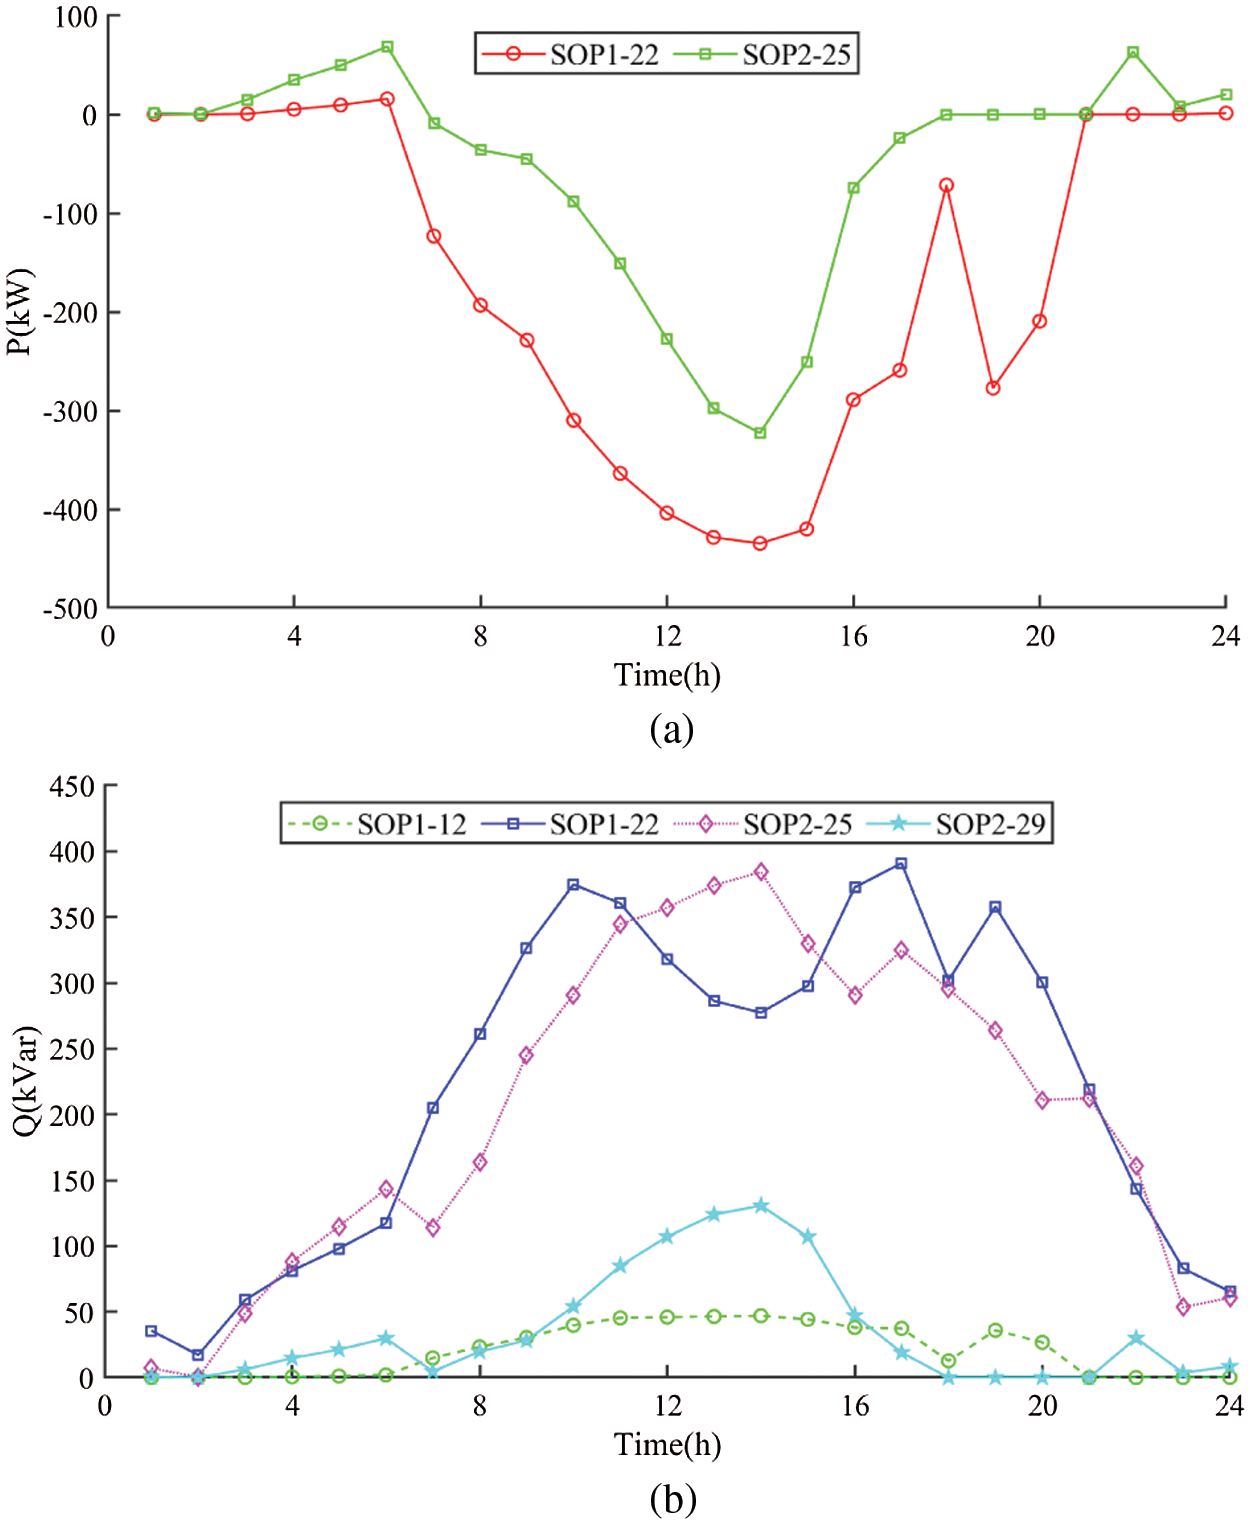
Figure A2: Scheduling strategies of SOP in Scheme 3. (a) Active power transmission of SOP (b) Reactive power compensation of SOP
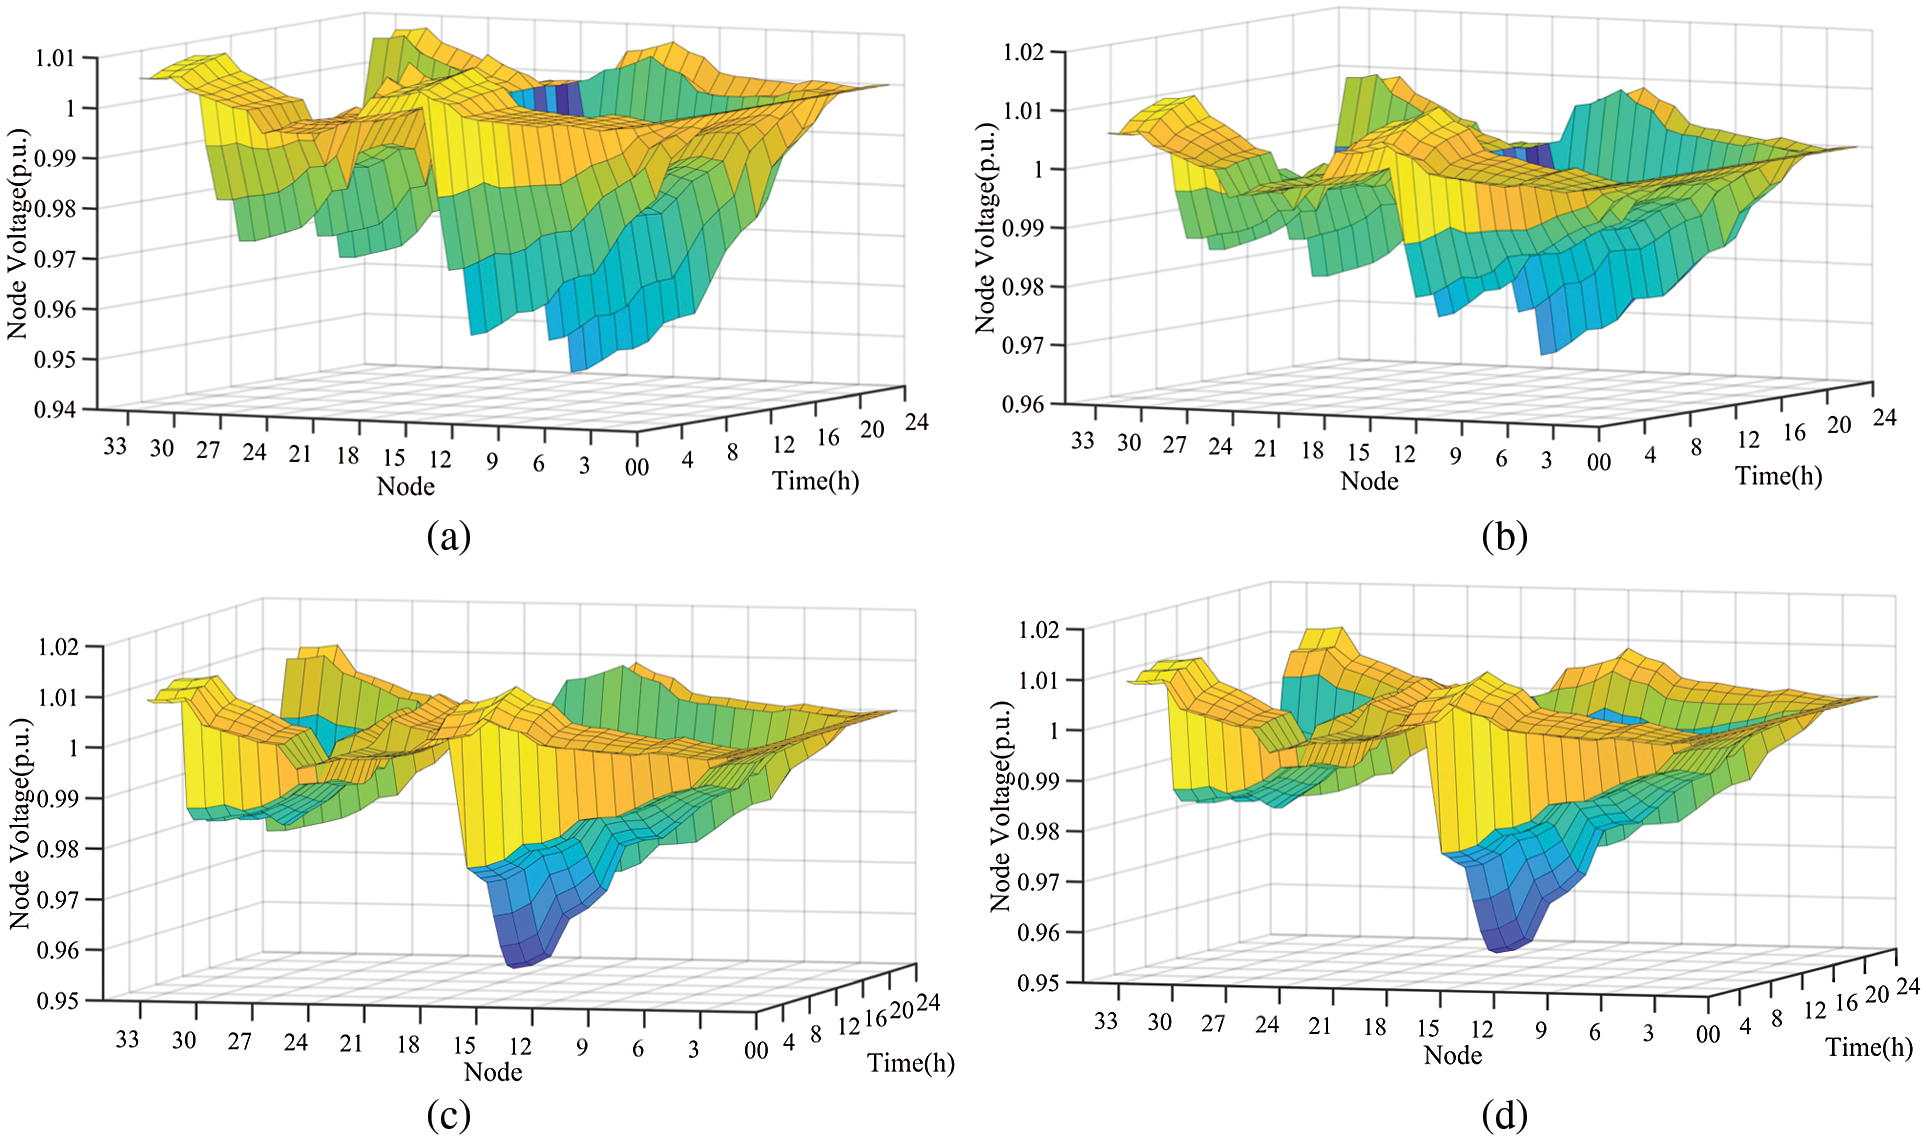
Figure A3: Voltage distribution diagram of nodes under different scenarios. (a) Voltage distribution diagram of nodes in Scheme 1 (b) Voltage distribution diagram of nodes in Scheme 2 (c) Voltage distribution diagram of nodes in Scheme 3 (d) Voltage distribution diagram of nodes in Scheme 4
 | This work is licensed under a Creative Commons Attribution 4.0 International License, which permits unrestricted use, distribution, and reproduction in any medium, provided the original work is properly cited. |