| Computer Modeling in Engineering & Sciences |
DOI: 10.32604/cmes.2022.019671
ARTICLE
Fractal Dimension Analysis Based Aging State Assessment of Insulating Paper with Surface Microscopic Images
1School of New Energy & Power Engineering, Lanzhou Jiaotong University, Lanzhou, 730070, China
2School of Automatic & Electrical Engineering, Lanzhou Jiaotong University, Lanzhou, 730070, China
*Corresponding Author: Shuaibing Li. Email: shuaibingli@mail.lzjtu.cn
Received: 09 October 2021; Accepted: 09 November 2021
Abstract: The insulating paper of the transformer is affected by many factors during the operation, meanwhile, the surface texture of the paper is easy to change. To explore the relationship between the aging state and surface texture change of insulating paper, firstly, the thermal aging experiment of insulating paper is carried out, and the insulating paper samples with different aging times are obtained. After then, the images of the aged insulating paper samples are collected and pre-processed. The pre-processing effect is verified by constructing and calculating the gray surface of the sample. Secondly, the texture features of the insulating paper image are extracted by box dimension and multifractal spectrum. Based on that, the extreme learning machine (ELM) is taken as the classification tool with texture features and aging time as the input and output, to train the algorithm and construct the corresponding relationship between the texture feature and the aging time. After then, the insulating paper with unknown aging time is predicted with a trained ELM algorithm. The numerical test results show that the texture features extracted from the fractal dimension of the micro image can effectively characterize the aging state of insulating paper, the average accuracy can reach 91.6%. It proves that the fractal dimension theory can be utilized for assessing the aging state of insulating paper for onsite applications.
Keywords: Insulating paper; aging state; fractal dimension; box dimension; multifractal spectrum
The oil-immersed transformer is the key equipment of the power distribution system. The normal operation of the transformer is conducive to the safety and stability of the power grid, and the transformer insulation system is the key to ensuring its normal operation [1,2]. For the insulation system, a long-standing problem is to accurately estimate the aging state of insulating paper, which has attracted extensive attention in recent years. Since the direct sample of insulating paper in actual maintenance is not easy to conduct, indirect, nonintrusive, and non-destructive inspection methods become the main streams for insulating paper state assessment in this field [3,4]. The image processing technology, as one of the non-destructive inspection methods, has made great progress with the development of computer science and digital signal processing technology and has been widely used in many fields for non-destructive testing [5–7]. Moreover, digital image processing techniques used in the textile and paper industry have gradually become one of the tools to judge the aging state of insulating paper in the maintenance link [8,9]. These beneficial attempts provide a good research idea for online detection and condition evaluation of insulating paper of large power transformers.
In the field of image processing, the fractal theory has received a lot of attention since it can measure the complexity of image and surface irregularity. The fractal dimension is often used as an important feature of image texture in image edge detection, segmentation, and recognition [10]. It has been widely used in the fields of structural analysis, geological mapping, machining, and medical CT [11–14]. In these fields, the following studies are very representative. Gong et al. [15] analyzed the influence of bedding and loading rate on the fractal characteristics of dynamic crack propagation in coal by combining image processing method and fractal dimension. Zou et al. [16] summarized the remote sensing image discrimination technology based on fractal theory and considered that it is feasible to classify remote sensing images by using fractal dimension characteristics. Based on fractal theory, Huang [17] extracted the texture image of the Dexing Mining Area in Jiangxi Province by using the double blanket coverage model and differential box dimension method and analyzed and studied the land use in this area from 1998 to 2018. An et al. [18] explored the calculation method of fractal dimension of the three-dimensional rough surface and believed that the fractal dimension of three-dimensional rough surface can be obtained more accurately by using wavelet transform, which provides a parameter basis for the construction of fractal contact model of a rough surface. Sun [19] took the fractal dimension as the texture feature parameter, extracted Hurst index H by using the fractal Brownian motion model, and then segmented the lung CT image by using the cumulative histogram of H distribution, to obtain a better effect of tumor region recognition. The above research provides a reference and new idea for the application of fractal theory in the condition evaluation of the insulating paper.
As common sense, cellulose in the insulating paper can be aged and become brittle with long-time high-temperature heating, the effect of electric fields, moisture deterioration, and in-oil acid reaction during operation [20]. The cracking of cellulose can directly lead to the change of paper surface texture, which corresponds to the variant of surface irregularity and image complexity. In this sense, the fractal theory is an effective tool to characterize the change of texture. The fractal theory is one of the effective choices to judge the condition of the cellulose or the insulating paper. Therefore, this paper tries to use the fractal theory for assessing the condition of insulating paper. Given the usefulness of image sensing for insulating paper inspection, the ABB and a Chinese power company tries to invent a computer vision system to inspect the inner condition of the transformer by collecting surface images of the transformer winding [21]. Such attempts can be combined with the method proposed in this paper, which further helps the assets management department in the power company to detect and evaluate the insulating paper condition in an onsite application.
The rest of this paper is organized as follows: In Section 2, details for the experimental setup of insulating paper sample preparation and thermal aging testing are provided. In Section 3, the insulating paper images at different aging stages are obtained through the thermal aging test, and a pre-processing of the surface images with histogram equalization is carried out. The pre-processing effect is verified by constructing the gray surface of typical images picked from different stages. With these treated microscopic images of insulating paper surface available, feature extraction and characterizing of insulating paper with fractal dimension is conducted in Section 4, where the singularity index- multifractal spectrum pairs along with the aging time is calculated. In Section 5, a numerical test with the extreme learning machine (ELM) is conducted, which is used for verifying the effectiveness of using fractal dimension, multi-fraction spectral width, and the spectral difference for characterizing the aging condition of insulating paper. The conclusions are finally drawn in Section 6.
2 Experimental Setup and Preparation of Insulating Paper Sample
Since the main factor affecting the aging of insulating paper is temperature, a thermal aging test of insulating paper is implemented. In this paper, the thermal aging experiment is considered for two reasons: one is that it can be relatively close to the aging process of insulating paper, and the other is that it can see the surface changes of insulating paper at different aging stages. The thermal aging experiment is conducted on an accelerated aging test platform for insulating paper with a vacuum aging oven, with the temperature adjustable from 0~260°C, and several wild-mouth bottles.
The commonly used kraft paper in transformers is selected for the experiment, which is composed of 90% cellulose, 6–7% hemicellulose, and 3–4% lignin. The liquid insulating dielectric selects the Karamay #25 transformer oil [22]. Details of the material are provided in Table 1.
Considering that the initial water content in insulating paper and insulating oil will affect the insulation aging effect, the transformer insulating oil and insulating paper are pre-treated respectively according to ISO 5640-4:2016 [23]. The kraft paper is firstly cut into several strips with a specification of 10 in length and 1.5 cm in width and then put into a vacuum oven at 100°C/50 Pa for 48 h to remove moisture. The pre-treated paper strips are convenient for putting into the wide mouth bottle. The transformer oil is also subjected to a pre-treated process before use, which is filtered and degassed firstly. After degassing, the insulating oil is dried in a vacuum drying oven at 40°C, and its moisture content is measured regularly to make its moisture content less than 10 ppm.
After pre-treatment, the insulating paper and insulation oil is put into the wide mouth bottle with a ratio of 1:20, and nitrogen is filled to seal the bottle. After then, the wide mouth bottles with oil and paper samples are in the oven with a temperature of 130°C for 4, 8, 12, 16, and 20 d, respectively.
Once the thermal aging test is finished, a degreasing process is conducted. The wide-mouth bottles are taken out from the oven and cooled to room temperature (20°C). Then, the insulating paper strips are taken out for surface degreasing. Here, according to IEC 60814-2014, we use volatile n-heptane to remove the residual insulating oil on the surface of the paper tape and then stand for about 30 min to volatilize n-heptane to complete the degreasing process [24].
3 Image Acquisition and Pre-Processing of Insulating Paper
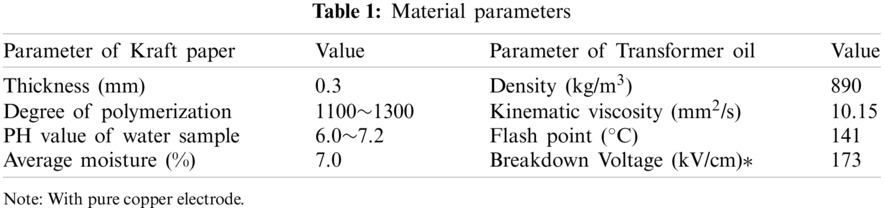
With insulating papers aged with different degrees available, the surface texture images of the insulating paper sample surface can be readily captured by using the optical microscope (EM-06). After several times of comparisons, the 200 times magnification is selected for image acquisition as the collected sample surface texture image is the clearest when the brightness of the light source is adjusted to the highest level. Fig. 1 shows the surface microscopy images collected from the insulating paper samples at different aging stages. It can be observed from the figure that with the increasing aging time, the carbonization degree of the insulating paper sample surface is increasing, the texture change degree is becoming more and more complex. However, attributed to the interference of the background, the surface texture change of the paper sample is hard to distinguish by naked eye recognition, further processing will be implemented to the images for a better view.
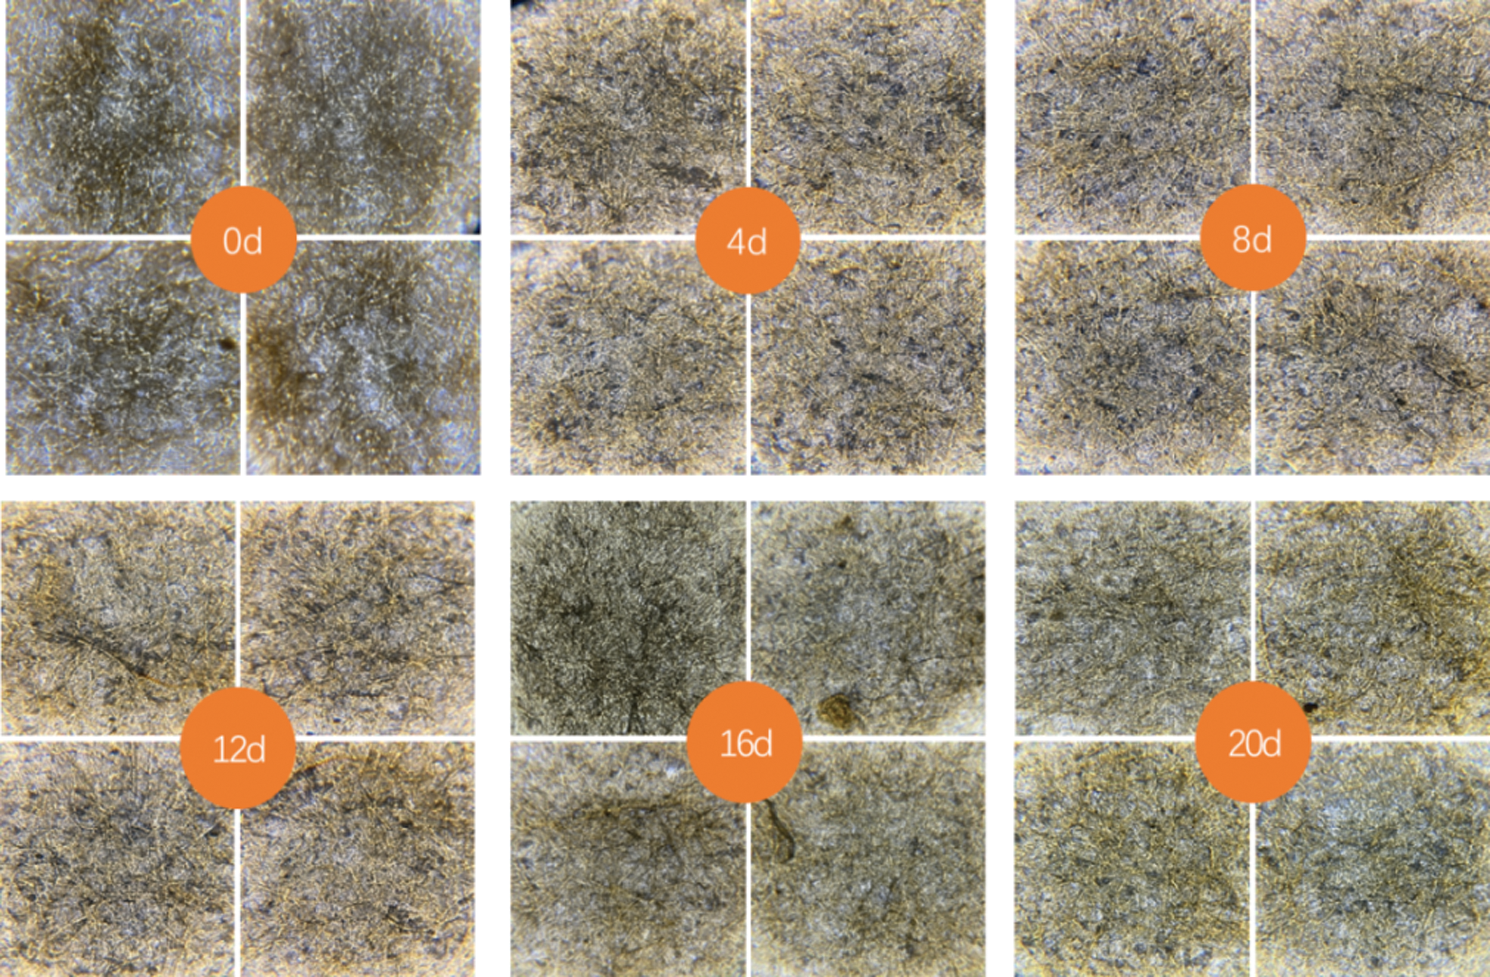
Figure 1: Surface microscopic images of insulating paper with different aging times
After obtaining the sample as shown in Fig. 1, an obvious problem is that the change of texture with aging time is not apparent. To solve that problem, the original sample images are converted into a serial of gray images, so that the RGB color images can be converted into gray images with only black and white colors. As a further step, these gray images will be implemented with a normalization. After that, the pixel value of the gray images can be distributed among 0~255, which avoids insufficient image contrast to a large extent. As the last step, histogram equalization is carried out to enhance the local contrast of the gray images without influencing the overall contrast.
Let the image be f(x, y), and the gray level of the image varies from the minimum pole Nmin to the maximum pole Ng. The gray normalization result Nnor is [25]:
After completing gray normalization, the image is processed with a histogram equalization function statement, and the resulting image is shown in Fig. 2. The processed image can better show the texture changes of the sample surface.
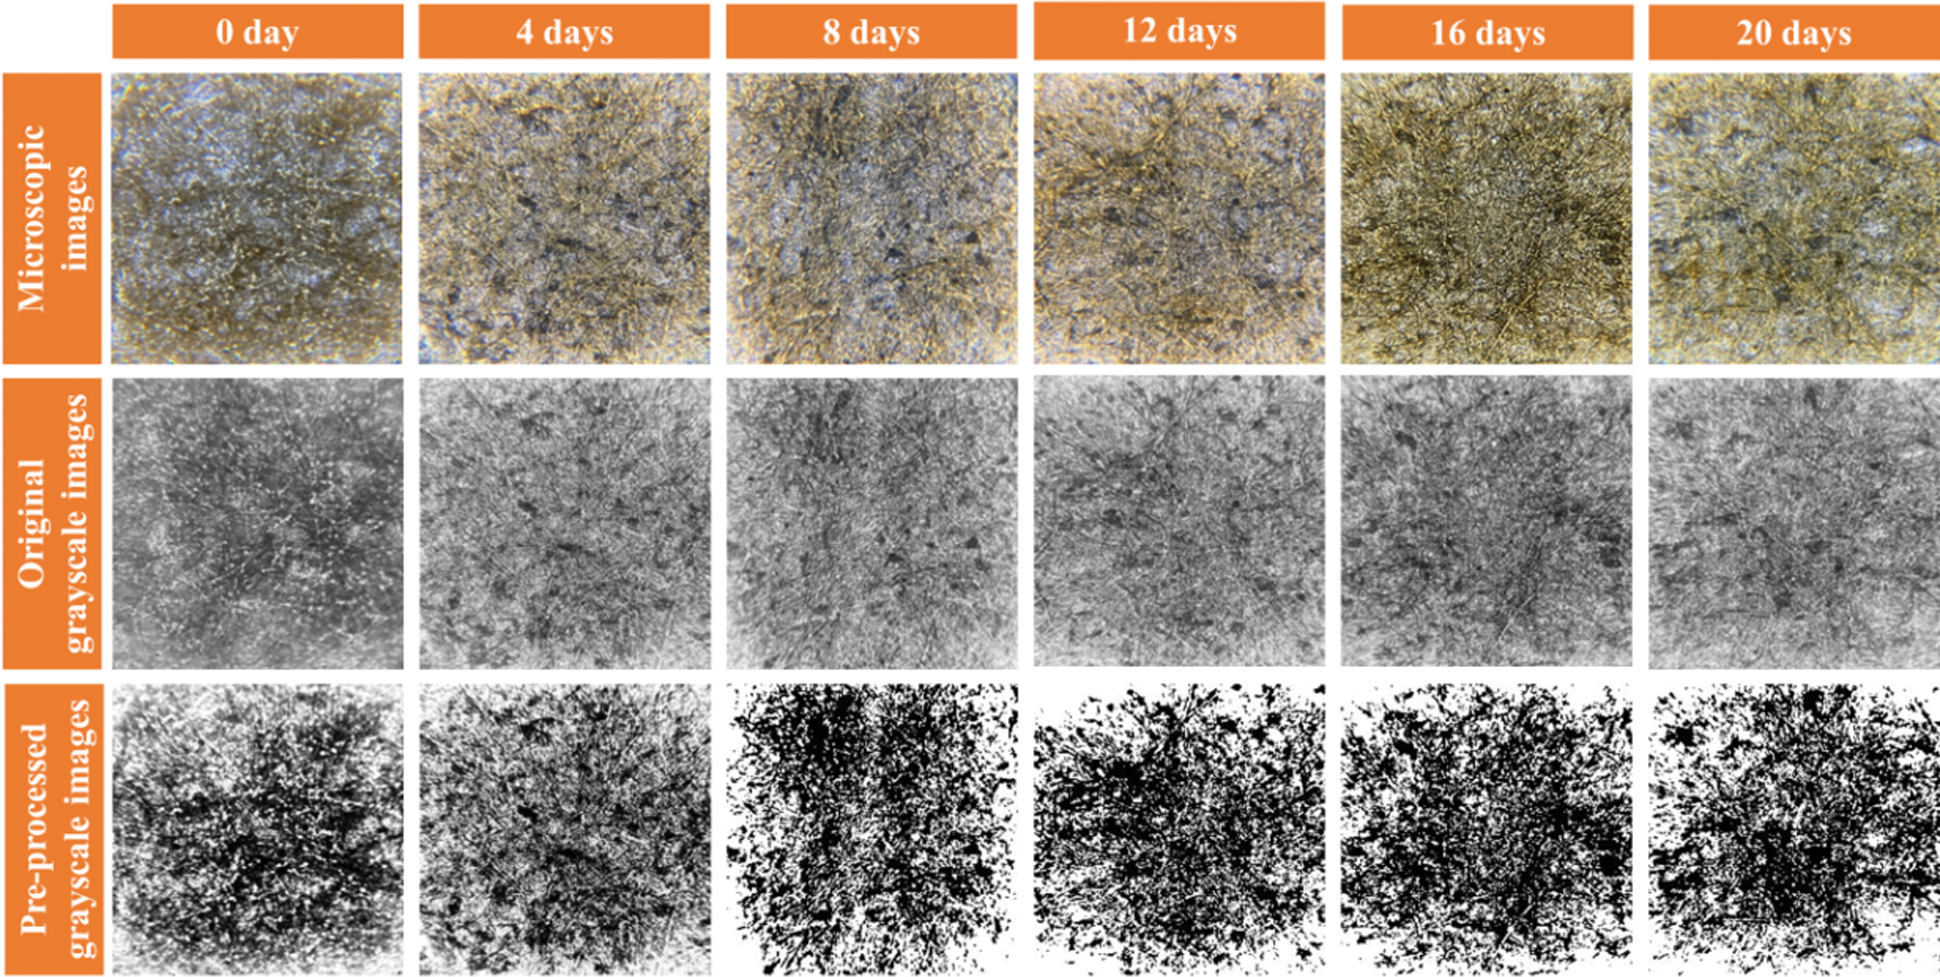
Figure 2: Surface microscopic images of insulating paper before and after treatment
3.3 Gray-Scale Surface Construction
In the field of image processing, texture roughness is an important visual feature of an image, which is of great significance for image segmentation, recognition, and classification. Pentland [26] points out that most natural objects are fractal in space, and the gray images of these objects are also fractal. This provides a theoretical basis for the application of the fractal model in image processing and analysis. Texture roughness intuitively uses image gray-scale surface to describe image complexity, and most of the numerical embodiment uses fractal dimension for image description.
For an image, the gray-scale surface can be formed with two parts: one is the position (x, y) of the image pixel, which constitutes the x-o-y coordinate plane, while another is the gray value of the pixel, which can be used for constructing the z-axis. Therefore, a gray-scale surface with image pixel and the corresponding pixel can be readily obtained. Fig. 3 shows the gray-scale surface of the insulating paper samples with different states.
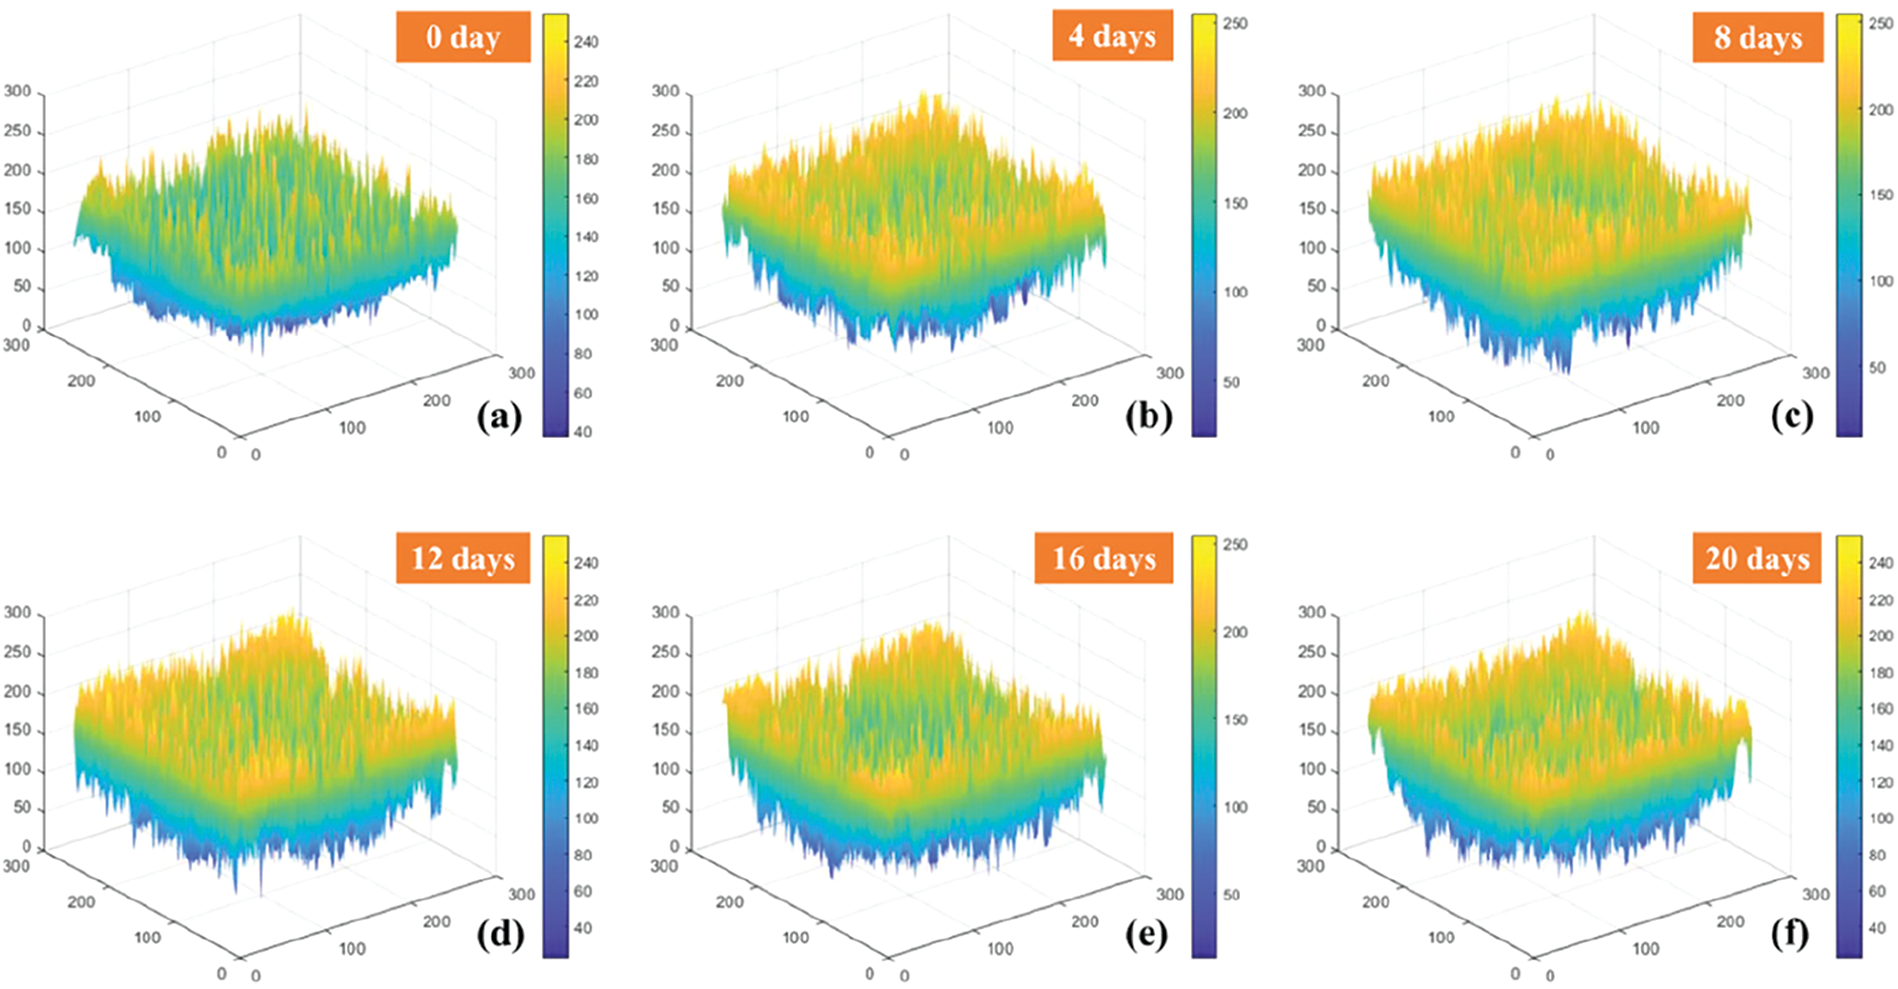
Figure 3: Gray-scale surface of the insulating paper samples with different aging times
In Fig. 3, the transition from the blue part to the yellow part of the gray-scale surface represents the gray value varies from small to large. A yellow “peak” and blue “valley” can be found on each grayscale surface. This surface, in essence, is a reflection of texture complexity. Generally, the stratification of yellow and blue parts will be more clear as the texture is more complex, and the “peak” and “valley” of the surface will be more prominent. Along with the aging time, the density of the yellow peaks and the blue valleys of the gray-scale surface become more and more. However, for feature extraction from the gray-scale surface, the distribution of the peaks and valleys is very irregular, which will make it hard to extract accurate features. That is why the original gray-scale images are implemented with a pre-treatment using histogram equalization and normalization. After pre-treatment, the distribution of the peaks and valleys looks more uniform, as shown in Fig. 4. By comparison, it can be seen that the yellow peaks and blue valleys after treatment are more prominent than those before treatment. From the numerical point of view, taking the gray-scale surface of the unaged insulating paper sample in Figs. 3a and 4a as an example, the gray value of the image before processing is concentrated in the range of gray value 80~200, while the gray value of the image after processing is evenly distributed in the range of gray value 0~250. The comparison result proves that the texture contrast is improved after treatment.
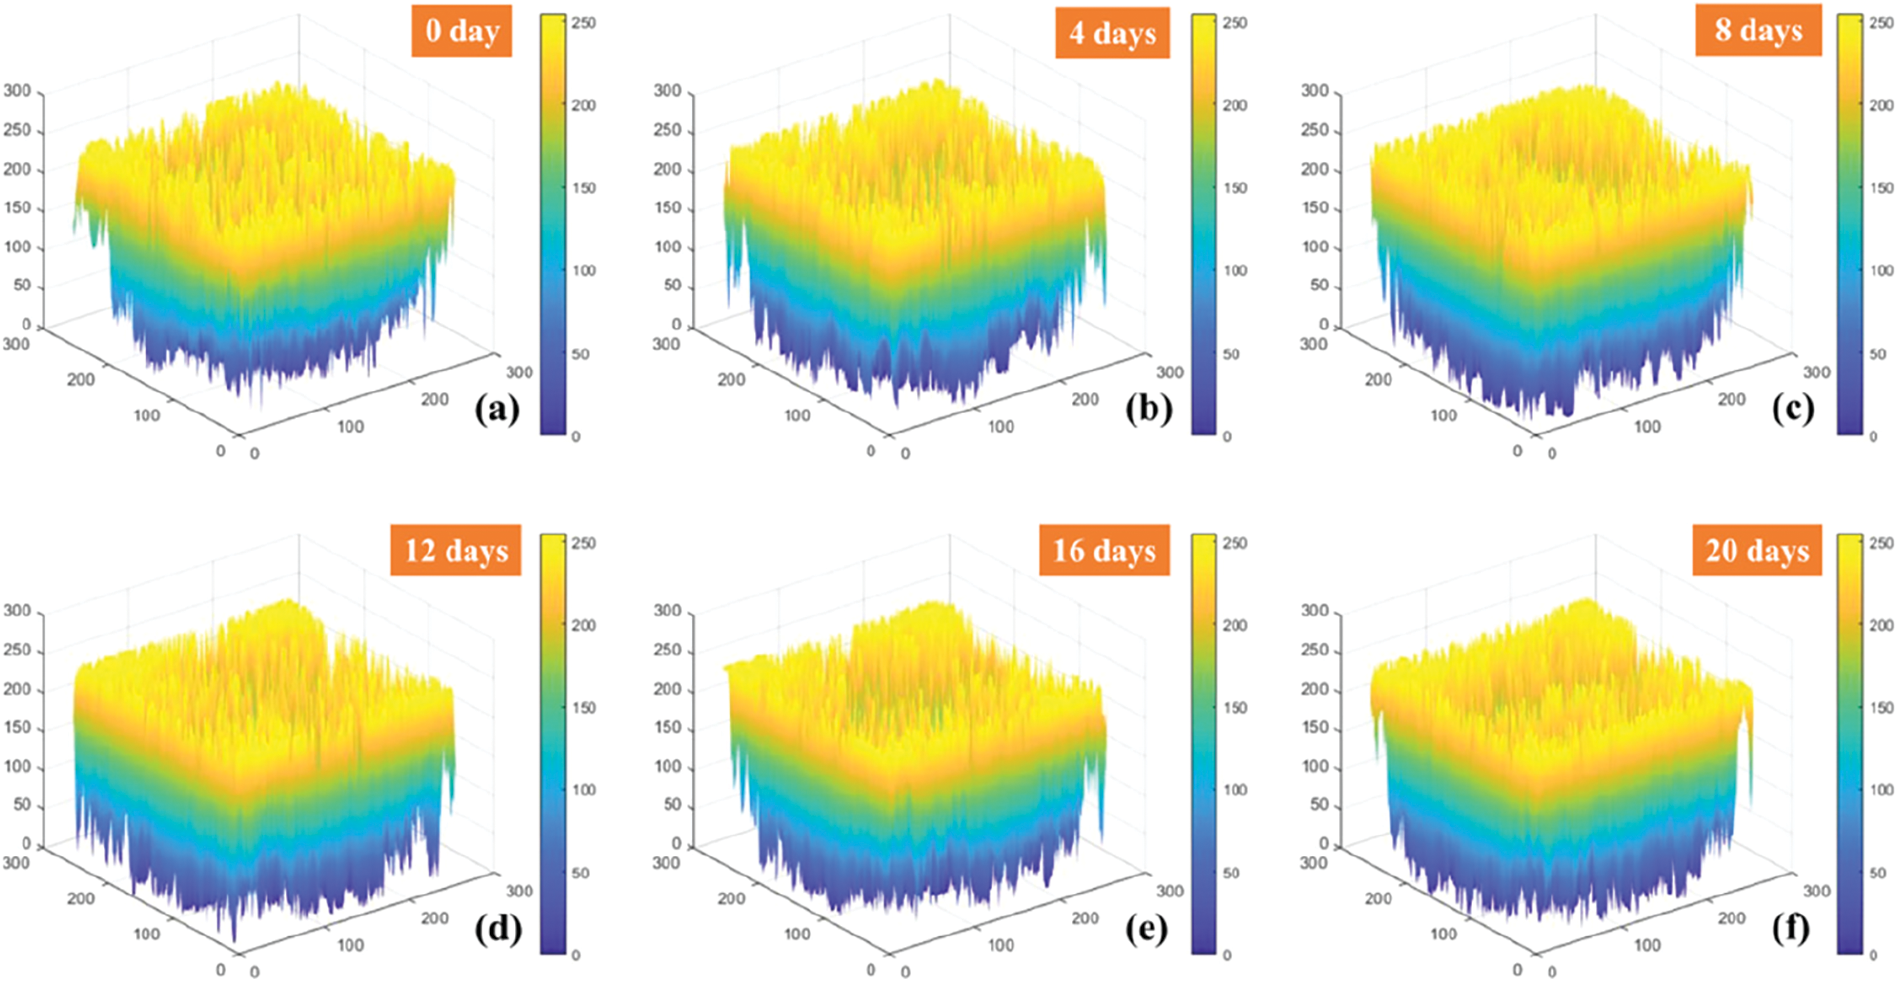
Figure 4: Gray-scale surface of the insulating paper treated with histogram equalization
4 Feature Extraction and Characterizing of Insulating Paper with Fractal Theory
The fractal theory was proposed by Mandelbrot in 1975 [27], to describe the self-similarity of complex natural scenery. He proposed to use fractal dimension to describe the irregularity of scenery. The fractal dimension measures the roughness of the image, that is, to measure the complexity of the gray-scale surface of the image. The higher the fractal dimension, the more complex the image surface and the coarser the image is. Later, Hausdorff proposed that fractal dimension is used to quantitatively describe the spatial complexity of image surface, and can quantitatively describe the texture characteristics of targets [28]. He created the concepts of measure and dimension in fractal theory. The Hausdorff measure extends the concept of length, area, and volume as described in Euclidean geometry, which can be described as objects that are not limited to Euclidean geometry or fractal.
Define Hs(f) as an s-dimensional Hausdorff measure of F, with the change of s, there is an s0 that changes Hs(F) from ∞ to 0, which can be denoted as the Hausdorff dimension dH (F) [29]:
The Hausdorff dimension describes the complexity and space occupation of an irregular fractal, which is the mathematical basis of other forms of fractal dimension [30]. However, the calculation of the Hausdorff dimension is relatively complex. Therefore, the calculated values of other dimension methods are usually selected as the estimated values of the Hausdorff dimension, e.g., box dimension.
The fractal dimension, based on box-counting, can be measured by calculating the minimum number of boxes covering the image surface [31], which was proposed by Gangpain and Roques Carmes in 1986. It is generally believed that surfaces with fractal characteristics have a self-similarity.
When the bounded set A in n-dimensional Euclidean space can be expressed as the union of its own Nr subsets that do not cover each other, then A is self-similar. Then, the fractal similarity dimension D of A is given by the following relationship:
where r is the scale factor in all coordinate directions, and Nr is the number of uncovering subsets of bounded set A.
For the gray-scale image, the two-dimensional image can be regarded as a surface in a three-dimensional space, expressed as {x, y, f (x, y)}, with f (x, y) denoting the gray-scale value of the two-dimensional image (x, y). In this way, the gray-scale change of the image is reflected in the roughness of the surface, and the dimension is the fractal dimension of the image by using different scales to measure the surface. In [32,33], an accurate and convenient algorithm called differential box-counting (DBC) is proposed for fractal dimension calculation, the main principles are as follows.
Divide the image with an M × M size into L × L sub-blocks, set r = L/M, and treat the two-dimensional image as the gray value of a surface in the three-dimensional space {x, y, f (x, y)}, f (x, y), then the X and Y planes are divided into many L × L grids. Each grid has a column of L × L × h boxes, where h is the height of a single box. Assuming that the total gray-scale level is G, h = L × G/M. If the minimum and maximum values of the image gray-scale in the (i, j)-th grid locate in the k-th and l-th boxes, respectively, then:
where nr(i, j) is the number of boxes required to cover the image in the (i, j)-th grid, l and k stand for the box number.
The number of boxes required to cover the entire image Nr can be calculated as follows:
While the fractal dimension is:
By selecting a set of L, calculating Nr and the linear regression result of point pairs {log(1/r), log(Nr)}, the obtained slope can be taken as the fractal dimension D.
The results of the differential box-counting method of insulating paper sample images are shown in Table 2 and Fig. 5.
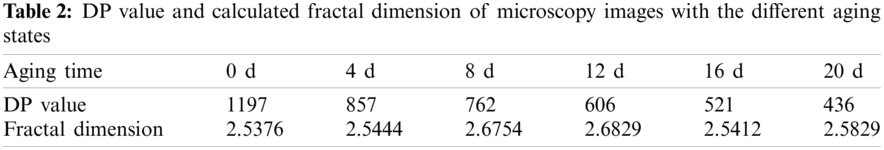
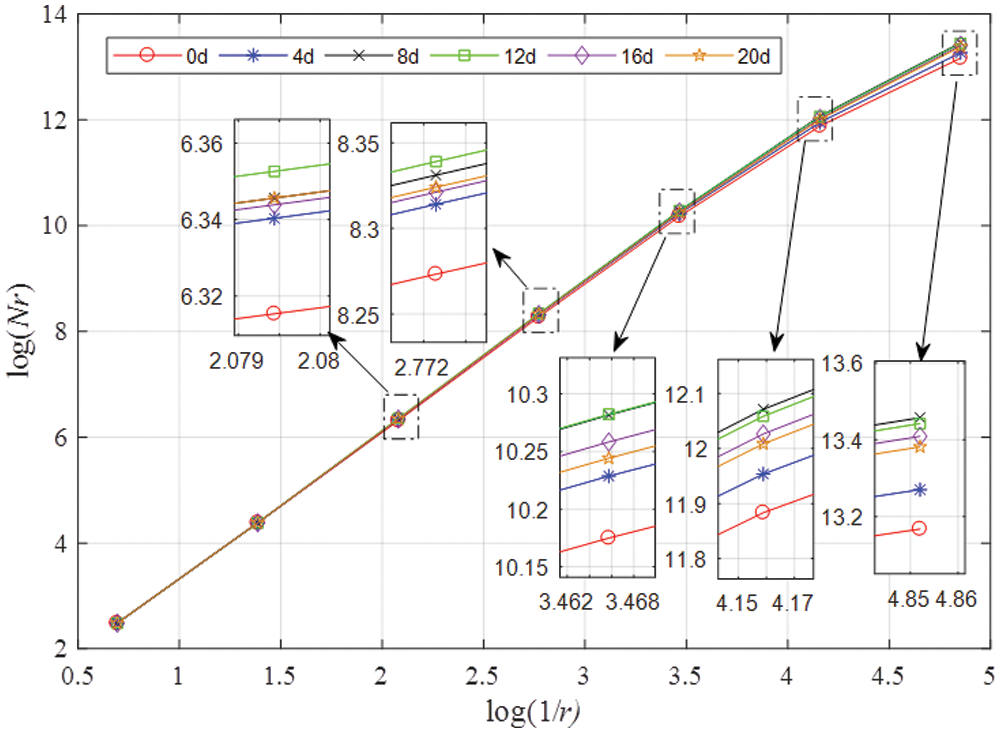
Figure 5: Differential box counting
In Fig. 5, it can be seen that with the increase of log(1/r), the value of log(Nr) increases gradually and exhibited an approximately linear relationship with log(1/r). However, the log(1/r) – log(Nr) curves of the insulating paper with different aging states show an alternating overturning phenomenon. When the value of log(1/r) is small, the value of log(Nr) of samples in different aging stages are almost equal, that is, the log(1/r) – log(Nr) data points are almost coincident. With the increase of the log(1/r) value, the log(Nr) value of samples at each aging stage is significantly different, as shown in the locally enlarged picture in the figure. It can be seen that the log(Nr) value of the non-aged sample (0 d) is always less than that of the aged sample (4 d). However, with the increase of log(1/r) value, the corresponding log(Nr) value of the samples aged for 8, 12, 16, and 20 d takes the lead in turn. Therefore, it is hard to determine the relationship between L value and n value by simple linear fitting, and it is impossible to determine the relationship between aging time and fractal dimension by linear relationship.
Multifractal is a set of infinite scaling indices defined on the fractal structure. Different local conditions on the fractal structure are described by a continuous spectral function. Multifractal is often used to describe the singularity distribution of an image, which can quantify the singular structure of the measure. In other words, a complex image can be divided into many small regions with different degrees of singularity, and the overall fine structure of the image can be understood hierarchically by studying the characteristics of each small region. Therefore, multifractal can be used to describe the texture features of an image [34,35].
Define α be the singularity index in practical applications which represents the fractal dimension of a small area of the image in fractal theory, and its value can reflect the growth probability of the small area. To get the multifractal spectrum of an image, the singular index α of each point on the image is calculated, firstly. The pixels with the same singular indices are set as a set of points corresponding to a numerical f(α), which is called the multifractal singularity spectrum. Then, the pixels that are different from the above pixels but also have the same singular index are taken as a point set again, corresponding to another value f(α), by analogy, the multifractal spectrum image α-f(α) can be obtained. Generally, the direct calculation method is used to calculate the multifractal spectrum and singular index. This method is based on the concept of box dimension and has the characteristics of simple calculation steps and high precision. The calculation process is as follows [36]:
(1) Using the box of scale δ to cover the studied image, and set pi(δ) as the probability of pixels falling to the i-th box, thus obtaining the probability measure distribution, namely:
where q is the weighting factor. The difference of q values divides the image into regions with different levels.
(2) Theoretically, the value range of q is [–∞, +∞]. When q > 0, the subset with a larger probability in the summation of probability measures has a greater influence on the fractal dimension. When q < 0, the subset with a smaller probability in the summation of probability measures has a greater influence on the fractal dimension. So, at this time, the singular index α(q) is:
The multifractal spectrum f [α (q)] is:
(3) Select different values of q to calculate the singular probability measure pi(δ) in the non-empty grid in the corresponding fractal space, and then draw the curve at different scales δ in the unscaled area of the figure, and use the least square method to calculate the slope of this section of the curve. The absolute value of the slope is the singular index α(q) and the corresponding multifractal spectrum f[α(q)] under the given q value.
Multifractal spectrum can accurately describe the image fractal structure under different singularity indices, so it has unique advantages in the description of image texture features. In this paper, the calculated multifractal spectrums of images corresponding to insulating papers with different aging states are provided in Fig. 6.
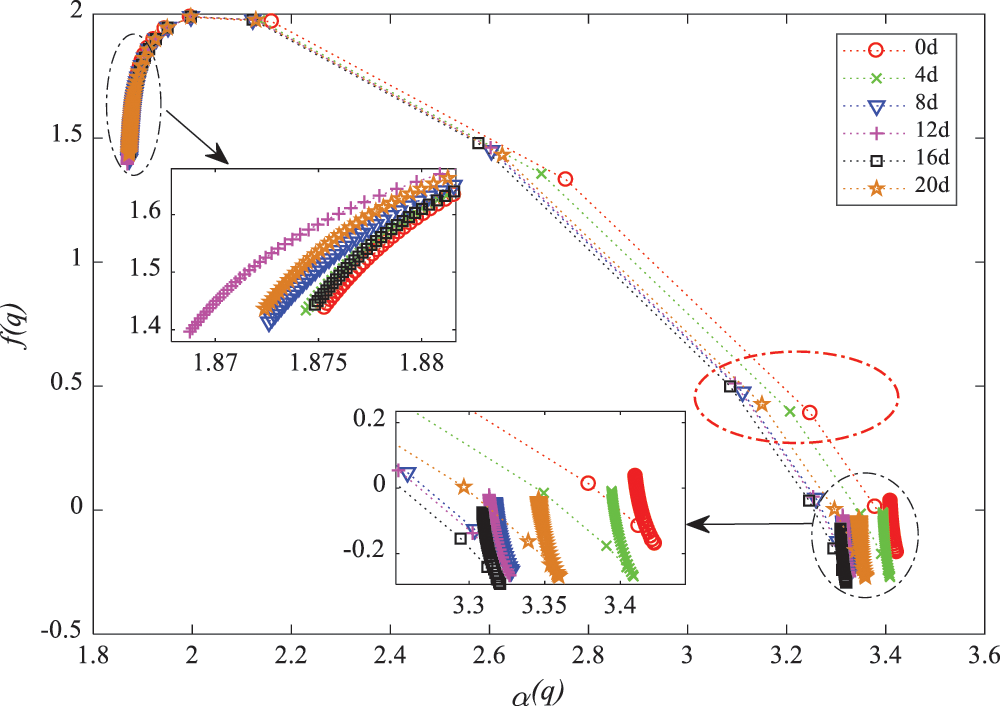
Figure 6: Multiple spectrums of insulating paper at different aging stages
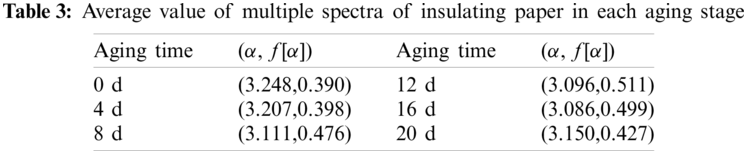
It can be seen that in the range of singularity index α(q) ∈ [3,3.3], or the multi-sufficiency spectrum f[α(q)] ∈ [0.35,0.55], the point distribution of the average value corresponding to each aging stage is relatively discrete and there seems to be no special rule. Therefore, similar to the log(1/r) – log(Nr) curves or the values of fractal dimension of the insulating paper with different aging states shown in Fig. 6, the singularity index and multi-sufficiency spectrum data pair (α, f[α]) along with the aging time can be used for condition assessment and classification of the insulating paper. The points in the red ellipse in Fig. 6 represent the average value of one aging stage of the insulating paper. The eigenvalue of the image in each aging stage is selected based on the average value point, and the points within the range are selected with the abscissa ± 0.1 and ordinate ± 0.25 of the average value point as the range. If there is only a single point in this range, the singularity index of the point α and multifractal spectrum f(α) are the eigenvalues representing the image. If there are multiple points in the range, the average value of the abscissa and ordinate of these points is taken as the characteristic value of the representative image. The specific values of each point (or data pair) are shown in Table 3.
5 Classification and Recognition of Image Texture Features
In this paper, the extreme learning machine (ELM) is taken as the classification algorithm. The ELM is a neural network with multi-hidden layers, which can achieve reasonable output weights of the network with only randomly assigning input weights and biases. Then, the relationship between the input variables and the output can be fitted. In theory, the ELM can approximate any function [37].
Given a neural network with only one layer, suppose N arbitrary samples (Xi, ti) are available for study, with Xi = [xi1, xi2, xi3, …, xin]T∈Rn, ti = [ti1, ti2, …, tim]T∈Rm. Then, such a neural network with one layer and L hidden layer nodes can be expressed using the following equation:
where g(x) stands for activation function, while Wi and βi represent the input and output weight, bi denotes the bias of the i-th hidden layer.
For each hidden layer, the goal is to minimize the error of output, this means:
Namely, βi, Wi and bi available, and:
By transforming the above equation into a matrix: Hβ = T, with H, β and T denoting the output of the hidden layer node, the output weight, and the desired output, respectively.
with
In order to train the neural network with one hidden layer, the desirable values of
where i = 1, …, L, which is numerically equivalent to the minimal value of the loss function, namely:
Generally, gradient descent-based algorithms are applied to solve the abovementioned problem by knowing the parameters of all variables at the initial stage. This, in actuality, is not realistic. In comparison, the ELM solved such a problem by randomly assigning weights and biases of the inputs to determine the output. The process of training a neural network with one layer is thus converted as dealing with a linear system Hβ = T. Behind, by using
5.2 Aging State Classification Based on ELM
In this paper, the ELM is selected to verify the effectiveness of using fractal dimension analysis for the aging assessment of insulating paper with surface microscopic images. The specific process is depicted in Fig. 7 and summarized as follows.
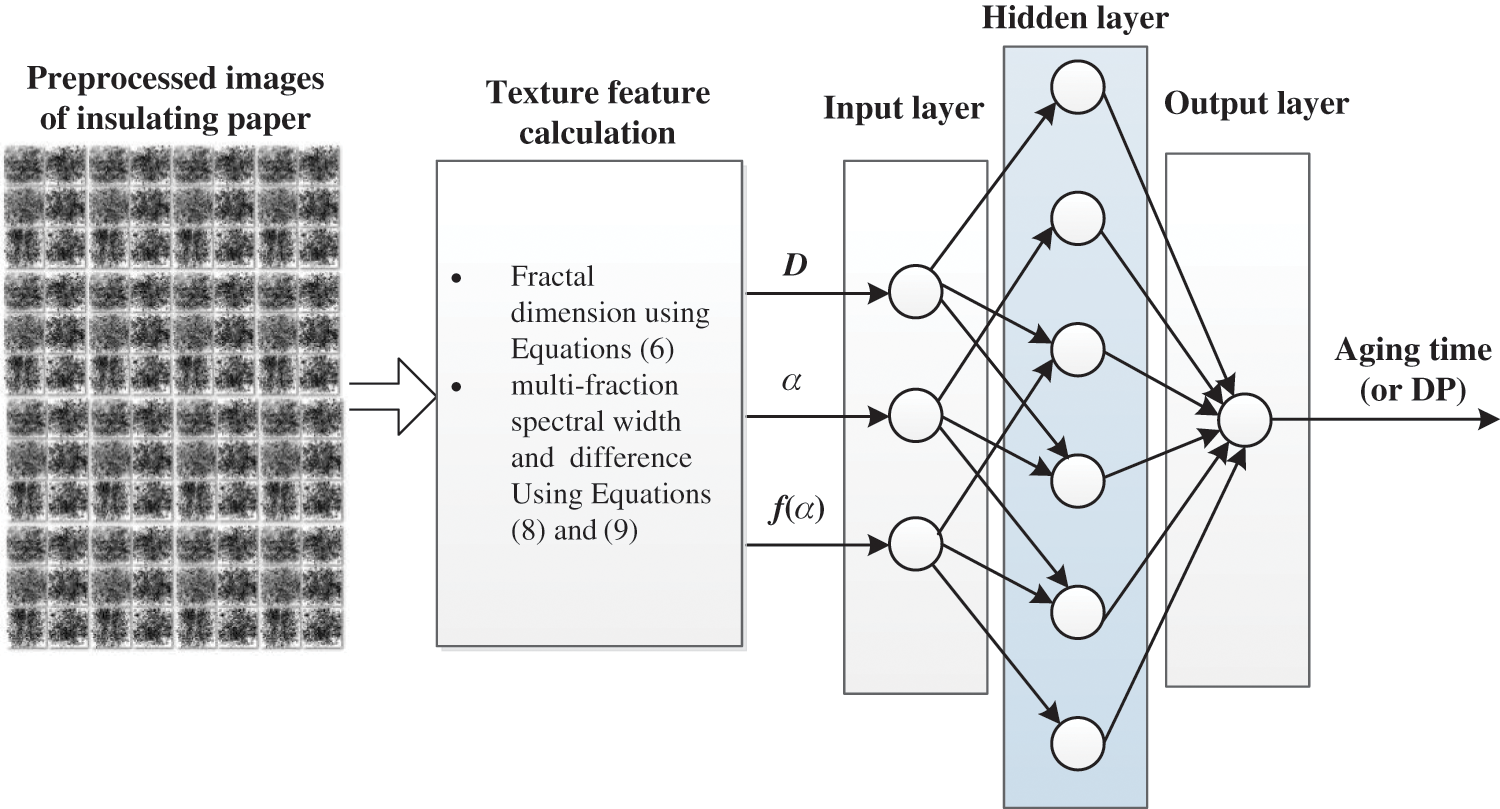
Figure 7: Schematic for fractal dimension-based aging assessment of the insulating paper
Step 1: randomly collect 16 images of insulating paper samples in each aging stage, and separate them into two groups with a ratio of 3:1, one includes 12 training images and another includes 4 testing images. For the insulating papers treated with accelerated thermal aging in six stages, a total of 96 images, including 72 training images and 24 test images, to ensure each training and testing image is properly labelled.
Step 2: calculate the fractal texture features of each image according to the calculation method of the box dimension and the multifractal spectrum introduced in Sections 4.1 and 4.2, where the box dimension D is calculated with the differential box-counting method.
Step 3: take the fractal dimension D, the singular index α, and the multi-fraction spectral f(α) as input variables of ELM, while using the aging time as the output variable (Considering the aging time is linear while the variation of DP value is nonlinear, the authors use the aging time as the output). Then input the test image, and use the calculated fractal texture feature as the input value to predict the aging time of the image.
Generally speaking, traditional neural network learning algorithms (such as BP algorithm) need to artificially set a large number of network training parameters, and it is easy to generate local optimal solutions. The extreme learning machine only needs to set the number of hidden layer nodes of the network, and does not need to adjust the input weights of the network and the bias of hidden elements during the execution of the algorithm, and generates the only optimal solution, so the learning speed of ELM is faster. At the same time, its excellent generalization ability can also solve the overfitting phenomenon that common classifiers are prone to when the data sample size is small. In this paper, the number of input layer, hidden layer, and output layer are set as three, six, and one, respectively. The classification results are shown in Fig. 8.
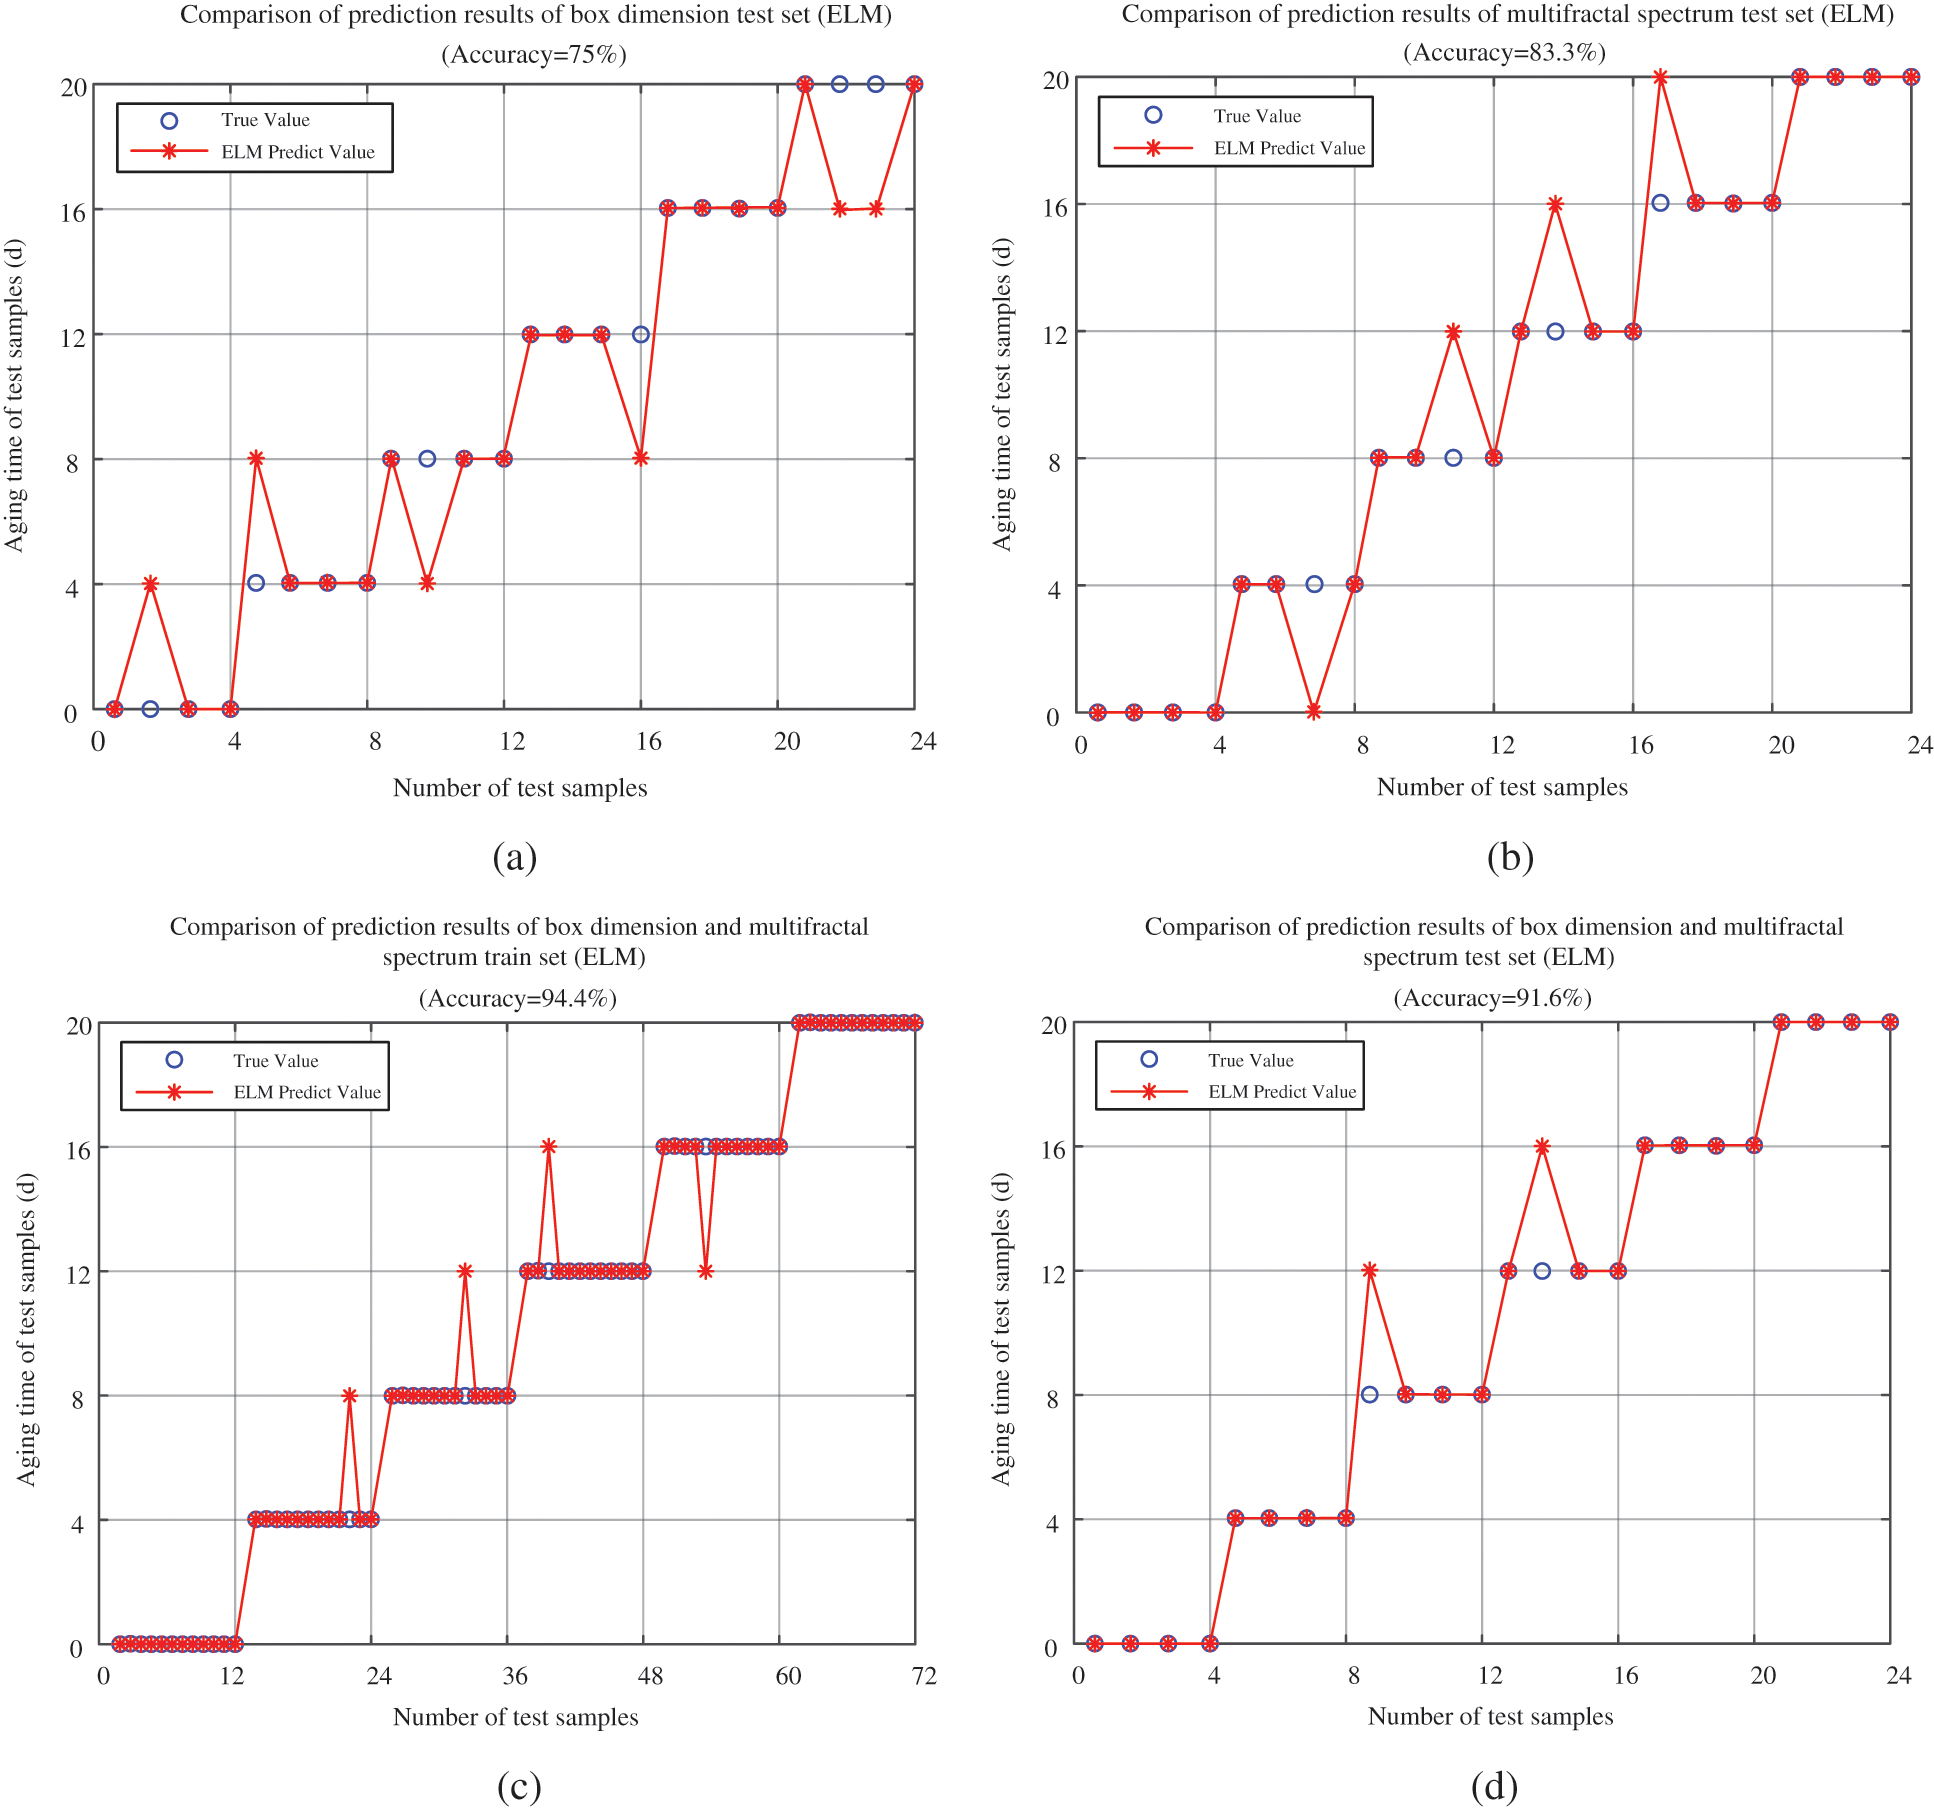
Figure 8: Aging state classification results of ELM. (a) Test result using box dimension as input, (b) Test result using singular index and multi-fraction spectral as inputs, (c) Training results using D, α, and f(α), (d) Test result using D, α, and f(α)
According to the classification results in Figs. 8a and 8b, it can be seen that if the box dimension is used as the single input, the classification accuracy is relatively low, even if two features of the multifractal spectrum are taken as the inputs, the test accuracy still lower than 90%. This indicates that either using box dimension or multifractal spectrum alone cannot well characterize the aging state of insulating paper, since the box dimension focuses on the overall texture complexity of the image, and the multifractal spectrum focuses on the local texture complexity of the image. Therefore, combining the two to describe the features of the image will often have better results. The classification results in Figs. 8c and 8d prove that, after combining the box dimension and multifractal spectrum as inputs, either the training accuracy or the test accuracy exceeds 90%, and the classification effect is satisfactory. Therefore, the fractal texture characteristics of the image, especially the combination of the box dimension and the multifractal spectrum can effectively characterize the image texture of the insulating paper, which can be applied for judging the aging time of the insulating paper.
The aging and degradation of insulating paper can change the surface of the paper. Such change can be reflected in the texture complexity of surface roughness, which is very similar to the judgment of the degree of wear of the object in machining. Therefore, the fractal dimension theory is adopted in this paper to describe the complexity of the insulating paper’s surface texture. Considering the influence of the surrounding environment, the collected images are pre-processed before extracting the texture complexity of the insulating paper. From the test results, it can be found that the box dimension in describing the texture complexity of insulating paper can reflect the texture complexity of the overall image at a single scale, but easy to ignore the influence of the local texture features of the image on the overall image texture complexity. While the multifractal spectrum can affect the image with different probabilities. The subset of the measure is used to obtain the fractal dimension, which can effectively describe the local texture features in the image. The classification result of using a complementary with the box dimension and the multifractal spectrum is better than that of using single box dimension or the multifractal spectrum features. Classification test with accelerated aging insulating paper samples proves the effectiveness of using fractal dimension theory for aging state assessment of the insulating paper.
Funding Statement: This work was supported by the Tianyou Youth Talent Lift Program of Lanzhou Jiaotong University, the Youth Science Foundation of Lanzhou Jiaotong University (No. 2019029), the University Innovation Fund Project of Gansu Provincial Department of Education (No. 2020A-036), the Young Doctor Foundation of JYT.GANSU.GOV.CN (No. 2021QB-060).
Conflicts of Interest: The authors declare that they have no conflicts of interest to report regarding the present study.
1. Wu, G., Yao, M., Xin, D., Gao, B. (2015). Experimental study on oil-immersed insulating paper under uneven thermal aging. Power System Technology, 39(11), 3298–3304. DOI 10.13335/j.1000-3673.pst.2015.11.043. [Google Scholar] [CrossRef]
2. Yuan, Y., Zhao, Z., Luo, C., Li, C., Liang, S. et al. (2019). Temperature characteristics of thermal resistance of insulating paper for oil immersed transformer. High Voltage Engineering, 45(6), 1754–1761. DOI 10.13336/j.1003-6520.hve.20190604010. [Google Scholar] [CrossRef]
3. Sui, B., Cao, J., Song, Z., Yin, X. (2018). Study on polarization/depolarization current characteristics of oil-immersed insulating paper with uneven thermal aging. High Voltage Apparatus, 54(1), 207–212. DOI 10.13296/j.1001-1609.hva.2018.01.031. [Google Scholar] [CrossRef]
4. Yang, L., Chen, J., Wang, S., Gao, J. (2018). Dielectric response measurement of oil-paper insulation based on system identification and its time-frequency-domain conversion method. IEEE Transactions on Dielectrics and Electrical Insulation, 25(5), 1688–1698. DOI 10.1109/TDEI.2018.007033. [Google Scholar] [CrossRef]
5. Lizarraga-Morales, R. A., Correa-Tome, F. E., Sanchez-Yanez, R. E., Cepeda-Negrete, J. (2019). On the use of binary features in a rule-based approach for defect detection on patterned textiles. IEEE Access, 7, 18042–18049. DOI 10.1109/ACCESS.2019.2896078. [Google Scholar] [CrossRef]
6. Song, A., Han, Y., Hu, H., Li, J. (2014). A novel texture sensor for fabric texture measurement and classification. IEEE Transactions on Instrumentation and Measurement, 63(7), 1739–1747. DOI 10.1109/TIM.2013.2293812. [Google Scholar] [CrossRef]
7. Li, M., Sun, X., Chen, W., Jiang, Y., Zhang, T. (2020). Classification epileptic seizures in EEG using time-frequency image and block texture features. IEEE Access, 8, 9770–9781. DOI 10.1109/ACCESS.2019.2960848. [Google Scholar] [CrossRef]
8. Li, S., Gao, G., Hu, G., Gao, B., Gao, T. et al. (2017). Aging feature extraction of oil-impregnated insulating paper using image texture analysis. IEEE Transactions on Dielectrics and Electrical Insulation, 24(3), 1636–1645. DOI 10.1109/TDEI.2017.006319. [Google Scholar] [CrossRef]
9. Jacob, N. D., Hassanzadeh, H., Oliver, D. R., Sherif, S. S., Kordi, B. (2016). Classification of degradation in oil-impregnated cellulose insulation using texture analysis of optical microscopy images. Electric Power Systems Research, 133, 104–112. DOI 10.1016/j.epsr.2015.11.010. [Google Scholar] [CrossRef]
10. Malviya, A. (2008). Fractal based spatial domain techniques for image de-noising. International Conference on Audio, Language and Image Processing, pp. 1511–1516. Shanghai, China. DOI 10.1007/s11705-019-1901-5. [Google Scholar] [CrossRef]
11. Xia, G., Huang, Y., Li, F., Wang, L., Pang, J. et al. (2020). A thermally flexible and multi-site tactile sensor for remote 3D dynamic sensing imaging. Frontiers of Chemical Science and Engineering, 14(6), 1039–1051. DOI 10.1007/s11705-019-1901-5. [Google Scholar] [CrossRef]
12. Liu, C., Zhang, Y., Sun, J., Cui, Z., Wang, K. (2021). Stacked bidirectional LSTM RNN to evaluate the remaining useful life of supercapacitor. International Journal of Energy Research, 15(7), 1–10. DOI 10.1002/er.7360. [Google Scholar] [CrossRef]
13. Liu, T., Zhu, K. (2017). Intelligent robust milling tool wear monitoring via fractal analysis of cutting force. 13th IEEE Conference on Automation Science and Engineering, pp. 1254–1259. Xi’an, China. DOI 10.1109/coase.2017.8256273. [Google Scholar] [CrossRef]
14. Xu, R., Sun, Y., Yang, Z., Song, B., Hu, X. (2015). The classification of HEp-2 cell patterns using fractal descriptor. IEEE Transactions on NanoBioscience, 14(5), 513–520. DOI 10.1109/TNB.2015.2424243. [Google Scholar] [CrossRef]
15. Gong, S., Zhao, Y., Wang, Z., Zhou, L., Yang, D. et al. (2021). Experimental study on the influence of bedding on the fractal characteristics of dynamic crack propagation in coal and rock. Journal of China Coal Society, 46(8), 1–11. DOI 10.13225/j.cnki.jccs.2020.0696. [Google Scholar] [CrossRef]
16. Zou, T., Qi, D. (2012). Overview of remote sensing image discrimination technology based on fractal theory. Ship Electronic Engineering, 32(4), 13–15+21. DOI cnki: sun: jcgc.0.2012-04-00. [Google Scholar]
17. Huang, X. (2020). Research and application of land use remote sensing information extraction based on fractal texture (Master Thesis). China University of Geosciences, China. [Google Scholar]
18. An, Q., Suo, S., Lin, F., Shi, J. (2020). Calculation method of fractal dimension of three-dimensional rough surface based on wavelet transform. Lubrication Engineering, 45(3), 88–92. DOI cnki:sun:rhmf.0.2020-03-020. [Google Scholar]
19. Sun, T. (2009). Research on texture segmentation algorithm of lung CT image based on fractal theory (Master Thesis). University of Heilongjiang, China. [Google Scholar]
20. Liao, R., Yang, L., Zheng, H., Wang, K., Ma, Z. (2012). Review on thermal aging of oil paper insulation of power transformer. Transactions of China Electrotechnical Society, 27(5), 1–12. DOI 10.19595/j.cnki.1000-6753.tces.2012.05.001. [Google Scholar] [CrossRef]
21. Cheim, L., Patel, P., Cole, G., Eakins, W., Rossano, G. (2018). Submersible transformer inspection device a change of paradigm. IEEE/PES Transmission and Distribution Conference and Exposition, pp. 1–9. Denver, CO, USA. DOI 10.1109/tdc.2018.8440514. [Google Scholar] [CrossRef]
22. Emsley, M. A., Stevens, C. G. (1994). Review of chemical indicators of degradation of cellulosic electrical paper insulation in oil-filled transformers. IEE Proceedings of Science, Measurement and Technology, 141(5), 324–334. DOI 10.1049/ip-smt:19949957. [Google Scholar] [CrossRef]
23. ISO 5630-4:1986. Paper and board–Accelerated ageing–Part 4: Dry heat treatment at 120 or 150°C, 1986. https://agris.fao.org/agris-search/search.do?recordID=XF19880035282. [Google Scholar]
24. Zhou, L., Chen, X., Wang, A., Wang, D., Liao, W. (2019). Effect of aging state on moisture diffusion of oil immersed insulating paper. Transactions of China Electrotechnical Society, 34(15), 3293–3301. DOI 10.19595/j.cnki.1000-6753.tces.180802. [Google Scholar] [CrossRef]
25. Haralick, M. R. (1973). Texture features for image classification. IEEE Transactions on Systems Man and Cybernetics, SMC-3(6), 610–621. DOI 10.1109/TSMC.1973.4309314. [Google Scholar] [CrossRef]
26. Pentland, P. (1984). Fractal-based description of natural scenes. IEEE Transactions on Pattern Analysis and Machine Intelligence, 6(6), 661–674. DOI 10.1109/TPAMI.1984.4767591. [Google Scholar] [CrossRef]
27. Zhang, Z., Dong, F., Wu, Y. (2005). Calculation of fractal dimension of two-dimensional gray image. Journal of Computer Application, 12, 137–138+151. DOI cnki:sun:jsjy.0.2005-12-046. [Google Scholar]
28. Rolph, S. (1990). Fractal geometry-mathematical foundations and applications. Mathematical Gazette, 74(469), 288–317. [Google Scholar]
29. Dong, L., Shan, R., Liu, H., Yu, D., Du, K. (2021). Research on shipwreck recognition method of side scan sonar image based on fractal texture feature. Marine Geology and Quaternary Geology, 41(4), 1–8. DOI 10.16562/j.cnki.0256-1492.2020070301. [Google Scholar] [CrossRef]
30. Zhu, H., Ji, C. (2011). Fractal theory and its application. China: Science Press. [Google Scholar]
31. Gagnepain, J. J., Roques-Carmes, C. (1986). Fractal approach to two-dimensional and three-dimensional surface roughness. Wear, 109(1–4), 119–126. DOI 10.1016/0043-1648(86)90257-7. [Google Scholar] [CrossRef]
32. Sarkar, N., Chaudhuri, B. B. (1992). An efficient approach to estimate fractal dimension of texture images. Pattern Recognition, 25(9), 1035–1041. DOI 10.1016/0031-3203(92)90066-R. [Google Scholar] [CrossRef]
33. Sarkar, N., Chaudhuri, B. B. (1994). An efficient differential box-counting approach to compute fractal dimension of image. IEEE Transactions System Man and Cybernet, 24(1), 115–120. DOI 10.1109/21.259692. [Google Scholar] [CrossRef]
34. Faghfouri, A., Kinsner, W. (2005). Local and global analysis of multifractal singularity spectrum through wavelets. Canadian Conference on Electrical and Computer Engineering, pp. 2163–2169. Saskatoon, SK, Canada. DOI 10.1109/ccece.2005.1557417. [Google Scholar] [CrossRef]
35. Li, H., Yu, B. (2003). An image segmentation algorithm based on new multifractal features. Optics and Precision Engineering, 3, 627–631. DOI 10.3321/j.issn:1004-924X.2003.06.017. [Google Scholar] [CrossRef]
36. Fan, Y., Feng, L., Ming, L., Chong, H., Chen, S. (2015). Weak target detection in sea clutter background using local-multifractal spectrum with adaptive window length. IET Radar, Sonar & Navigation, 9(7), 835–842. DOI 10.1049/iet-rsn.2014.0286. [Google Scholar] [CrossRef]
37. Li, X., Mao, W., Wei, J. (2013). Fast sparse approximation of extreme learning machine. Neurocomputing, 128(5), 96–103. DOI 10.1016/j.neucom.2013.01.064. [Google Scholar] [CrossRef]
 | This work is licensed under a Creative Commons Attribution 4.0 International License, which permits unrestricted use, distribution, and reproduction in any medium, provided the original work is properly cited. |