| Computer Modeling in Engineering & Sciences |
DOI: 10.32604/cmes.2022.019378
ARTICLE
A Method Based on Knowledge Distillation for Fish School Stress State Recognition in Intensive Aquaculture
1College of Information and Electrical Engineering, China Agricultural University, Beijing, 100083, China
2National Innovation Center for Digital Fishery, China Agricultural University, Beijing, 100083, China
3School of Information Science and Technology, Beijing Forestry University, Beijing, 100083, China
*Corresponding Author: Yingyi Chen. Email: chenyingyi@cau.edu.cn
Received: 23 September 2021; Accepted: 30 November 2021
Abstract: Fish behavior analysis for recognizing stress is very important for fish welfare and production management in aquaculture. Recent advances have been made in fish behavior analysis based on deep learning. However, most existing methods with top performance rely on considerable memory and computational resources, which is impractical in the real-world scenario. In order to overcome the limitations of these methods, a new method based on knowledge distillation is proposed to identify the stress states of fish schools. The knowledge distillation architecture transfers additional inter-class information via a mixed relative loss function, and it forces a lightweight network (GhostNet) to mimic the soft probabilities output of a well-trained fish stress state recognition network (ResNeXt101). The fish school stress state recognition model's accuracy is improved from 94.17% to 98.12% benefiting from the method. The proposed model has about 5.18 M parameters and requires 0.15 G FLOPs (floating-point operations) to process an image of size 224 × 224. Furthermore, fish behavior images are collected in a land-based factory, and a dataset is constructed and extended through flip, rotation, and color jitter augmentation techniques. The proposed method is also compared with other state-of-the-art methods. The experimental results show that the proposed model is more suitable for deployment on resource-constrained devices or real-time applications, and it is conducive for real-time monitoring of fish behavior.
Keywords: Fish behavior; deep learning; knowledge distillation; aquaculture
Stress is the general physiological response of fish to threatening situations [1]. Environmental changes (oxygen deficit, water temperature, and nitrogen compounds fluctuations), fish handling (fishing, sorting, and transporting), and the presence of different toxic chemicals in polluted water reservoirs are considered major stressors [2]. The chronic stress caused by repeated acute stress could affect fish's long-term feeding behavior and growth performance [3]. Hence, stress is considered a primary contributing factor that leads to impaired health in cultured fish [4]. Stress can initiate behavioral changes, and these changes reflect how a fish is sensing and responding to its environment [4,5]. Therefore, continuous monitoring and identification of species-specific behavior are critical to fish production and breeding. With the development of commercial aquaculture, more research has been conducted to understand the relationship between stress and behavior [5,6].
A variety of research about fish behavior identification has been reported in the literature. In the early stages, artificial observation is a common and effective method. However, this approach is time-consuming and expensive [7–9]. Recently, computer vision technology has been applied to fish behavior analysis, which is noninvasive, efficient, and automatic. Among them, deep learning has attracted extensive attention from academia and industry and is increasingly used in the aquaculture industry, mainly for fish species classification [10,11], behavior analysis [12–14], and water quality prediction [15]. However, most effective deep learning-based methods involve huge computational complexity and massive storage. For example, the common ResNet-101 has about 44.7 million parameters, needs 170 MB storage, and requires 7.6 B FLOPs to process the algorithm.
The extremely high computation and memory costs seriously limit the development of these models in portable devices and real-time applications [16]. In aquaculture, real-time data analysis is essential for timely and accurate cultured fish recognition and monitoring. Establishing a model for accurate and rapid detection of fish stress states is imperative. Therefore, this research presents the first attempt to introduce knowledge distillation technology into the aquaculture industry and propose a fish stress state recognition model called KD-GhostNet. More specifically, the knowledge distillation method forces a lightweight network (GhostNet) to mimic the soft probabilities output of a well-trained fish stress state recognition network (ResNeXt101), so that the lightweight network obtains additional inter-class information. In this research, we use a four-class dataset from a real farming environment to evaluate the performance of the model. The experimental results show that the fish school stress state recognition model's accuracy is improved from 94.17% to 98.12%. The model has about 5.18 M parameters and requires 0.15 G FLOPs (floating-point operations) to process an image of size 224 × 224. We also compare KD-GhostNet with other state-of-the-art methods. This experiment demonstrates that the method based on knowledge distillation for fish school stress state recognition is more effective in intensive aquaculture.
The organization of the article is as follows. Section 2 reviews the related work on fish behavior analysis. Section 3 introduces the process of obtaining fish state data and the details of the proposed approach. Section 4 reports experimental results and discussion. Section 5 discusses the advantages and limitations of the method. Finally, Section 6 provides a conclusion. Table 1 provides a list of abbreviations used in this article.

In the early stage, fish behavior monitoring is mainly based on visual observation and manual recording [9], which is basically in the qualitative analysis stage and significantly affected by the human's subjective judgment. Moreover, fish behavior analysis requires a large number of measured data, but data acquisition is a time-consuming and laborious process [7,17]. With the development of science and technology, computer vision technology has become a common approach in fish behavior analysis due to its low-cost and non-contact features. Most of the existing research has been carried out in the laboratory environment, mainly focusing on stress response [18,19], genetic statues [20], motion responses [21], vertical distribution [22]. These research efforts mostly observe fish's changes in physical state or environment based on monitoring individual fish's behavior. They mainly depend on the accuracy of detection and tracking. They first detect and locate an individual fish based on the appearance and movement information, then the fish's trajectory is established by tracking methods. Finally, the characteristic parameters are extracted to quantitatively analyze the individual fish behavior, such as speed, direction [19–20,23,24], turn angle, acceleration, displacements [25], and tail-beat frequency [26]. However, feature parameter extraction becomes a challenge, when the target cannot be correctly detected or tracked. To solve this problem, Zhao et al. [14] proposed a new method for fish detection and localization, which is based on a modified motion influence map and RNN. The method realizes the recognition of three typical local abnormal behaviors. Its main problem is the distinction between local and global abnormal behavior of fish, which directly affects the performance.
In a real industrial aquaculture environment (high-density), it is difficult to detect and track individual fish due to intra-class variation and cross-occlusion. However, fish school behavior analysis only needs to consider the global information in the image and does not require accurate tracking of individual fish. Hence, fish school behavior analysis is an alternative method and has become a research focus. Generally, frame differencing [24,27,28], background subtraction [29–35], and optical flow [30,31] are used to extract the movement information of fish. A kinetic energy model based on BMFS is easily affected by the color of the image background and refection noise [31]. A KEM based on particle advection scheme and PAOF has a good prospect in RAS because it has no foreground segmentation. Optical flow can avoid sophisticated foreground segmentation and tracking in dense scenes, so it is adopted to represent motion characteristics [30,31]. The active number of fish is extracted by the frame differencing technique. Based on the above methods, one or more features are extracted to analyze the feeding behavior of fish schools, such as the Projected Mobility Picture index [27] and two group behavior indexes: fish group dispersion index Ptot and fish group activity index Adiff. A single index cannot provide sufficient information, and Adiff is sensitive to changes in swimming speed, so Adiff's performance exceeds Israeli's method [27]. Moreover, velocity, turning angle, and dispersion are used to express spatial behavioral characteristics [31,35]. The fish speed and turning angle are used to assess the change magnitude of behavioral traits, combined with dispersion information to detect unusual behaviors of fish schools [31].
The methods mentioned above [18–35] mainly use artificial predesigned features to analyze the behavior of fish schools, but the robustness and generalization ability are poor. The deep learning technology has been applied in this research because of its powerful learning and feature extraction ability. Zhou et al. [13] used a LeNet to grade the feeding intensity of fish, then evaluate fish's appetite. Different from Zhou et al. method, Han et al. [12] first fuse fish's optical flow image and RGB image, then send them into a designed convolution neural network, and finally realize the recognition of the fish's state. At present, these deep learning-based fish behavior analysis methods are still in the theoretical and exploratory stage, because most of them simply consider the accuracy and disregard the model size, deployment cost, inference time, and application environment. Our research introduces knowledge distillation into fish behavior analysis and proposes a fish stress state recognition model. The model has excellent recognition performance with less computation cost and fewer parameters.
Experiments are conducted in Mingbo Fishery, a land-based factory (Laizhou, Shandong, China) using a closed recirculating marine aquaculture system. We choose B6 and C11 culture pools in the eighth workshop to collect the dataset. The pools are made of glass fiber-reinforced plastic and are 0.64 m deep with a diameter of 3.3 m. An artificial lighting system is installed above each pond, as shown in Fig. 1. Two groups of oplegnathus punctatus are used in the experiment. One group of about 200 fish (each weighs 50 grams) is labeled as Group 1, the other group of about 80 fish (each weighs 150 grams) is labeled as Group 2. During the experiment, they are raised in seawater. The water temperature is controlled in the range of
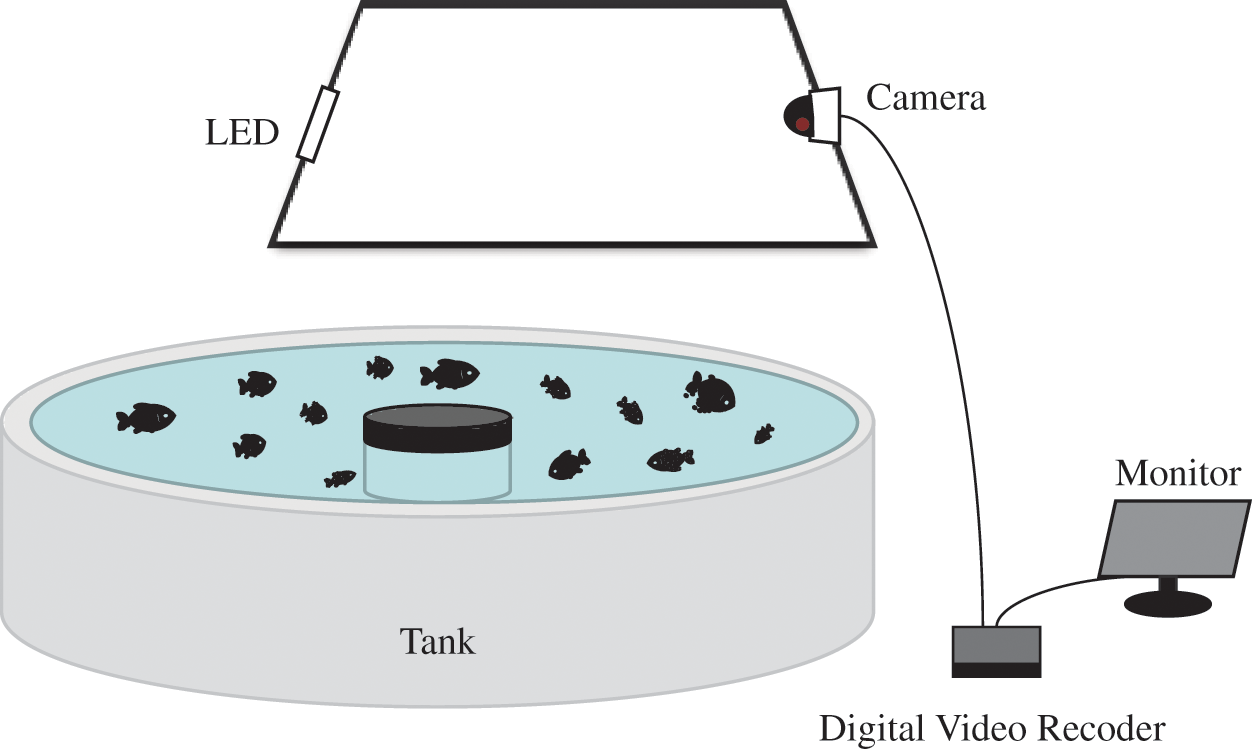
Figure 1: The structure of the experimental system
The camera used in this experiment is a Hikvision infrared camera. The specific model is DS-2DC2204IW-DE3/W. RGB images are acquired with a resolution of
Stress is the general physiological response of fish to threatening situations. Environmental changes, fish handling, and the presence of different toxic chemicals in polluted water reservoirs can be stressors, but these problems cannot always be avoided in aquaculture. During the experiment at Mingbo Fishery, we collect the fish behavior data in stress states and normal states under the guidance of professional aquaculture workers. The information of the fish in different states are presented in Table 2.

According to the different swimming speeds of the fish in different states, the frames are firstly sampled at different times. Two datasets are then obtained: 1) the dataset of 200 fish (each weighs 50 grams) in four states; 2) the dataset of 80 fish (each weighs 150 grams) in four states. Finally, the two datasets are merged, and the specific distribution of the datasets is shown in Table 3. The variant samples of the four states in the fish school state dataset are shown in Fig. 2.

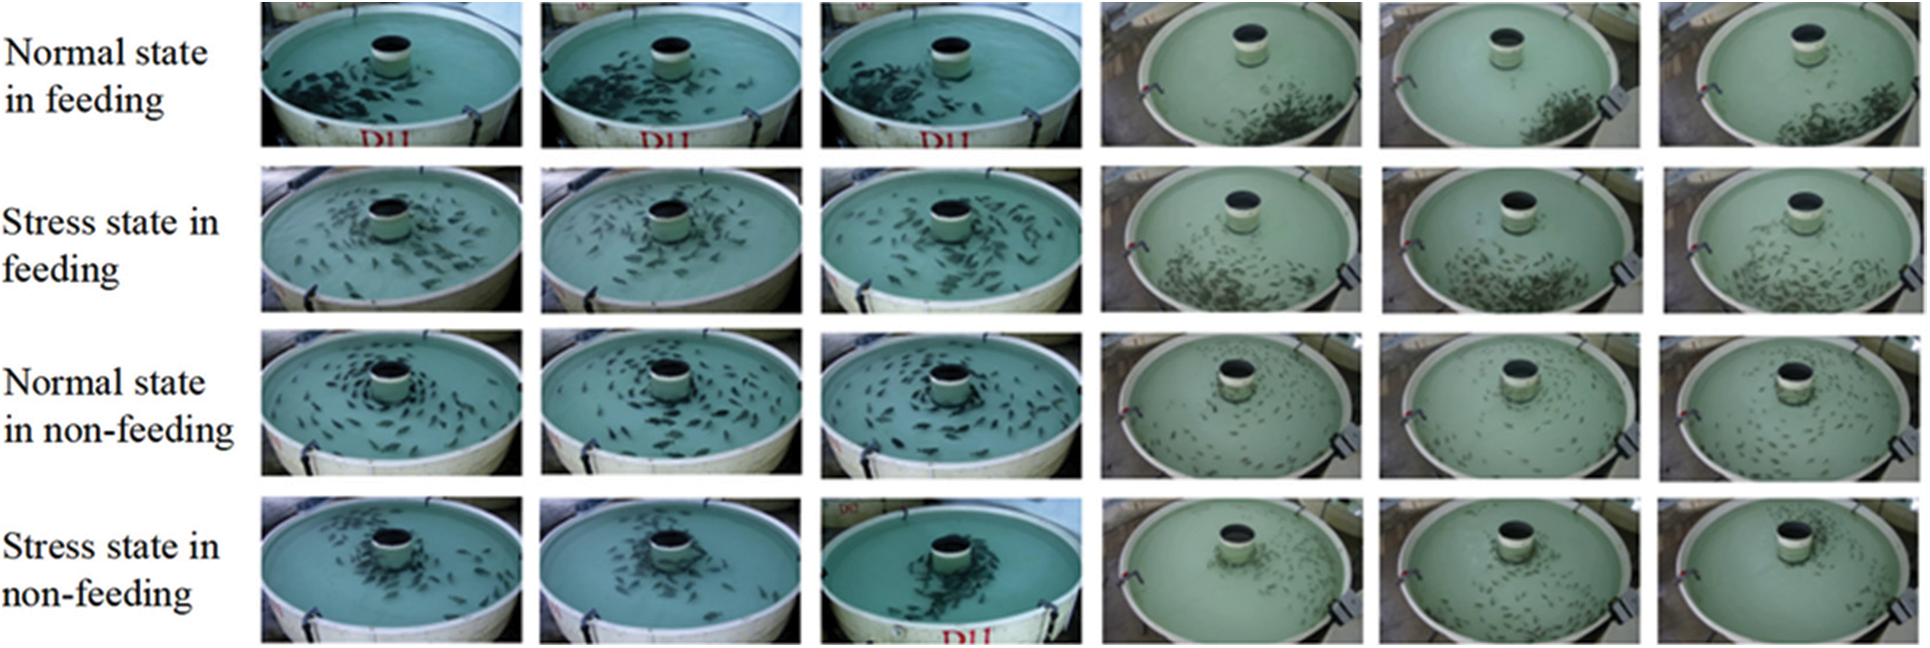
Figure 2: Samples of the fish school state dataset
Deep learning models depend on the ability of training data to faithfully represent the data encountered during deployment. If the dataset is too small, it is prone to overfitting during model training. Data augmentation technology produces new data by making immaterial changes to existing images, fundamentally improving the robustness. Therefore, the research choses a series of image pre-processing operations such as random flipping, scaling, random rotation, and changing contrast, brightness and hue. These traditional methods are simple and effective.
3.4 Proposed Recognition Method
GhostNet:
To explore a convolutional neural network model suitable for deployment on resource-constrained devices or real-time applications, the research uses a lightweight and efficient network (GhostNet) to train and recognize fish school's states. This type of convolutional neural network model is suitable for deployment on resource-constrained devices or real-time applications. Based on a set of intrinsic feature maps, GhostNet applies a series of linear operations to generate many ghost feature maps [36] that could fully reveal information underlying intrinsic features. The linear operations operate on each channel whose computational cost is much less than ordinary convolution. The key module in GhostNet is called Ghost Module and combines convolution operation and linear operation, as shown in Fig. 3.
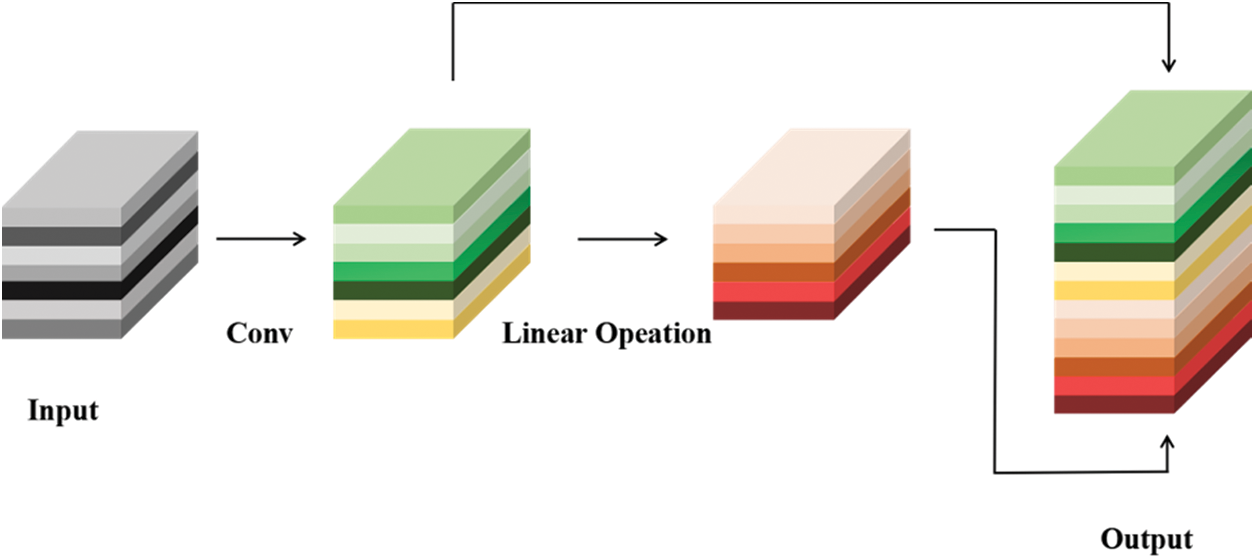
Figure 3: The ghost module
The structures of two Ghost bottlenecks are built based on the Ghost module. When the stride is 1, the structure of Ghost Bottleneck is shown in Fig. 4a, which is used for feature extraction; When the stride is 2, the structure of Ghost Bottleneck is shown in Fig. 4b, which is used to reduce the number of channels. For efficiency, the primary convolution in the Ghost module is point convolution.
The basic framework of GhostNet uses MobileNet as a reference. The first layer is a standard convolution layer with 16 filters, followed by a series of Ghost bottlenecks. The last Ghost bottleneck in each stage is applied with stride = 2, and the rest is with stride = 1. In some Ghost bottlenecks, the squeeze and excite module (SE) is applied to the residual layer. Finally, a global average pooling and a convolution layer are used to transform the feature maps into 4-dimensional feature vectors for classification.
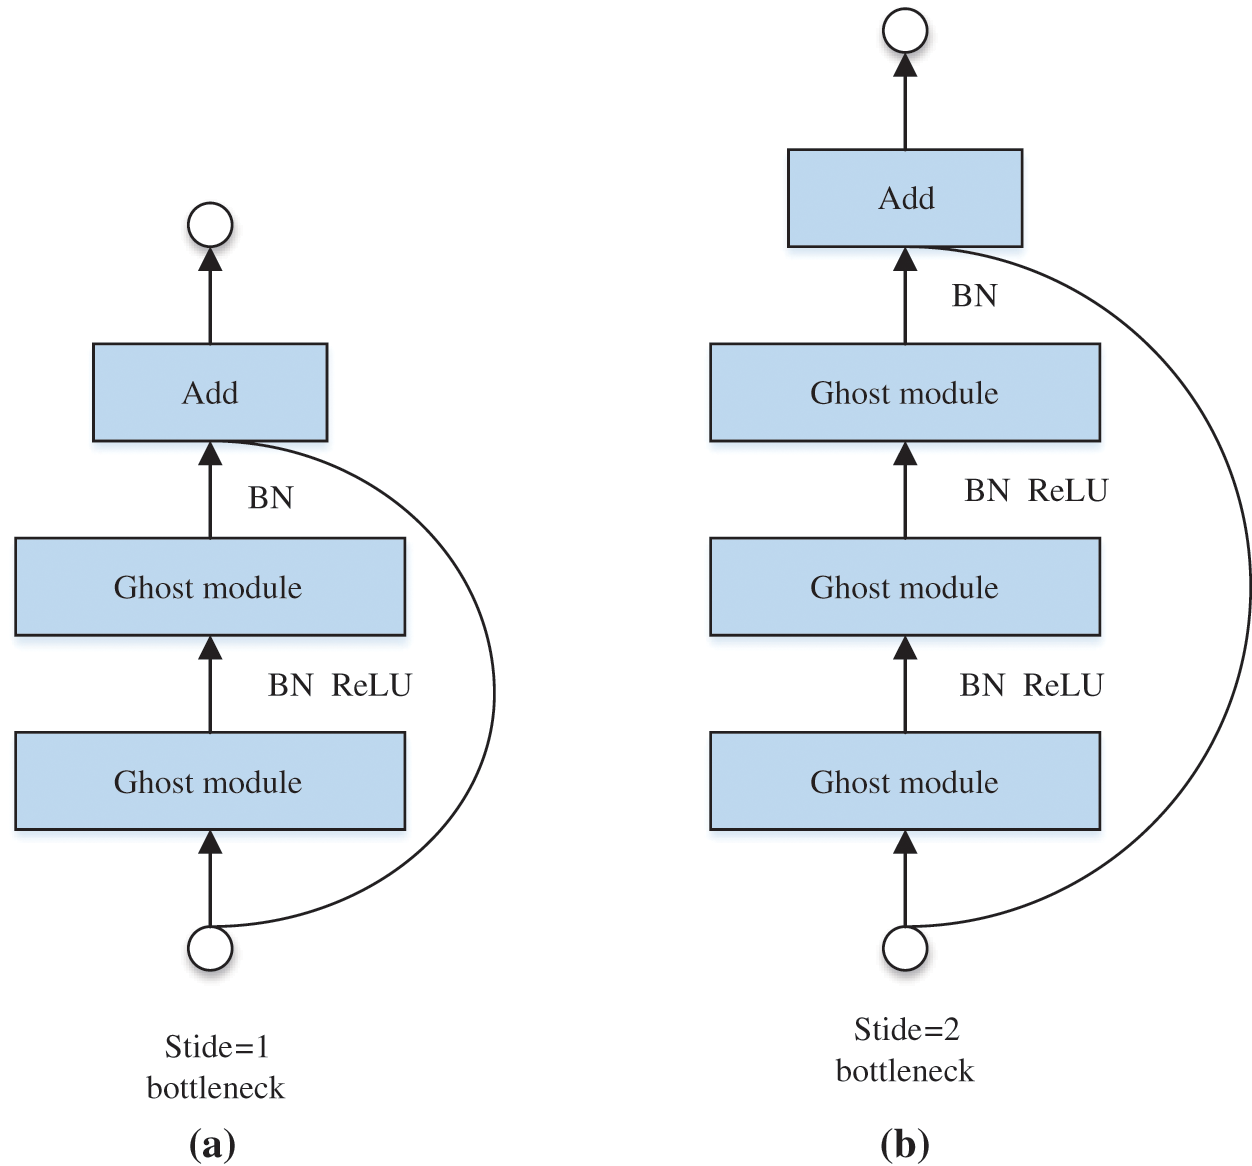
Figure 4: Ghost bottleneck
ResNeXt:
The ResNeXt proposed by Xie et al. [37] is adopted, which is a highly modularized network architecture. Widening or deepening the neural network is a traditional method to improve the model's accuracy. However, as the depth or width increases, the problem of gradient disappearance or explosion will appear. ResNeXt adopts VGGNet's repeated layer strategy and Inception's split-transform-merge idea simultaneously, which improves the accuracy with reducing the number of hyperparameters. The module of ResNeXt is defined as Eq. (1):
where X is the input, Y is the output,
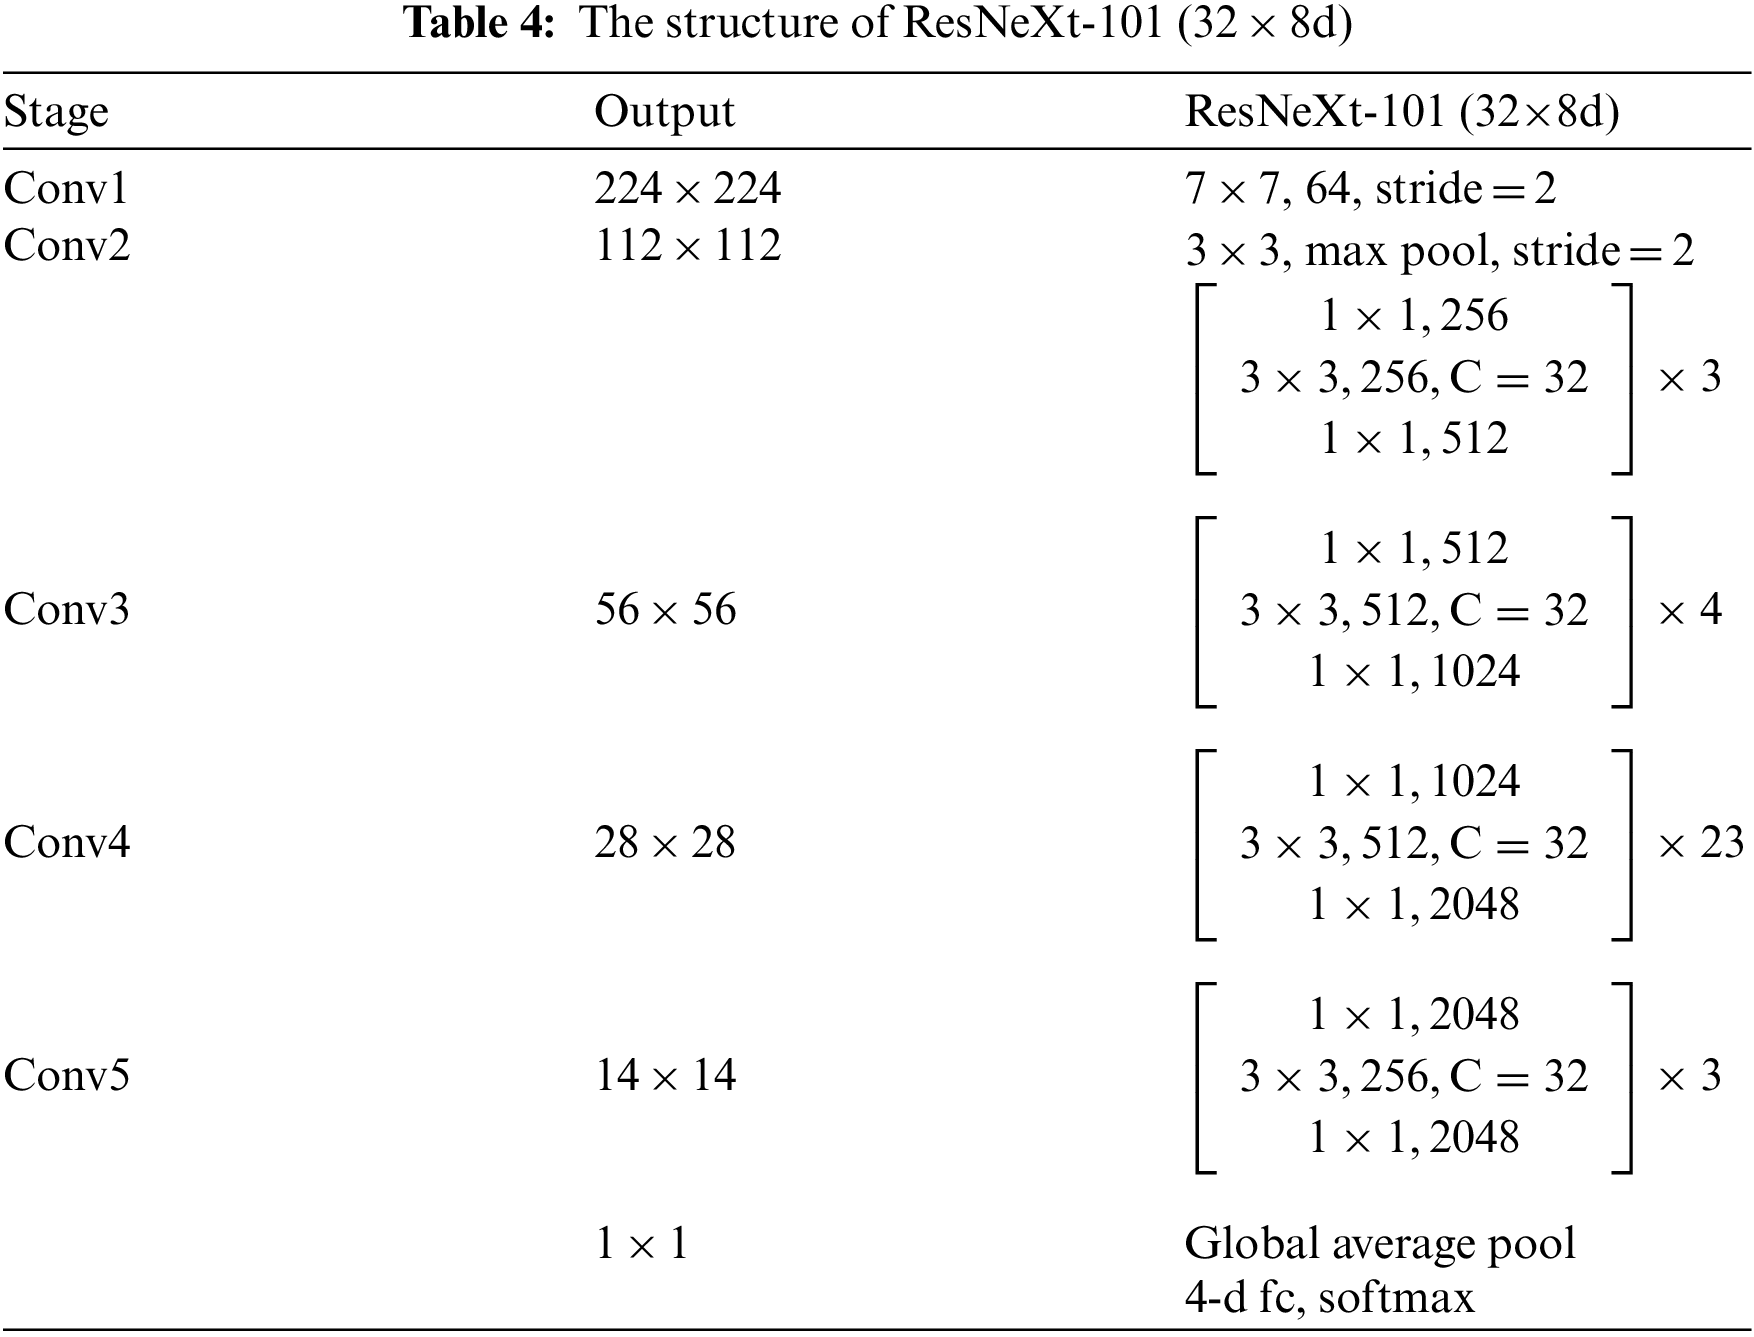
Fig. 5 shows a block of the ResNeXt network with C = 32. The ResNeXt can be extended to any large number of transformations without specialized designs. It is constructed by repeating the building block. In experiments conducted on the ImageNet dataset, ResNeXt shows high accuracy compared with existing models and requires low operation FLOPS. The structure of ResNeXt-101 (32 × 8d) is shown in Table 4.
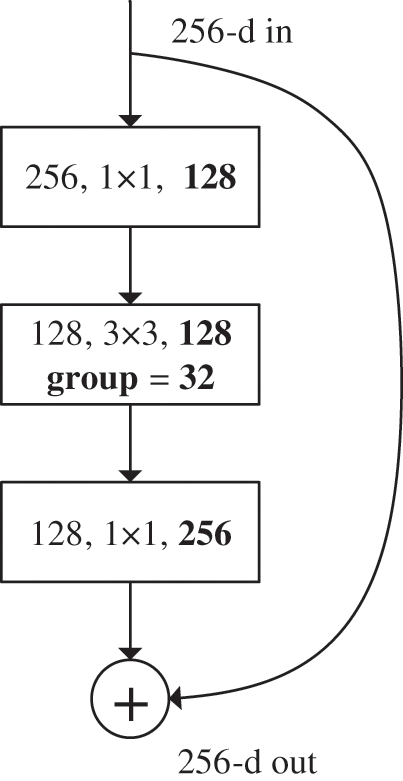
Figure 5: A block of ResNeXt with C = 32
There is more structured information between classes in the soft probabilities output of the “teacher” network, and the critical idea of knowledge distillation is to use this information as supervisory signals to train the “student” network [38]. For example, if an image is predicted with high probability in multiple categories, it might mean that the image must be located near the decision boundary between these classes. By forcing the output of the “student” network to be close to the probabilities, the student acquires knowledge from the teacher. The structure of knowledge distillation is shown in Fig. 6.
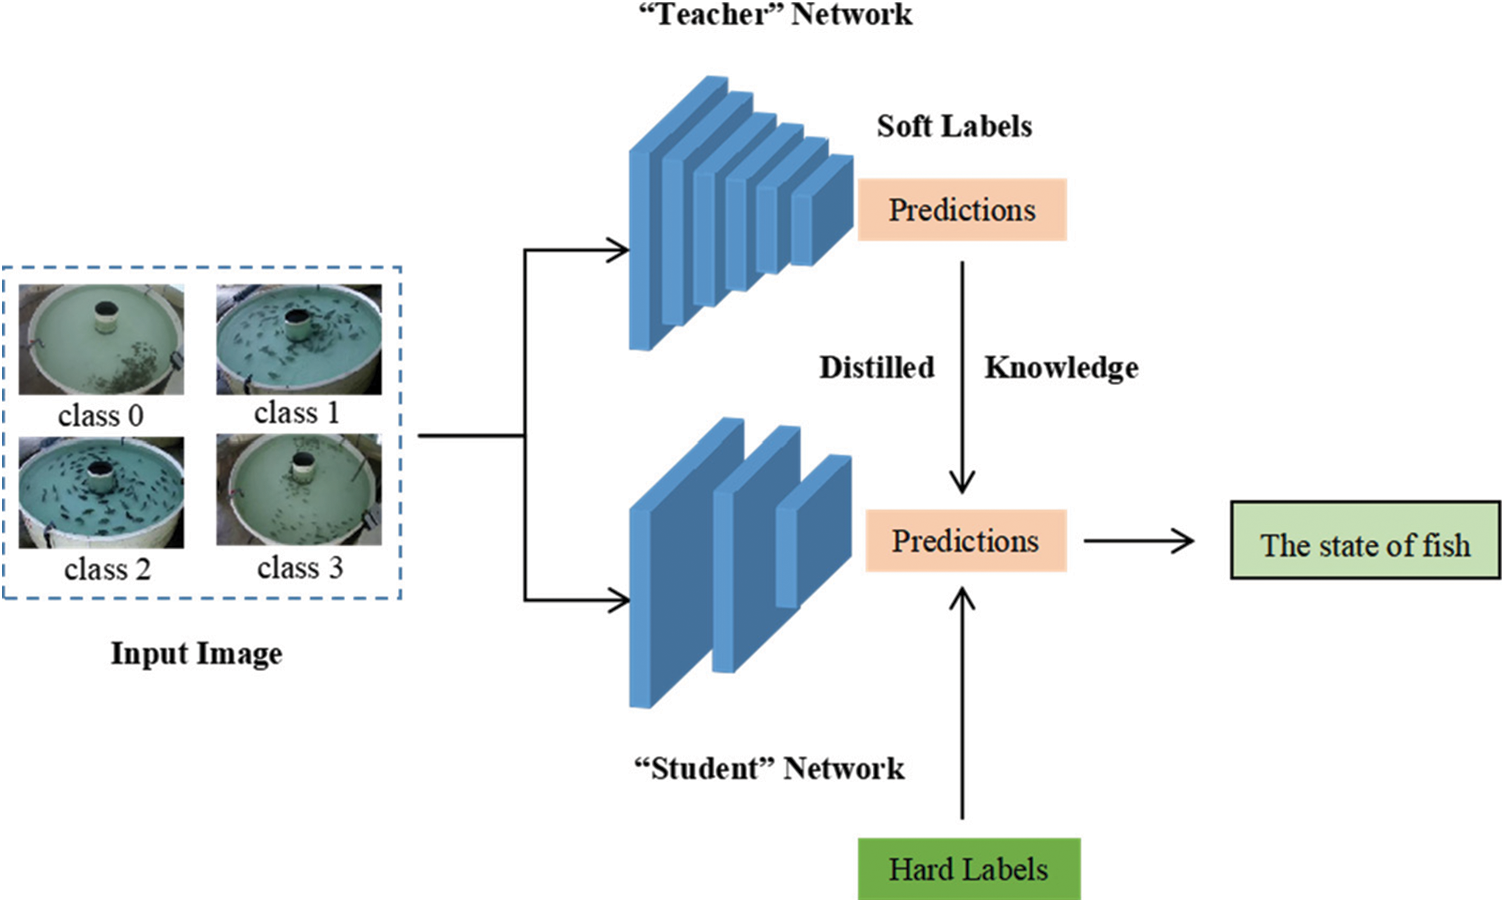
Figure 6: The structure of knowledge distillation
Concretely, when an image is fed into the model, the model will give the score of the image belonging to each category. The traditional softmax classifier maps the output classification results into the interval (0, 1), representing the probability of belonging to each category. It is calculated as shown in Eq. (2).
Since the model is well trained, it predicts an output distribution with a high probability on the correct class and with probabilities close to zero on other classes. The useful inter-class information will disappear in the training process. Therefore, Hinton et al. [38] propose the temperature scaling to “soften” these probabilities:
where T is a hyperparameter. When the value of T is higher, a softer probability distribution over classes is produced.
Knowledge distillation uses a mixed relative loss function, KD Loss, as shown in Eq. (4).
where
Knowledge distillation takes the softened output information of the teacher model as the dark knowledge to guide the student model so that the simple student model with fewer parameters can also have a similar performance as the teacher network. We establish the ResNeXt-GhostNet framework based on the idea of knowledge distillation, and the model KD-GhostNet is proposed. The proposed novel method combines the advantages of knowledge distillation and the two networks.
The fish stress state recognition model is based on the PyTorch framework, and four 2080Ti GPUs are used for the experiment. The hyperparameters of the training process are set to be consistent in the experiment. The batch size is 32 in each iteration. The learning rate is initially set to 1e−4 and decays according to the cosine annealing strategy with a period of 14 epochs and a minimum learning rate of 5e−6. The momentum is set to 0.99, and the weight decay is set to 5e−4. The experimental results are presented in the following subsections.
4.1 Proposed Recognition Method
4.1.1 Knowledge Distillation Training
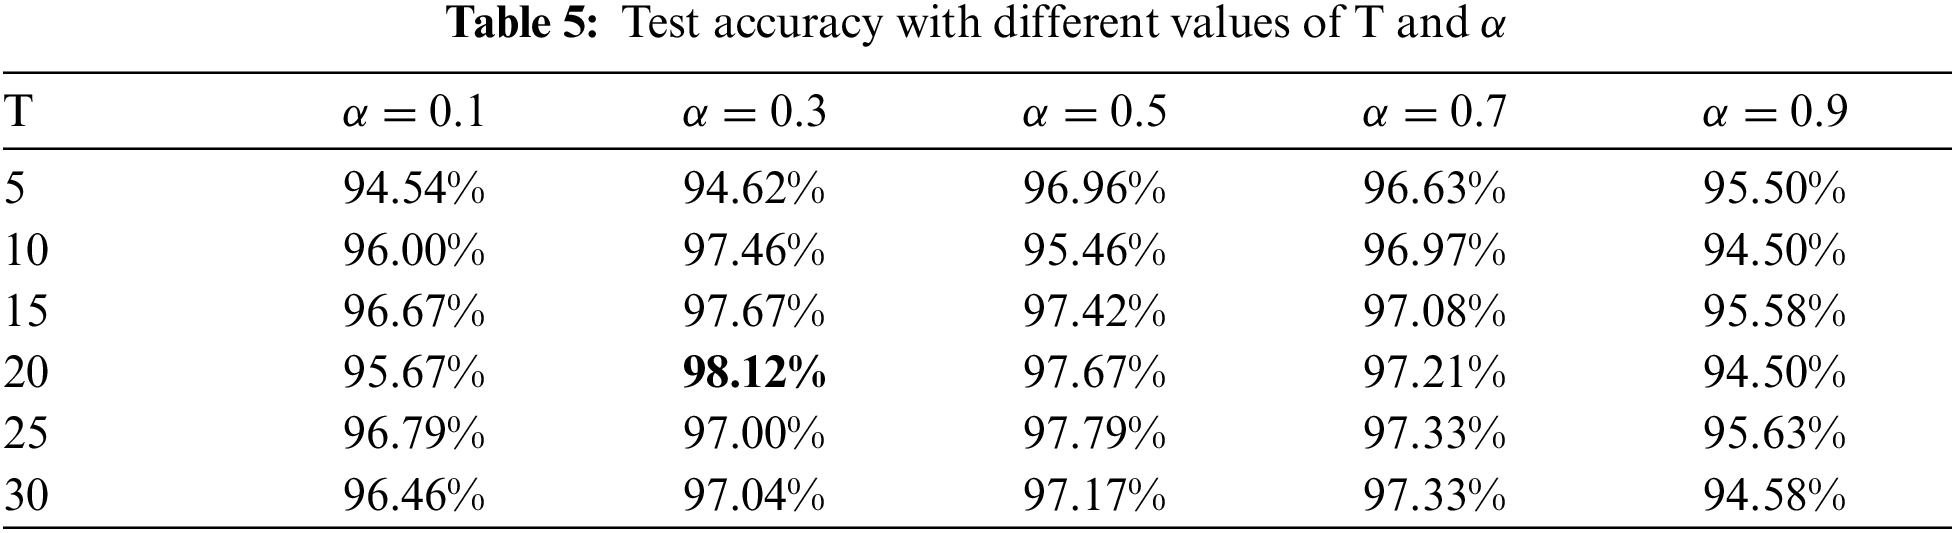
In knowledge distillation, two parameters affect the student model's accuracy: the temperature T and the proportionality coefficient α. As the value of T becomes larger, the categorical distribution tends to be more even. An example of categorical probability distributions of softmax output with different temperatures is shown in Fig. 7. α is the relative weight on the cross-entropy for the hard targets. (1-α) is the relative weight on the Kullback-Leibler Divergence for the soft targets. The same group of teacher and student models are used to analyze the influence of temperature T and proportion coefficient α on the distillation effect.
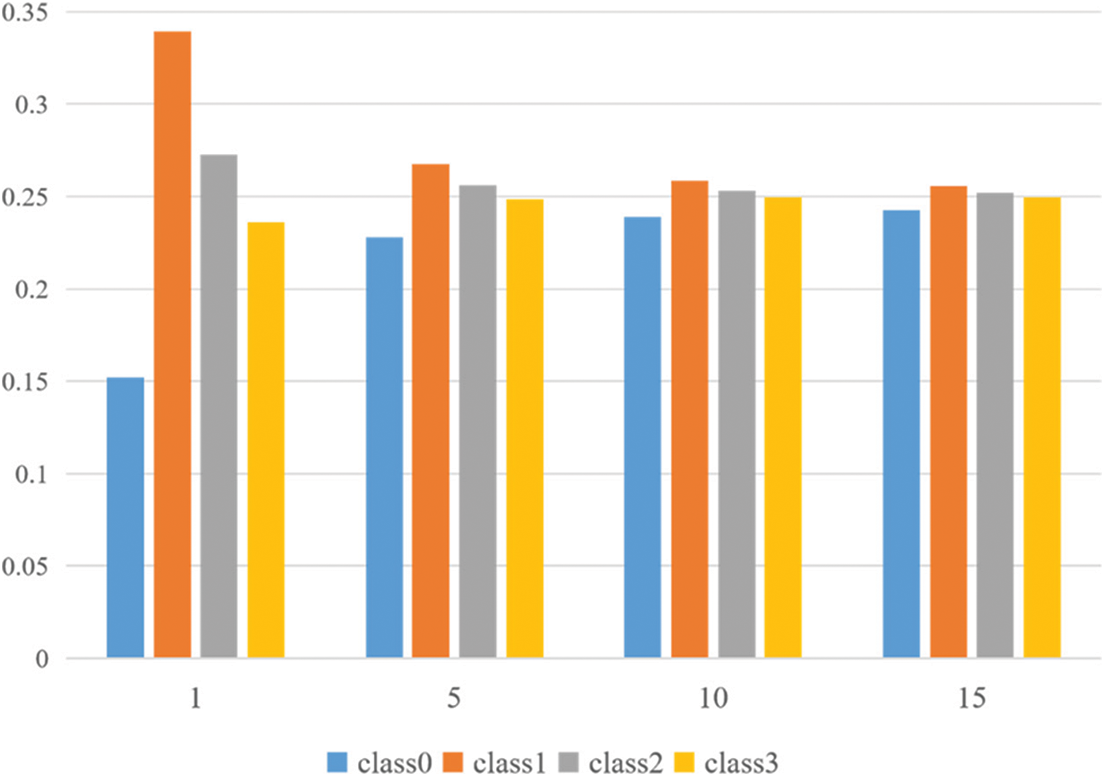
Figure 7: An example of categorical probability distributions of softmax output with different temperatures. Class 0 represents the stress state in feeding. Class 1 represents the normal state in feeding. Class 2 represents the stress state in non-feeding. Class 3 represents the normal state in non-feeding
We choose the value of T in {5, 10, 15, 20, 25, 30} and the value of α in {0.1, 0.3, 0.5, 0.7, 0.9}. As shown in Table 5, when α is 0.3 and T is 20, the model's verification accuracy is 98.12%.
4.1.2 The Teacher-Student Structure
Knowledge distillation trains a simple network (the student) by using the output of the trained teacher model as a supervisory signal. In the current research on knowledge distillation, there is no clear principle for the selection of teachers. To explore the best combination of teacher and student for the dataset presented in this research, different kinds of neural networks are used to guide the student, including ResNeXt [37], VGGNet [39], Wide_ResNet [40], DenseNet [41], ResNet [42], MobileNet [43], and GhostNet. The results based on knowledge distillation are shown in Table 6. According to the overall statistical data, eight of them can effectively guide the student among fourteen teacher networks. Therefore, the choice of the teacher-student structure will directly affect the effectiveness of knowledge distillation.

As shown in Table 6, when the depths of neural networks increase, these neural networks have stronger nonlinear expression ability, so their recognition accuracy on the fish school state dataset increases. However, it may not lead to better student accuracy. When DenseNet, Wide_ResNet, and ResNeXt are the teacher, the accuracy of students is improved as the depth of the teacher increases. However, different experimental results are obtained when VGGNet and ResNet are selected as the teacher.
Researchers usually use deep neural networks as teacher models to guide the training of shallow networks. In this research, lightweight neural networks are also used as teacher models. From the experimental results, it can be seen that when a lightweight neural network is used as a teacher, it can also guide students to achieve higher recognition accuracy, even more effective than some deep neural networks.
Theoretically, the student will improve the recognition accuracy by learning from information on the similarities among categories provided by the teacher. However, according to the experimental results, it is found that an inappropriate teacher-student framework reduces the accuracy of the fish stress state recognition model. In the above experiments, When ResNeXt-GhostNet is selected as a framework with T = 20 and α = 0.3, the model's verification accuracy is improved from 94.17% to 98.12%. The following section provides a comprehensive evaluation of the established model.
4.2 Overall Performance for Fish Stress State Recognition
This section explores the influence of knowledge distillation on fish stress state recognition. To be consistent with our proposed method and ensure the fairness of the experiment, the hyperparameters of the training process are set to be consistent.
In deep learning, the confusion matrix is a visualization tool to evaluate the classification quality of models. We can calculate the Accuracy, Recall, Precision, and F1-score from this matrix. Accuracy is the ratio of the sum of correctly and incorrectly predicted class instances (TP + TN) to the total instances (TP + FP + FN + TN). Precision is the ratio of a correctly predicted class instance (TP) to the total number of instances that are predicted by the specific class (TP + FP). Recall is the ratio of a correctly predicted class instance (TP) to the total number of instances associated with all classes (TP + FN). When both Recall and Precision are averaged according to their weight, it is F1-score. These evaluation parameters are expressed in Eqs. (5)–(8).
where, TP = true positive, TN = true negative, FP = false positive, and FN = false negative.
By using the confusion matrix, the classification performance of GhostNet and KD-GhostNet on the test data is obtained, as shown in Fig. 8. Comprehensive classification performance is summarized in Table 7.
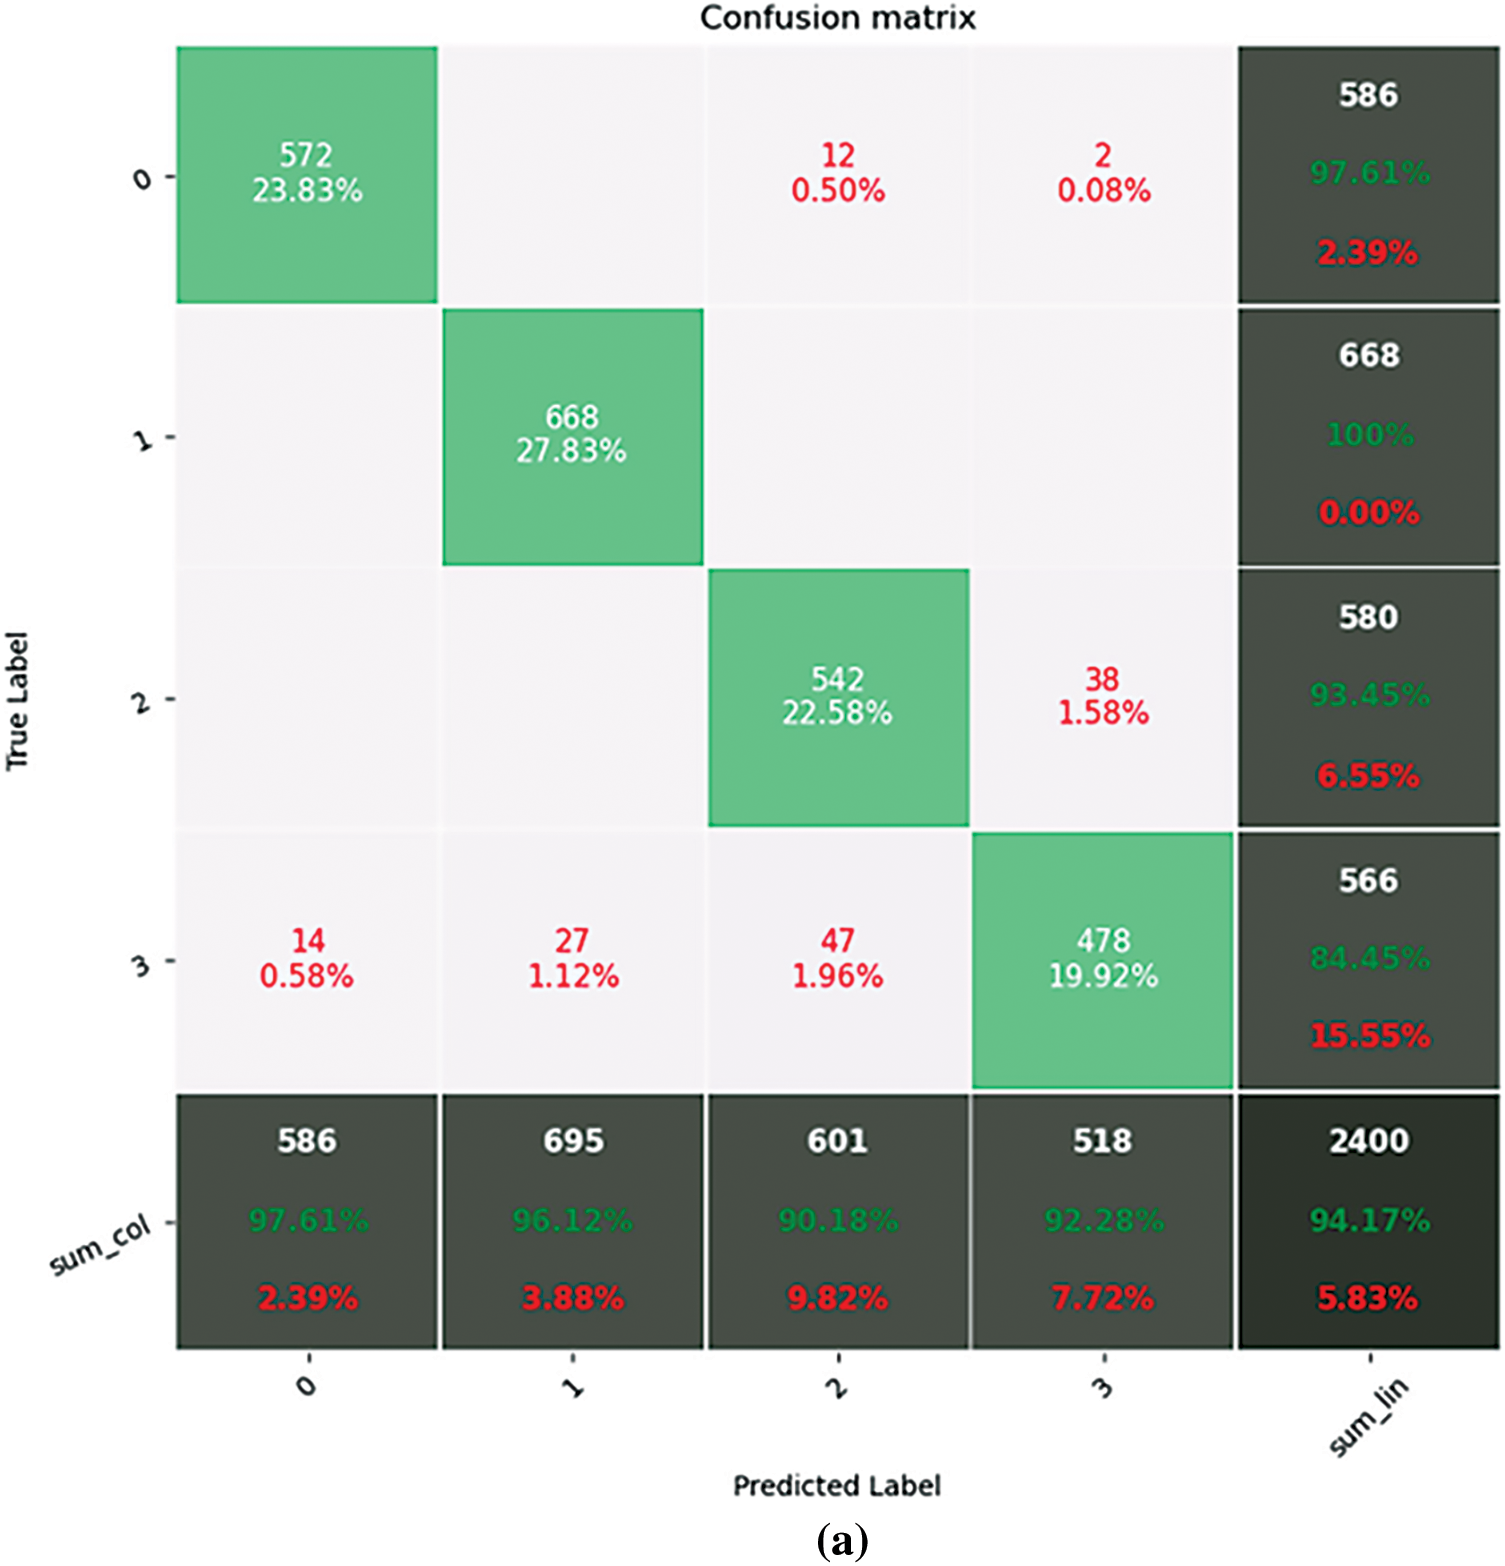
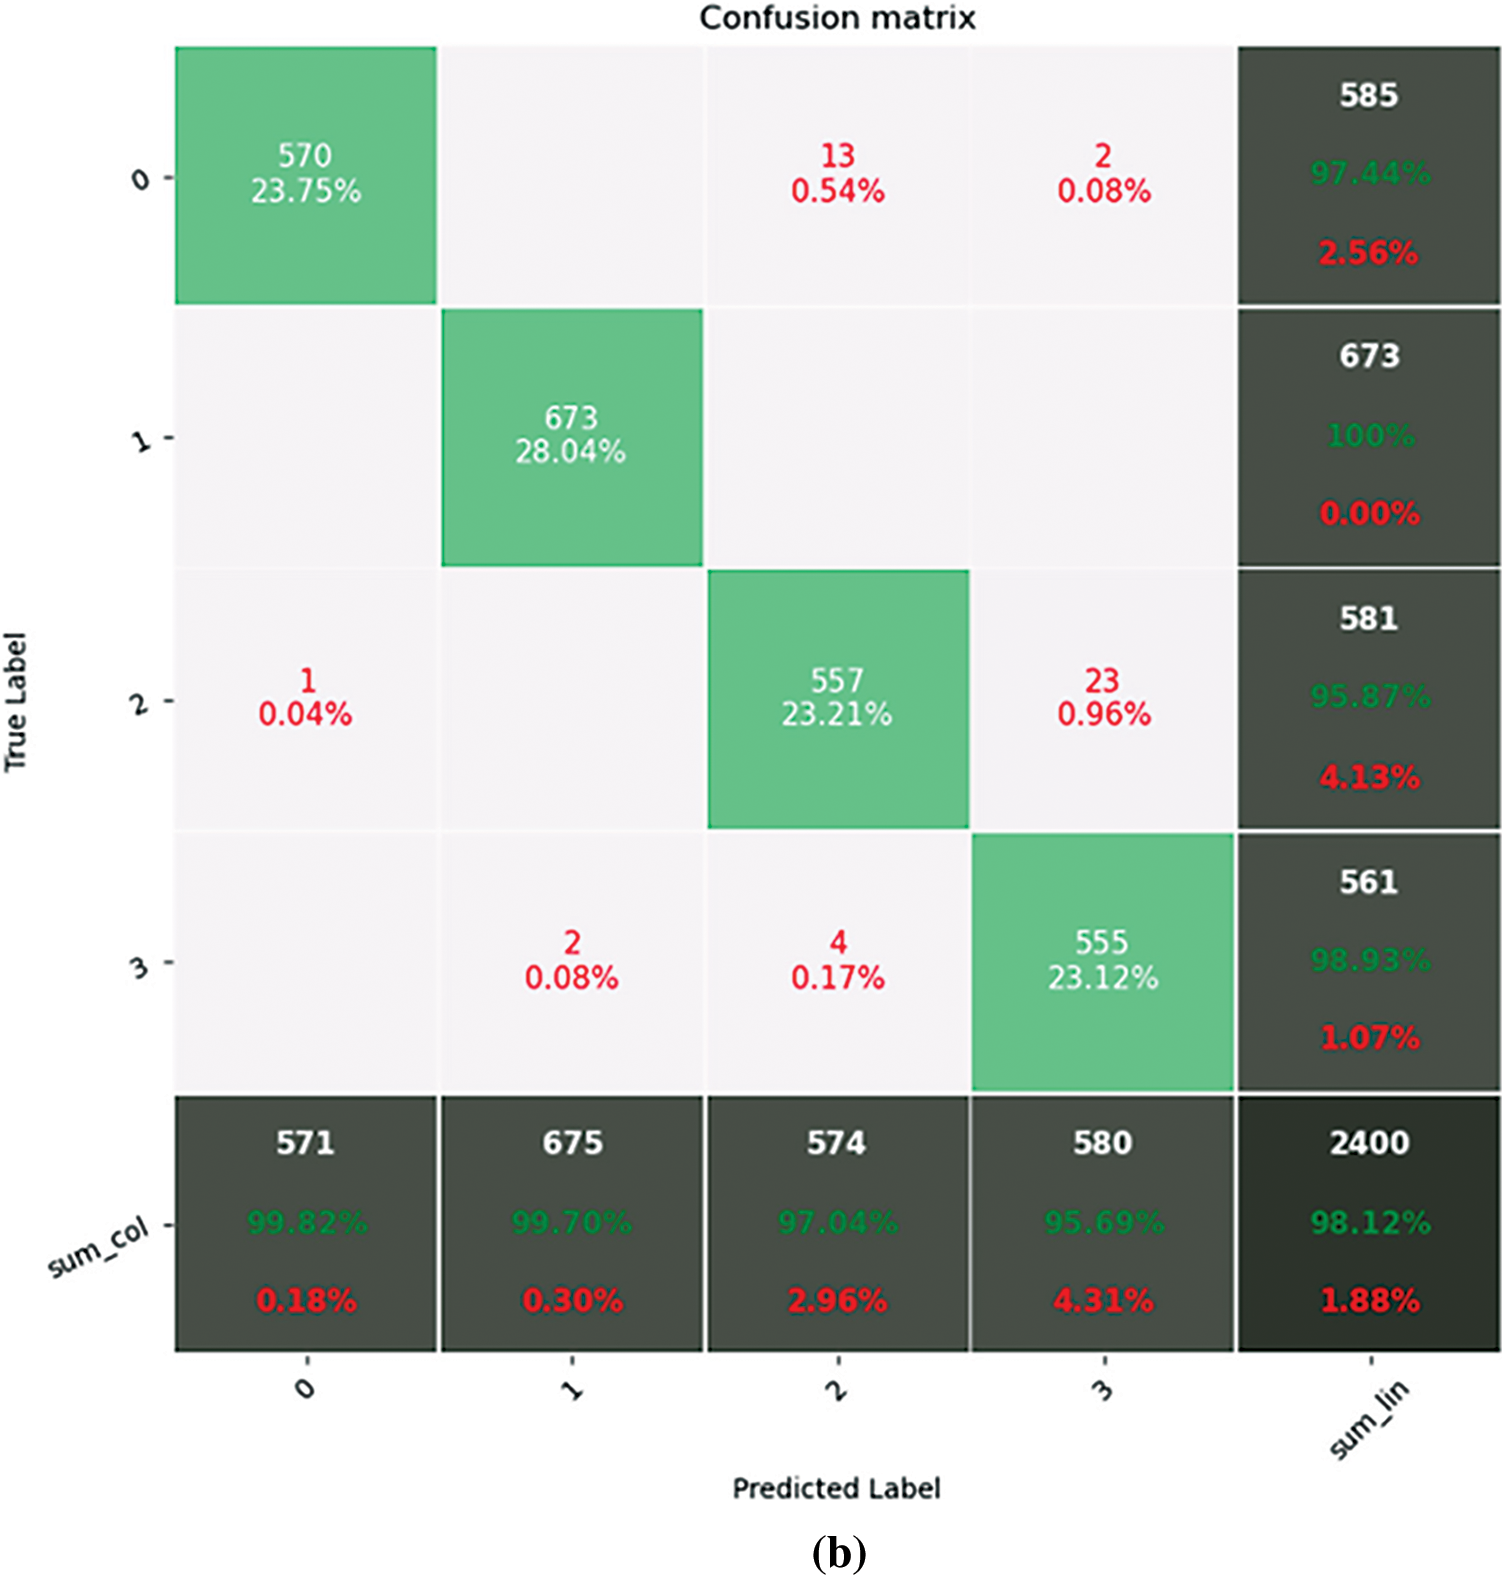
Figure 8: Confusion matrix: (a) GhostNet, (b) KD-GhostNet. 0 represents the stress state in feeding. 1 represents the normal state in feeding. 2 represents the stress state in non-feeding. 3 represents the normal state in non-feeding
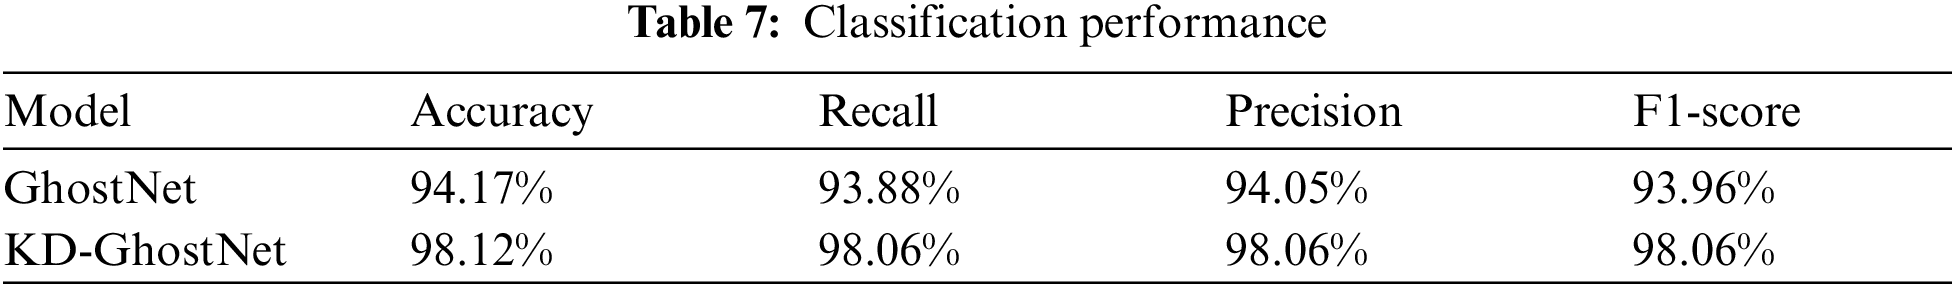
On the green diagonals of the confusion matrices are correct predictions, and all other entries are wrong predictions. From the matrices, the images from Class 1 are the easiest to recognize, and they are not misclassified. 2.56% of images in Class 0 are incorrectly identified as Class 2 or Class 3. 4.13% of images in Class 2 are incorrectly identified as Class 0 or Class 3. 1.07% of images in Class 0 are incorrectly identified as Class 1 or Class 2. According to the classification performance, it can be seen that the Accuracy, Recall, Precision, and F1-score of the student model are significantly improved via knowledge distillation techniques. Specifically, the Accuracy of the model is improved by 3.41%. The Recall and Precision of the model are both 98.06%. The F1-score of the model is increased from 93.96% to 98.06%.
The results demonstrate that GhostNet gains more information between classes by learning from the softening probability of ResNeXt-101 (32 × 8d) with a high temperature, and its recognition accuracy is improved from 94.17% to 98.12%.
4.2.2 Comparison with Other Models
To verify the overall performance of the proposed method, KD-GhostNet is compared with existing deep learning models, including large and complex neural networks and lightweight neural networks. The basic parameters of the models are shown in Tables 8 and 9. Figs. 9 and 10 summarize the performance of all models on the fish state dataset, where FLOPs represent the number of parameter operations. The larger the value, the more complex the model. Parameters represent the model's parameters, and Accuracy represents the model's recognition accuracy on the fish state dataset.
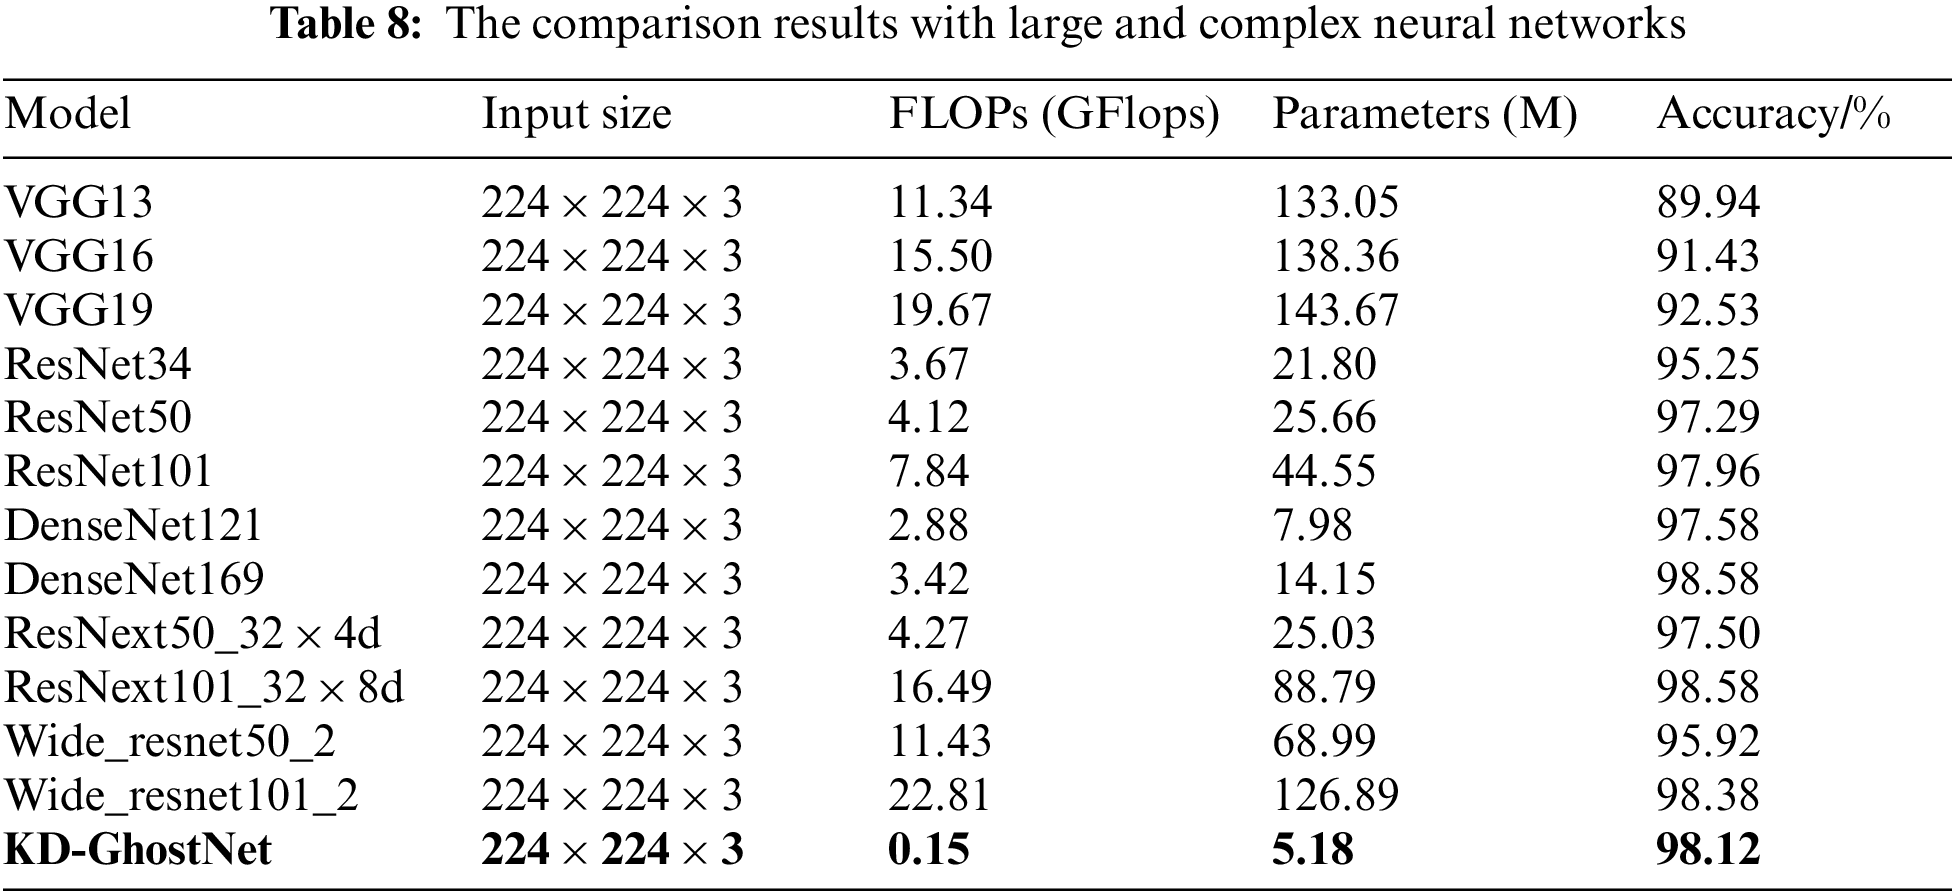

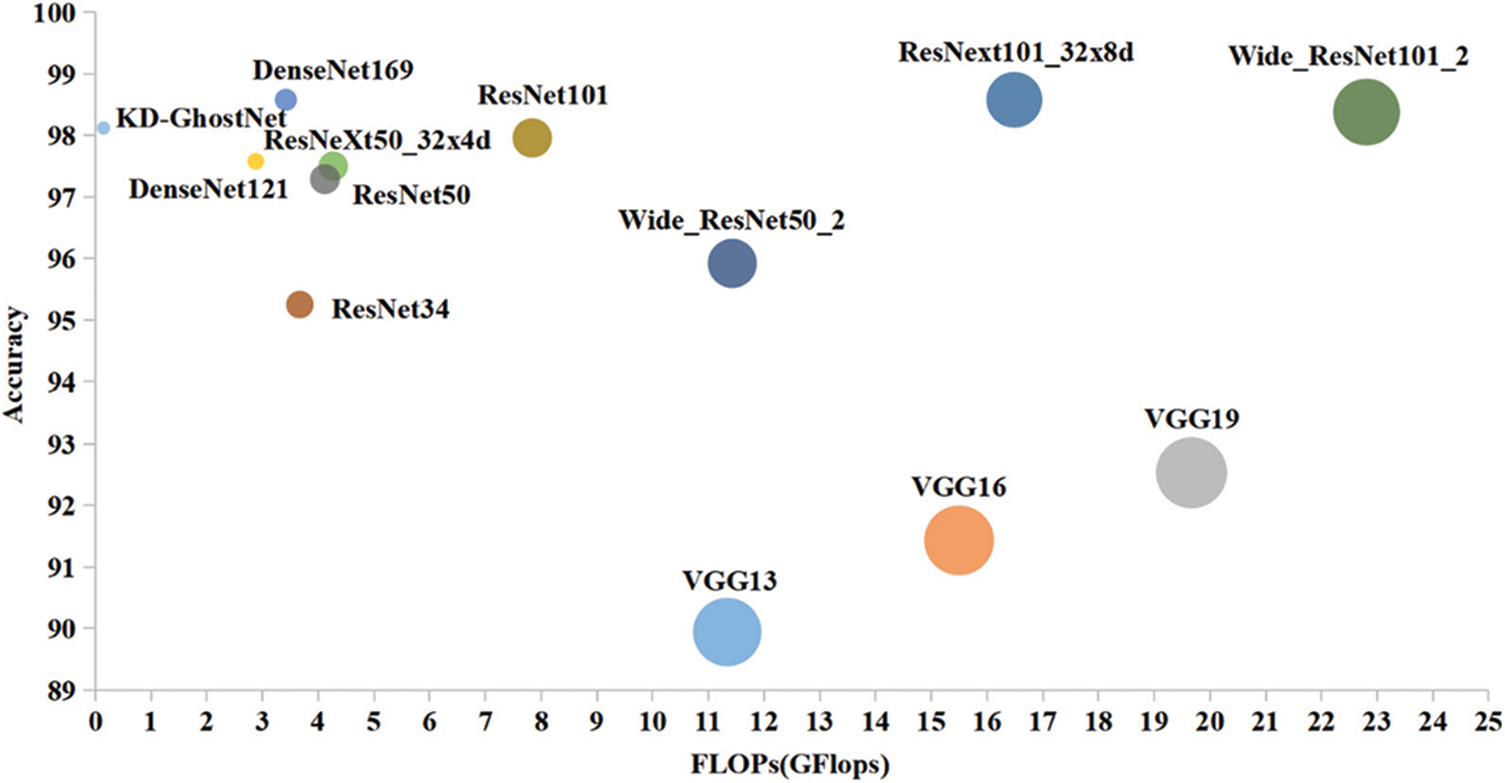
Figure 9: Comparison with large and complex neural networks in terms of classification accuracy, FLOPs, and the number of network parameters, indicated by radii of circles
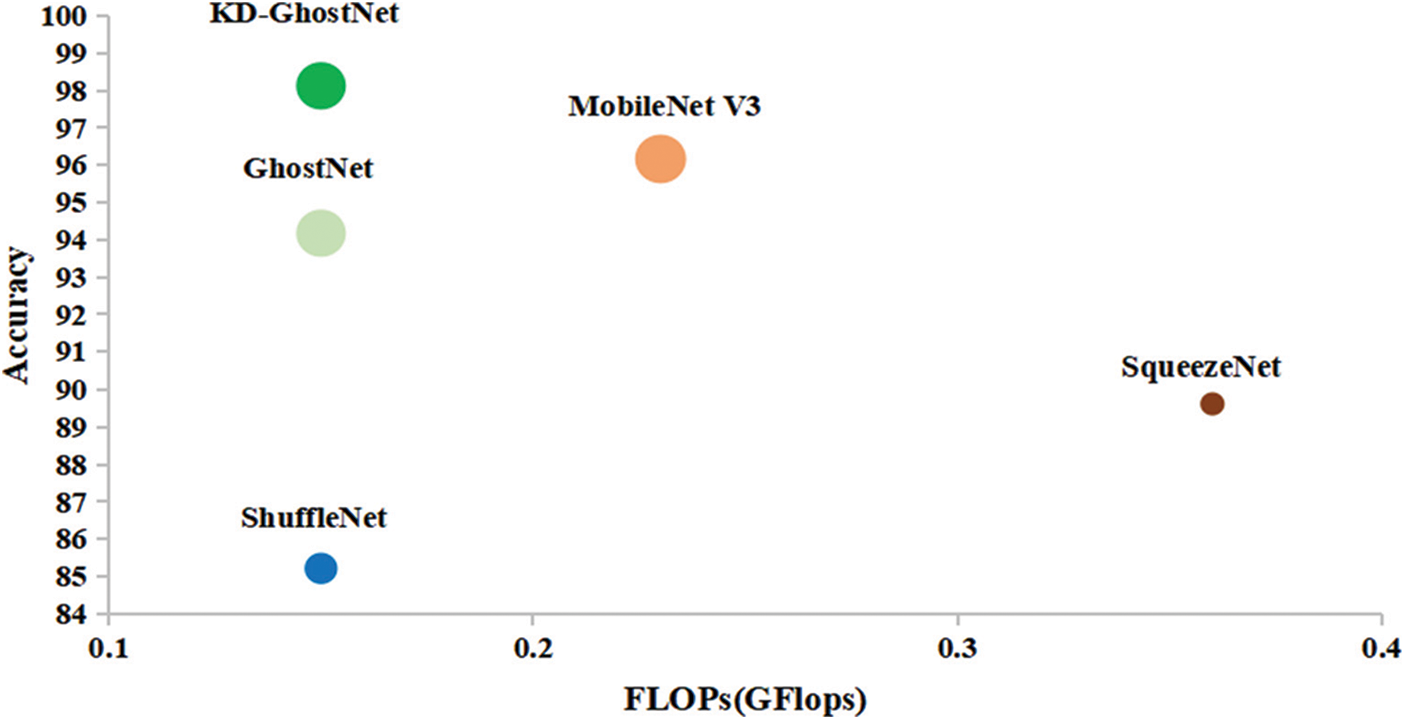
Figure 10: Comparison with lightweight neural networks in terms of classification accuracy, FLOPs, and the number of network parameters, indicated by radii of circles
In Table 8, twelve models are trained for fish stress state recognition using existing deep neural networks, including VGG13, VGG16, VGG19, ResNet34, ResNet50, ResNet101, DenseNet121, DenseNet169, ResNext50_32 × 4d, ResNext101_32 × 8d, Wide_resnet50_2, and Wide_resnet101_2. As the depths of the networks increase, the accuracy of these models improves significantly. However, these networks require a large amount of computation and parameters. As shown in Table 8, the proposed model has only 5.18 M parameters and requires 0.15 G FLOPs to process an image of size 224 × 224, and its accuracy is better than 75% of the models. The recognition accuracy of KD-GhostNet is only 0.46% lower than DenseNet169 and ResNext101_32 × 8d. Therefore, the proposed model (KD-GhostNet) based on the knowledge distillation method achieves a similar recognition performance with the fewest parameters and calculations compared with most other deep neural networks. The advantages of the model can be seen clearly in Fig. 9.
As shown in Table 9, ShuffleNet [44], SqueezeNet [45], MobileNet, and GhostNet (the baseline model before knowledge distillation) are trained on the same fish state dataset. The accuracy of KD-GhostNet based on knowledge distillation is 3.95% higher than the baseline network. Although the computation and parameters of SqueezeNet and ShuffleNet are lower than those of the proposed model, their recognition accuracy is less than 90%. Compared with MobileNet, KD-GhostNet has less computation and fewer parameters, and its recognition accuracy on the dataset is 98.12%, which is 1.96% higher than MobileNet. According to the experimental results and Fig. 10, KD-GhostNet has outstanding comprehensive performance in these lightweight neural networks.
Based on our experiments, it can be seen clearly that the proposed KD-GhostNet has an accuracy of 98.12% and is better than the existing CNN models in terms of the number of parameters and computation. Compared with other models, KD-GhostNet is more suitable for deployment in resource-constrained devices or real-time applications.
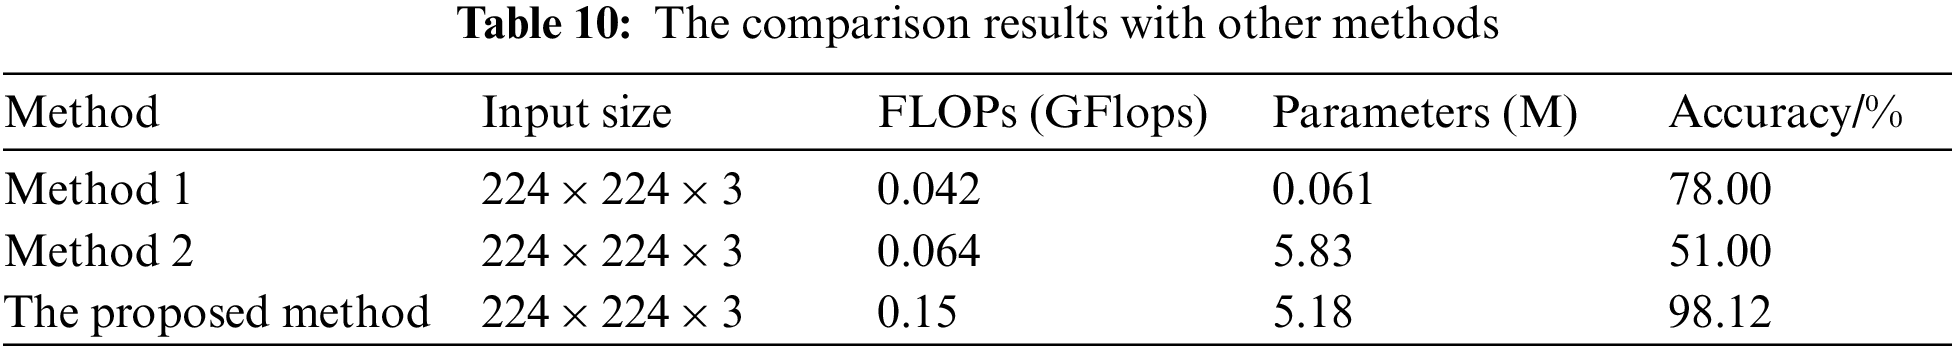
To further demonstrate the advantages of our method, we compare it with fish school behavior recognition methods proposed by Zhou et al. [13] and Han et al. [12]. In Zhou et al. research, a LeNet model is used to evaluate four levels of fish school feeding intensity and achieves 90% accuracy on feeding intensity datasets. The LeNet algorithm is applied to our dataset only achieves 78.00% accuracy. In Han et al. research, the fish spatial distribution image and optical flow energy map are spliced up and down to form a new image reflecting the spatiotemporal information. Then the research sends the spatiotemporal fusion image to a CNN, and realize the fish shoal's behavior state recognition with an overall accuracy of 82.5%. Due to the different types of data obtained, the method is not fully reproduced. Applying the proposed CNN to our dataset only achieves 51.00% accuracy. The method proposed by Zhou et al. is denoted as Method 1. The method proposed by Han et al. is denoted as Method 2. The experimental results are shown in Table 10. The results reveal that our proposed method is significantly superior to the methods proposed by Zhou et al. and Han et al.
The proposed method can be applied to recognize the oplegnathus punctatus’ stress states in actual farming scenarios, and it can play an early warning role in the aquaculture process. In addition, these fish are in different growth periods and breeding densities. One group consists of about 200 fish weighing 50 grams each, and the other group consists of approximately 80 fish weighing 150 grams each. Therefore, our model is more suitable for the actual breeding process compared with previous works.
Although our proposed model has significant advancement compared with other methods, we must objectively acknowledge that there are certain limitations in this research. First, our model cannot realize the stress state detection of all species of fish, because different fish species may have different stress responses. It is also difficult for our model to recognize the stress states of fish during all growth cycles. Moreover, changes in breeding density may affect the accuracy of our model. In future work, we will collect a large dataset to cover a wider range of growth cycles, species, and densities. The algorithm will be retrained on the diverse dataset to show a good performance in real scenarios.
This research presents a novel method based on knowledge distillation for fish school stress state recognition. We propose the best combination of teacher and student in the knowledge distillation architecture, which are ResNeXt101 and GhostNet. The lightweight network (GhostNet) obtains the additional inter-class information by mimicking the soft probabilities output of the well-trained fish stress state recognition network (ResNeXt101). In addition, the value of T and α can affect the quality of inter-class information transferred. The proposed method is used to detect fish school stress states in real aquaculture scenarios. The experimental results show that the model has excellent recognition performance (the test accuracy is 98.12% on datasets) with low computation cost and fewer parameters benefited from the introduction of knowledge distillation. Therefore, the proposed method is suitable for deployment in resource-constrained devices or real-time applications. It offers practical implications for implementing intelligent fish behavior analysis and smart aquaculture. Our future work will explore a video analysis model based on spatiotemporal data and further refine the behavior state of fish schools.
Acknowledgement: We thank the associate editor and the reviewers for their useful feedback that improved this research. Furthermore, we are grateful to Professor Yanqing Duan for her proofreading and guidance on the whole article, who is from the University of Bedfordshire in the UK.
Funding Statement: This work is supported by the National Science Foundation of China ‘Analysis and feature recognition on feeding behavior of fish school in facility farming based on machine vision’ (No. 62076244), the National Key R&D Program of China ‘Next generation precision aquaculture: R&D on intelligent measurement, control and equipment technologies’ (China Grant No. 2017YFE0122100).
Conflicts of Interest: The authors declare that they have no conflicts of interest to report the present study.
1. Schreck, C. B., Tort, L. (2016). The concept of stress in fish. Fish Physiology, 35, 1–34. DOI 10.1016/B978-0-12-802728-8.00001-1. [Google Scholar] [CrossRef]
2. Antychowicz, J., Pekala, A. (2015). Stres i zależne od stresu bakteryjne choroby ryb. Życie Weterynaryjne, 90, 450–460. [Google Scholar]
3. Leal, E., Fernández-Durán, B., Guillot, R., Ríos, D., Cerdá-Reverter, J. M. (2011). Stress-induced effects on feeding behavior and growth performance of the sea bass (Dicentrarchus labraxA self-feeding approach. Journal of Comparative Physiology B, 181(8), 1035–1044. DOI 10.1007/s00360-011-0585-z. [Google Scholar] [CrossRef]
4. Conte, F. S. (2004). Stress and the welfare of cultured fish. Applied Animal Behaviour Science, 86(3–4), 205–223. DOI 10.1016/j.applanim.2004.02.003. [Google Scholar] [CrossRef]
5. Schreck, C. B., Olla, B. L., Davis, M. W. (1997). Behavioral responses to stress. In: Fish stress and health in aquaculture, vol. 62, pp. 145–170. UK: Cambridge University Press. [Google Scholar]
6. Braithwaite, V. A., Ebbesson, L. O. E. (2014). Pain and stress responses in farmed fish. Revue Scienifique Et Technique-Offiece International Des Epizooties, 33(1), 245–253. DOI 10.20506/rst.33.1.2285. [Google Scholar] [CrossRef]
7. Reig, L., Ginovart, M., Flos, R. (2003). Modification of the feeding behaviour of sole (Solea sole) through the addition of a commercial flavour as an alternative to betaine. Aquatic Living Resources, 16(4), 370–379. DOI 10.1016/S0990-7440(03)00062-7. [Google Scholar] [CrossRef]
8. Skiftesvik, A. B. (1992). Changes in behaviour at onset of exogenous feeding in marine fish larvae. Canadian Journal of Fisheries and Aquatic Sciences, 49(8), 1570–1572. DOI 10.1139/f92-174. [Google Scholar] [CrossRef]
9. Stradmeyer, L. (1989). A behavioural method to test feeding responses of fish to pelleted diets. Aquaculture, 79(1–4), 303–310. DOI 10.1016/0044-8486(89)90471-7. [Google Scholar] [CrossRef]
10. Rathi, D., Jain, S., Indu, S. (2017). Underwater fish species classification using convolutional neural network and deep learning. 2017 Ninth International Conference on Advances in Pattern Recognition (ICAPR), pp. 1–6. Indian Stat Inst Bangalore, Bangalore, INDIA. [Google Scholar]
11. Rauf, H. T., Lali, M. I. U., Zahoor, S., Shah, S. Z. H., Rehman, A. U. et al. (2019). Visual features based automated identification of fish species using deep convolutional neural networks. Computers and Electronics in Agriculture, 167, 105075. DOI 10.1016/j.compag.2019.105075. [Google Scholar] [CrossRef]
12. Han, F., Zhu, J., Liu, B., Zhang, B., Xie, F. (2020). Fish shoals behavior detection based on convolutional neural network and spatiotemporal information. IEEE Access, 8, 126907–126926. DOI 10.1109/ACCESS.2020.3008698. [Google Scholar] [CrossRef]
13. Zhou, C., Xu, D., Chen, L., Zhang, S., Sun, C. et al. (2019). Evaluation of fish feeding intensity in aquaculture using a convolutional neural network and machine vision. Aquaculture, 507, 457–465. DOI 10.1016/j.aquaculture.2019.04.056. [Google Scholar] [CrossRef]
14. Zhao, J., Bao, W., Zhang, F., Zhu, S., Liu, Y. et al. (2018). Modified motion influence map and recurrent neural network-based monitoring of the local unusual behaviors for fish school in intensive aquaculture. Aquaculture, 493, 165–175. DOI 10.1016/j.aquaculture.2018.04.064. [Google Scholar] [CrossRef]
15. Liu, Y., Zhang, Q., Song, L., Chen, Y. (2019). Attention-based recurrent neural networks for accurate short-term and long-term dissolved oxygen prediction. Computers and Electronics in Agriculture, 165, 104964. DOI 10.1016/j.compag.2019.104964. [Google Scholar] [CrossRef]
16. Choudhary, T., Mishra, V., Goswami, A., Sarangapani, J. (2020). A comprehensive survey on model compression and acceleration. Artificial Intelligence Review, 53(7), 5113–5155. DOI 10.1007/s10462-020-09816-7. [Google Scholar] [CrossRef]
17. Gabriel, U. U., Akinrotimi, O. A. (2011). Management of stress in fish for sustainable aquaculture development. Researcher, 3(4), 28–38. [Google Scholar]
18. Kane, A. S., Salierno, J. D., Gipson, G. T., Molteno, T. C., Hunter, C. (2004). A video-based movement analysis system to quantify behavioral stress responses of fish. Water Research, 38(18), 3993–4001. DOI 10.1016/j.watres.2004.06.028. [Google Scholar] [CrossRef]
19. Papadakis, V. M., Papadakis, I. E., Lamprianidou, F., Glaropoulos, A., Kentouri, M. (2012). A computer-vision system and methodology for the analysis of fish behavior. Aquacultural Engineering, 46, 53–59. DOI 10.1016/j.aquaeng.2011.11.002. [Google Scholar] [CrossRef]
20. Creton, R. (2009). Automated analysis of behavior in zebrafish larvae. Behavioural Brain Research, 203(1), 127–136. DOI 10.1016/j.bbr.2009.04.030. [Google Scholar] [CrossRef]
21. Gui, F., Li, Y., Dong, G., Guan, C. (2006). Application of CCD image scanning to sea-cage motion response analysis. Aquacultural Engineering, 35(2), 179–190. DOI 10.1016/j.aquaeng.2006.01.003. [Google Scholar] [CrossRef]
22. Stien, L. H., Bratland, S., Austevoll, I., Oppedal, F., Kristiansen, T. S. (2007). A video analysis procedure for assessing vertical fish distribution in aquaculture tanks. Aquacultural Eengineering, 37(2), 115–124. DOI 10.1016/j.aquaeng.2007.03.002. [Google Scholar] [CrossRef]
23. Pinkiewicz, T. H., Purser, G. J., Williams, R. N. (2011). A computer vision system to analyse the swimming behaviour of farmed fish in commercial aquaculture facilities: A case study using cage-held atlantic salmon. Aquacultural Engineering, 45(1), 20–27. DOI 10.1016/j.aquaeng.2011.05.002. [Google Scholar] [CrossRef]
24. Xu, J., Liu, Y., Cui, S., Miao, X. (2006). Behavioral responses of tilapia (Oreochromis niloticus) to acute fluctuations in dissolved oxygen levels as monitored by computer vision. Aquacultural Engineering, 35(3), 207–217. DOI 10.1016/j.aquaeng.2006.02.004. [Google Scholar] [CrossRef]
25. Xiao, G., Zhang, W., Zhang, Y. L., Chen, J. J., Huang, S. S. et al. (2011). Online monitoring system of fish behavior. 2011 11th International Conference on Control, Automation and Systems, pp. 1309–1312. South Korea. [Google Scholar]
26. Xiao, G., Feng, M., Cheng, Z., Zhao, M., Mao, J. et al. (2015). Water quality monitoring using abnormal tail-beat frequency of crucian carp. Ecotoxicology and Environmental Safety, 111, 185–191. DOI 10.1016/j.ecoenv.2014.09.028. [Google Scholar] [CrossRef]
27. Israeli, D., Kimmel, E. (1996). Monitoring the behavior of hypoxia-stressed Carassius auratus using computer vision. Aquacultural Engineering, 15(6), 423–440. DOI 10.1016/S0144-8609(96)01009-6. [Google Scholar] [CrossRef]
28. Barry, M. J. (2012). Application of a novel open-source program for measuring the effects of toxicants on the swimming behavior of large groups of unmarked fish. Chemosphere, 86(9), 938–944. DOI 10.1016/j.chemosphere.2011.11.011. [Google Scholar] [CrossRef]
29. Zhou, C., Zhang, B., Lin, K., Xu, D., Chen, C. et al. (2017). Near-infrared imaging to quantify the feeding behavior of fish in aquaculture. Computers and Electronics in Agriculture, 135, 233–241. DOI 10.1016/j.compag.2017.02.013. [Google Scholar] [CrossRef]
30. Ye, Z., Zhao, J., Han, Z., Zhu, S., Li, J. et al. (2016). Behavioral characteristics and statistics-based imaging techniques in the assessment and optimization of tilapia feeding in a recirculating aquaculture system. Transactions of the ASABE, 59(1), 345–355. DOI 10.13031/issn.2151-0032. [Google Scholar] [CrossRef]
31. Zhao, J., Gu, Z., Shi, M., Lu, H., Li, J. et al. (2016). Spatial behavioral characteristics and statistics-based kinetic energy modeling in special behaviors detection of a shoal of fish in a recirculating aquaculture system. Computers and Electronics in Agriculture, 127, 271–280. DOI 10.1016/j.compag.2016.06.025. [Google Scholar] [CrossRef]
32. Duarte, S., Reig, L., Oca, J. (2009). Measurement of sole activity by digital image analysis. Aquacultural Engineering, 41(1), 22–27. DOI 10.1016/j.aquaeng.2009.06.001. [Google Scholar] [CrossRef]
33. Sadoul, B., Mengues, P. E., Friggens, N. C., Prunet, P., Colson, V. (2014). A new method for measuring group behaviours of fish shoals from recorded videos taken in near aquaculture conditions. Aquaculture, 430, 179–187. DOI 10.1016/j.aquaculture.2014.04.008. [Google Scholar] [CrossRef]
34. Liu, Z., Li, X., Fan, L., Lu, H., Liu, L. et al. (2014). Measuring feeding activity of fish in RAS using computer vision. Aquacultural Engineering, 60, 20–27. DOI 10.1016/j.aquaeng.2014.03.005. [Google Scholar] [CrossRef]
35. Chew, B. F., Eng, H. L., Thida, M. (2009). Vision-based real-time monitoring on the behavior of fish school. Conference on Machine Visual Applications, pp. 90–93. Yokohama, Japan. [Google Scholar]
36. Han, K., Wang, Y., Tian, Q., Guo, J., Xu, C. et al. (2020). Ghostnet: More features from cheap operations. Proceedings of the IEEE Conference on Computer Vision and Pattern Recognition, pp. 1577–1586. Seattle, WA, USA. [Google Scholar]
37. Xie, S., Girshick, R., Dollár, P., Tu, Z., He, K. (2017). Aggregated residual transformations for deep neural networks. Proceedings of the IEEE Conference on Computer Vision and Pattern Recognition, pp. 1492–1500. Honolulu, HI, USA. [Google Scholar]
38. Hinton, G., Vinyals, O., Dean, J. (2015). Distilling the knowledge in a neural network. arXiv preprint arXiv:1503.02531. [Google Scholar]
39. Simonyan, K., Zisserman, A. (2015). Very deep convolutional networks for large-scale image recognition. arXiv preprint arXiv:1409.1556. [Google Scholar]
40. Zagoruyko, S., Komodakis, N. (2016). Wide residual networks. Proceedings of the British Machine Vision Conference, pp. 87.1–87.12. York, UK. [Google Scholar]
41. Huang, G., Liu, Z., van der Maaten, L., Weinberger, K. Q. (2017). Densely connected convolutional networks. Proceedings of the IEEE Conference on Computer Vision and Pattern Recognition, pp. 4700–4708. Honolulu, HI, USA. [Google Scholar]
42. He, K., Zhang, X., Ren, S., Sun, J. (2016). Deep residual learning for image recognition. Proceedings of the IEEE Conference on Computer Vision and Pattern Recognition, pp. 770–778. Seattle, WA, USA. [Google Scholar]
43. Howard, A., Sandler, M., Chu, G., Chen, L. C., Chen, B. et al. (2019). Searching for mobilenetv3. Proceedings of the IEEE International Conference on Computer Vision, pp. 1314–1324. Seoul, South Korea. [Google Scholar]
44. Zhang, X., Zhou, X., Lin, M., Sun, J. (2018). Shufflenet: An extremely efficient convolutional neural network for mobile devices. Proceedings of the IEEE Conference on Computer Vision and Pattern Recognition, pp. 6848–6856. Salt Lake City, UT, USA. [Google Scholar]
45. Iandola, F. N., Han, S., Moskewicz, M. W., Ashraf, K., Dally, W. J. et al. (2016). SqueezeNet: AlexNet-level accuracy with 50× fewer parameters and <0.5 MB model size. arXiv preprint arXiv:1602.07360. [Google Scholar]
 | This work is licensed under a Creative Commons Attribution 4.0 International License, which permits unrestricted use, distribution, and reproduction in any medium, provided the original work is properly cited. |