| Computer Modeling in Engineering & Sciences |
DOI: 10.32604/cmes.2022.020178
ARTICLE
Analyzing the Urban Hierarchical Structure Based on Multiple Indicators of Economy and Industry: An Econometric Study in China
1School of Architecture, Tsinghua University, Beijing, 100084, China
2Beijing Tsinghua Tongheng Urban Planning & Design Institute, Beijing, 100085, China
*Corresponding Author: Jie Zhang. Email: zjzhangjie@mail.tsinghua.edu.cn
Received: 09 November 2021; Accepted: 29 November 2021
Abstract: For a city, analyzing its advantages, disadvantages and the level of economic development in a country is important, especially for the cities in China developing at flying speed. The corresponding literatures for the cities in China have not considered the indicators of economy and industry in detail. In this paper, based on multiple indicators of economy and industry, the urban hierarchical structure of 285 cities above the prefecture level in China is investigated. The indicators from the economy, industry, infrastructure, medical care, population, education, culture, and employment levels are selected to establish a new indicator system for analyzing urban hierarchical structure. The factor analysis method is used to investigate the relationship between the variables of selected indicators and obtain the score of each common factor and comprehensive scores and rankings for 285 cities above the prefecture level in China. According to the comprehensive scores, 285 cities above the prefecture level are clustered into 15 levels by using K-means clustering algorithm. Then, the hierarchical structure system of the cities above the prefecture level in China is obtained and corresponding policy implications are proposed. The results and implications can not only be applied to the urban planning and development in China but also offer a reference on other developing countries. The methodologies used in this paper can also be applied to study the urban hierarchical structure in other countries.
Keywords: Urban planning; hierarchical structure; prefecture-level city; factor analysis method; K-means clustering algorithm; China
For a country, the development level and perfection of infrastructure and transportation vary greatly among the cities, especially for the cities in China developing at flying speed. It is very necessary to analyze the hierarchical structure of the cities for urban construction improvement, urban planning, urban structure optimization and economic development. The extant literatures mainly focused on urban competitiveness and sustainable development in China and the countries around the world, and few studies pay attention to the comprehensive or integrated development or pattern of the city. To fill this gap, this paper investigates the hierarchical structure of the cities based on the urban comprehensive development and pattern with the indicators of economy and industry in detail, and more cities are involved to offer more references for the current overall development of the cities in a country.
The hierarchical structure of the cities can be studied by evaluating the urban development. Urban competitiveness and urban sustainability are used to evaluate urban development from a specific perspective. About urban competitiveness, Jiang et al. [1] considered the economic, social and environmental factors of urban competitiveness and presented a hierarchical indicator system with four levels to evaluate the competitiveness of 253 cities at the prefecture level or above of China in 2000. Singhal et al. [2] applied the Delphi technique and analytic hierarchy method with multi-criteria analysis to present a hierarchical model for city competitiveness, and explored the integrated regeneration and property-led business strategies of four cities in the United Kingdom. Singhal et al. [3] proposed a hierarchical model with 32 identified factors to examine the competitiveness of the cities in emerging economy for regeneration and business strategies in five different economic-level cities in India. Ni et al. developed a methodology to analyze the urban competitiveness for 25 principal cities in China during three periods from 1990 to 2009. They evaluated the competitiveness of inland and coastal cities in mega cities [4]. Shen et al. [5] explored the dynamic changes of urban competitiveness for 24 major cities during 1995 to 2008 in China, and 59 indicators were selected to measure urban competitiveness using the equal weighting method. Du et al. [6] used major function-oriented zones to explore urban competitiveness considering four dimensions, including economy, social-culture, environment and location, and applied the entropy weighting method to explore urban competitiveness in 31 provincial capitals of China based on spatial data in 2010. Guo et al. [7] established a scientific evaluation indicator system which involved four subsystems, 12 elements and 58 indicators to investigate the urban competitiveness of 141 cities from 28 Chinese urban clusters in 2009 based on the method of technique for order preference by similarity to an ideal solution. Bruneckienė et al [8]. developed the urban economic competitiveness evaluation methodology under the context of shrinkage for border cities. They proposed recommendations to improve the economic development and competitiveness of Lithuanian-Polish cross border cities. Wang et al. [9] compared urban competitiveness in Yangtze River Delta and Pearl River Delta of China during 2000 to 2010 by using a hierarchical evaluation system with four levels and 59 indicators. Sáez et al [10]. established a composite indicator as a weighted aggregate of sub-indicators for the identified component dimensions, including the primary, efficiency-related and innovation-related competitiveness. Thirty-one indicators are selected to rank 159 European Large Urban Zones located in 26 European countries. Song et al. [11] presented a comprehensive model to evaluate urban competitiveness in the Huaihe River eco-economic belt based on the dynamic factor analysis method with the urban panel data. Liu et al. [12] evaluated the long-term competitiveness during urban changes by using Malmquist Productivity Index and measured the structural productivity changes to explore the strengths, weaknesses and differences in their competitiveness, and proposed the directions for future development in 20 major cities of China.
About the evaluation of urban sustainability, Li et al. [13] developed a complete permutation polygon synthetic indicator method to establish a system of 52 indicators, including economic growth and efficiency, ecological and infrastructural construction, environmental protection, social and welfare progress, of urban sustainable development. They evaluated the capacity for urban sustainable development at different times during the coming two decades in Jining of China. Cai et al. [14] proposed an indicator system which involves five subsystems and 37 indicators for the comprehensive evaluation on urban sustainable development, and analyzed the urban sustainable development and degree of urban interior coordination in Harbin of China based on principle component analysis, analytic hierarchy process and weighed index method. Hu [15] considered sustainability into the competitiveness to measure the sustainability and competitiveness in Australian cities and improve policy making and planning for urban development. Yang et al. [16] constructed a linear dimensionless coordinate system of urban sustainable development to evaluate 287 cities in the eastern, central and western regions in China, and examined the influencing factors of urban sustainable development. Wang et al. [17] used a modified M-L index analysis method based on the new directional distance function to present a linear programming model for evaluating sustainable urban development, and provided a scientific decision-making basis for sustainable development of 13 prefecture-level cities in Jiangsu Province of China. Liu et al. [18] proposed the Drive-Pressure-State-Impact-Response model to compare the different urban sustainable development status, and explored the factors affecting the urban sustainable development in six cities in Shaanxi Province of China from 2008 to 2018. Li et al. [19] constructed an evaluation indicator system from the aspects of economy, society and environment, and used elimination and ET choice translation reality model based on information entropy weighting to evaluate the urban sustainability and explore the dynamics of urban spatial effects in 17 cities of Henan Province in China from 2013 to 2017.
For other aspects of city evaluation, Shan et al. [20] established an evaluation index system from economic, political, cultural, social and ecological levels, and evaluated the healthy development of 287 designated cities at prefecture level and above in China. Wang et al. [21] used the urban network method to investigate the hierarchical structure and spatial distribution of coastal cities in China based on the data of 1995, 2005 and 2015. Han et al. [22] selected social and economic factors and presented the synthetic gravity model to study the urban hierarchy system in China in the mid-1990s based on the traditional gravity model. Shi et al. [23] established an evaluation index system for urban intelligent development based on the people-oriented, city-system and resources-flow evaluation model by using analytic hierarchy process, analytical hierarchy process-back propagation and analytic hierarchy process-extreme learning machine models, and evaluated the intelligent development level of 151 cities in China. Zhen et al. [24] explored the flow analysis of various factors between the cities in Hebei Province of China based on urban network and space of flow theories, and analyzed the comprehensive status of each city in the regional urban network by simulating the economic, information, traffic and financial flow among the cities. Wang et al. [25] applied the fuzzy Delphi method to construct the dimensions and the possible impact factors to develop the overall evaluation framework and explore the development of urban quality of life. Shao [26] constructed an evaluation index system of the international port city from the aspects of openness and internationalization of the city, economic development and technological innovation, port radiation and influence, balanced development and ecological environment, residents’ life and social development, and evaluated the international port city of Ningbo in China based on the fuzzy comprehensive evaluation method. Li et al. [27] considered the factors of ecological environment, economic development and public service to present an evaluation model of environmental quality of livable cities. They proposed a support vector machine algorithm based on particle swarm optimization to evaluate the livable cities in Hunan Province of China.
From extant literatures, most researches focused on the urban competitiveness and sustainable development in China and the countries around the world, and few studies pay attention to the comprehensive or integrated development or pattern of the city. For the indicator system, the selected indicators concentrate more on the perspective of urban competitiveness and sustainable development. There are few cities involved in relevant researches, which has less reference for the current overall development of the cities in a country. The application scope of the existing researches is limited to some regions in a country, or to measure the comprehensive competitiveness or sustainability of the cities. In addition, there are few researches investigating the urban hierarchical structure according to the comprehensive and overall urban development or pattern. China is a developing country, and there are many prefecture-level cities. There are big gaps among these cities in urban development. With the rapid development of cities above the prefecture level in China in recent years, it is particularly important to analyze the hierarchical structure of the cities above the prefecture level in China according to the current comprehensive and overall urban development.
In this paper, the indicators, including eight categories and a total of 33 indicators, of urban hierarchical structure analysis are selected. Factor analysis and K-means clustering algorithm are used to investigate the hierarchical structure of 285 prefecture level cities in China. More cities in China are involved in this paper. The results can give a more accurate understanding of the overall development trend of the cities in China, and offer a reference for the development of prefecture level cities in China at the present stage. The results and implications can not only be applied to the urban planning and development in China, but also offer a reference on other developing countries. The methodologies used in this paper can also be applied to study the urban hierarchical structure in other countries.
The contribution of this paper is that: (1) Based on the comprehensive development or pattern of the city, the indicators from the aspects of economy, industry, infrastructure, medical care, population, education, culture and employment levels are selected to establish a new indicator system for analyzing urban hierarchical structure; (2) More cities, including 285 cities, are involved to offer more references for the current overall development of the cities in China; (3) Factor analysis method and K-means clustering algorithm are used to investigate the relationship between the variables of selected indicators, obtain the score of each common factor and comprehensive scores and rankings for 285 cities above prefecture level in China, and classify the 285 cities into 15 levels; (4) The hierarchical structure system of the cities above prefecture level in China is obtained and corresponding policy implications are proposed.
In this paper, the urban hierarchical structure of 285 cities above prefecture level in China is explored by using data analysis [28,29].
By forming a new indicator system considering the aspects of economy, industry, infrastructure, medical care, population, education, culture and employment levels and collecting the corresponding data, the data system of urban hierarchical structure analysis is proposed. Then factor analysis method and K-means clustering algorithm are used to analyze the data system.
Factor analysis method is the one to explore the relationship between the selected variables of indicators, extract the common factors of the variables, and calculate the factor score coefficients. K-means clustering algorithm is a method that n samples are divided into k classes randomly, the distance between each sample and each cluster center is computed, each sample is assigned to the nearest cluster center, and an initial classification scheme is obtained. Based on this initial classification scheme, the clustering center is re-selected according to the same criteria, and each sample is re-allocated until the sum of the squares of clustering error is locally minimum and no new classes are generated.
In this paper, factor analysis method is used to investigate the relationship between the variables of selected indicators and obtain the score of each common factor and comprehensive scores and rankings for 285 cities above prefecture level in China. K-means clustering algorithm is used to cluster 285 cities above prefecture level into 15 levels according to the comprehensive scores from factor analysis. Then, the hierarchical structure system of the cities above prefecture level in China is obtained.
According to the analysis of the results and the hierarchical structure system of the cities above prefecture level in China, the corresponding policy implications are proposed.
The methodology in this paper is shown in Fig. 1.

Figure 1: The methodology of the paper
3.1 The Indicator System of Urban Hierarchical Structure Analysis
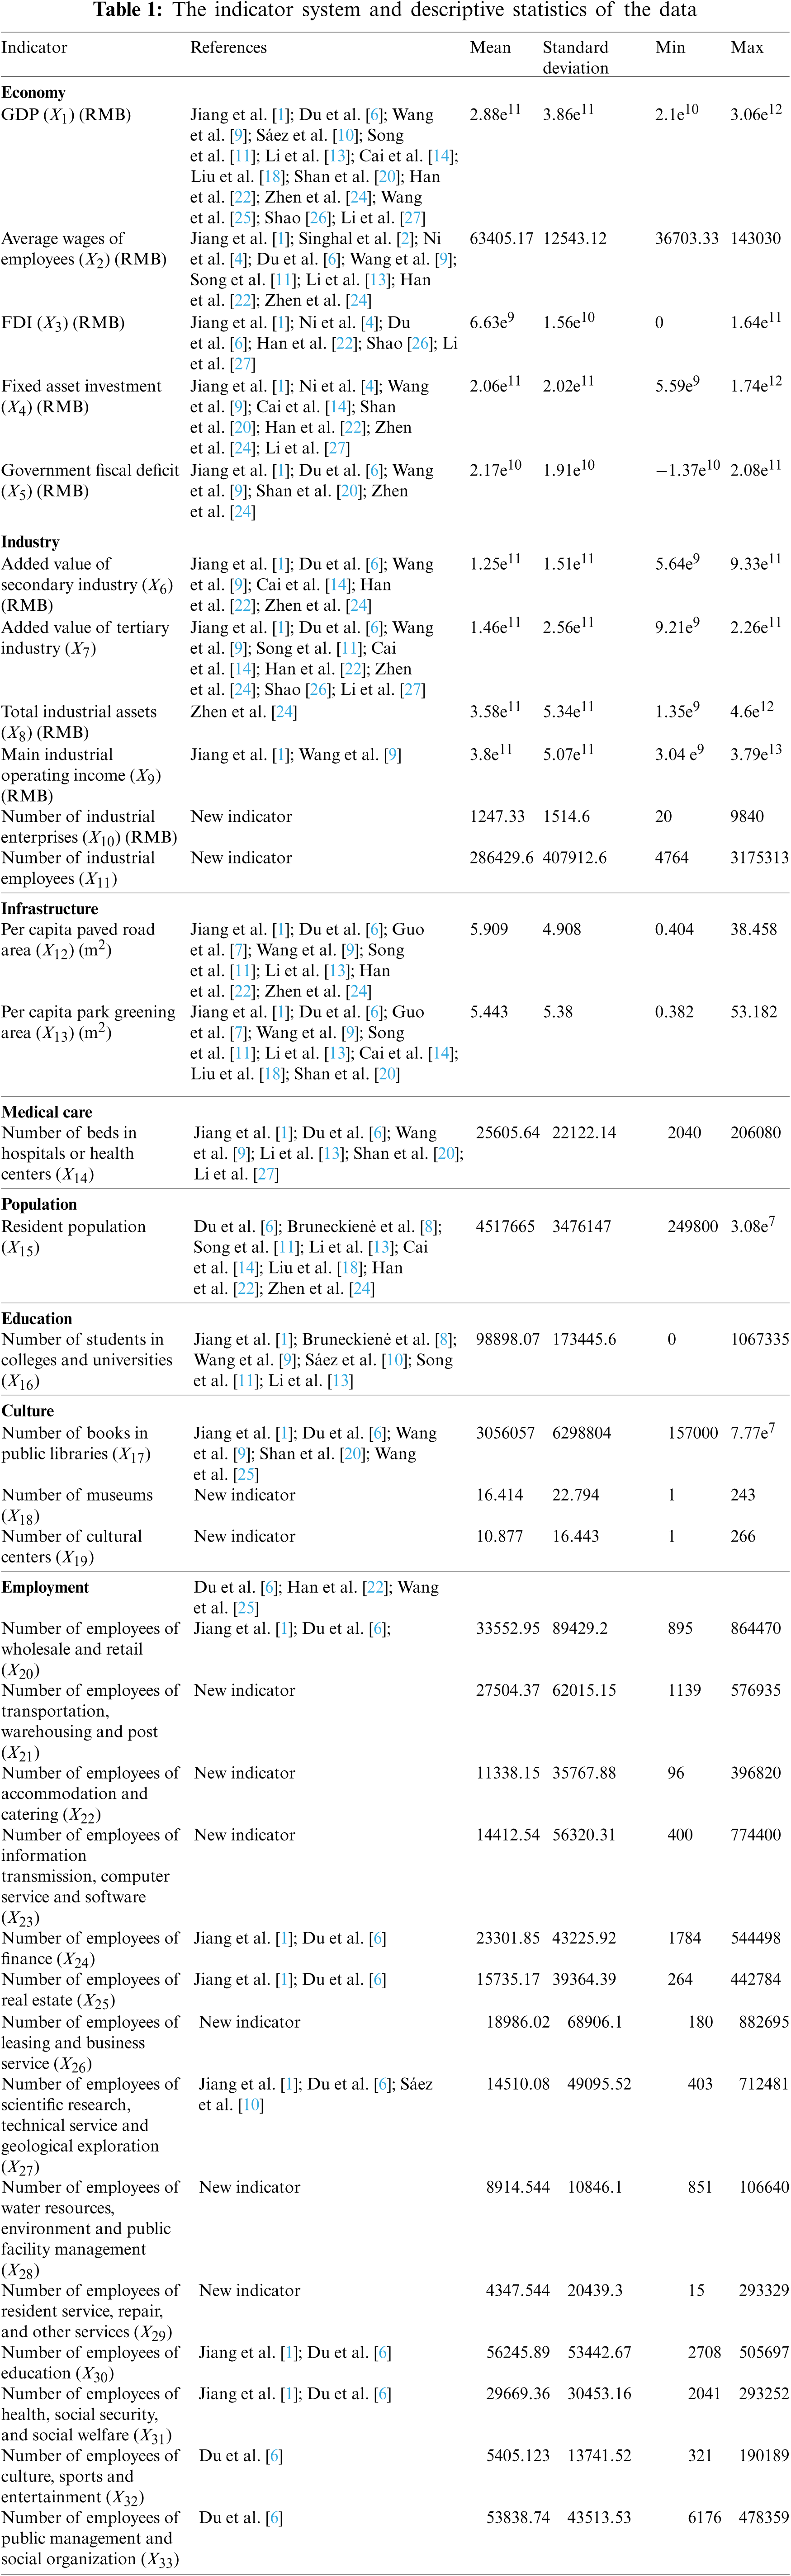
Based on the literature review, the indicators from the aspects of economy, industry, infrastructure, medical care, population, education, culture and employment levels are selected comprehensively to establish a new indicator system for analyzing urban hierarchical structure according to the comprehensive development and pattern of the cities. Table 1 shows the indicator system and relevant indicators from literatures.
(1) Economy
The economic indicators include gross domestic product (GDP), foreign direct investment (FDI), average wages of employees, fixed asset investment and government fiscal deficit.
GDP is an important indicator of urban economic development, which reflects the economic situation and market scale of a city. FDI reflects the external economic strength, competitiveness and influence, as well as the level of opening to the foreign countries. The average wage of employees reflects the national economic level, residents’ consumption ability and the overall economic level of a city. The fixed asset investment is the embodiment of urban capital savings and economic strength. These economic indicators reflect the economic development and foreign economic competitiveness of a city.
(2) Industry
The industrial indicators include added value of the secondary industry, added value of the tertiary industry, total industrial assets, main industrial operating income, number of industrial enterprises and number of industrial employees.
The added values of the secondary and tertiary industries reflect the economic growth of the industries in a certain period of time. The total industrial assets, main operating income, number of industrial enterprises and number of industrial employees are the basic indicators of industrial development. These industrial indicators reflect the changes of urban industrial structure, which are the important factors for the development of urban industrial structure, economic development and urban planning.
(3) Infrastructure
The infrastructure indicators include per capita paved road area and per capita park greening area. These indicators reflect the construction level and completeness level of urban infrastructure, which is necessary for urban development.
(4) Medical care
The medical indicator includes number of beds in hospitals or health centers. This indicator reflects the level of social services and medical care.
(5) Population
The resident population is selected as the population indicator. The population indicator is the basic factor of urban scale and economic development.
(6) Education
The number of students in colleges and universities is considered as the education indicator. The education indicator reflects the quality level of education of a city, which is the basis of scientific and technological innovation and talent reserve.
(7) Culture
The cultural indicators include number of books in public libraries, number of museums and number of cultural centers. These indicators reflect the scale and quality level of cultural facilities and the maturity of urban development.
(8) Employment
The employment indicators include number of employees for the sub-industries of tertiary industry, such as the wholesale and retail, transportation, warehousing and post, accommodation and catering, information transmission, computer service and software, finance, real estate, leasing and business service, scientific research, technical service and geological exploration, water resources, environment and public facility management, resident service, repair, and other services, education, health, social security, and social welfare, culture, sports and entertainment, and public management and social organization.
The employment indicators mainly focus on the number of employees in each sub-industry of the tertiary industry, reflecting the tertiary industry structure and industrial development level. As an important part of the industrial structure, the tertiary industry accounts for a large proportion of the total GDP and is an important driving force for urban economic and industrial development.
From Table 1, some new indicators are considered, such as number of industrial enterprises, number of industrial employees, number of museums, number of cultural centers, and employment in sub-industries of the tertiary industry, to show a more specific status of industry, culture and employment level of a city. In addition, more comprehensive indicators of urban hierarchical structure analysis are selected than the previous studies.
285 cities above prefecture level in China are considered. These cities include Beijing, Tianjin, Shanghai, Chongqing, and the prefecture-level cities in Hebei Province, Henan Province, Yunnan Province, Liaoning Province, Heilongjiang Province, Hunan Province, Anhui Province, Shandong Province, Jiangsu Province, Zhejiang Province, Jiangxi Province, Hubei Province, Gansu Province, Shanxi Province, Shaanxi Province, Jilin Province, Fujian Province, Guizhou Province, Guangdong Province, Qinghai Province, Sichuan Province, Hainan Province, Inner Mongolia Autonomous Region, Ningxia Hui Autonomous Region, Guangxi Zhuang Autonomous Region and Xinjiang Uygur Autonomous Region. There excludes the cities at the same level in Taiwan Province and Tibet Autonomous Region, as well as Hong Kong Special Administrative Region and Macao Special Administrative Region. The 285 cities above prefecture level can reflect the characteristics and system of urban hierarchical structure in China as a whole.
The data of economic, industrial, infrastructure, population, medical care, education and cultural indicators are collected from the Statistical Yearbook of Municipalities, Provinces and Autonomous Regions in China and the City Statistical Yearbook in 2017. The data of employment indicators are collected from the City Statistical Yearbook in 2017. Table 1 is the descriptive statistics of the data. The observation of each indicator is 285. The big data analysis method is used to clean and process the data, check the abnormal values, and supplement the missing data with the mean interpolation method.
4 Data Analysis of Urban Hierarchical Structure
Bartlett sphere test and Kaiser-Meyer-Olkin (KMO) test are used to determine whether the data samples are suitable for factor analysis.
Bartlett sphere test can test the correlation between variables and judge whether each variable is independent. By using Stata, the results show that the chi-square statistic is 20747.955, the degree of freedom is 528, and the P value is 0. The P value is equal to 0, rejecting the original hypothesis and indicating that the data samples are relevant and suitable for factor analysis.
KMO test is a method to compare the coefficients of correlation and partial correlation of variables. When the sum square of the coefficient of the correlation between variables is greater than the sum square of the coefficient of the partial correlation, the value of KMO will be closer to 1, indicating that the stronger the correlation between variables is, the more suitable the data are used for factor analysis. By using Stata, the result shows that KMO = 0.946, indicating that the data samples are suitable for factor analysis.
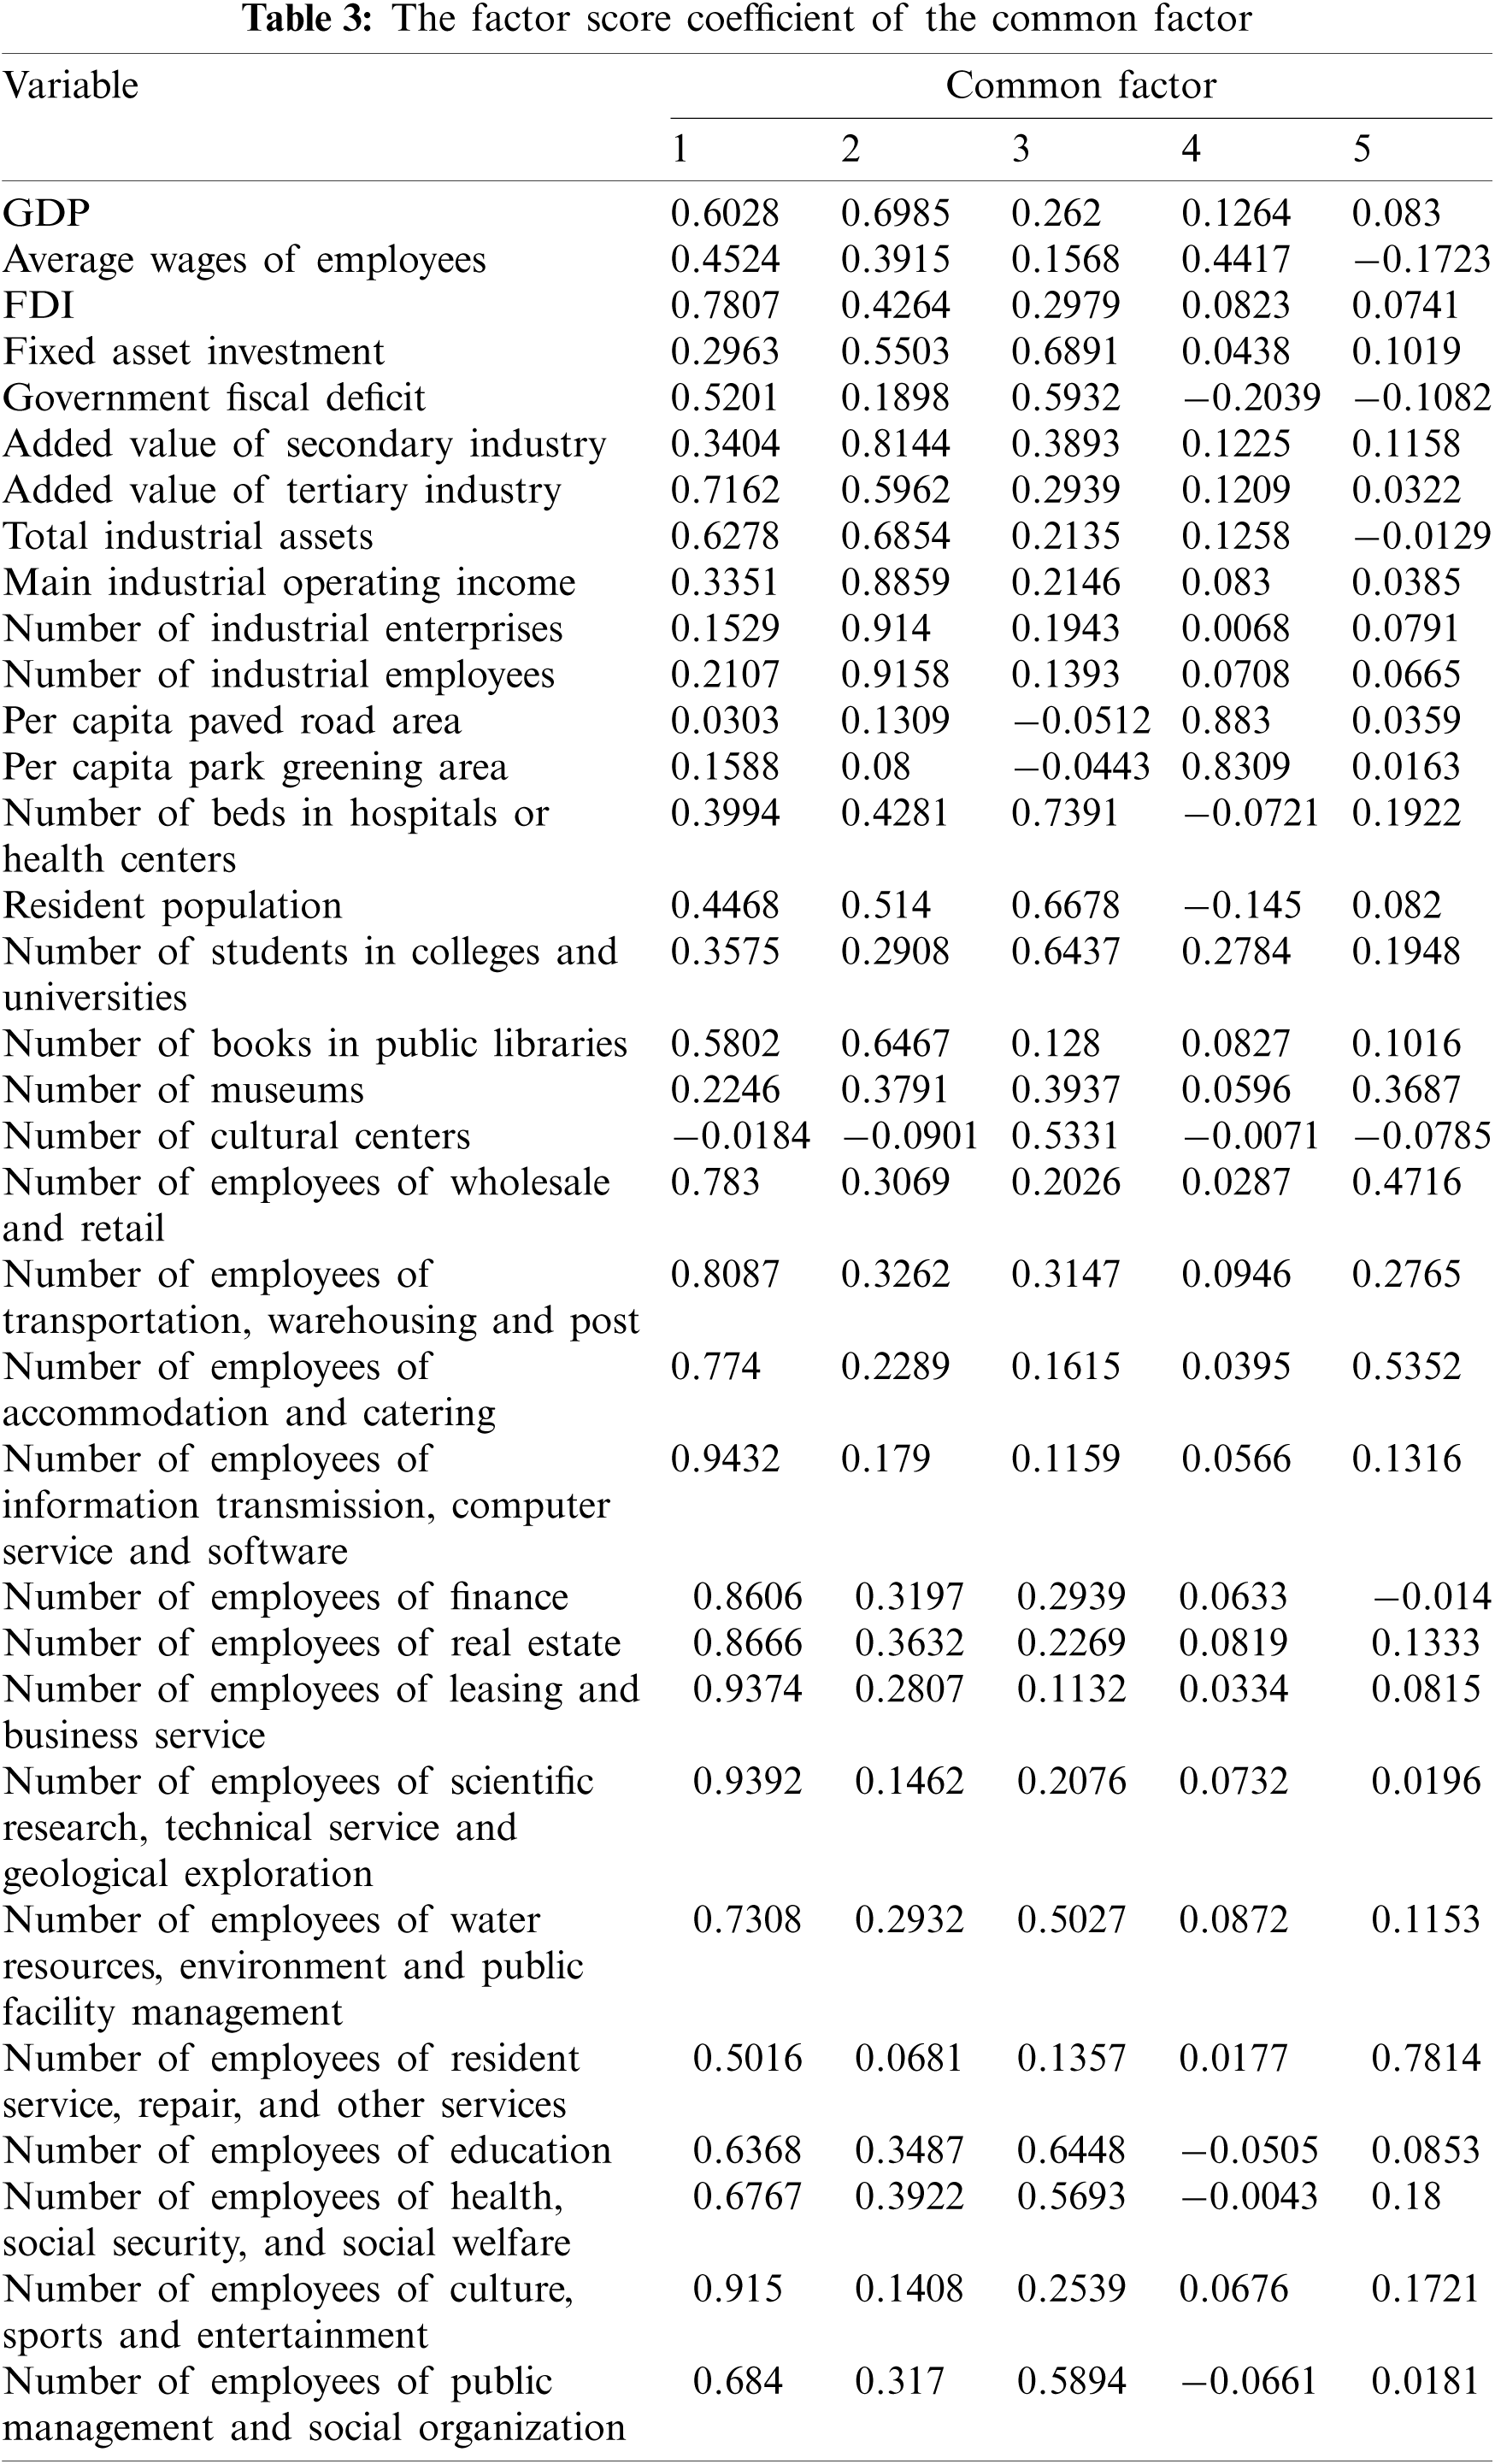
Then, the data samples are used to do the factor analysis. By using Stata, the common factor is extracted and rotated, and the factor load matrix after rotation is calculated. The rotated factor does not change the fitting degree of the model to the data, nor does it change the common factor variance of each variable, which can explain the variables better. Table 2 shows the common factor variables after rotation. Table 3 is the factor score coefficients of the common factors.
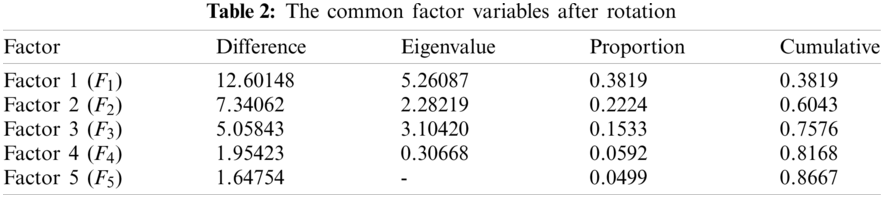
From Table 2, it is shown that five common factors are extracted, their proportions are 38.19%, 22.24%, 15.33%, 5.92% and 4.99%, respectively, and the cumulative contribution rate of common factors reaches 86.67%. The proportion of the first common factor is the highest, showing that it plays a key role in the urban hierarchical structure.
Based on Table 3, the correlation coefficients between the common factors and their included variables can be obtained. The greater the correlation coefficient is, the stronger the correlation is. Generally, when the absolute value of the correlation coefficient of the common factor is greater than 0.4, it means that this factor reflects the level of the variables better.
The first common factor reflects the level of employment and economy. It better explains following variables, including the number of employees of information transmission, computer service and software, scientific research, technical service and geological exploration, leasing and business service, culture, sports and entertainment, real estate, finance, transportation, warehousing and post, wholesale and retail, accommodation and catering, water resources, environment and public facility management, public management and social organization, health, social security, and social welfare, and education, FDI, added value of tertiary industry, and average wages of employees.
The second common factor reflects the industrial level of a city. The variables include the number of industrial employees, number of industrial enterprises, main industrial operating income, added value of secondary industry, GDP, total industrial assets, and number of books in public libraries.
The third common factor reflects the level of medical care, population, education and culture of a city. The variables include the number of beds in hospitals or health centers, investment in fixed assets, resident population, the number of students in colleges and universities, government fiscal deficit and the number of cultural centers. The third common factor of the absolute values of the correlation coefficients for the number of museums is the largest, thus relatively speaking, it better explains this variable.
The fourth common factor reflects the level of infrastructure of a city, which includes per capita paved roads and per capita park greening area.
The fifth common factor reflects the employment level of a city, involving the number of employees in resident service, repair, and other services.
Using Stata, the coefficients of the factor scores of common factors are obtained. The factor score models are established based on the coefficients of the factor scores of common factors obtained in Table 3. The formulas of the first to fifth common factors are
where Fi (
The common factor scores and ranking of 285 cities in China are calculated through formulas (1)–(5).
Taking the proportion of common factors as the weights, the comprehensive scores and ranking of 285 cities above prefecture level in China are calculated. The formula is
where the coefficients of the variables are the proportion of the first to fifth common factors obtained in Table 2.
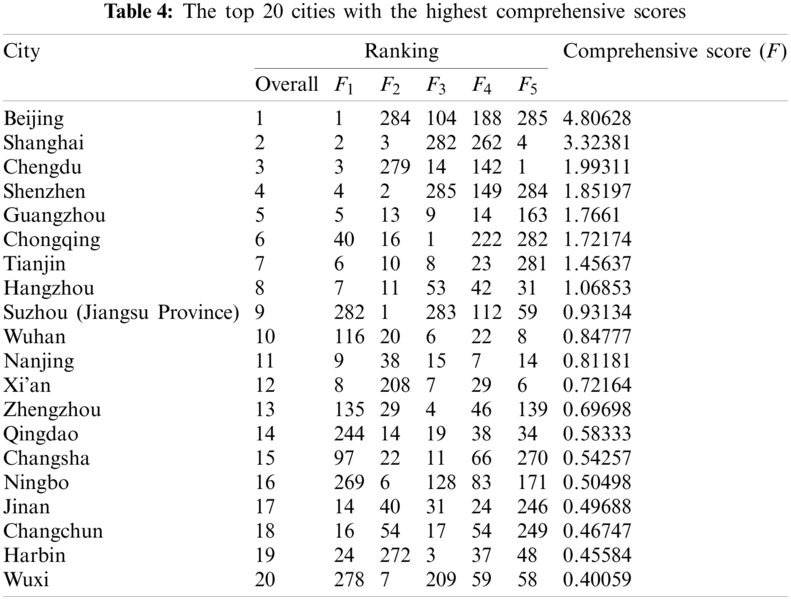
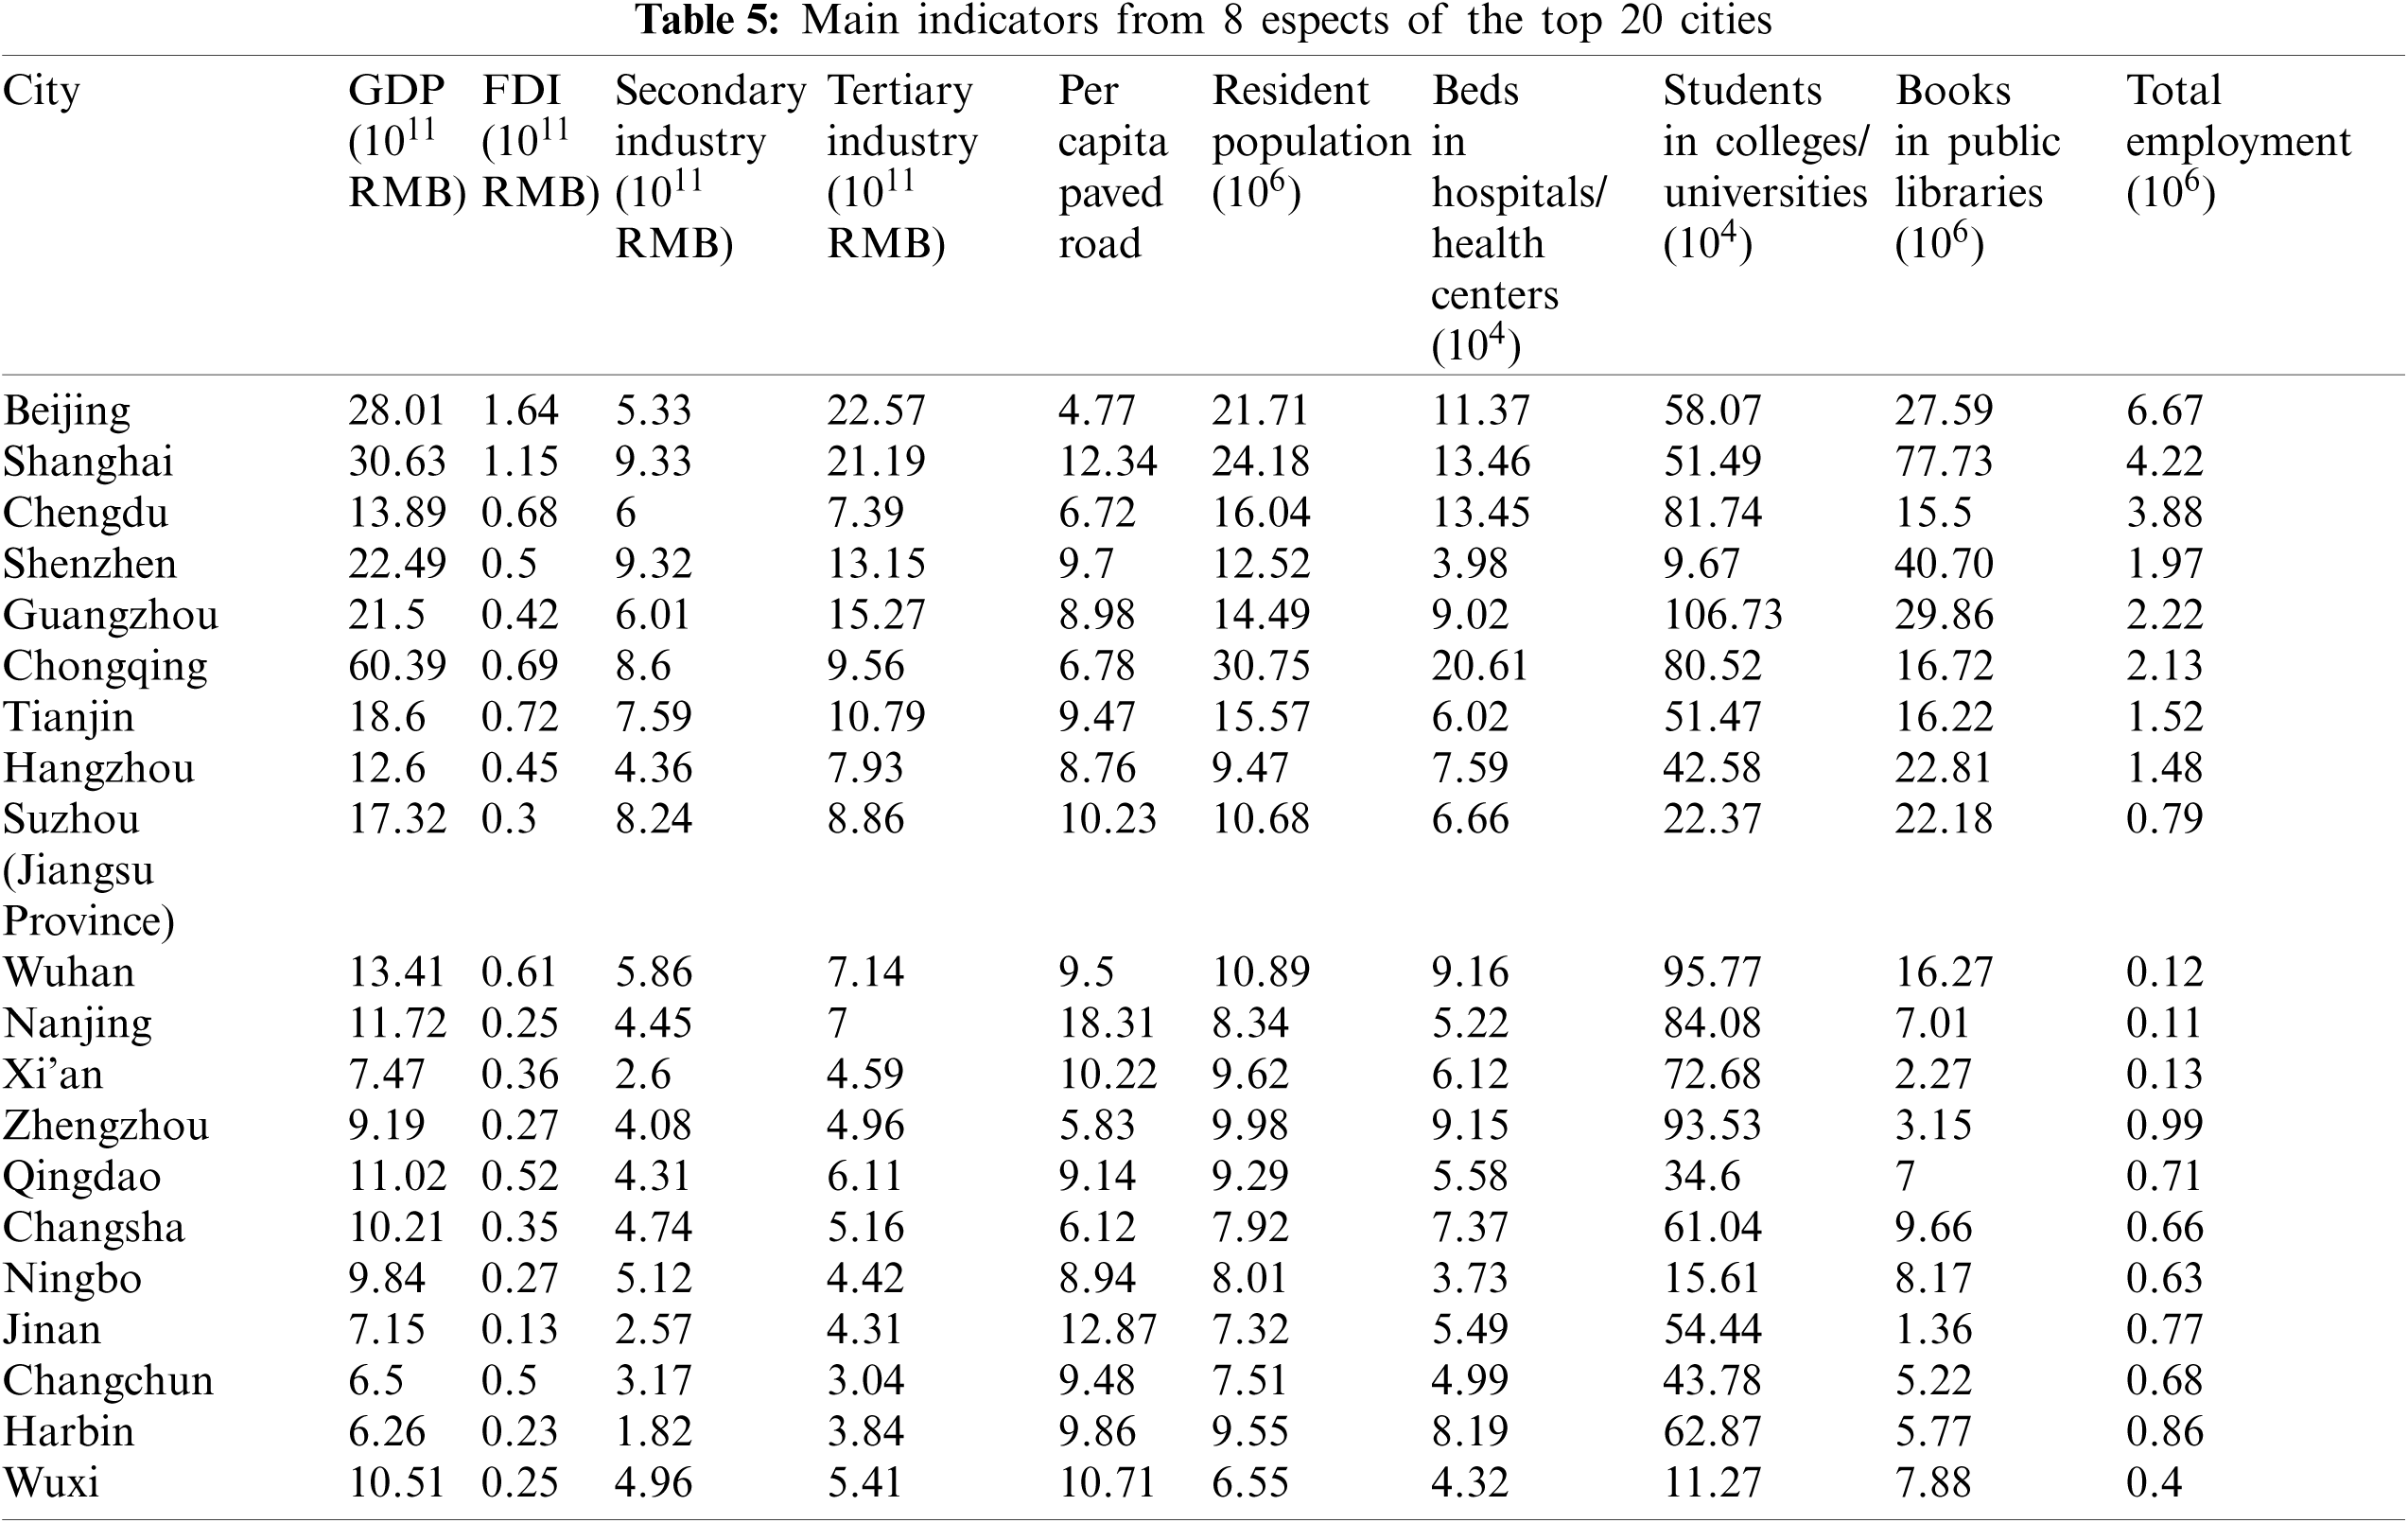
By calculation, Fig. 2 shows the results of the trend of the comprehensive scores and ranking of 285 cities. Table 4 shows the top 20 cities with the highest comprehensive scores. Table 5 is the main indicators from 8 aspects of the top 20 cities.

Figure 2: The results of the trend of the comprehensive scores and ranking of 285 cities
According to the comprehensive scores of 285 cities obtained by factor analysis, K-means clustering algorithm method is used for clustering analysis, and the hierarchical structure of the cities above prefecture level in China is established, as shown in Table 6. The 285 cities above prefecture level are clustered into 15 levels. According to the first to fifth common factor scores and comprehensive scores of each city, the mean value of the first to fifth common factors and the comprehensive score of each level are calculated. Fig. 3 shows the distribution of the hierarchical structure of the cities above prefecture level in China.
For the levels of the cities, 8 to 15 levels are computed by using K-means clustering algorithm method, respectively. Comparing the results of these levels, we select 15 levels in this paper. For 8 to 14 levels, the results show that these levels are not very detailed and specific, because some levels include too many cities, which cannot show the clear changes and differences among the cities in different levels. Thus, for 285 cities, 15 levels are considered in this paper to show the differences between different levels of the cities from 8 aspects and the characteristics and development level of the cities more specifically and clearly.
From Fig. 2, there is a downward trend for the comprehensive scores of 285 cities, and a very obvious and rapid downward trend for the top 20 cities with the highest comprehensive scores especially. Then, the decline trend is relatively slow. It indicates that there is a large difference in urban development between the top 20 cities and other cities. Specifically, the comprehensive scores of the first and second cities are much higher than other cities, and also those of the third to seventh cities are higher than other cities, indicating that there are obviously large differences in urban development of these cities from other cities in urban development.


Figure 3: The distribution of the hierarchical structure of the cities above prefecture level in China
From Tables 4 and 5, most top 20 cities are located in east China. These are large cities with the resident population over 6 millions. There are relatively high GDP, FDI and added value of secondary and teritary industries, complete basic infrastructure, and high education level in these cities. Among these cities, Beijing and Shanghai are the cities with the highest comprehensive scores, and their scores are much higher than those of other top 20 cities. Beijing has highest F1 that shows the greatest power in employment and economy, while Shanghai has more advantages in industrial development. The comprehensive scores of the cities ranking in the third to seventh are very close and higher than the rest of 13 cities. In Beijing, the total employment reaches 6.67 million people for tertiary industry; the economy is also well-developed with 164.27 billion RMB, 894.81 billion RMB and 1642.7 RMB in FDI, fixed asset investment and average wage of employees respectively, which ranks the first in China. In Shanghai, the added value of secondary industry reaches 933.07 billion RMB, and the industrial indicators of main industrial operating income and number of industrial enterprises are 379.11 million RMB and 8122, showing dominant in China.
The cities with the highest F2, F3 and F4 are Suzhou, Chongqing and Xiamen, respectively. For industry development, Suzhou is the top city with the highest per capita added value of secondary industry and per capita industrial indicators which include total industrial assets, main operating income, number of industrial enterprises and number of industrial employees. Its secondary industry accounts for 47.55% of total GDP. Among these industries, there is stable development of the leading industry, such as computer, communication and other electronic equipment manufacturing, electrical machinery and equipment manufacturing, ferrous metal smelting and rolling processing, chemical raw materials and chemical products manufacturing, general equipment manufacturing and automobile manufacturing, achieving a total output value of 2.12 trillion RMB.
For level of medical care, population, education and culture, Chongqing stands the first place in the medical treatment for the number of beds in hospitals or health centers and resident population, reaching 206,080 and 30.75 million people. Concerning the aspect of culture, the number of museum is relatively high with 94.
With the regards to infrastructure, the per capita paved road area in Xaimen is 13.59, which is relatively complete than other cities. Its per capita park greening area is obviously high with 53.18, which shows dominate in 285 cities. There is a comfortable environment with large green area and many scenic spots, such as Kulangsu, with beatiful scenery in this city, which creats it a national ecological garden city.
Among the top 20 cities, the cities with the highest F1 occupy the top 5 positions of overall comprehensive score, which indicates that F1 representing economy and employment level of a city plays a very important role in ranking the cities and determining the urban hierarchical structure. In these 20 cities, the development of 8 aspects in Hangzhou and Nanjing is more balanced, while other cities show strong development in certain aspects of urban development. For example, Shenzhen has high score in F1 and F2, and it advances in economy, employment and industry; while it has low score in other 3 common factors, and it is poor in medical care, education, culture and infrastructure. Shenzhen has been committed to developing economy and industry in recent years, but ignoring developing other aspects, such as culture, education and infrastructure. Mainly because Shenzhen is an emerging city, it lacks cultural deposits and heritage, and the universities or colleges and the infrastructure, such as subways, built in Shenzhen is not very complete.
For the bottom 20 cities, their scores of F2, F3 and F4 are lower. Generally, these cities have lower GDP with less than 130 billion RMB, less FDI, imperfect infrastructure, less resident population and backward progress of education, medical care and culture, especially for Yichun, Jinchang, Tongchuan, Qitaihe, etc. The reasons may be that these cities lacks imported FDI, or the national policies can not be well covered in these cities; moreover, there is no radiation impact of metropolitans around these cities.
From Table 6, Level 1 involves the cities with outstanding comprehensive strength, which is much higher than that of other levels, indicating the cities in Level 1 play key roles in the overall development of the country. The value of F1 is obviously higher than that of the cities in other levels, which shows the cities in Level 1 have the greatest development in economy and employment, especiallty in FDI, residents’ consumption ability, tertiary industry and total labor force. The value of F4 is lower, showing that the infrastracture of the cities should be improved to achieve a more balanced urban development.
Level 2 is the cities with strong comprehensive strength. There is a gap between the comprehensive score of the cities in Level 2 and Level 1 due to the large differences of the value of F1, and these differences are mainly in employment, foreign investment, tertiary industry and residents’ consumption level. However, there is better development for the cities in Level 2 in other aspects, and the development of the cities in Level 2 is more balanced and stable.
Levels 3 to 6 are the potential cities with positive comprehensive scores, and their development are above the average level. The cities in Level 3 show balanced development with the positive scores of all five common factors, and have better development in industry. There is a lack of development in some aspects for the cities in Levels 4 to 6 due to the negative scores of some common factors, and these cities need to improve the economy and employment level. The development of economy, employment and infrastructure for the cities in Level 6 lags behind. Without changing their structural characteristics and environment, these cities can make up for slightly backward aspects according to their own needs for development, which can make more complete urban development. These cities can also absorb the advantages of the cities in Levels 1 and 2, so as to achieve better development.
Levels 7 and 8 are the developing cities with negative comprehensive scores, and their overall development is below the average level. More aspects of development for the cities in these levels are lower than the average level. The economy and employment level for the cities in Level 7 lags behind. The cities in Level 8 only have one positive score of F3, which indicates the development of medical care, population, education and culture are above the average level, and the development of other aspects, especially for industry, lags behind. In the process of development, these cities need to highlight their characteristics to maximize their development, formulate urban planning based on the urban characteristics and combination with other industries, and try to make up for their own shortcomings.
Levels 9 to 15 are the cities to be developed. Their comprehensive scores are negative, and most common factor scores are also negative. Their development is considerably lower than the average level, and they all have weaknesses in development. All the scores of the common factors show negative for the cities in Levels 9, 11 and 12, showing that the overall development for these cities is below the average level and lag far behind. The values of F2 and F3 are relatively lower, which indicates the development of industry, medical care, population, education and culture is excessively backward. These cities can strengthen the construction of infrastructure and transportation system, optimize the industrial structure, strengthen the cooperation with big cities, increase cultural exchanges with other cities, and improve the level and efficiency of urban comprehensive development.
Through the above analysis, the conclusions are: (1) The main reasons for the differences in urban levels are the level and development of urban economy and employment, and these indicators play key roles in determining the level of the city; (2) There is a large difference in urban development between the top 20 cities and other cities; (3) The cities in each level have advantages and disadvantages in some aspects, and the overall development for the most cities is not very balanced; (4) Cities at the same level have similarities in urban development.
6 Conclusions and Policy Implications
In this paper, based on multiple indicators of economy and industry, the urban hierarchical structure in China is investigated. The indicators from the aspects of economy, industry, infrastructure, medical care, population, education, culture and employment levels are selected to establish a new indicator system for analyzing urban hierarchical structure. The factor analysis method is used to investigate the relationship between the variables of selected indicators and obtain the score of each common factor and comprehensive scores and rankings for 285 cities above the prefecture level in China. According to the comprehensive scores, 285 cities above the prefecture level are clustered into 15 levels using the K-means clustering algorithm. Then, the hierarchical structure system of the cities above the prefecture level in China is obtained.
The conclusions can be drawn as follows: (1) The main reasons for the differences in urban levels are the level and development of urban economy and employment, and these indicators play key roles in determining the level of the city; (2) There is a large difference in urban development between the top 20 cities and other cities; (3) The cities in each level have advantages and disadvantages in some aspects, and the overall development for the most cities is not very balanced; (4) Cities at the same level have similarities in urban development.
Based on the conclusions, the policy implications are proposed as follows:
Firstly, although the factors of economy and employment are very important, the government also needs to focus on the development of industry, infrastructure, medical care, population, education and culture based on the economy and employment during the progress of urban development to achieve more balanced development.
Secondly, without changing the environment and inherent characteristics of the city, the government can strengthen the advantages, make up for the deficiencies and make the urban development more coordinated according to the quantitative data.
Thirdly, the needs of urban development at each level are different. The government can find out the gap during the development process of the city according to the backward aspects, and formulate a more complete and balanced urban planning of the city in each level.
Fourthly, the development of cities at all levels should consider their own specialized development direction on the basis of the national macro development strategy, maximize the advantages of the city, and formulate urban planning based on the characteristics of the city, combination with other industries and sustainable development, so as to make urban development more balanced.
This paper can identify the drawbacks during the urban development, help the government find out the gaps among the development process of economy, industry, infrastructure, medical care, population, education, culture and employment, and improve the overall development of the country.
The results and implications can not only be applied to the urban planning and development in China, but also offer a reference on other developing countries. Also, the methodologies used in this paper can be applied to study the urban hierarchical structure in other countries.
Funding Statement: This work was supported by National Key Research and Development Program of China (Grant No. 2018YFC0704903).
Conflicts of Interest: The authors declare that they have no conflicts of interest to report regarding the present study.
1. Jiang, Y. H., Shen, J. F. (2010). Measuring the urban competitiveness of Chinese cities in 2000. Cities, 27, 307–314. DOI 10.1016/j.cities.2010.02.004. [Google Scholar] [CrossRef]
2. Singhal, S., McGreal, S., Berry, J. (2013). An evaluative model for city competitiveness: Application to UK cities. Land Use Policy, 30, 214–222. DOI 10.1016/j.landusepol.2012.03.018. [Google Scholar] [CrossRef]
3. Singhal, S., McGreal, S., Berry, J. (2013). Application of a hierarchical model for city competitiveness in cities of India. Cities, 31, 114–122. DOI 10.1016/j.cities.2012.05.012. [Google Scholar] [CrossRef]
4. Ni, P. F., Kresl, P., Li, X. J. (2014). China urban competitiveness in industrialization: Based on the panel data of 25 cities in China from 1990 to 2009. Urban Studies, 51(13), 2787–2805. DOI 10.1177/0042098013514461. [Google Scholar] [CrossRef]
5. Shen, J. F., Yang, X. L. (2014). Analyzing urban competitiveness changes in major Chinese cities 1995–2008. Applied Spatial Analysis, 7, 361–379. DOI 10.1007/s12061-014-9114-2. [Google Scholar] [CrossRef]
6. Du, Q. Y., Wang, Y. X., Ren, F., Zhao, Z. Y., Liu, H. Q. et al. (2014). Measuring and analysis of urban competitiveness of Chinese Provincial capitals in 2010 under the constraints of major function-oriented zoning utilizing spatial analysis. Sustainability, 6, 3374–3399. DOI 10.3390/su6063374. [Google Scholar] [CrossRef]
7. Guo, H. X., Liu, X., Li, Y. J., Wang, D. Y., Chen, X. H. (2015). Comparison analysis and evaluation of urban competitiveness in Chinese urban clusters. Sustainability, 7, 4425–4447. DOI 10.3390/su7044425. [Google Scholar] [CrossRef]
8. Bruneckienė, J., Sinkienė, J. (2015). The economic competitiveness of Lithuanian-Polish border region’s cities: The specific of urban shrinkage. Equilibrium-Quarterly Journal of Economics and Economic Policy, 10(4), 133–149. DOI 10.12775/EQUIL.2015.039. [Google Scholar] [CrossRef]
9. Wang, L., Shen, J. F. (2017). Comparative analysis of urban competitiveness in the Yangtze river delta and pearl river delta regions of China, 2000–2010. Applied Spatial Analysis, 10, 401–419. DOI 10.1007/s12061-016-9210-6. [Google Scholar] [CrossRef]
10. Sáez, L., Periáñez, I., Heras-Saizarbitoria, I. (2017). Measuring urban competitiveness: Ranking European large urban zones. Journal of Place Management and Development, 10(5), 479–496. DOI 10.1108/JPMD-07-2017-0066. [Google Scholar] [CrossRef]
11. Song, M. L., Xie, Q. J. (2021). Evaluation of urban competitiveness of the Huaihe River eco-economic belt based on dynamic factor analysis. Computational Economics, 10, 615–639. DOI 10.1007/s10614-019-09952-5. [Google Scholar] [CrossRef]
12. Liu, C. C., Chuang, L. M., Huang, C. M. (2011). A study on the urban competitiveness of two-straits. Applied Economics Letters, 19(10), 1001–1005. DOI 10.1080/13504851.2011.610736. [Google Scholar] [CrossRef]
13. Li, F., Liu, X. S., Hua, D., Wang, R. S., Yang, W. R. et al. (2009). Measurement indicators and an evaluation approach for assessing urban sustainable development: A case study for China’s Jining city. Landscape and Urban Planning, 90, 134–142. DOI 10.1016/j.landurbplan.2008.10.022. [Google Scholar] [CrossRef]
14. Cai, C. M., Shang, J. C. (2009). Comprehensive evaluation on urban sustainable development of Harbin city in Northeast China. Chinese Geographical Science, 19(2), 144–150. DOI 10.1007/s11769-009-0144-7. [Google Scholar] [CrossRef]
15. Hu, R. (2015). Sustainability and competitiveness in Australian cities. Sustainability, 7, 1840–1860. DOI 10.3390/su7021840. [Google Scholar] [CrossRef]
16. Yang, B., Xu, T., Shi, L. Y. (2017). Analysis on sustainable urban development levels and trends in China’s cities. Journal of Cleaner Production, 141, 868–880. DOI 10.1016/j.jclepro.2016.09.121. [Google Scholar] [CrossRef]
17. Wang, Y. Q., Yuan, G. H., Yan, Y., Zhang, X. L. (2020). Evaluation of sustainable urban development under environmental constraints: A case study of Jiangsu Province. China Sustainability, 12, 1049. DOI 10.3390/su12031049. [Google Scholar] [CrossRef]
18. Liu, S. D., Ding, P. Y., Xue, B. R., Zhu, H. B., Gao, J. (2020). Urban sustainability evaluation based on the DPSIR dynamic model: A case study in Shaanxi Province. China Sustainability, 12, 7460. DOI 10.3390/su12187460. [Google Scholar] [CrossRef]
19. Li, H. M., Huang, X., Xia, Q., Jiang, Z. M., Xu, C. C. et al. (2021). Dynamic evaluation of urban sustainability based on ELECTRE: A case study from China. Discrete Dynamics in Nature and Society, 2021, 6659623. DOI 10.1155/2021/6659623. [Google Scholar] [CrossRef]
20. Shan, J. J., Wu, Z. Y. (2015). Evaluation of China’s urban healthy development: Current situation, problems and countermeasures. Chinese Journal of Urban and Environmental Studies, 3(3), 1550023. DOI 10.1142/S2345748115500232. [Google Scholar] [CrossRef]
21. Wang, L. L., Xiao, W. W., Wang, C. W. (2017). Evolution of hierarchical structure and spatial pattern of coastal cities in China–based on the data of distribution of marine-related enterprises. Polish Maritime Research, 24(s1), 58–64. DOI 10.1515/pomr-2017-0105. [Google Scholar] [CrossRef]
22. Han, R. B., Cao, H. H., Liu, Z. W. (2018). Studying the urban hierarchical pattern and spatial structure of China using a synthesized gravity model. Science China (Earth Sciences), 61(12), 1818–1831. DOI 10.1007/s11430-016-9191-5. [Google Scholar] [CrossRef]
23. Shi, H. B., Tsai, S. B., Lin, X. W., Zhang, T. Y. (2018). How to evaluate smart cities’ construction? A comparison of Chinese smart city evaluation methods based on PSF. Sustainability, 10, 37. DOI 10.3390/su10010037. [Google Scholar] [CrossRef]
24. Zhen, F., Qin, X., Ye, X. Y., Sun, H. H., Luosang, Z. X. (2019). Analyzing urban development patterns based on the flow analysis method. Cities, 86, 178–197. DOI 10.1016/j.cities.2018.09.015. [Google Scholar] [CrossRef]
25. Wang, W. M., Peng, H. H. (2020). A fuzzy multi-criteria evaluation framework for urban sustainable development. Mathematics, 8, 330. DOI 10.3390/math8030330. [Google Scholar] [CrossRef]
26. Shao, W. Q. (2020). Evaluation of international port city based on fuzzy comprehensive evaluation. Journal of Intelligent & Fuzzy Systems, 38, 7027–7032. DOI 10.3233/JIFS-179780. [Google Scholar] [CrossRef]
27. Li, Q. Z., Fu, Q., Zou, Y., Hu, X. J. (2021). Evaluation of livable city based on GIS and PSO-SVM: A case study of hunan province. International Journal of Pattern Recognition and Artificial Intelligence, 35(8), 2159030. DOI 10.1142/S0218001421590308. [Google Scholar] [CrossRef]
28. Cheng, J. (2021). Analysis of commercial land leasing of the district governments of Beijing in China. Land Use Policy, 100, 104881. DOI 10.1016/j.landusepol.2020.104881. [Google Scholar] [CrossRef]
29. Cheng, J. (2021). Mathematical models and data analysis of residential land leasing behavior of district governments of Beijing in China. Mathematics, 9, 2314. DOI 10.3390/math9182314. [Google Scholar] [CrossRef]
 | This work is licensed under a Creative Commons Attribution 4.0 International License, which permits unrestricted use, distribution, and reproduction in any medium, provided the original work is properly cited. |