| Computer Modeling in Engineering & Sciences |
DOI: 10.32604/cmes.2022.016831
ARTICLE
Performance Evaluation of Electromagnetic Shield Constructed from Open-Cell Metal Foam Based on Sphere Functions
1Graduate School of Industrial Technology Nihon University, Narashino, Chiba 275-8575, Japan
2College of Industrial Technology Nihon University, Narashino, Chiba 275-8575, Japan
3College of Science and Engineering Ritsumeican University,, Kusatsu, Shiga 525-8577, Japan
4College of Information Science and Engineering Ritsumeican University, Kusatsu, Shiga 525-8577, Japan
*Corresponding Author: Yuya Hanaoka. Email: ciyu19013@g.nihon-u.ac.jp
Received: 30 March 2021; Accepted: 22 December 2021
Abstract: This study evaluates the performance of a model of open-cell metal foams generated by sphere functions. To this end, an electromagnetic shield constructed from the model was inserted between two horn antennas in an electromagnetic wave propagation simulation. The foam-hole diameter in the electromagnetic shield model was varied as d = 2.5 and 5.0 mm, and the frequency of the electromagnetic waves was varied from 3 to 13 GHz. In the numerical experiments of shield effectiveness, the shields with foam holes of both diameters attenuated the electromagnetic waves across the studied frequency range. The shield effectiveness was enhanced at low frequencies and in the shield with smaller hole diameter.
Keywords: Electromagnetic propagation; electromagnetic shielding; materials; metal foams; numerical simulation
The cell structures of metal foams are divided into two main states: open and closed. Owing to their valuable characteristics (light weight and strong impact absorption), metal foams are expected in many engineering applications such as crash absorbers, train materials, and architectural structures.
This paper focuses on open-cell metal foams. Recently, open-cell metal foams have been assembled into electromagnetic shields [1]. A model of open-cell metal foams has been incorporated as the electromagnetic shield model in electromagnetic wave propagation simulations [2,3]. This model is a simple construction with rectangle holes and constant-width edges. Therefore, it lacks the characteristic structures of real open-cell states, in which the edges have concave-triangular cross-sections and are thickened around the junctions (see Fig. 1). An alternative model [4] has circular holes but does not represent the concave-triangular edges.
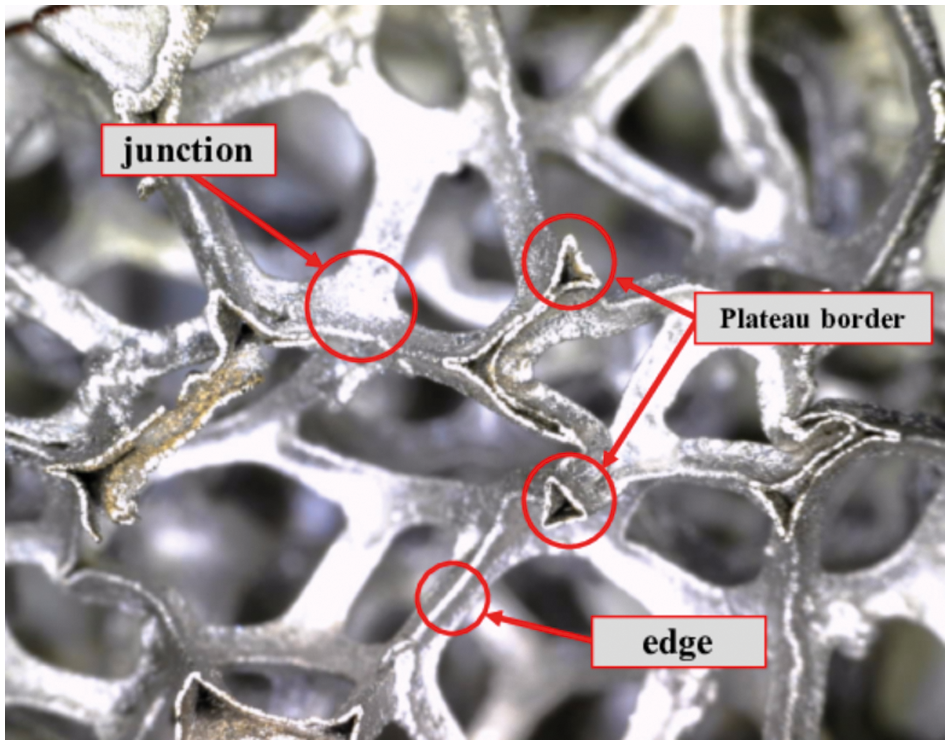
Figure 1: Structure of an open-cell metal foam
Another modeling method for open-cell metal foams using implicit functions has been proposed [5]. The implicit functions are appropriately arranged sphere functions. To construct the open-cell model, the sphere functions are combined using constructive solid geometry (CSG). The open-cell model represents the characteristic structures of edges and junctions in real open-cell metals (see Fig. 1). Such a model of the electromagnetic shield will likely outperform the conventional model.
The present study aims to evaluate the performance of an electromagnetic shield constructed in an open-cell model based on [5]. The open-cell-based electromagnetic shield is evaluated in electromagnetic simulations.
Open-cell metal foams are highly porous (see Fig. 1). For this reason, they are typically lightweight, which is advantageous in many applications.
As shown in Fig. 1, open-cell metal foams are assemblages of edges and vertices. Edges (generally called Plateau borders) are conjoined at vertices. The cross-section of a Plateau border is a concave triangle.
3 Modeling of Open Cell Metal Foam
To model open-cell metal foams, we employ the strategy described in [5] as a modeling method of open-cell metal foams. This strategy is briefly described below.
Each shape of the open-cell metal foam is represented by an implicit surface
In the open cell model of [5], a sphere is represented as
where (a, b, c) and r are the center and radius of the sphere, respectively. An appropriate arrangement of the spheres is shown in Fig. 2a. In this figure, the lines represent implicit surfaces satisfying
where n is the number of spheres. In Fig. 2a, n = 4. Note that,
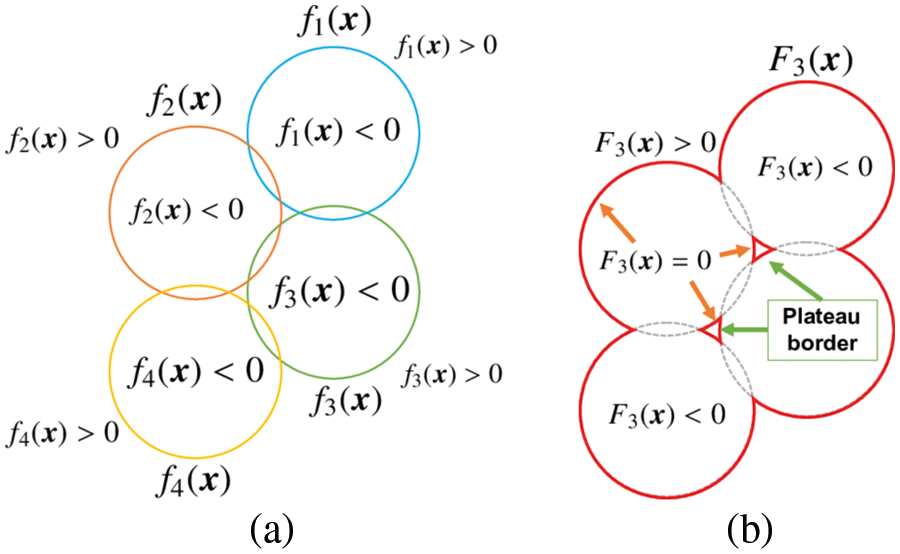
Figure 2: Schematics of (a) arranged spheres and (b) combined spheres after applying (2)
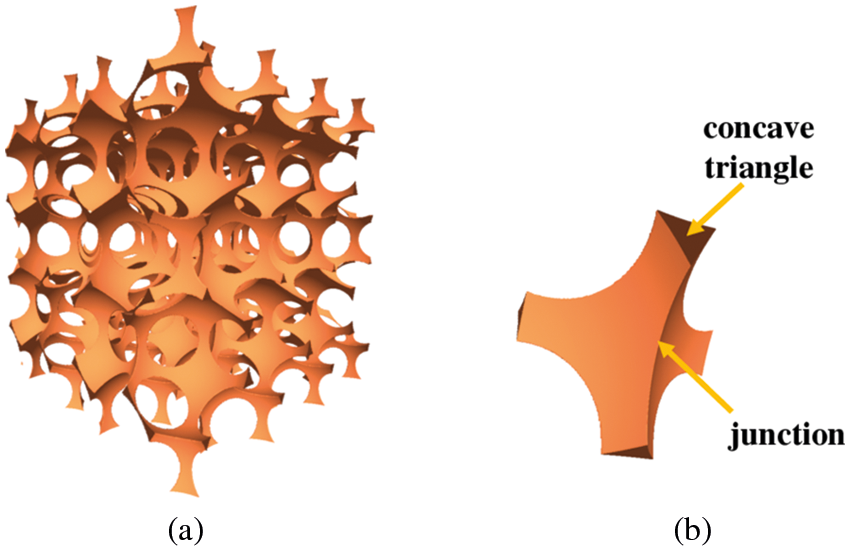
Figure 3: Result of (a) an open-cell metal foam model based on the strategy in [5] and (b) enlarged view around a junction, showing the edge cross-section. The cross-sections of the Plateau borders are shaped like concave triangles
One application of open-cell metal foams is electromagnetic shielding. The performance of electromagnetic shielding constructed from open-cell metal foams has recently been investigated in numerical simulations [2–4].
To evaluate the shielding effectiveness, we calculate the transmission coefficients between two ports in electromagnetic simulations with and without the metal foam shield generated based on [5]. In addition, we determine the shielding effectiveness
where S21 and
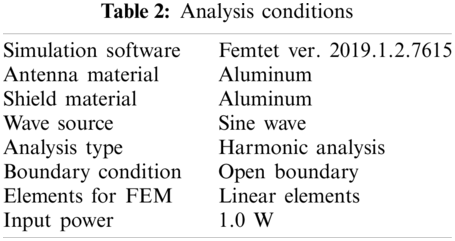
In numerical simulations of three-dimensional (3-D) electromagnetic wave propagation, this section investigates the performance of the open-cell metal foam model based on [5]. The model (see Fig. 4 assumes the experimental setup of [3]. Specifically, an electromagnetic shield is inserted between two oppositely-facing horn antennas. The electromagnetic wave is generated from Port 1 of the left antenna in Fig. 4, and the shield model is based on [5]. The horn antennas and shield are surrounded by air, and open boundary conditions are imposed on the system. Fig. 5 illustrates the placements of the antennas and shield in the simulation. The shield is located at
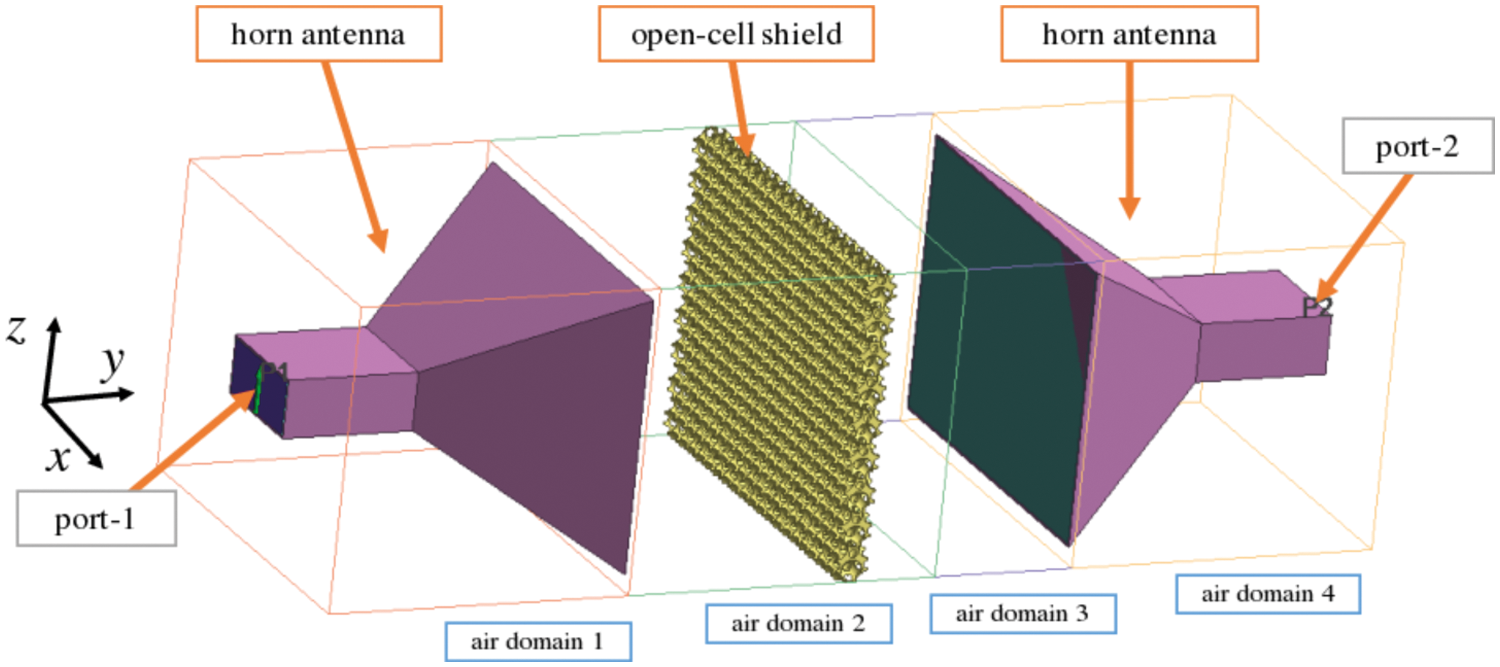
Figure 4: Simulation of electromagnetic shielding by an open-cell metal foam
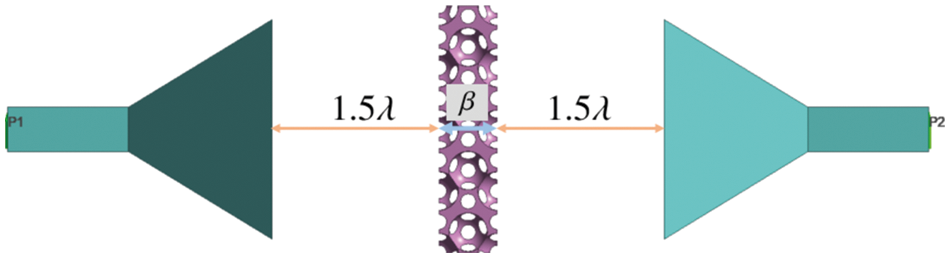
Figure 5: Position of the shield and horn antennas in the model.
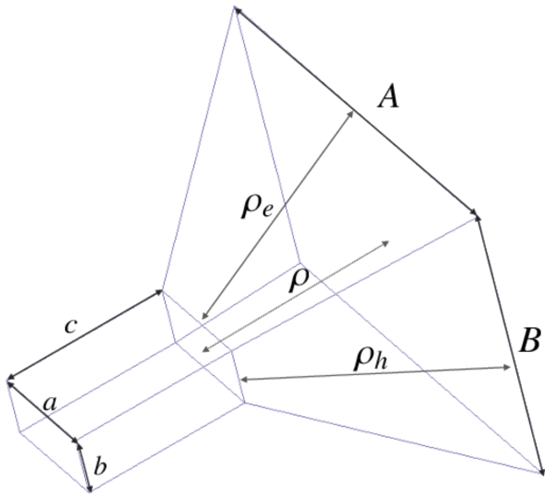
Figure 6: A horn antenna model, showing the geometric parameters
The method in [5] generates a unit model with geometric periodicity in all directions (see Fig. 7a). To construct a shield, we concatenated the unit model as shown in Fig. 7b. The size of the unit model depends on the radius r of the employed spheres. In Fig. 7b, each unit model is represented by a different color to illustrate its placement. Note that the shield is not concatenated in the y-direction; that is,
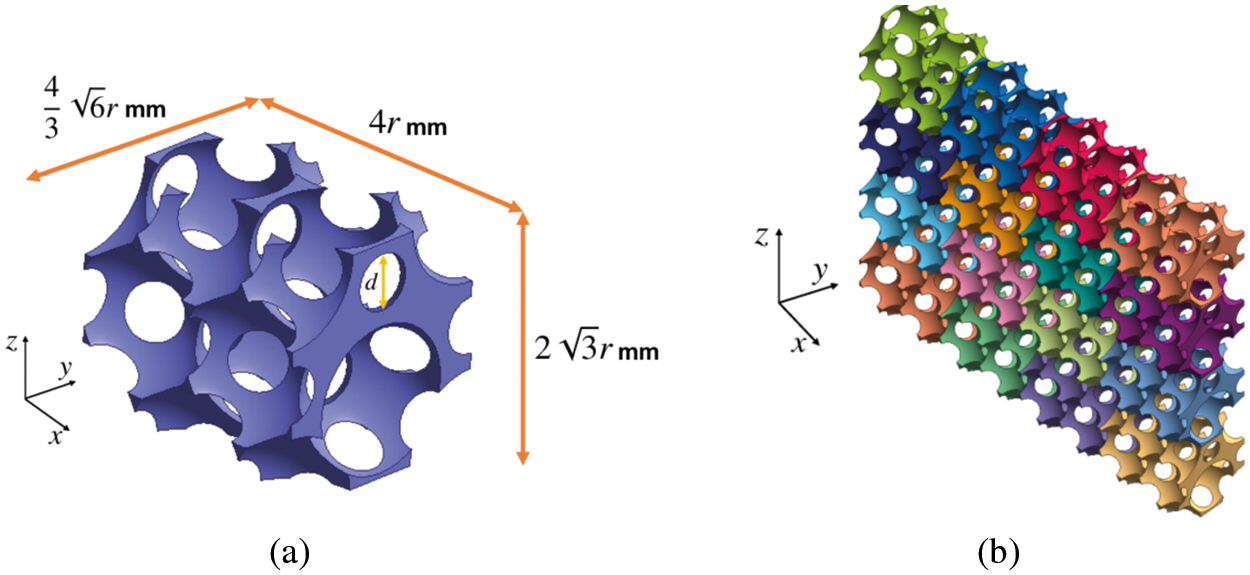
Figure 7: Examples of (a) the unit model based on [5] and (b) a shield model constructed by concatenating the unit model
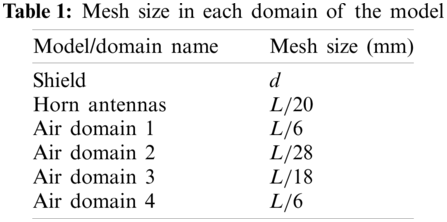
In the simulations, the air region was divided into four domains (see Fig. 4). To reduce the computational cost of the simulations, the mesh fineness was varied among the domains. The initial mesh resolution of Fig. 4 is shown in Fig. 8. As clarified in this figure, the mesh was finest in air domain 2, which contains the electromagnetic shield, and coarsest in the external parts of air domains 1 and 4. Table 1 shows the initial mesh sizes of air domains 1–4 and the horn antennas. In this table, L denotes the total length in the y-direction of the analysis domain in Fig. 8. Specifically,
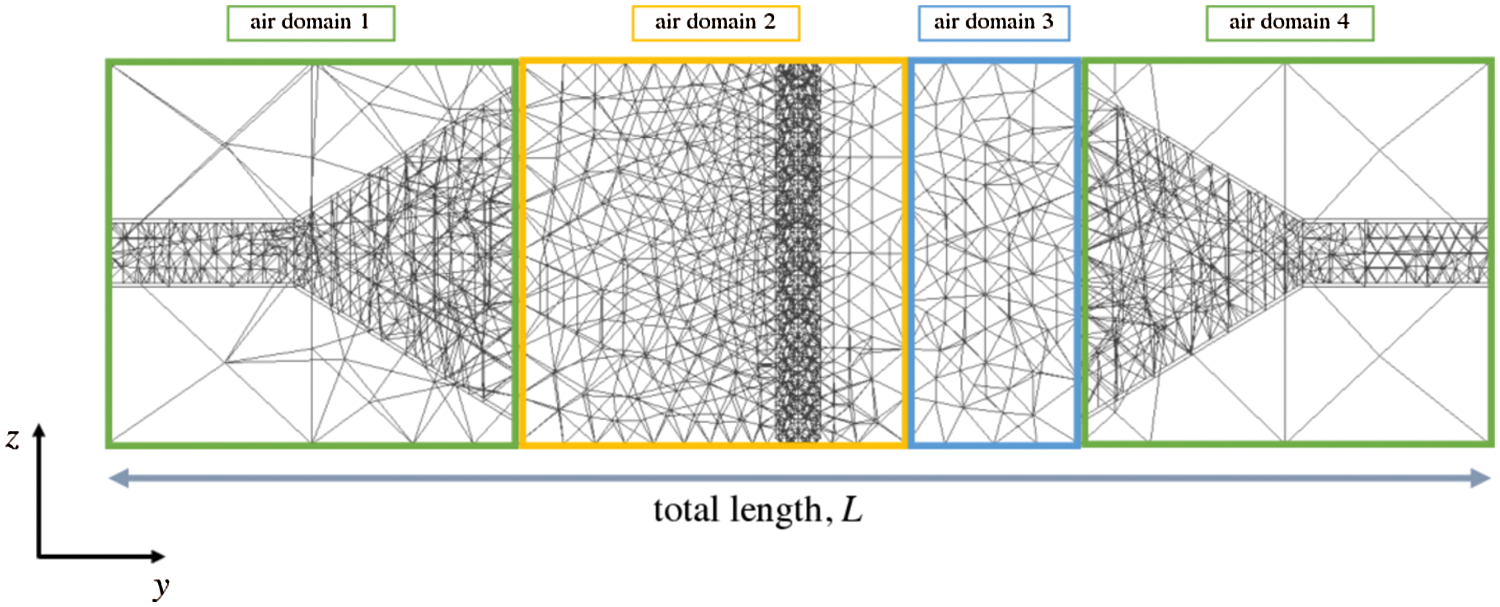
Figure 8: Initial mesh resolution of the model
In the simulations, the foam-hole diameter d of the electromagnetic shield constructed from the unit models was varied as 2.5 and 5.0 mm. We additionally set r = 3.0 mm,
The simulations results are displayed in Fig. 9. We first show the frequency dependence of
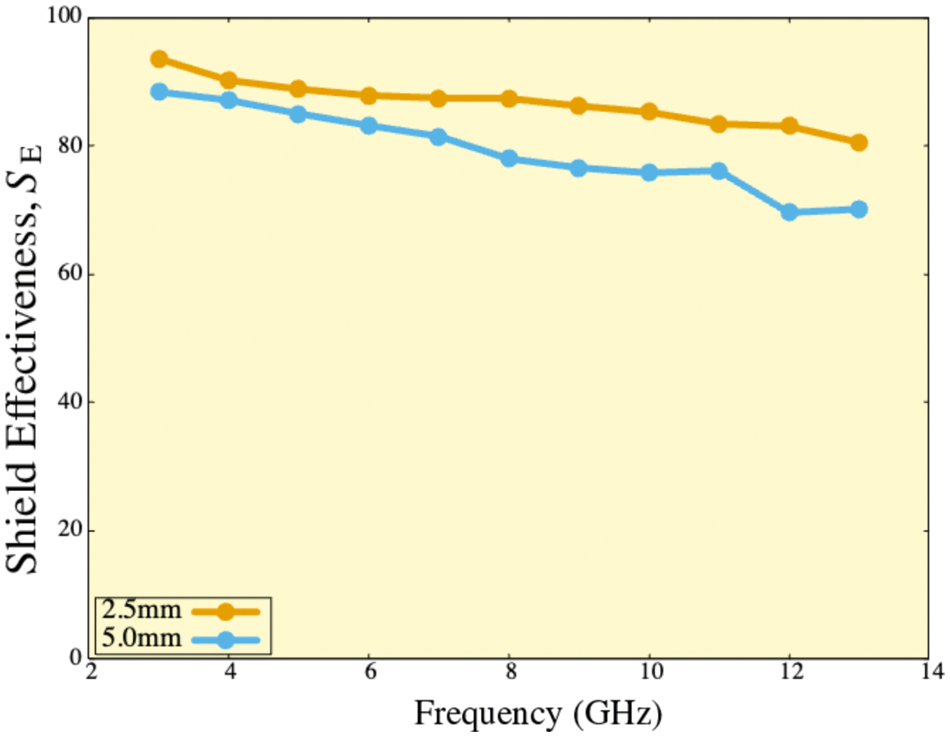
Figure 9: Frequency dependence of the shield effectiveness
Figs. 10 and 13 show the results at 8 and 13 GHz in the absence of the shield, respectively. In addition, Figs. 11 and 12 show the results at 8 GHz in the presence of the shields with d = 2.5 and 5.0 mm, respectively. Similarly, Figs. 14 and 15 show the results at 13 GHz in the presence of the shields with d = 2.5 and 5.0 mm, respectively. Panels (a) and (b) of Figs. 10–15 display the arrow plots of electric field
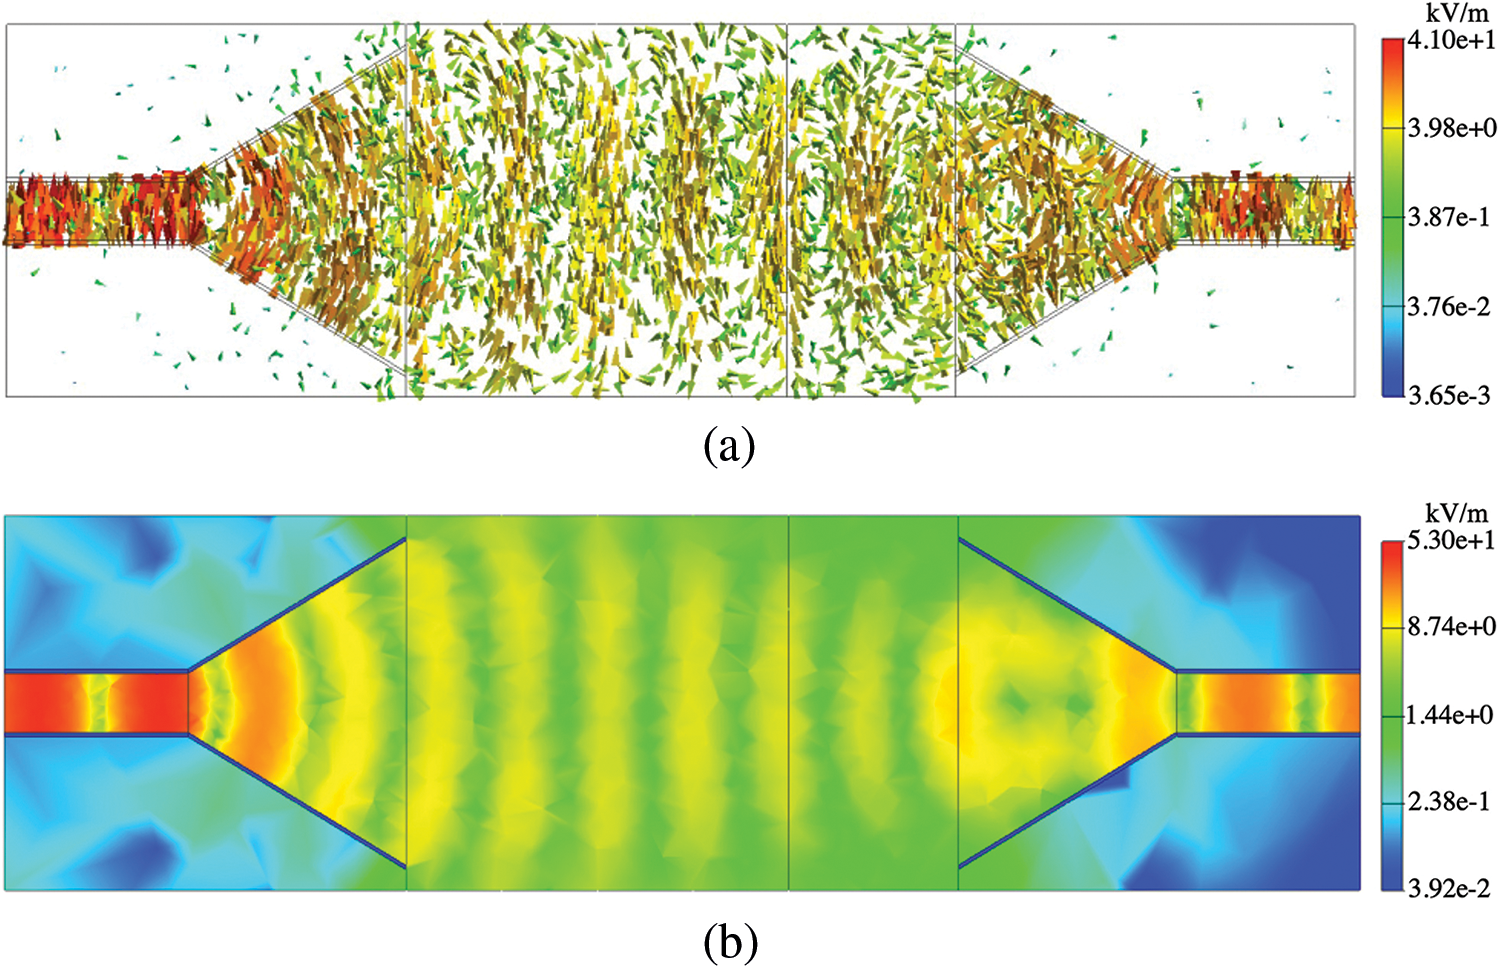
Figure 10: Results of (a) arrow plot of electric field
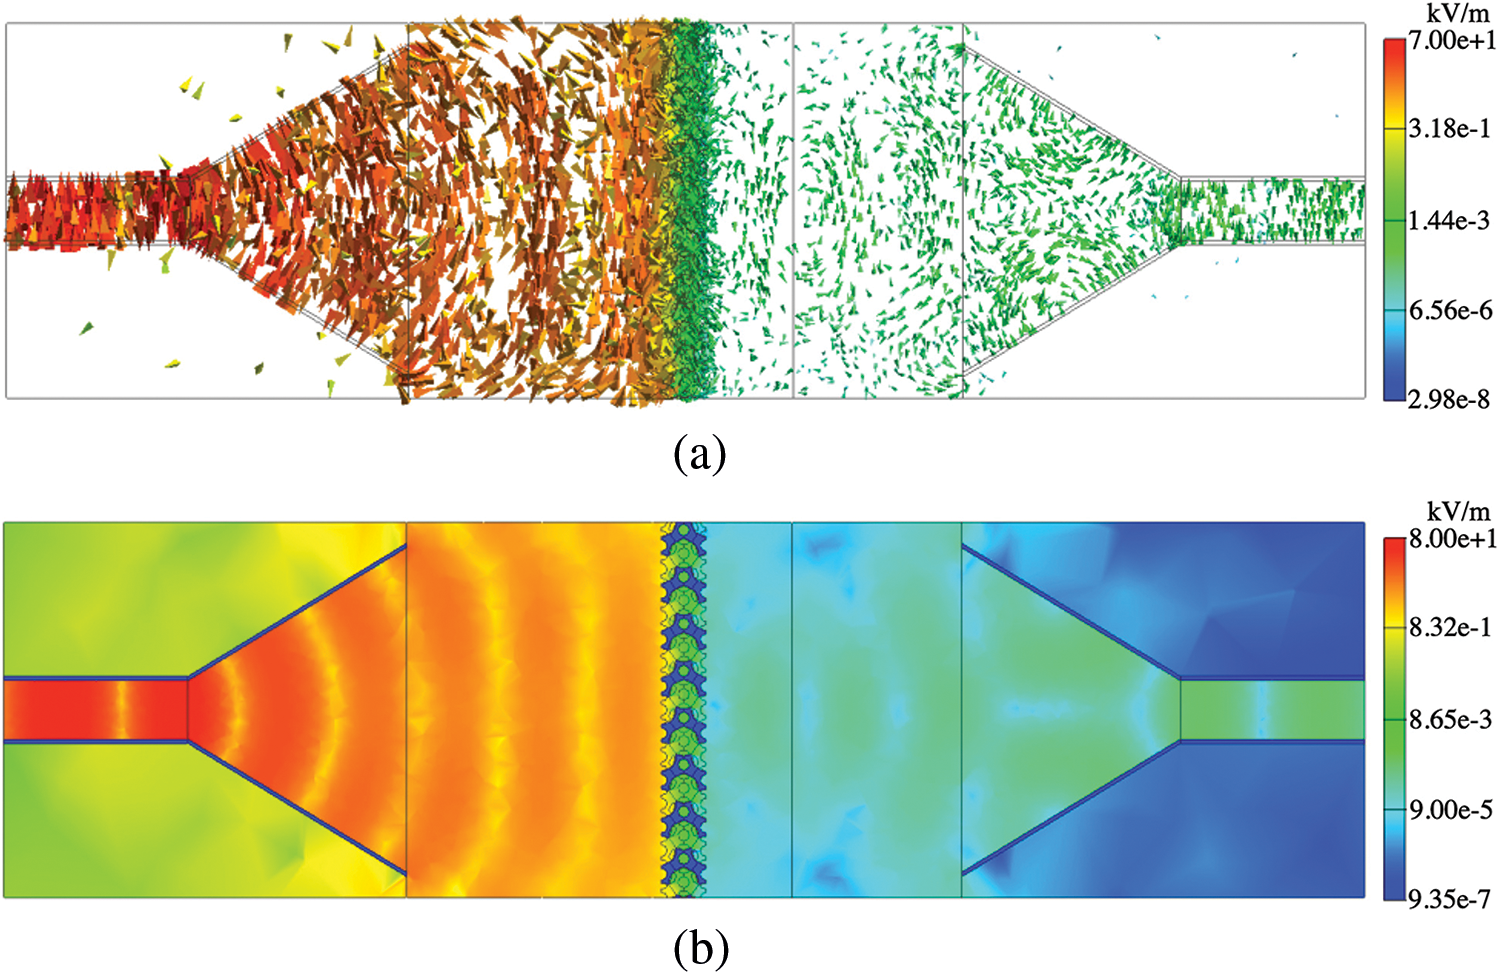
Figure 11: Results of (a) arrow plot of electric field
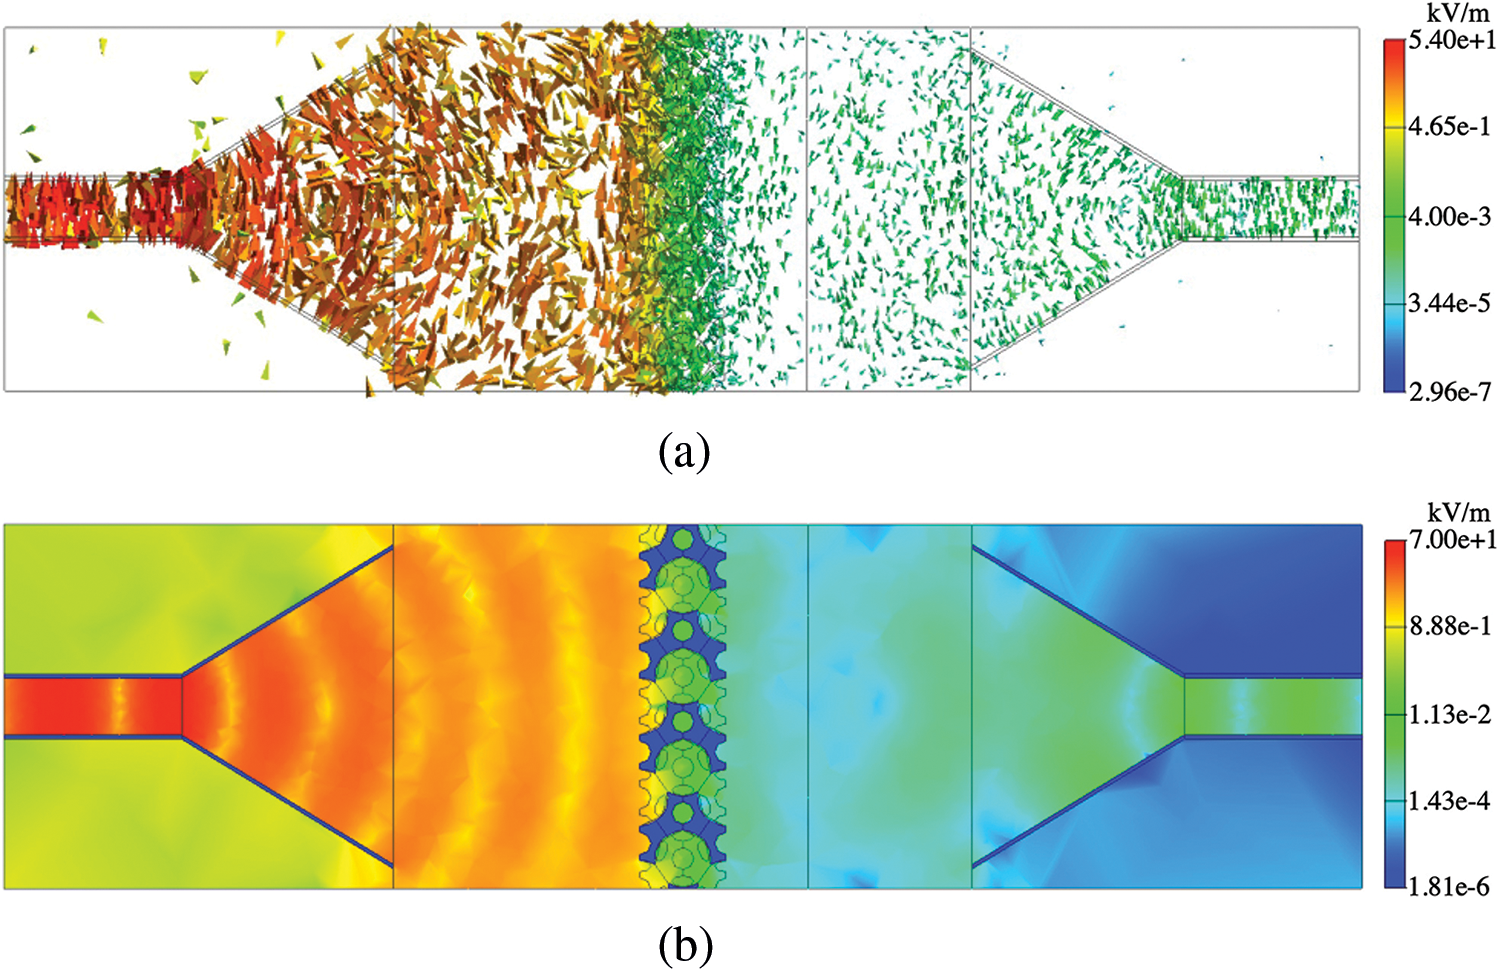
Figure 12: Results of (a) arrow plot of electric field
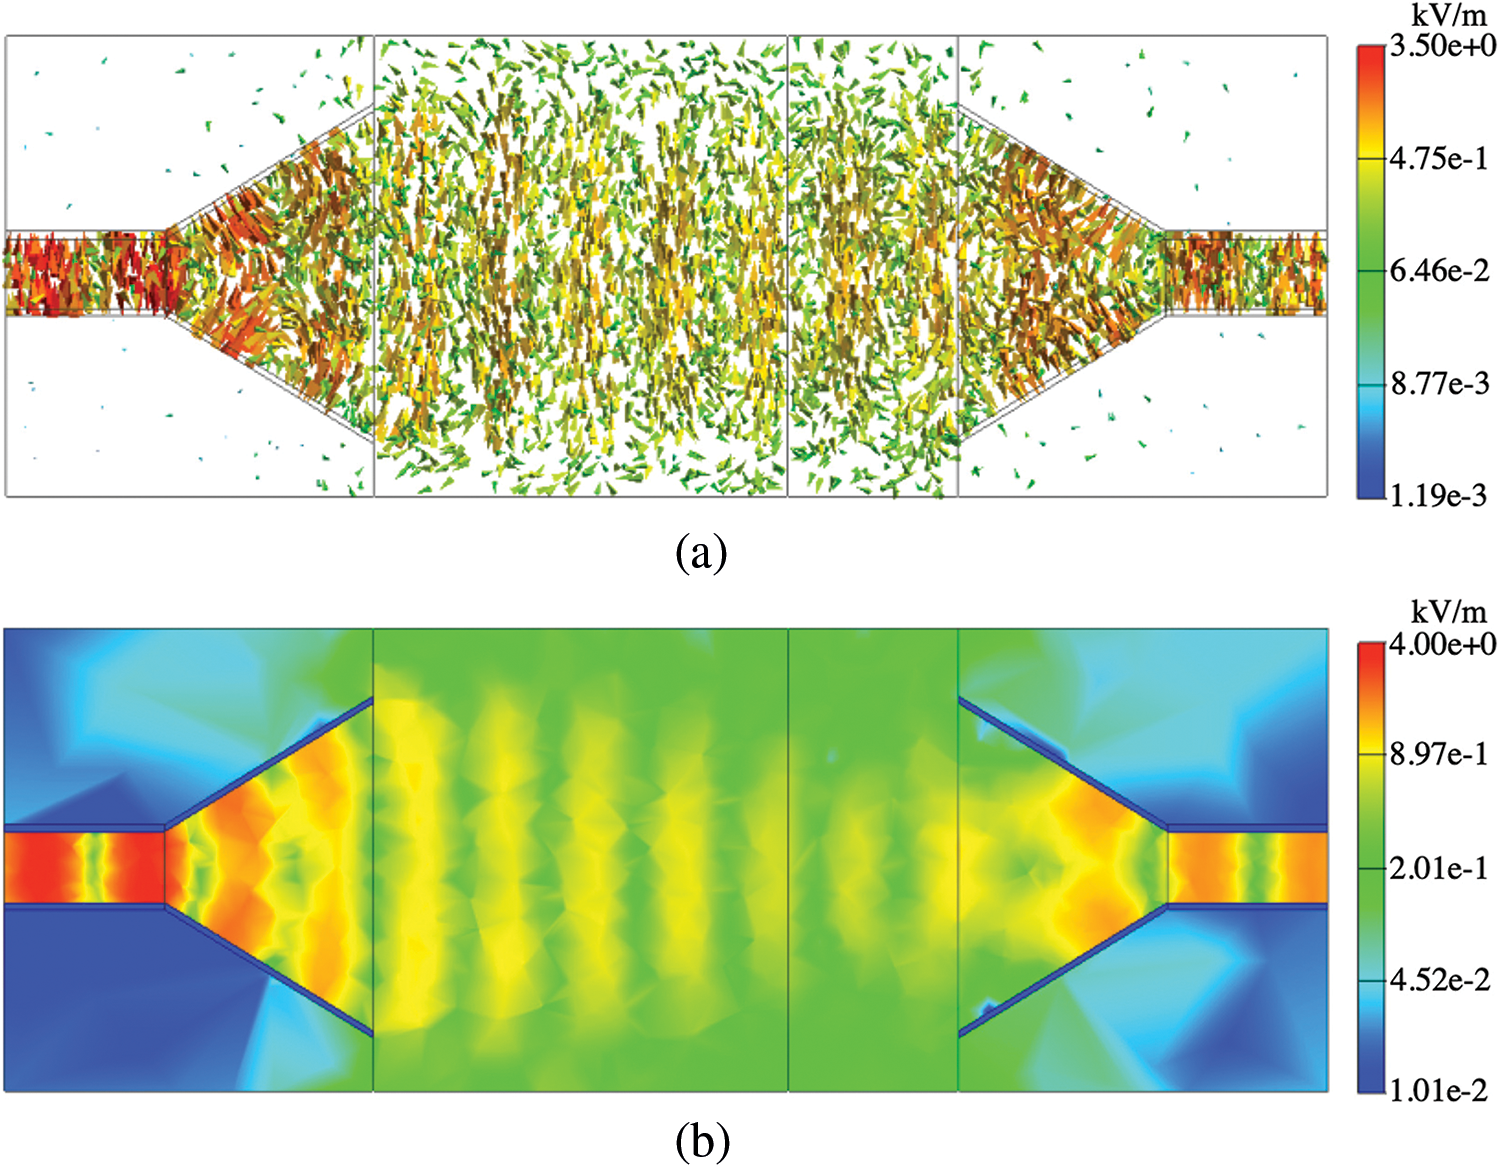
Figure 13: Results of (a) arrow plot of electric field
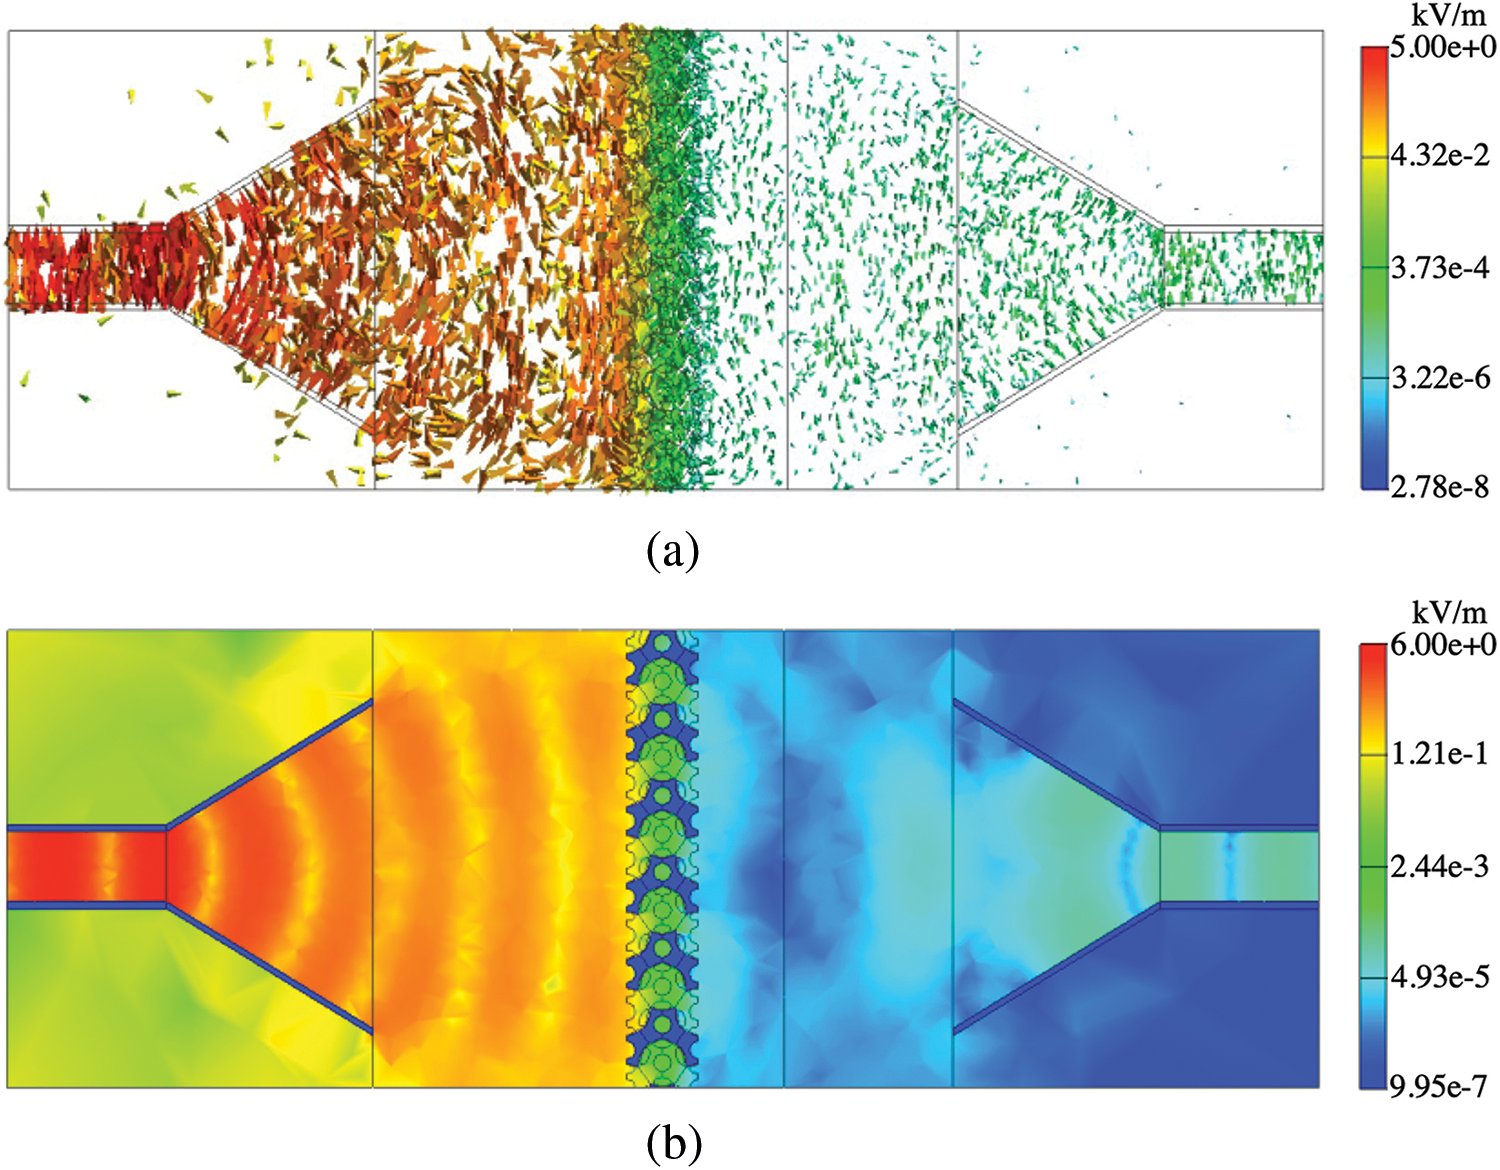
Figure 14: Results of (a) arrow plot of electric field
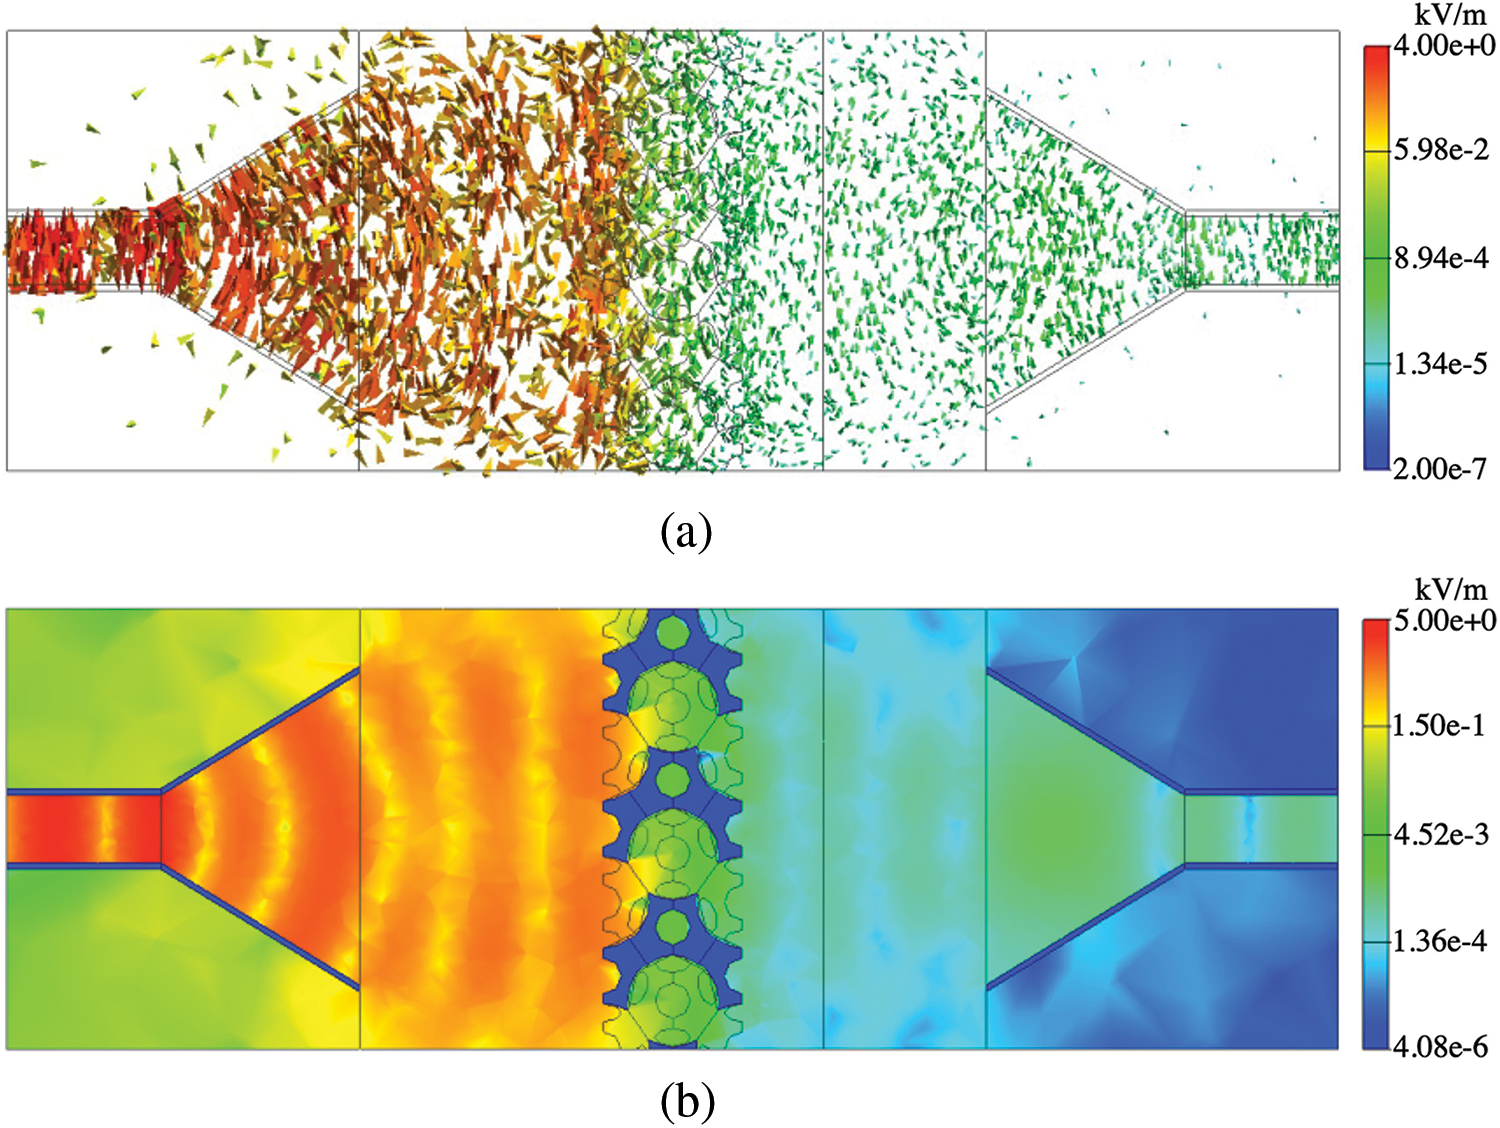
Figure 15: Results of (a) arrow plot of electric field
To evaluate the performance of a model constructed from open-cell metal foams [5], we simulated electromagnetic wave propagations between two horn antennas separated by an electromagnetic shield constructed from the model. In the simulations, the hole diameter of the electromagnetic shield was varied as 2.5 and 5.0 mm, and the shield effectiveness was investigated over the frequency range 3–13 GHz. The main conclusions are summarized below:
1. Shields with holes of both diameters attenuated electromagnetic waves in the 3–13 GHz range.
2. The effectiveness of the shields with holes of both diameters was enhanced at low frequencies.
3. The shielding effectiveness was enhanced by reducing the hole diameter of the metal foam.
Overall, we conclude that the shields generated in the open-cell metal foam model can attenuate electromagnetic waves.
In future work, the shield performance will be evaluated over a wider frequency range, and the physical behavior of the open-cell model will be investigated for different shield materials. In addition, other kinds of evaluations such as comparing between the simulation and real experimental results and a structural analysis of the open-cell metal foam model will be performed.
Funding Statement: This work was partially supported by JSPS KAKENHI Grant No. 18K11329.
Conflicts of Interest: The authors declare that they have no conflicts of interest to report regarding the present study.
1. Kumar, R., Jain, H., Sriam, S., Chaudhary, A., Khare, A. et al. (2020). Lightweight open cell aluminum foam for superior mechanical and electromagnetic interference shielding properties. Materials Chemistry and Physics, 240, 122274. DOI 10.1016/j.matchemphys.2019.122274. [Google Scholar] [CrossRef]
2. Losito, O., Barletta, D., Dimiccoli, V. (2010). A Wide-frequency model of metal foam for shielding applications. IEEE Transactions Electromagnetic Compatibility, 52(1), 75–81. DOI 10.1109/TEMC.2009.2035109. [Google Scholar] [CrossRef]
3. Wang, L. B., See, K. Y., Ling, Y., Koh, W. J. (2012). Study of metal foams for architectural electromagnetic shielding. Journal of Materials in Civil Engineering, 24(4), 488–493. DOI 10.1061/(ASCE)MT.1943-5533.0000403. [Google Scholar] [CrossRef]
4. Rodríguez, F., Meneses, M., Chiné, B. (2019). Computational analysis of metal foams for EMI shielding using Comsol Multiphysics. Comsol Conference, Cambridge. [Google Scholar]
5. Hanaoka, Y., Itoh, T., Nakata, S., Watanabe, K. (2020). Sphere-function-based shape modelling of open cell metal foam with plateau borders. Journal of Advanced Simulation in Science and Engineering, 7(1), 89–101. DOI 10.15748/jasse.7.89. [Google Scholar] [CrossRef]
6. Balanis, C. A. (2016). Antenna theory: Analysis and design, 4th edition. Hoboken: John Wiley & Sons. [Google Scholar]
7. Pasternack Enterprises, Inc. Standard gain horn antennas with waveguide input. https://www.pasternack.com/standard-gain-horn-antennas-with-waveguide-input-category.aspx. [Google Scholar]
8. Everything RF. Waveguide sizes (2022). https://www.everythingrf.com/tech-resources/waveguides-sizes. [Google Scholar]
9. Murata Software. Femtet (2022). https://www.muratasoftware.com/en/. [Google Scholar]
 | This work is licensed under a Creative Commons Attribution 4.0 International License, which permits unrestricted use, distribution, and reproduction in any medium, provided the original work is properly cited. |