| Computer Modeling in Engineering & Sciences |
DOI: 10.32604/cmes.2022.019522
ARTICLE
Mechanical Properties of Soil-Rock Mixture Filling in Fault Zone Based on Mesostructure
1Department of Engineering Mechanics, Hohai University, Nanjing, 210098, China
2Laboratoire de Génie Civil et géo-Environnement, Université de Lille, Lille, 59000, France
3Laboratoire de Mécanique, Multiphysique, Multi-échelle, Université de Lille, Lille, 59000, France
*Corresponding Author: Qingwen Ren. Email: renqw@hhu.edu.cn
Received: 28 September 2021; Accepted: 27 December 2021
Abstract: Soil-rock mixture (SRM) filling in fault zone is an inhomogeneous geomaterial, which is composed of soil and rock block. It controls the deformation and stability of the abutment and dam foundation, and threatens the long-term safety of high arch dams. To study the macroscopic and mesoscopic mechanical properties of SRM, the development of a viable mesoscopic numerical simulation method with a mesoscopic model generation technology, and a reasonable parametric model is crucially desired to overcome the limitations of experimental conditions, specimen dimensions, and experiment fund. To this end, this study presents a mesoscopic numerical method for simulating the mechanical behavior of SRM by proposing mesoscopic model generation technology based on its mesostructure features, and a rock parameter model considering size effect. The validity and rationality of the presented mesoscopic numerical method is experimentally verified by the triaxial compression tests with different rock block contents (RBC). The results indicate that the rock block can increase the strength of SRM, and it is proved that the random generation technique and the rock parameter model considering size effect are validated. Furthermore, there are multiple failure surfaces for inhomogeneous geomaterial of SRM, and the angle of the failure zone is no longer 45°. The yielding zones of the specimen are more likely to occur in thin sections of soil matrix isolated by blocks with the failure path avoiding the rock block. The proposed numerical method is effective to investigate the meso-damage mechanism of SRM.
Keywords: Soil-rock mixture (SRM); triaxial compression tests; random generation technique; mesostructure; rock parameter model; size effect; finite element method
The high arch dams in China are gradually going through the impounding and operation periods, such as the Jinping arch dam (305 m), the Xiaowan arch dam (294.5 m), and the Xiluodu arch dam (285.5 m). However, geological defects such as faults are generally developed in the dam abutment and dam foundation, which predominantly control the deformation and stability of the dam abutment and dam foundation, threatening the long-term safety of high arch dams [1]. According to relative statistics [2–4], 70% of the significant arch dam accidents are related to the development of faults and cracks in the dam abutment and the dam foundation. The fault breccia and fault gouge mixture (rock and soil mixtures, SRM) filling in faults, the most critical factor controlling the deformation, permeability, and stability of the dam abutment and dam foundation, generally has the characteristics of small deformation modulus, serious weathering, low strength and strong permeability [5]. Thusly, it is essential and crucial to investigate the mechanical properties and deformation laws of the SRM in the fault zone.
The SRM, a significant geological body that is different from soil and rock, has raised increasing attention in geotechnical engineering, and many researchers have carried out systematic research on its physical and mechanical properties. The current studies on the SRM are mainly based on two aspects: physical experiment and numerical simulation experiment.
The physical experiments mainly focus on the investigation of influencing factors on the macro-mechanical behavior of SRM, such as rock block content (RBC) and particle size distribution. On the one hand, the results of shear tests [6–15] indicate the mechanical properties of SRM with low RBCs are predominantly controlled by the soil. In cases of high RBCs, the mechanical properties of SRM are jointly controlled by the rock and the soil, with the strength being significantly improved in such cases. Also, the internal friction angle increases with the growth of the RBC. However, no uniform change rules are observed for cohesion. On the other hand, the results of experimental tests [11,16–20] of SRM are affected by block particle diameters. The SRM has a typical size effect, and the larger blocks in SRM control their macroscopic deformations and destructions to some extent. In addition, the permeability tests of SRM are performed as well. In the permeability test [21], the permeability coefficient of SRM with different gravel contents was measured. The effects of particle size, void ratio, and particle shape on the permeability of SRM were evaluated. A further equation was established to evaluate hydraulic conductivity with the three factors above. The characteristics of SRM with different RBCs were examined through permeability testing by Wang et al. [22,23]. The experimental results implied that the average permeability coefficient decreases first and then increases with the growth of RBC, and the permeability coefficient of SRM decreases with the increase of confining pressure, which is probably due to the interactions between soil matrix and rock blocks.
The numerical simulation technology featured as an essential method to study the mechanical properties of SRM is developed rapidly in recent decades because it can overcome the limitations of conditions and specimen dimensions in physically experimental tests. In numerical simulation methods, the generation of mesostructure is the first crucial problem to be addressed, especially for the complex structures of SRM. Currently, various mesostructure generation methods have been established, including the Monte Carlo method [24–26] and the digital image processing technology [27–29]. Based on the SRM mesostructure, the mesoscopic mechanism of SRM's mechanical behavior can be revealed. A stochastic structural model of SRM through the Monte Carlo method was built, and the direct shear tests were conducted by Li et al. [26]. The numerical and experimental results showed that the fracture patterns exhibit shear failure with irregular fracture planes. A mesostructure concept model of SRM was proposed by Xu et al. [29] to represent the inhomogeneity of SRM based on the technique of digital image processing, and the two large-scale direct shear tests of inhomogeneous SRM were carried out by using the finite element method. The numerical results indicated that owing to the existence of the ‘‘rock’’ blocks in SRM, there were three modes during the failure process: failure path going round through one side of the ‘‘rock’’ block, failure path going round by both sides of the ‘‘rock’’ block, and failure path passing through the weak ‘‘rock’’ block. A random mesostructure model was presented, and a series of biaxial compression tests with different block proportions, shapes, orientations of blocks and specimen sizes were carried out by Pan et al. [30]. The results indicated that the strength of BIM colluvium increased with the growth of block proportion, rock-block orientation affected the anisotropy of mechanical properties, and the block aspect ratio only had a minor influence on the strength and stiffness. In addition, it also showed that mechanical properties remained constant when the specimen size approached a certain representative elemental volume (REV). A damage constitutive model of SRM based on the random distribution characteristics of strength was established by Wang et al. [31,32]. The damage characteristics with damage element number (DEN) were described through RFPA2D. The numerical results showed that damage characteristics of SRM were progressive: the crack began from rock–soil jointed interfaces, then propagated into the soil matrix, and finally, the growth of the crack-shear band and macro-pore caused the failure of SRM.
According to the authors’ knowledge, only limited current studies take accounts of the influences of “rock block” on SRM filling in fault zone when investigating its mechanical strength parameters and deformation characteristics [32–36]. Additionally, the conduction of physical experiments requires specific conditions, designated specimen dimensions, and observing the evolution of the internal structure is inconvenient in the physical experiments. Therefore, it is more efficient to study the macroscopic and mesoscopic mechanical properties of SRM filling in fault zone based on mesostructure by numerical simulation methods. The main problems in mesoscopic numerical simulation methods are generating a mesostructured model and reasonably selecting parameters. Up to now, there are only a handful of studies on the mapping grid method for the random mesostructure generation technology of SRM. In addition, the rock size effect has rarely been considered in previous studies. Thus, an improved numerical method for the random mesostructure generation technology of SRM, together with the consideration of the rock size effect, is essentially desired in the precise simulation of the SRM.
This study aims to develop a mesoscopic numerical simulation method by proposing a random mesostructure generation technology and rock parameter model considering the size effect for future research of macroscopic and microscopic mechanical properties and deformation mechanisms. By this mesoscopic numerical method, a series of extended studies could be carried out, for example, multifield coupling analysis, meso-damage failure analysis, and so on. In this study, Section 2 conducts triaxial compression tests of soil in SRM and SRM with different RBCs to provide the model parameters and verify the correctness of the numerical method. Section 3 analyses the experimental results in Section 2 in detail. Section 4 regards the SRM as a two-phase structure composed of rock and soil, and proposes the random mesostructure generation technology based on the mapping grid method by proposing the mapping algorithm and the algorithm for generating a random block. In addition, Section 5 presents the rock parameter model considering the rock size effect. Finally, Section 6 performs the triaxial compression tests through the finite element method to study the influence of rock block content (RBC) on the macro-mechanical and meso-mechanical behaviors of SRM.
2.1 Materials Particle Analysis
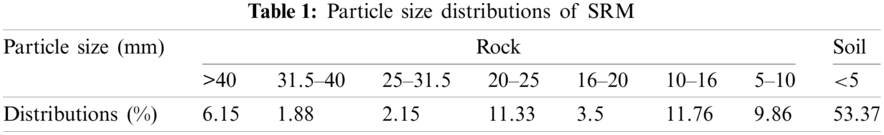
There are several faults developed in the dam abutment and dam foundation of Jinping I Hydropower Station. Their locations and distributions are presented in Fig. 1a. Among the faults, the fault f42-9 located on the left of the dam mainly controls the slope safety. Therefore, the filling of the fault f42-9 is investigated in this study. Deposit samples are taken from the f42-9 fault, which is composed of breccia and fault gouge (Fig. 2). After being dried by dring case, the sieve test was carried out based on Test Methods of Soils for Highway Engineering/JTG E40-2007 of China. The grain size distributions of SRM obtained from the sieve test are shown in Table 1.
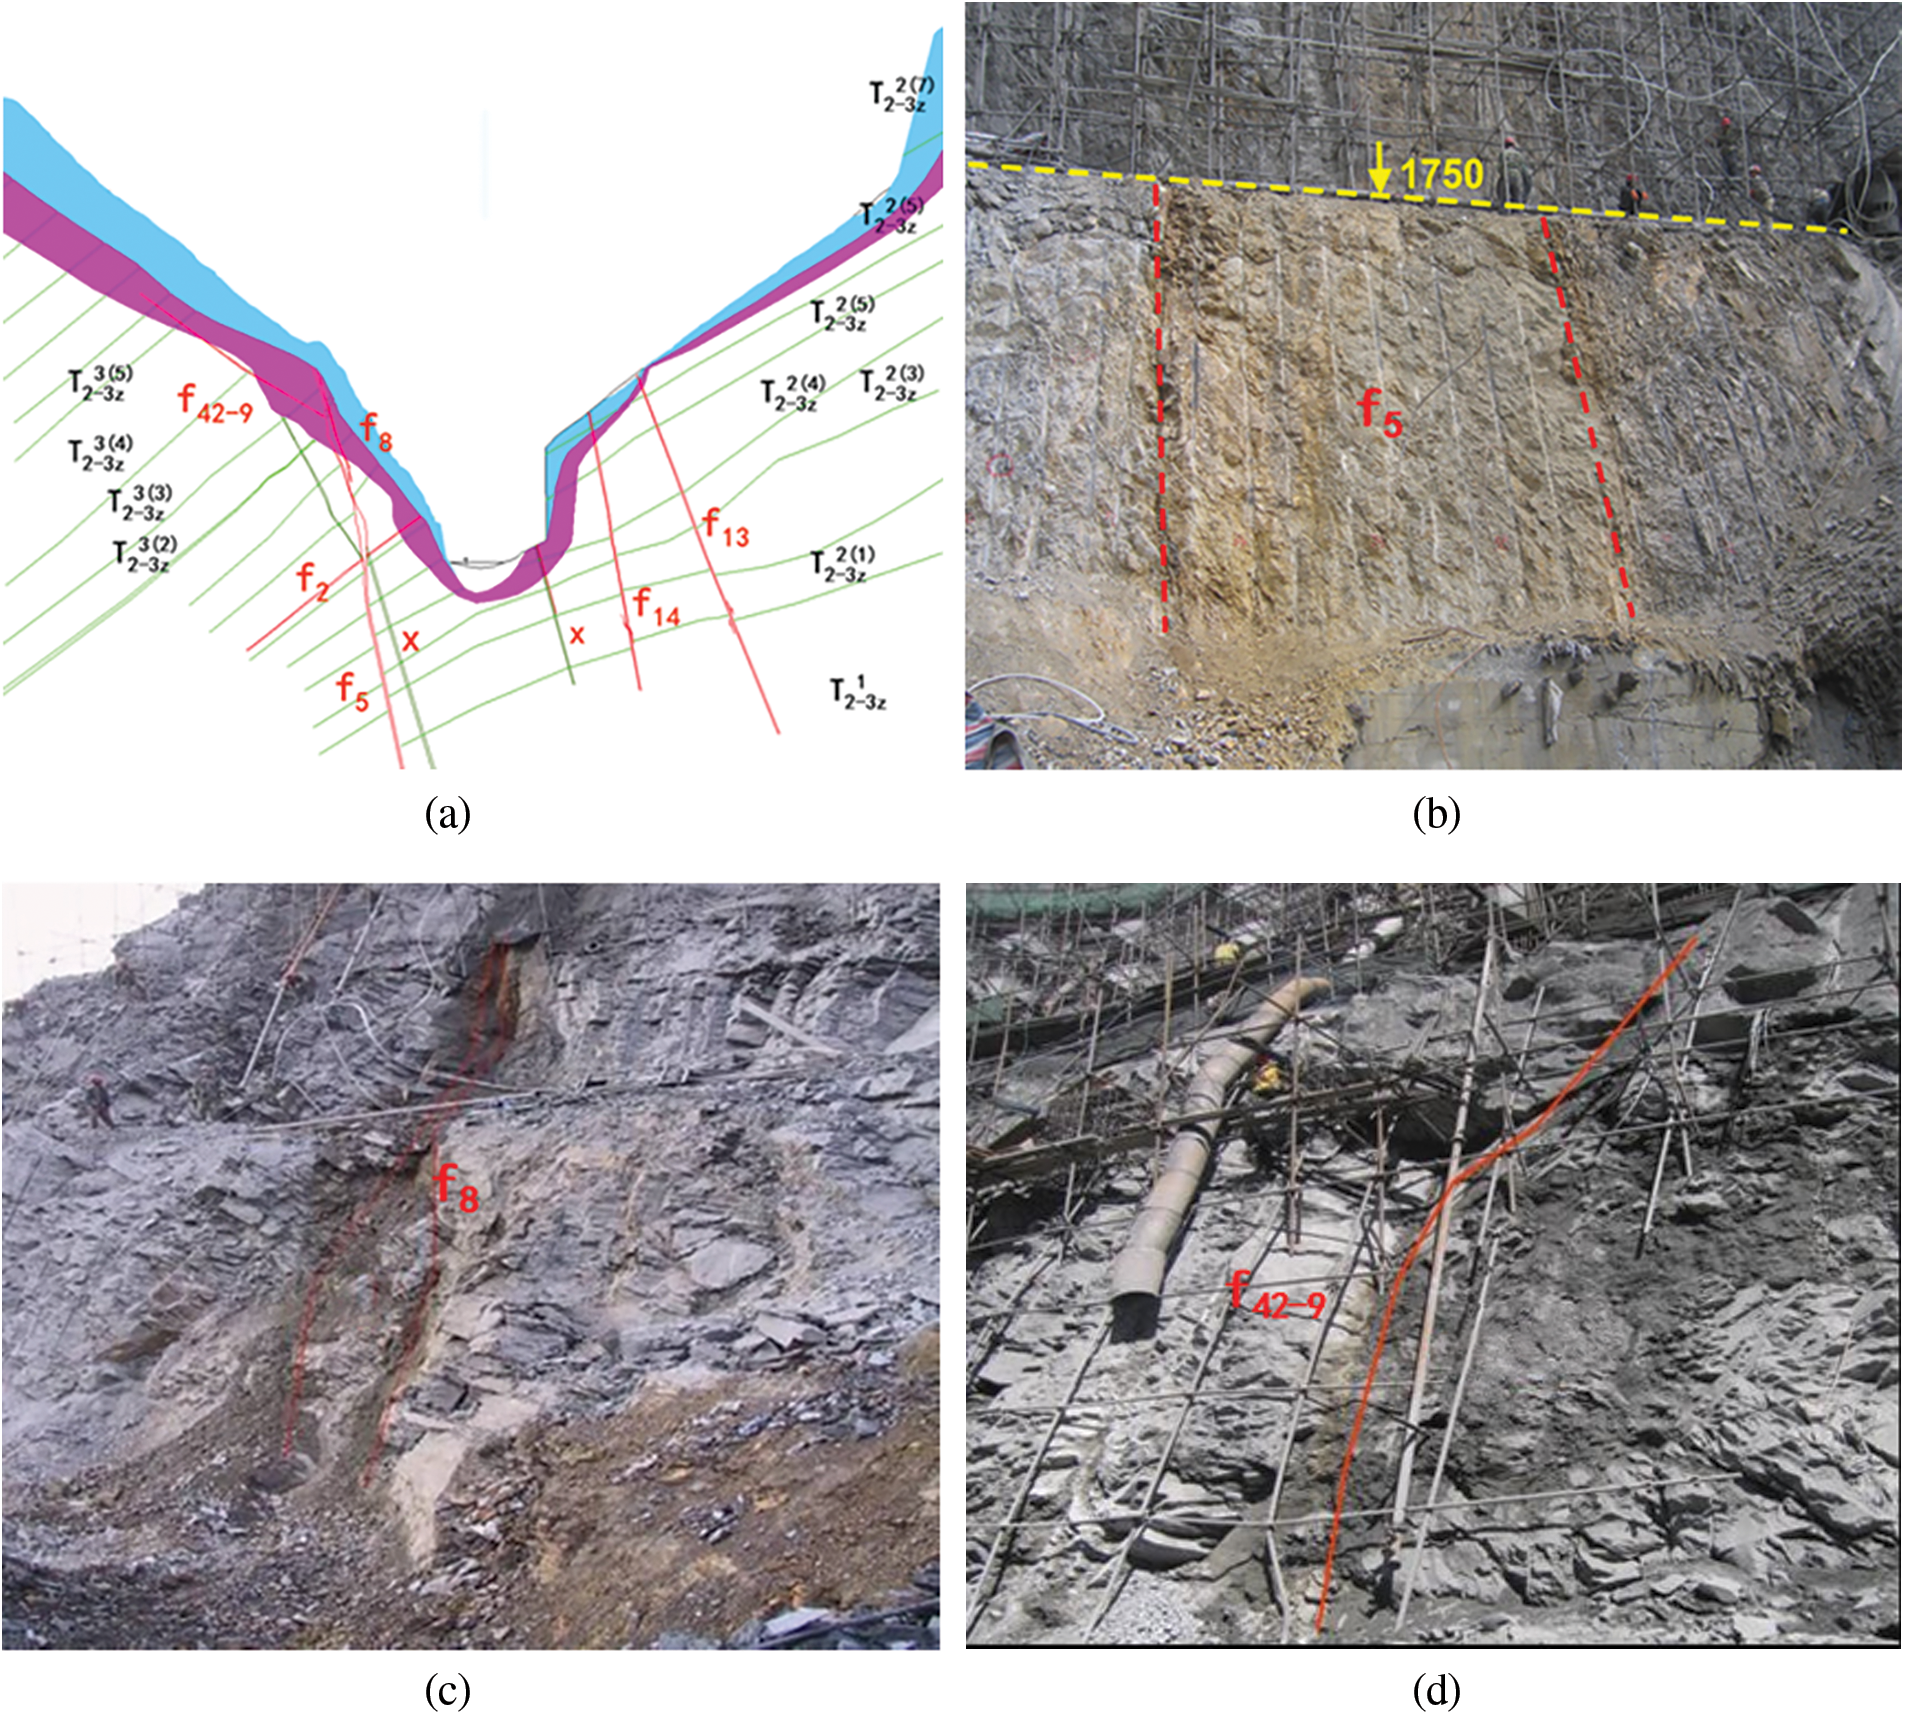
Figure 1: Developed faults of the valley (a) geological profile of the valley; (b) f5 fault; (c) f8 fault; (d) f42-9 fault
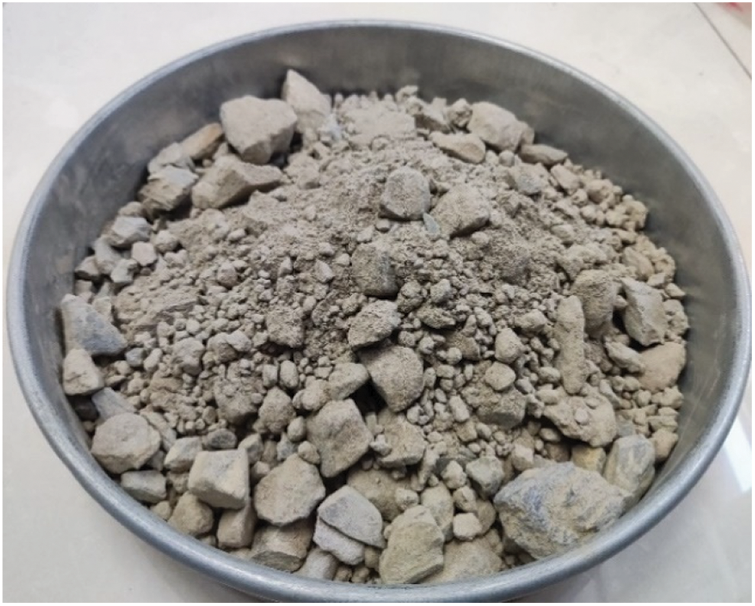
Figure 2: SRM fillings in the f42-9 fault zone
It is widely known that particle classification is the main basis for judging soil types. Similarly, SRM also has the problem of dividing “soil” and “rock block” in SRM, that is, how to determine the threshold of soil and rock, which can distinguish between “soil” and “rock block”. Meanwhile, it is also the key factor to determine the block content. In China, the rules of building materials stipulate that for SRM, the boundary size of “block” and “soil” is taken as 5 mm. In addition, many scholars [37–41] also agree with the specification that specifies 5 mm as the soil-rock threshold in SRM. Namely, the particles with a particle size less than 5 mm are regarded as fine soil, and those with a particle size greater than 5 mm are regarded as rock blocks. In this study, the soil-rock threshold is also considered to be 5 mm.
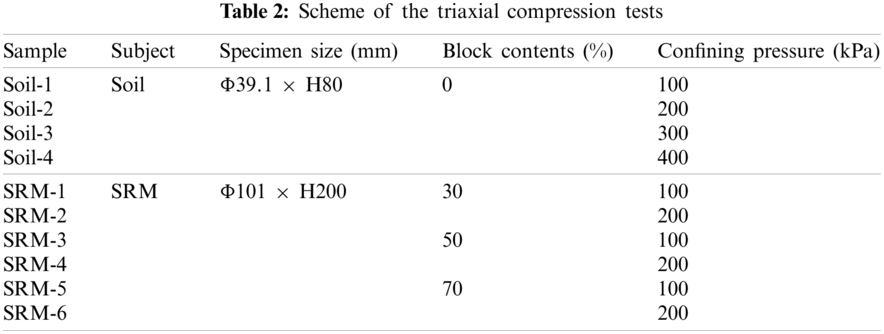
As a special engineering geological body, SRM consists of stiff rocks and comparatively soft soils, which determine the mesostructure damage and macroscopic mechanical properties of SRM. In this study, the triaxial compression tests of SRM with different block contents are carried out, which can reflect the influence of block content on the mechanical behavior of SRM. The case of RBC = 0 is set to research the physical properties of the soil matrix in SRM and provide reliable parameters for the numerical simulation tests of SRM. In addition, the soil with a particle size of less than 5 mm is taken as the fine-grained soil, and for rock, the particle size is between 5–20 mm in this test. The scheme of the triaxial compression tests for soil and SRM is shown in Table 2.
2.3 Preparation of Model Samples
According to Table 1, the soil tests specimen is 39.1 mm in diameters and 80 mm in height, and the SRM tests specimen is 101 mm in diameters and 80 mm in height. The samples are prepared according to the natural dry density of 1.74 g/cm3 in the project. According to the principle of similar gradation, the proportion of each grain size of rock block is calculated which is
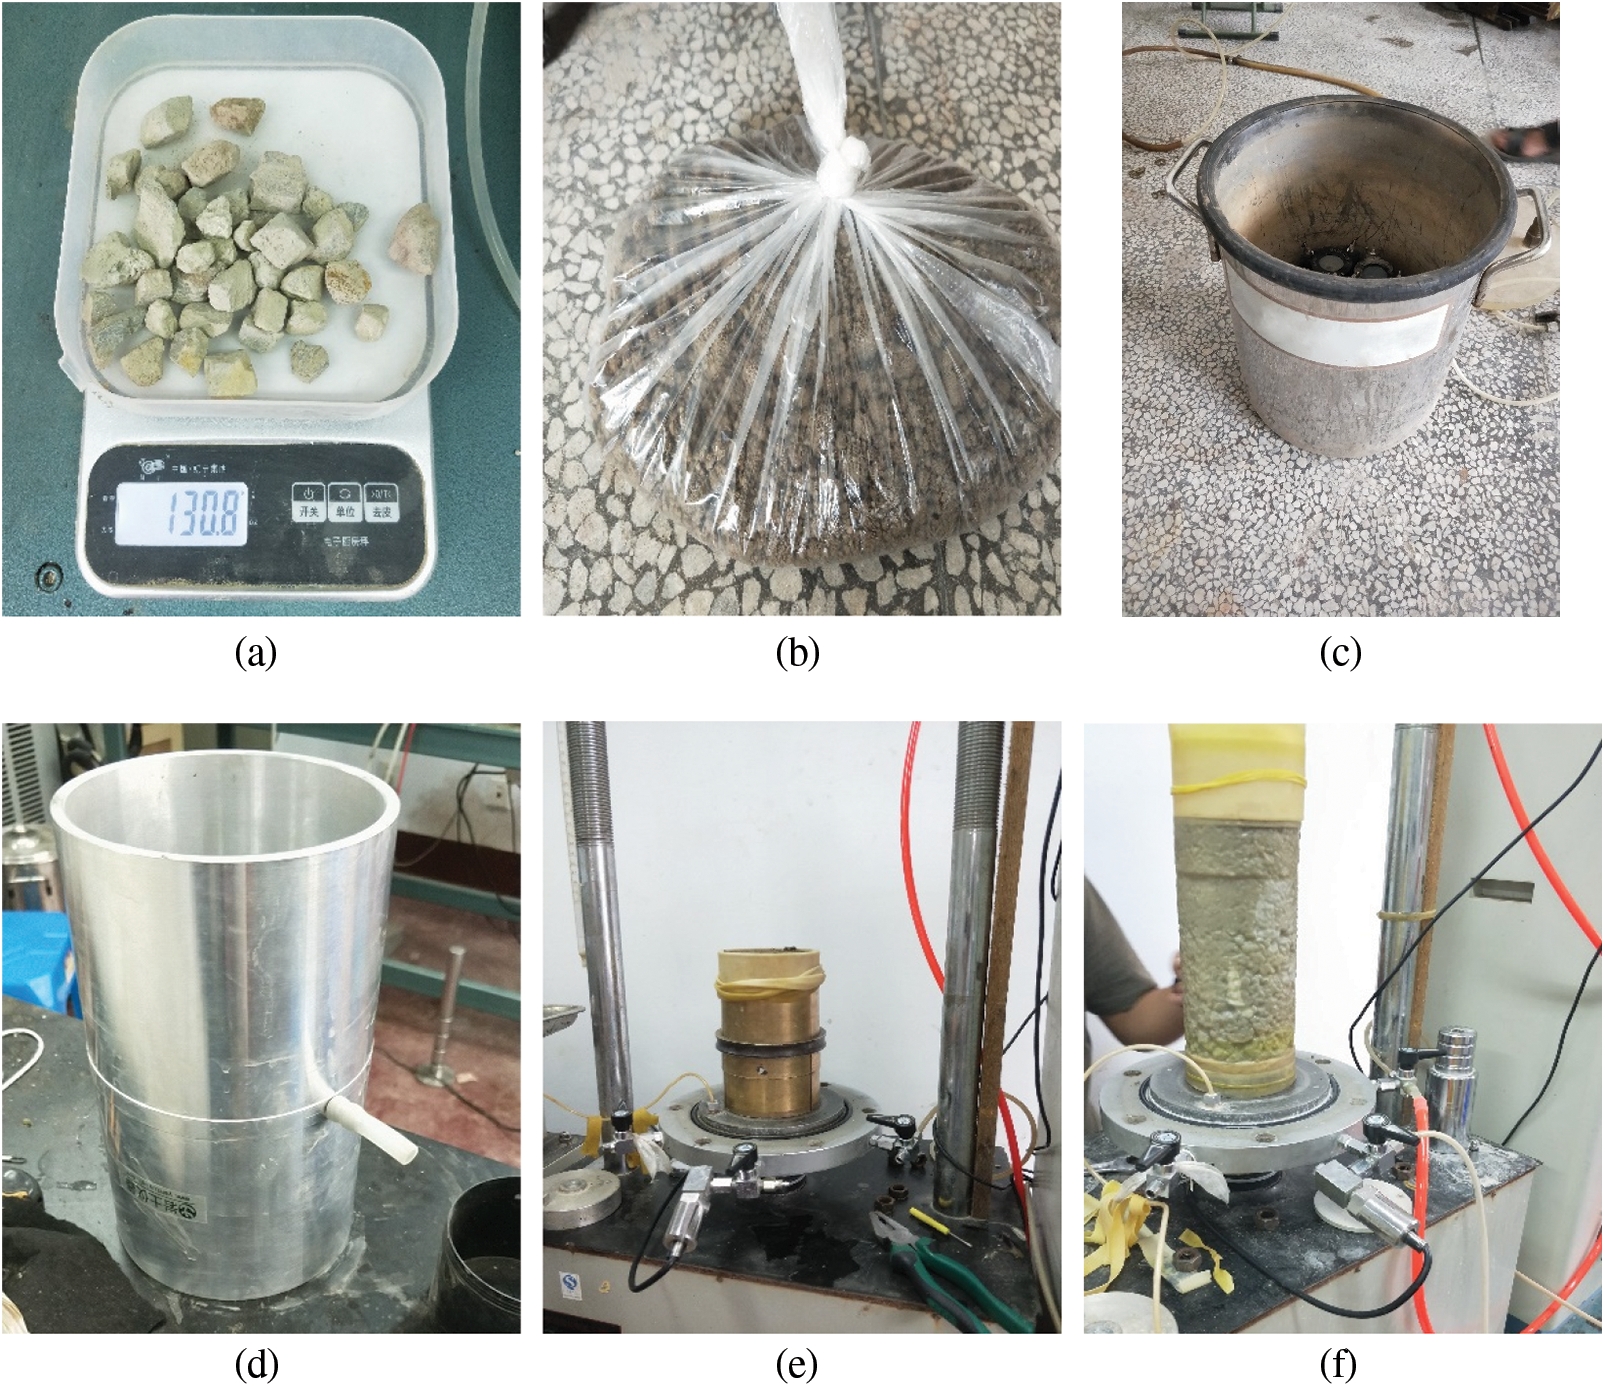
Figure 3: Processes of specimen preparation (a) weigh according to the proportion; (b) sealed and stored; (c) vacuum saturation; (d) bearing membrane tube; (e) compacted in three layers; (f) saturated with air extractor
2.4 Procedures of Triaxial Compression Tests
The consolidation drainage shear tests are conducted with a TSZ-6A triaxial apparatus at Hohai University, China, as shown in Fig. 4. For TSZ-6A triaxial apparatus, the load rate range is 0.0024 to 4.5 mm/min, and the range of confining pressures can be applied 0 to 2.0 MPa. After the preparation of specimens, they are consolidated under different confining pressures according to the scheme in Table 2. Then, for the soil tests, the samples are compressed with the strain-controlled loading method at a constant axial strain rate of 0.01 mm/min under four confining pressures from 100 to 400 kPa by the step of 100 kPa. The tests are over when the axial displacement reaches 12 mm. During the shearing process, the drainage valve keeps open. For the SRM test, the specimens are compressed with the strain-controlled loading method at a constant axial strain state of 0.2 mm/min under the corresponding confining pressure of 100 and 200 kPa. The tests are stopped when the axial displacement reaches 15% axial strain. During the shearing process, axial displacement, axial load, and drainage volume can be recorded per minute.
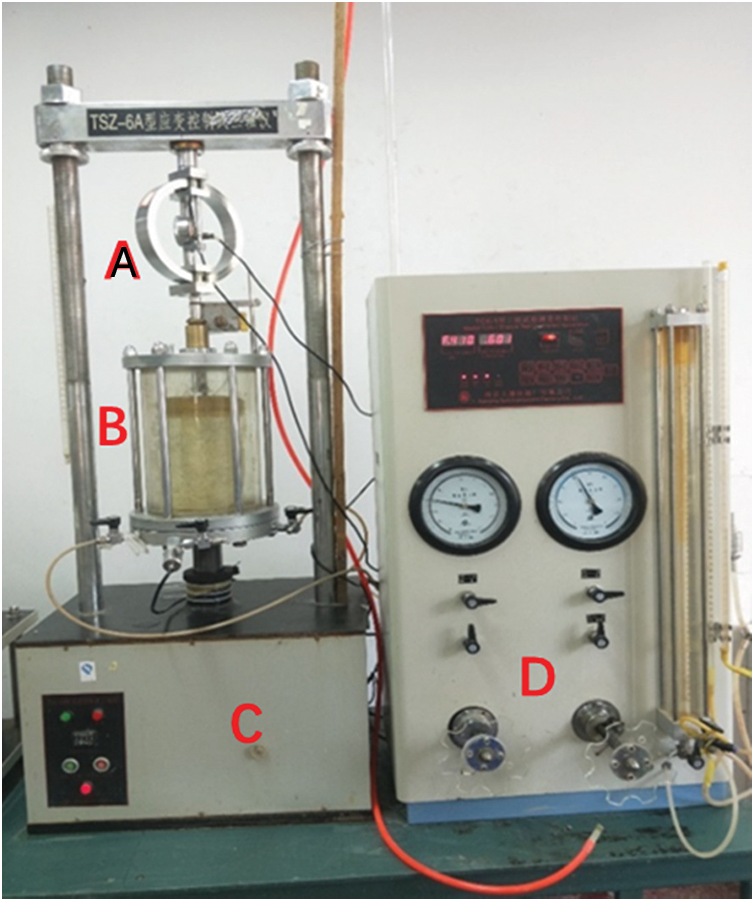
Figure 4: TSZ-6A triaxial apparatus A: force gauge; B: pressure cell; C: axial loading system; D: confining pressure control system
3.1 Triaxial Compression Tests Results of Soil in SRM
The stress-strain curves of the four samples under different confining pressures are shown in Fig. 5, with the deviator stress
In addition, the volumetric strain
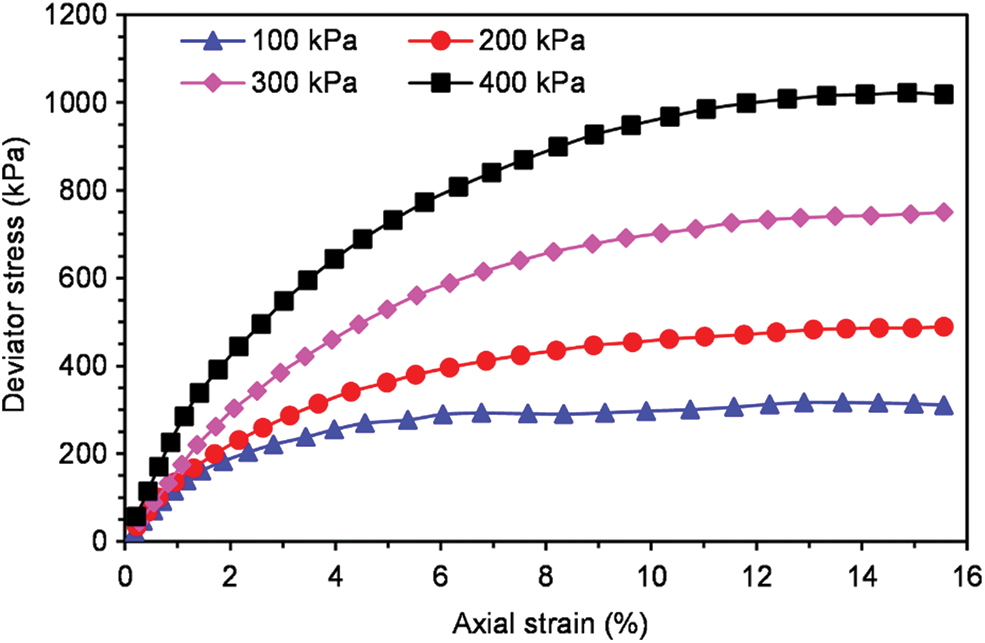
Figure 5: Deviator stress-axial strain curves under different confining pressures
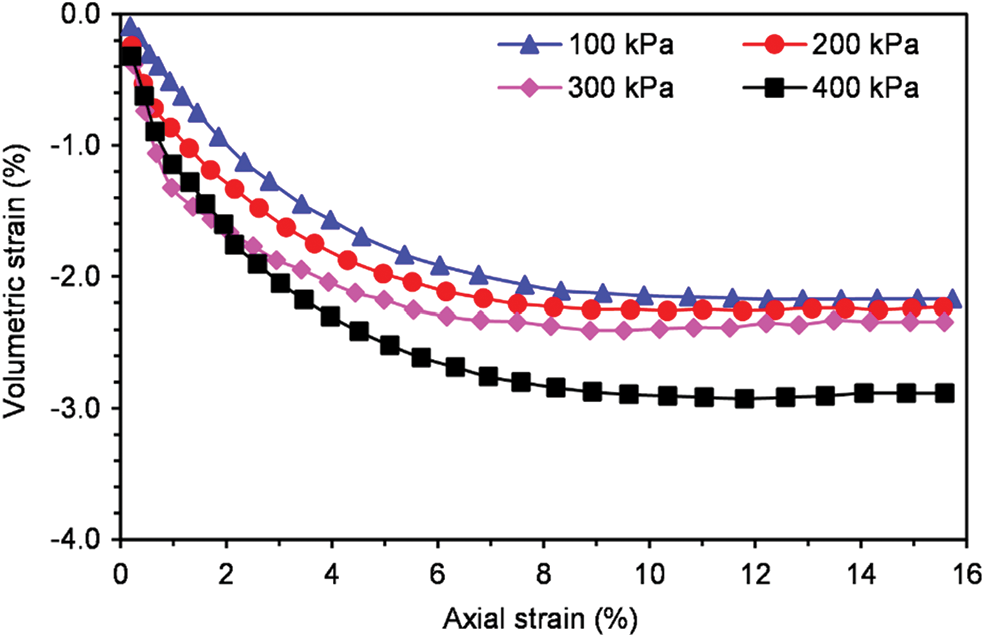
Figure 6: Volumetric strain-axial strain curves
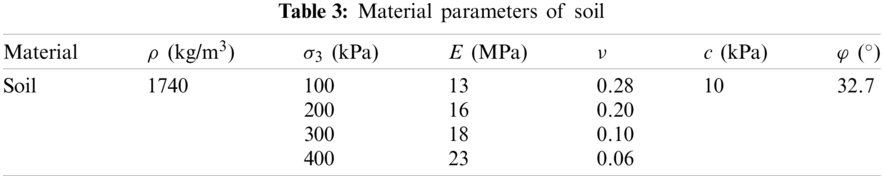
Moreover, to obtain the soil physical and mechanical parameters, the internal friction angle and cohesion of the soil in SRM are calculated by drawing the mohr circle, as shown in Fig. 7. Besides, the elastic modulus E can be represented by the secant modulus at the 1% axial strain
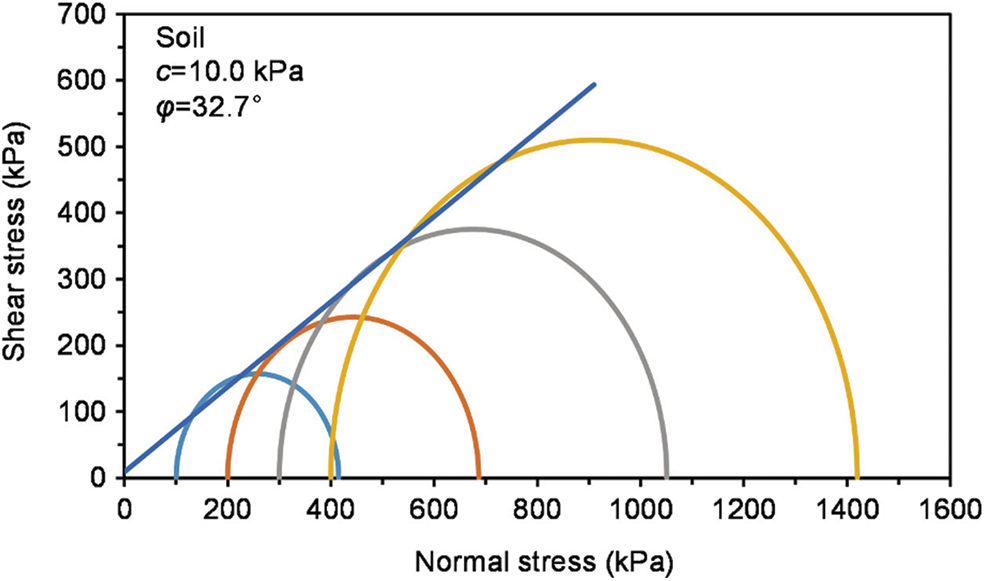
Figure 7: Mohr circle of soil
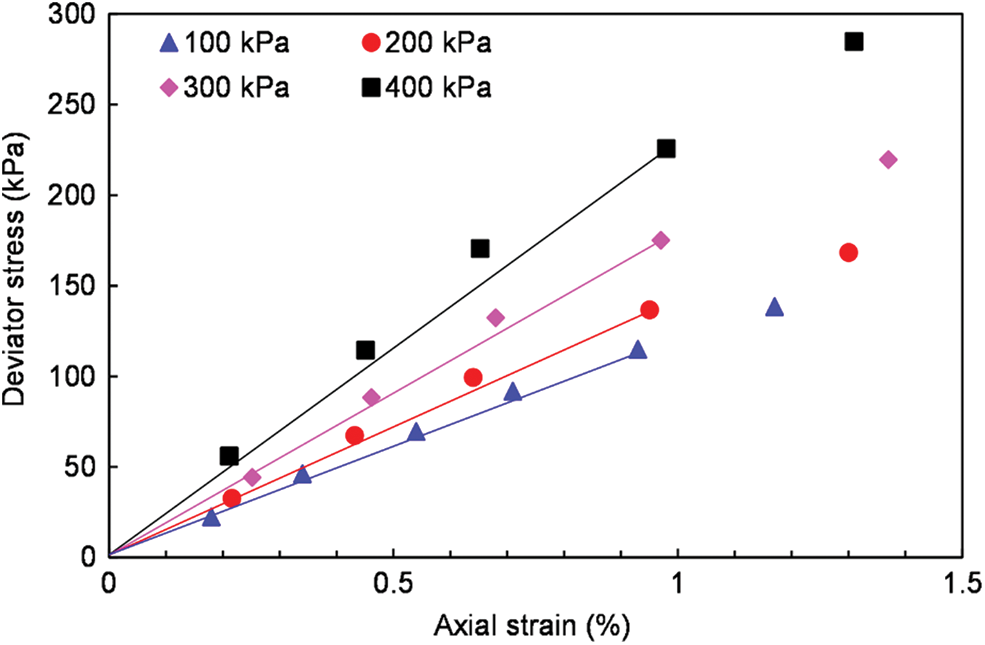
Figure 8: The secant modulus at the 1% axial strain
3.2 Triaxial Compression Tests Results of SRM
The curves between deviator stress and axial strain under the two confining pressures with different block contents are shown in Figs. 9 and 10. It can be observed from Figs. 9 and 10 that the deviator stress-axial strain curve of SRM has obvious non-linear characteristics and strain-hardening characteristics. The deviator stress increases at a relatively stable rate in the early stage, and the rate decreases slightly in the later stage. In addition, the deviator stress increases with the growth of rock block content, and the initial elastic modulus also increases correspondingly at the same confining pressure. That is because the rock is embedded in the soil with low RBCs. And there are fewer contacts between the rock blocks, which just bear a little load so that the soil plays the main role in this situation. However, with the rock block content increasing gradually, the contact between the rocks increases. The rock block forms the skeleton of SRM, which bears the main load.
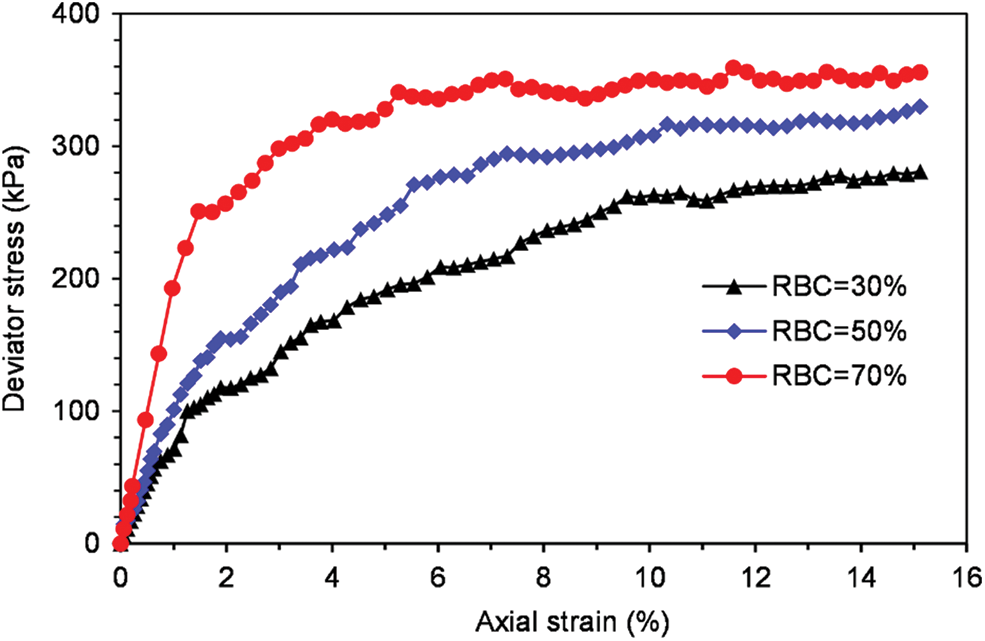
Figure 9: Deviator stress-axial strain curve under confining pressures of 100 kPa
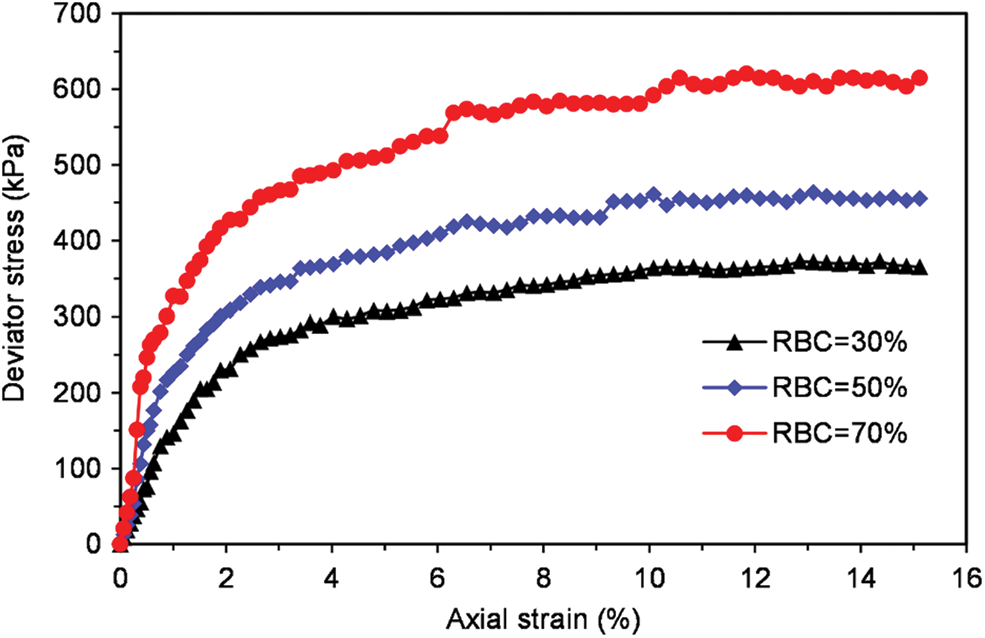
Figure 10: Deviator stress-axial strain curve under confining pressures of 200 kPa
Moreover, it can be seen from Figs. 9 and 10 when the confining pressure is 100 kPa, due to the relatively more minor boundary constraint of the sample, the rock blocks in SRM are more likely to move and rotate. The deviator stress–axial strain curve of SRM has more significant fluctuations from a macroscopic view. It indicates that the rock blocks continue to move and rotate during the shearing process, and the skeleton is continuously formed and destroyed until it is stabilized.
In addition, it can be observed that the peak deviator stress intensity increases with the increase of confining pressure at the same RBC. The specific relationship between rock content and peak deviator stress is shown in Fig. 11.
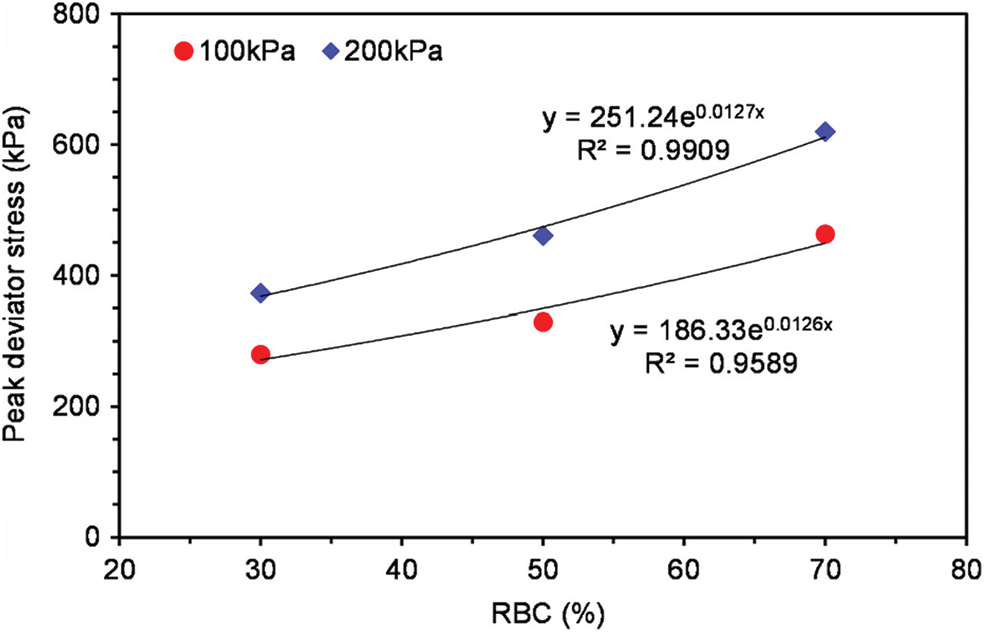
Figure 11: Relationship curve between rock block content and peak deviator stress
4 Mesostructure Model Generation Technique of SRM
The irregular meshes will result in the non-convergence and low efficiency of the micromechanical simulation of SRM. It is essential to propose a random generation technique of the mesostructure model based on the mapping grid method. This method mainly consists of the mapping algorithm and the algorithm for the generation of the random block. First, the sample area is meshed to obtain an initial regular mesh model. Then, the mesh mapping algorithm is proposed, by which the random aggregate model obtained according to the algorithm for the generation of the random block is mapped to the preliminary mesh model.
The advantage of the 3D (2D) mapping mesh method is that a more regular hexahedral finite element mesh model can be obtained. The first thing to do is determine the area where the rock blocks are placed, including the size and shape of the sample. In the numerical simulation test, the shape of the SRM sample is usually a cylinder or a cuboid, and the specific size of the sample can be determined according to the test requirements. The characteristic unit size is taken as 1/4 to 1/8 of the smallest rock block size. Then, the sample area is uniformly meshed using the spatial eight-node hexahedral element obtaining an initial regular mesh model. In addition, the node information and element information of the three-dimensional or two-dimensional mapping mesh model is stored.
4.2 Algorithm for Generation of Random Block Model for SRM
Three main issues in the generation of the mesostructure model of SRM using the Monte Carlo method are the random number, the size distribution, and the spatial position of the rock blocks.
In this study, to ensure the similarity between the random mesoscopic model and the undisturbed SRM, the random mesostructure model is generated according to the particle size distributions (Table 1). So that, for the gradation section
where
For a gradation section
1) The ratio
2) The representative particle size
3) A set of uniformly distributed random variables on the interval [0, 1] is generated and is transformed into the space coordinates of the rock block in the sample area. Then it is judged whether the rock block overlapped with other blocks; if not, the set of space coordinates of this block is recorded in the quantity array, the corresponding block volume is calculated and accumulated, and the next rock block particle continues to be generated; if yes, a set of random variables is regenerated to enter the judgment condition. It is stopped until all blocks are generated.
4) By repeating all the above steps, the blocks of the next gradation section are generated until the rock blocks of the last gradation section are generated, and the sum of the rock block volume of each gradation section is verified whether it meets the requirements.
4.3 Identification Algorithm of Mesoscopic Components for Mapping
The three-dimensional or two-dimensional initial regular mesh model for mapping is obtained. However, the homogenized structure mesh model does not reflect the distribution of each component. So that, the random block model generated in 4.2 needs to be mapped to the initial homogenized mesh model generated in 4.1 to distinguish each component. Therefore, an algorithm needs to be proposed to identify the mesoscopic components of SRM, by which the material properties of each component can be determined. The specific steps are as follows:
1) The stored element information and node information of the 3D finite element mesh model for mapping is read. The coordinates of 8 nodes of element number N are assigned to
2) According to the particle size, the number of rock blocks for each gradation section is assigned to num1, num2,…,
3) The distance between the centroid point of this element and the center point of the block particle is calculated. In addition, the minimum distance dis_min and the position of the block particle are assigned to the array infor [dis_min, loc_min].
4) The relationship between the element and the rock block particles is judged in turn. If
5) If
6) According to the above steps, the mapped element sets of material are written into the inp file.
In addition, the flow diagrams for the generation of random block and identification algorithm of mesoscopic components for mapping are provided, as shown in Fig. 12. Furthermore, the random rock block model and the random mesostructure mesh model of SRM are shown in Figs. 13–15. It can be observed that the rock blocks are randomly distributed, and the shape is also similar to be a sphere, indicating that the technology for the generation of the random mesostructure model is feasible.
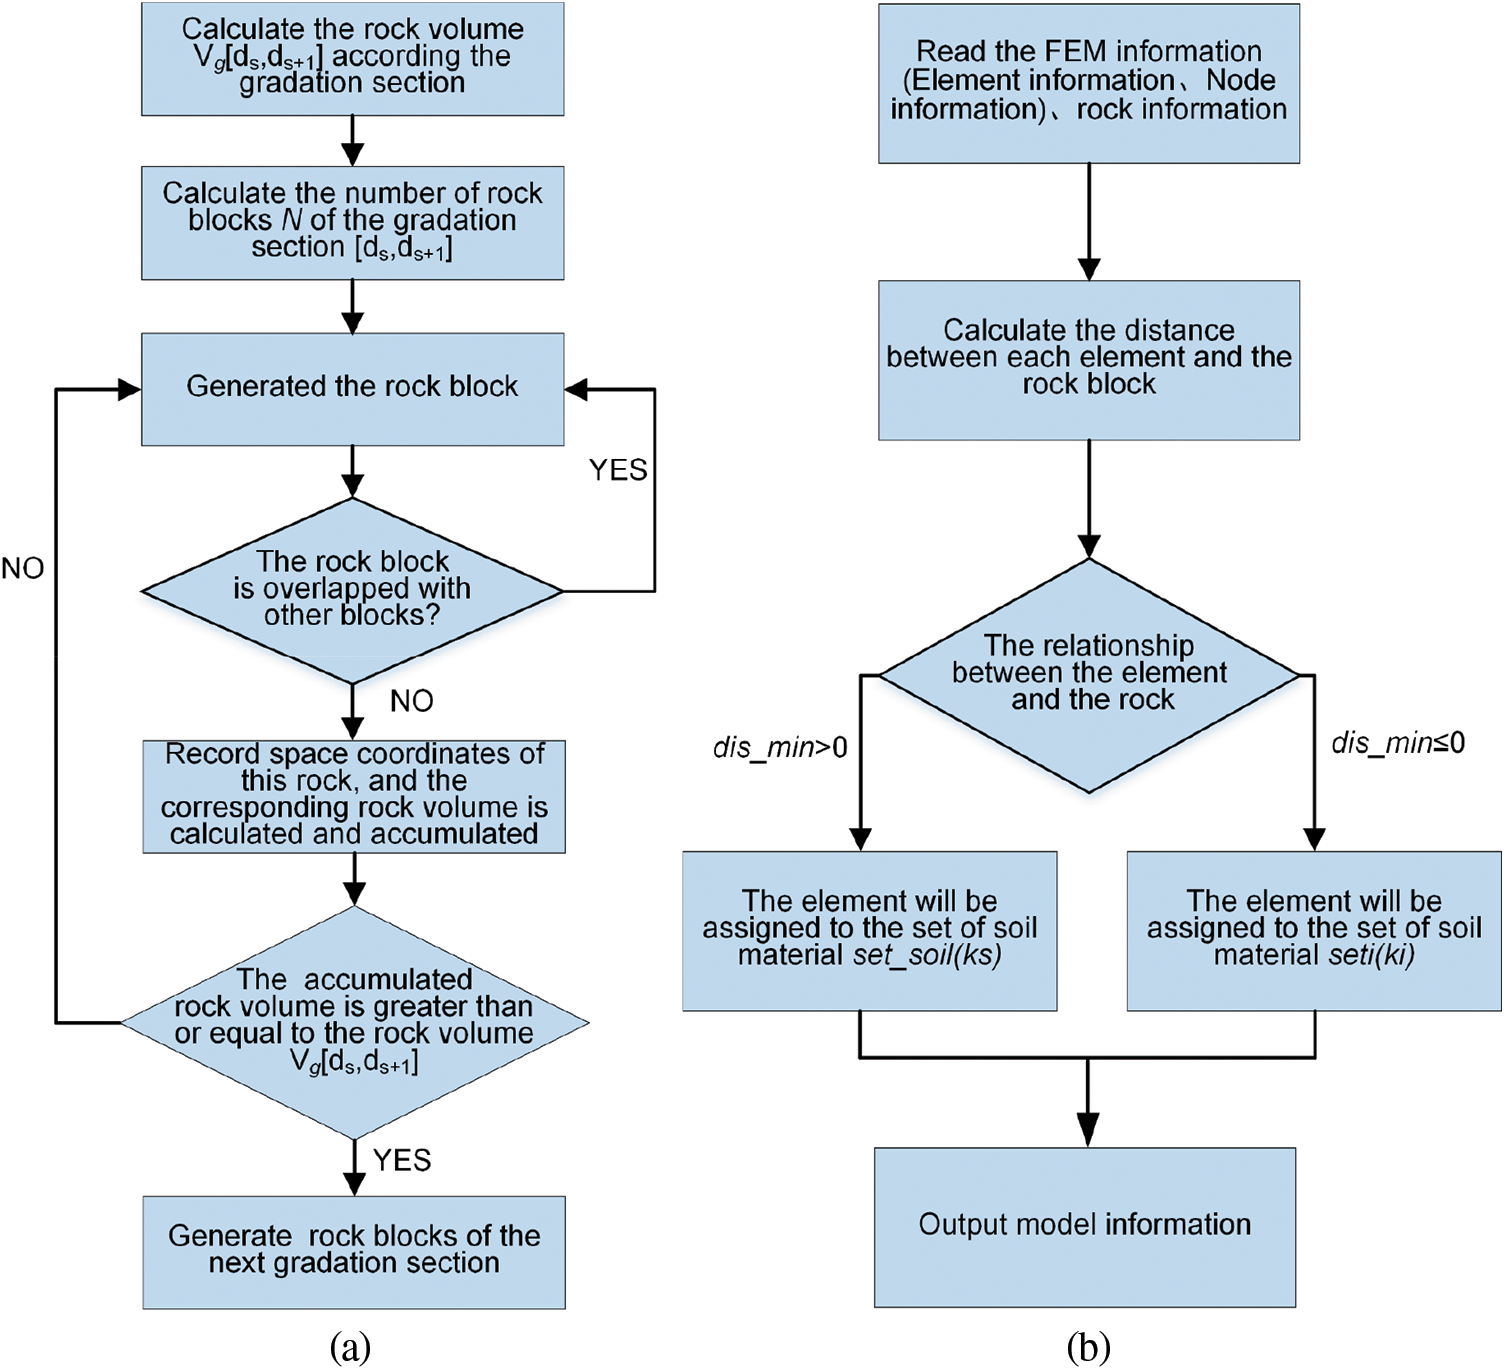
Figure 12: The flow diagrams for algorithms (a) the processing graphic for the generation of random block; (b) the processing graphic for identification algorithm of mesoscopic components for mapping
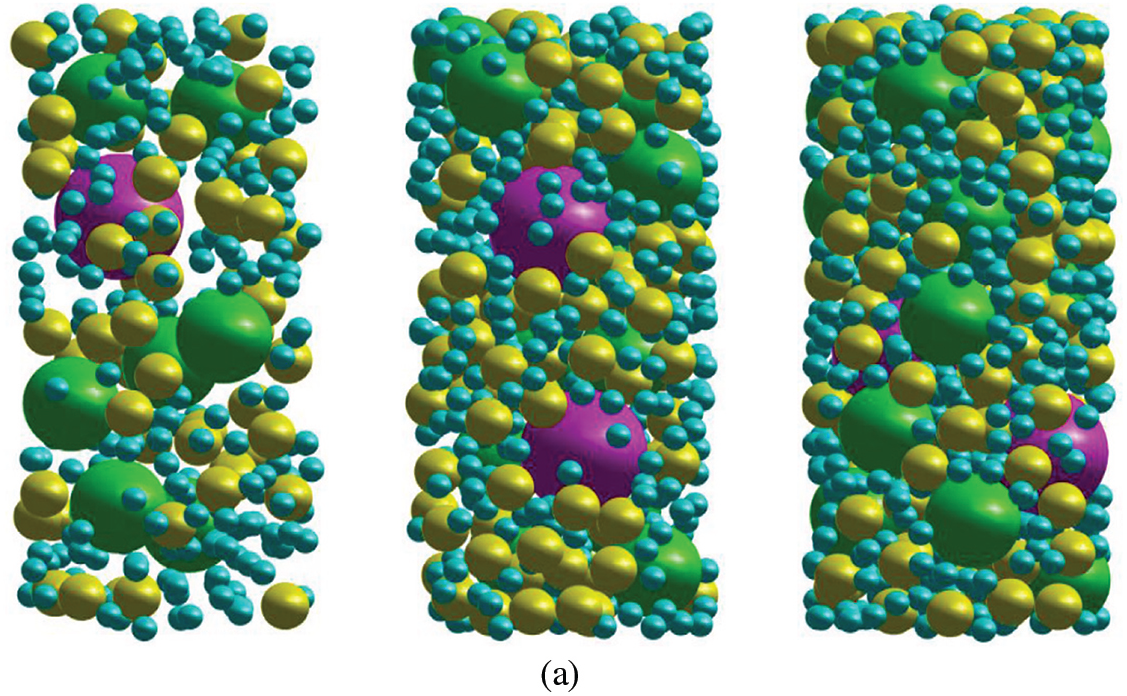
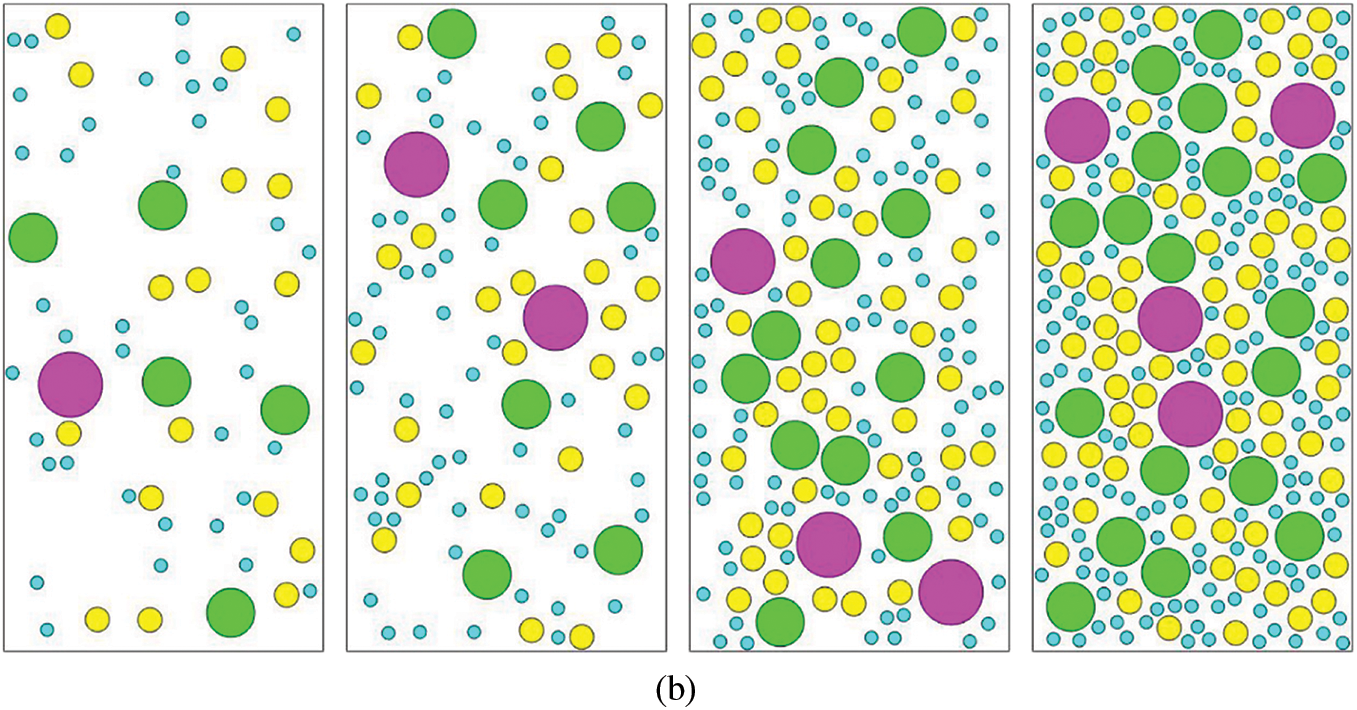
Figure 13: The random rock block model of SRM with different contents (a) 3D; (b) 2D
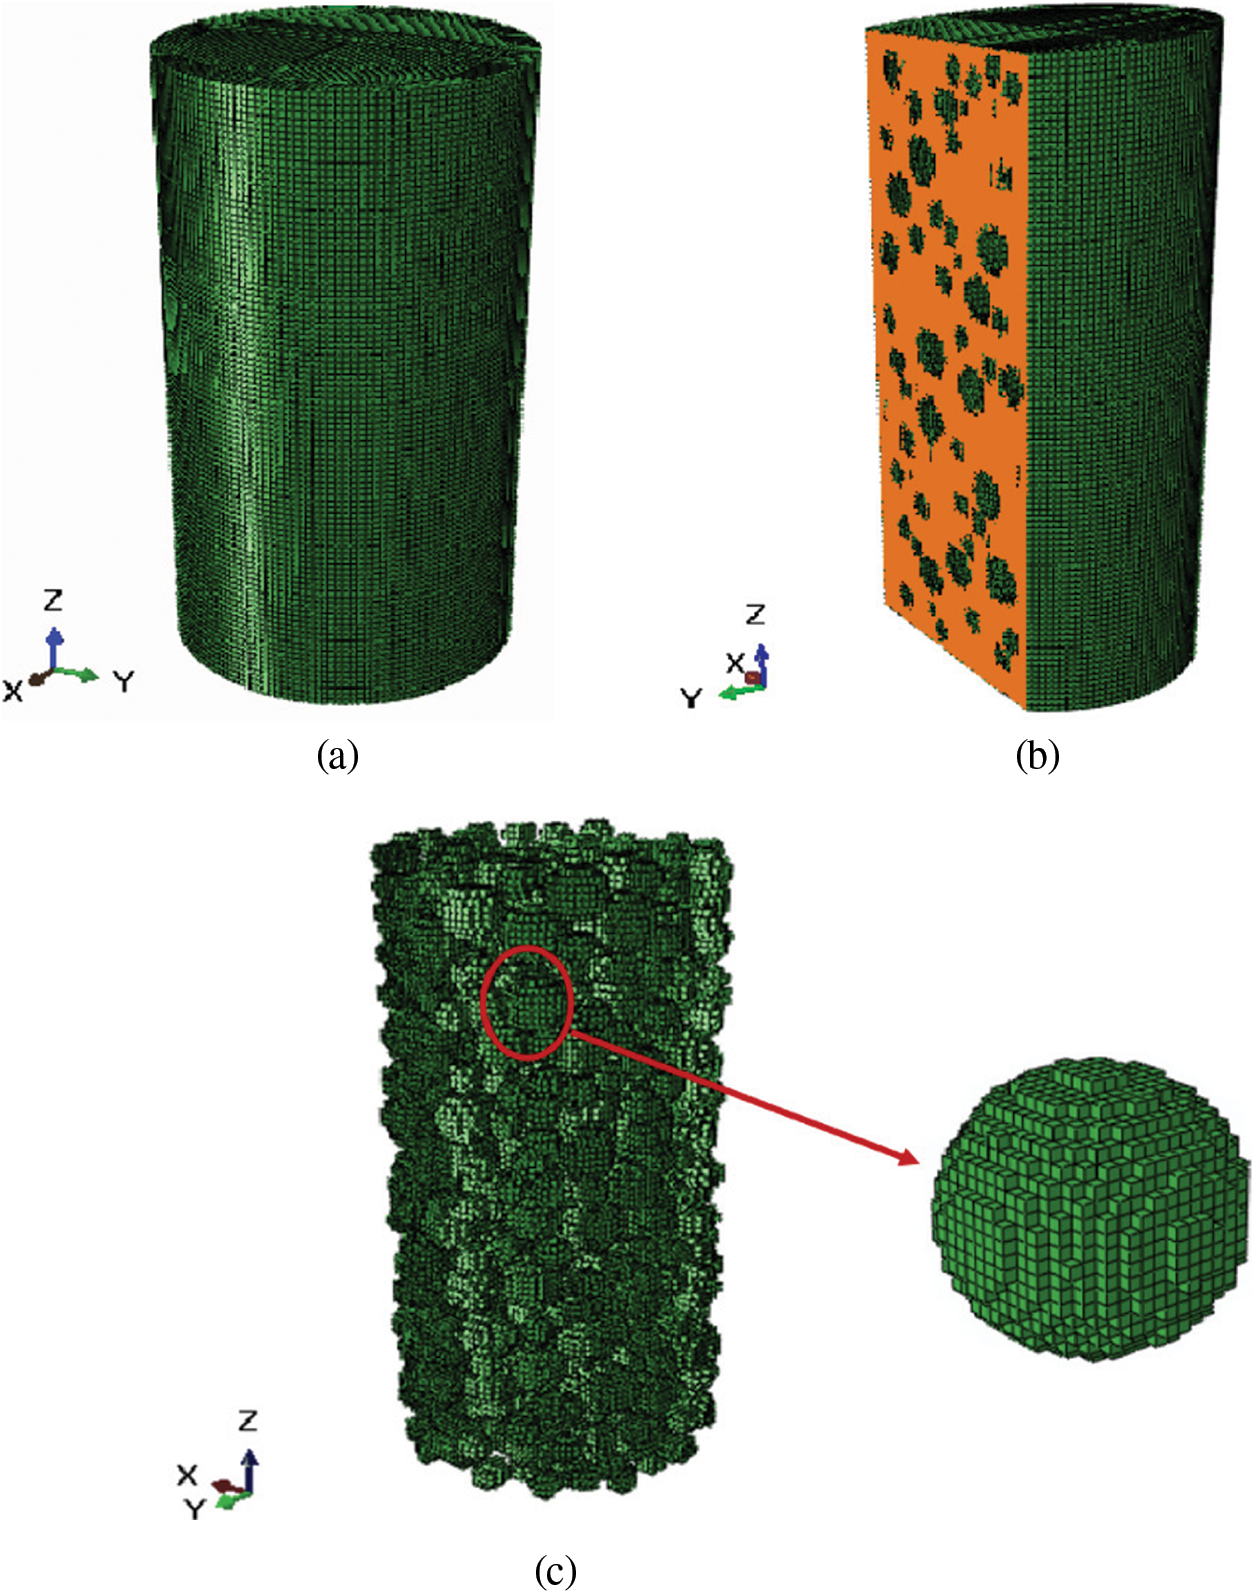
Figure 14: 3D random mesostructure model of SRM (a) 3D mapping mesh model; (b) soil mesh model of SRM; (c) rock block mesh model of SRM
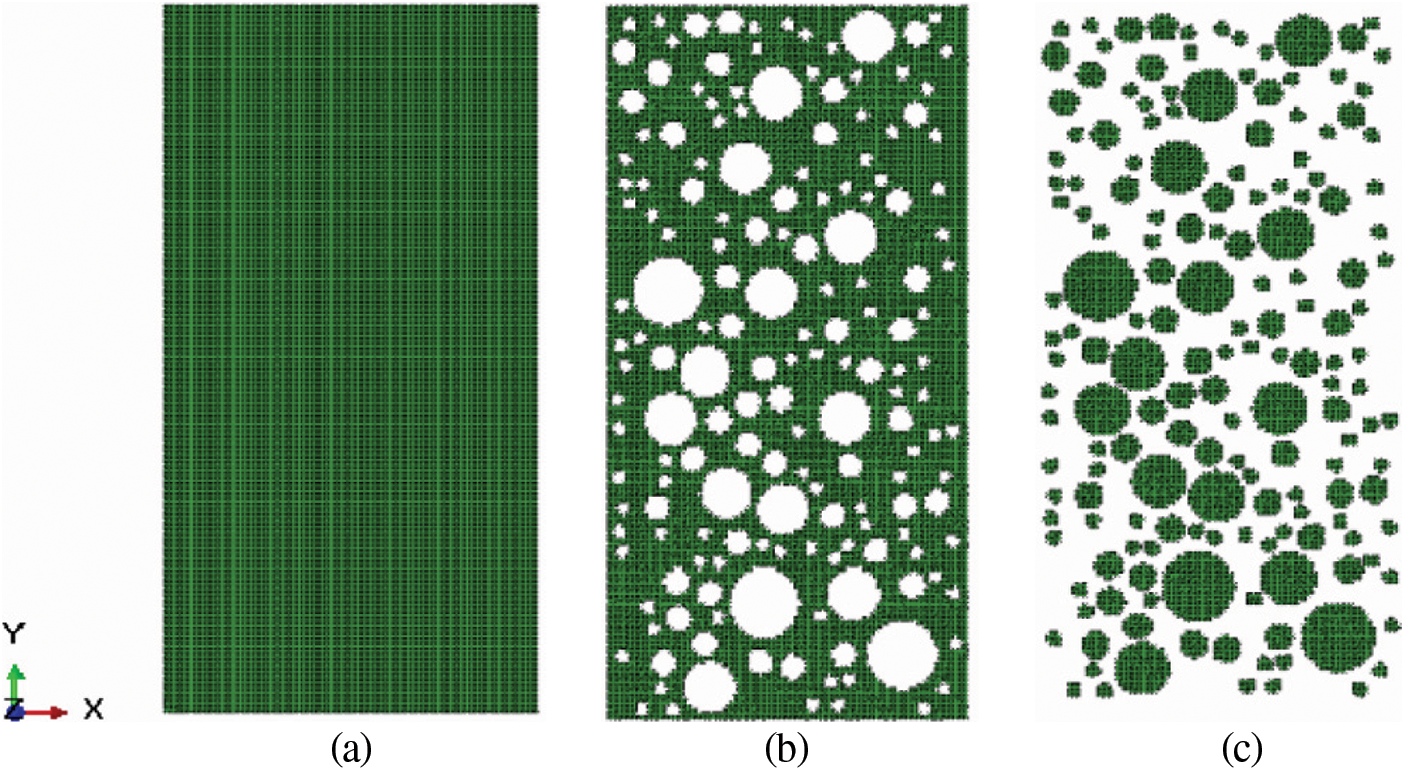
Figure 15: 2D random mesostructure model of SRM (a) 2D mapping mesh model (b) Soil mesh model (c) Rock block mesh model
5 Rock Parameter Model Considering Size Effect
In the process of fault formation, the rock mass is deformed and metamorphosed, forming fault filling due to the action of tectonic stress. From the macroscopic point of view, it is generally regarded as a homogeneous material. Meanwhile, the mechanical parameters are selected by multiplying the soil parameters by a coefficient. However, from a mesoscopic point of view, the fault filling is composed of rock blocks and fault gouges. It is a heterogeneous material with highly complex mechanical properties. Furthermore, the disadvantages of treating fault filling as homogeneous materials are more evident due to the slender structure characteristic of fault. Therefore, it is essential to consider the material difference between rock blocks and soil from a mesoscopic point of view. Generally, the rock block parameters are selected according to empirical values for numerical simulation of SRM. However, the mechanical properties of rock have a size effect [42,43]. The larger the rock block size, the more defects are inside, such as micro-cracks, micro-cavities, etc. So that, its mechanical parameters will be lower than those of smaller rock size, as shown in Fig. 16.
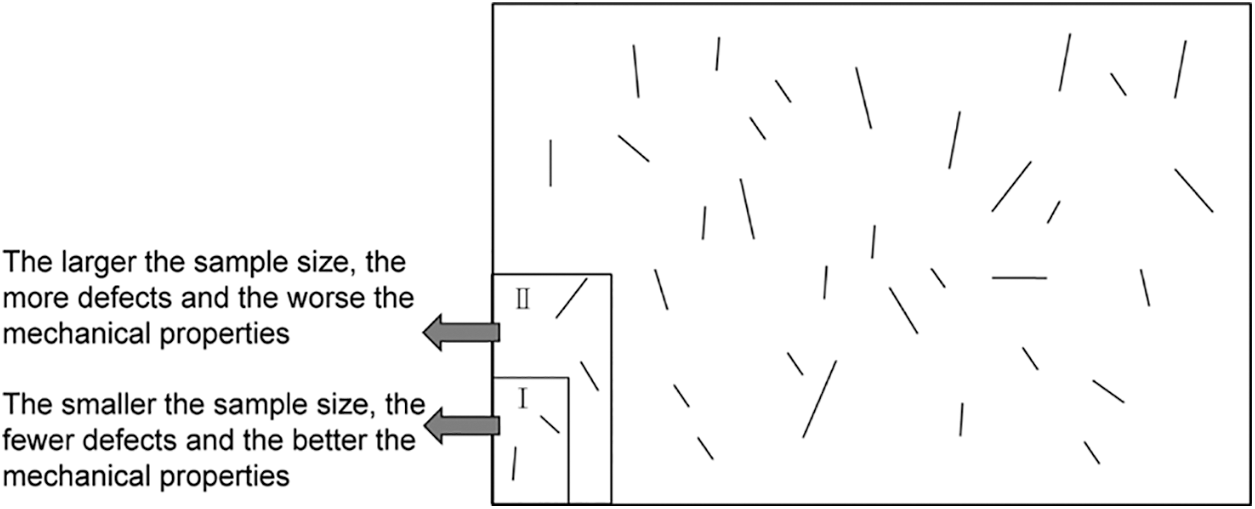
Figure 16: Different sizes of rock specimen
At present, many researchers have studied the particle size effect from the aspect of particle strength [44,45], and they concluded that particle strength decreased with the increase of particle size. For instance, an empirical formula in exponential form based on the experimental data is established by Liu et al. [46]:
where a, b and c are the parameters related to rock properties and size effect.
The rock blocks have high strength and high elastic modulus compared to the soil, so that in this study, only the size effect of elastic modulus for rock blocks is studied. The model of elastic modulus for rock block with size effect is proposed according to the study of Liu et al. [46]. The elastic modulus changing with the size of the rock block particle is defined by the exponential equation:
where
Generally, when the block particle size D approaches infinity, the elastic modulus of the rock block approaches the elastic modulus of the rock mass in the engineering, and it is taken as
In addition, when the block particle size D approaches zero, which means the rock block is considered to be very small and does not contain any natural defects, the elastic modulus of the rock block should be close to the elastic modulus of the original rock
In addition, when

Figure 17: Elastic modulus model of rock block considering size effect
6 Numerical Simulations of Mechanical Characteristics of SRM Based on Mesostructured
6.1 Procedure of the Numerical Triaxial Compression Tests
Numerical triaxial compression tests of SRM with different rock block contents are simulated by FEM to validate the rationality of the rock parameter size effect and the random mesostructure model developing a numerical simulation method.
The size of the specimens is the same as the experimental tests of SRM of Φ101 × 200 mm. The block particle size D is divided into two groups: 5 to 10 mm and 10 to 20 mm, and the representative particle sizes are 8 mm, 15 mm. The element size is 2 mm, and element numbers of each component are shown in Table 4. The random mesostructure model of numerical simulation tests is shown in Fig. 18.
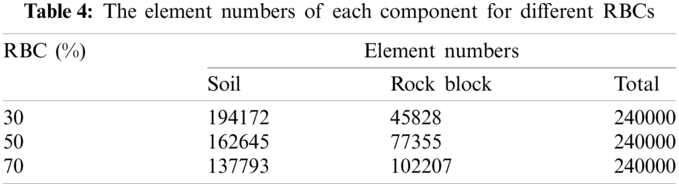
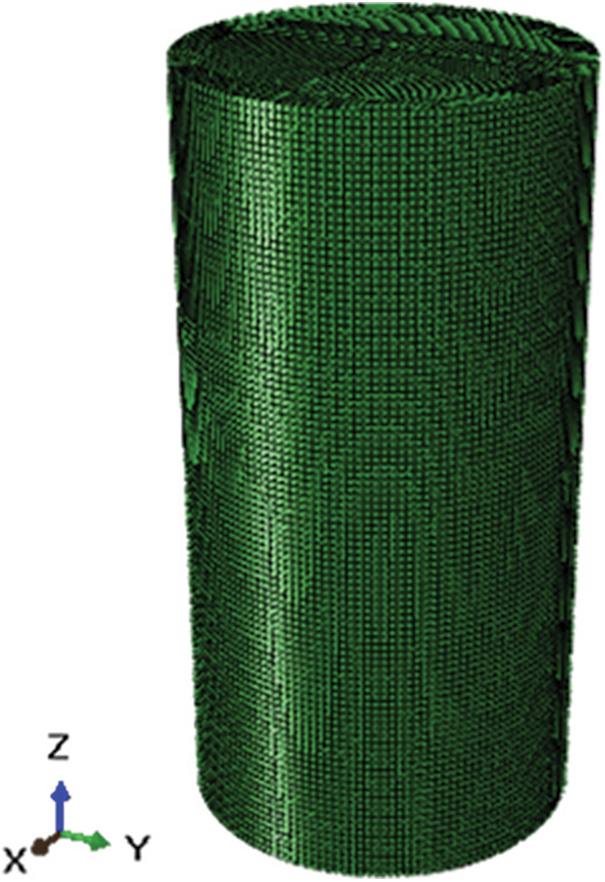
Figure 18: Random mesostructure model of SRM
The boundary conditions are imposed in the simulation: the bottom surface is fixed, and the upper surface is fixed in horizontal orientation. There are two stages for the triaxial compression tests: first, the specimen is consolidated under confining pressure; second, a constant displacement rate is applied to the upper surface by displacement control method under confining pressure until the axial strain reaches 15%. The confining pressures of 100 and 200 kPa have been considered.
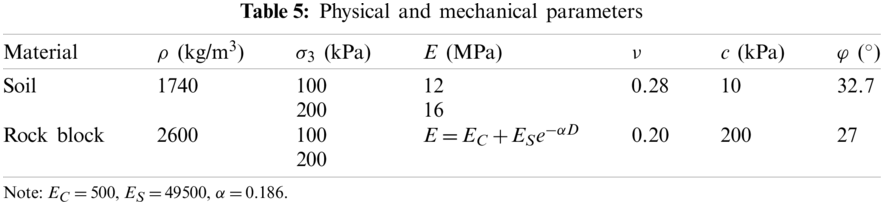
Moreover, the Mohr-Coulomb criterion is adopted for both soil and rock block based on the former experiences and experiments. Their physical and mechanical parameters are shown in Table 5.
6.2 Result of Numerical Simulations
By calculating the mean of the reactions at each node on the upper surface of the specimen, for each loading step, the deviator stress-axial strain curves can be plotted. The numerical results are shown in Figs. 19 and 20, and the results of the experimental tests are compared with the numerical results. It can be observed that the deviator stress-axial strain relationship is the hardening type. With the increase of confining pressure, the deviator stress increases gradually, and the peak deviator stress also increases. Similarly, with the increase of rock block content, the deviator stress also increases gradually. In addition, it can be observed that experimental tests results are smaller than the numerical values, and the larger the RBC, the closer the experimental and numerical results are. The reason may be that the interface between rock block and soil is not considered in the numerical tests. It is believed that the interface between rock blocks is easier to destroy, and the effect is getting smaller with the growth of RBC [47,48]. On the whole, except for the condition of
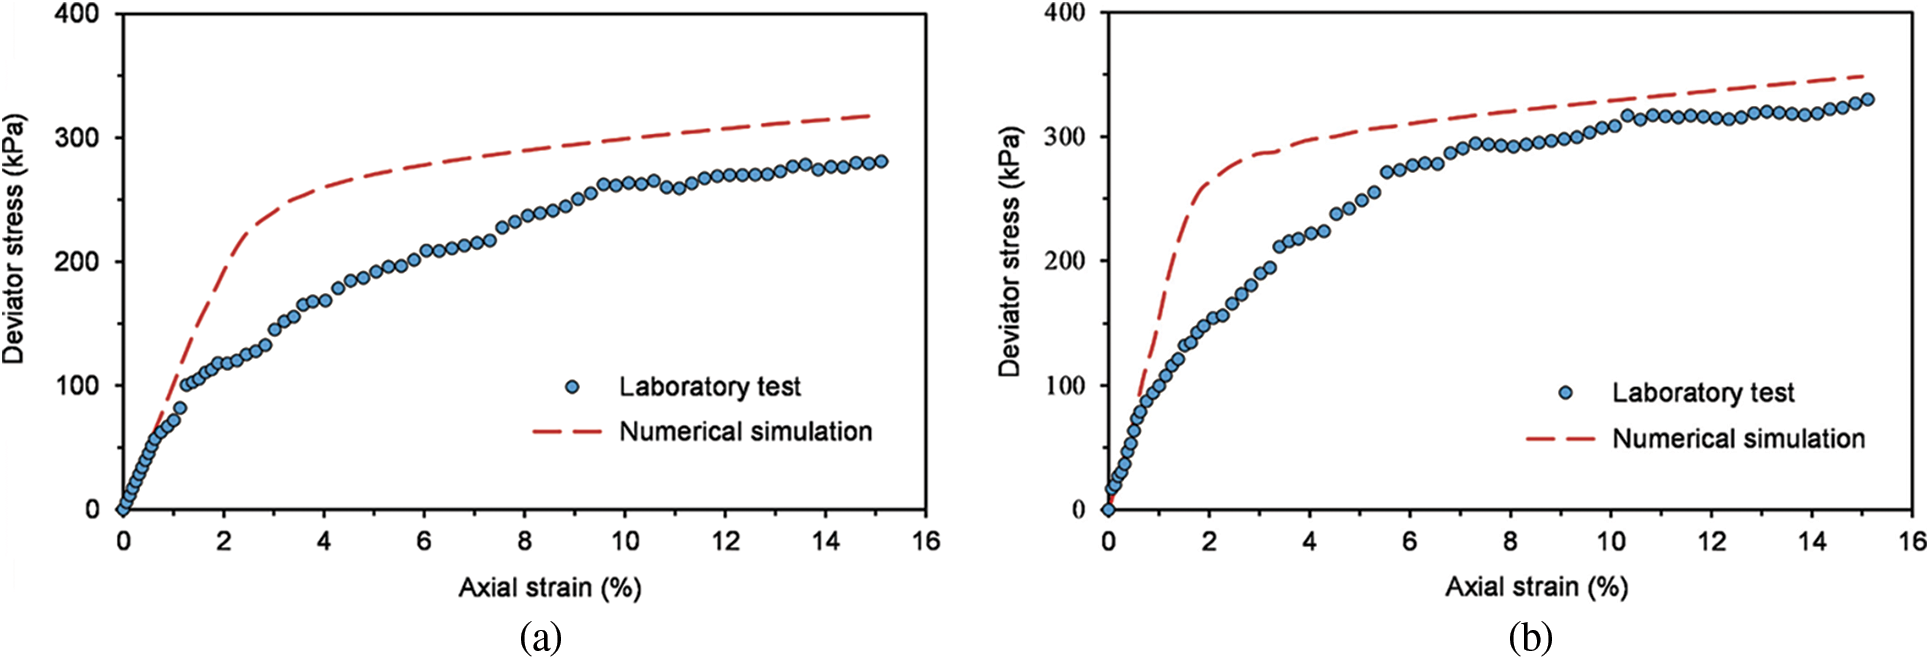
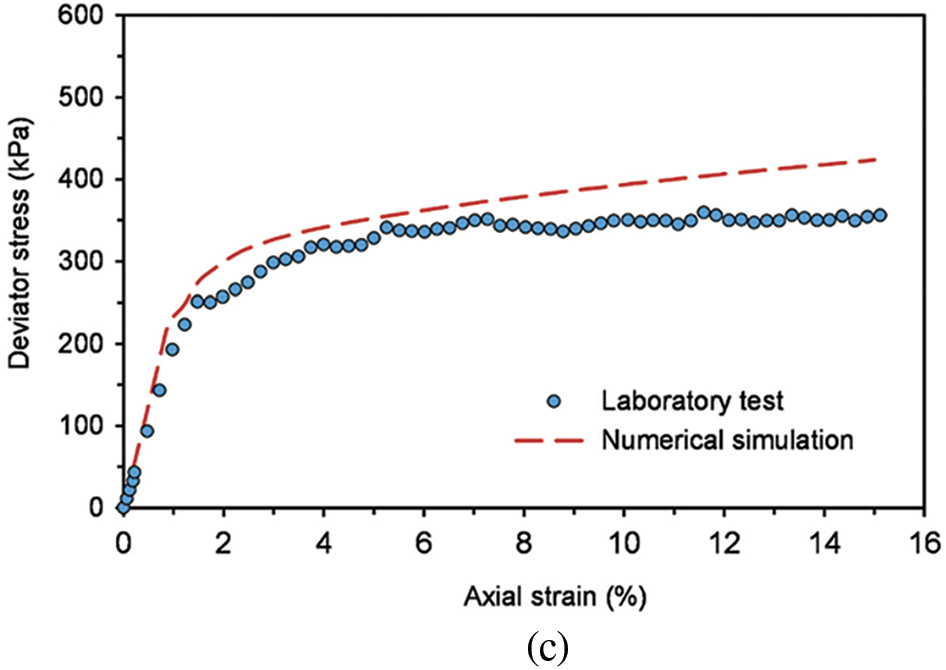
Figure 19: Numerical simulation of triaxial tests on SRM under confining pressure of 100 kPa, comparing with the experimental results realized in Section 2. (a) RBC = 30%; (b) RBC = 50%; (c) RBC = 70%
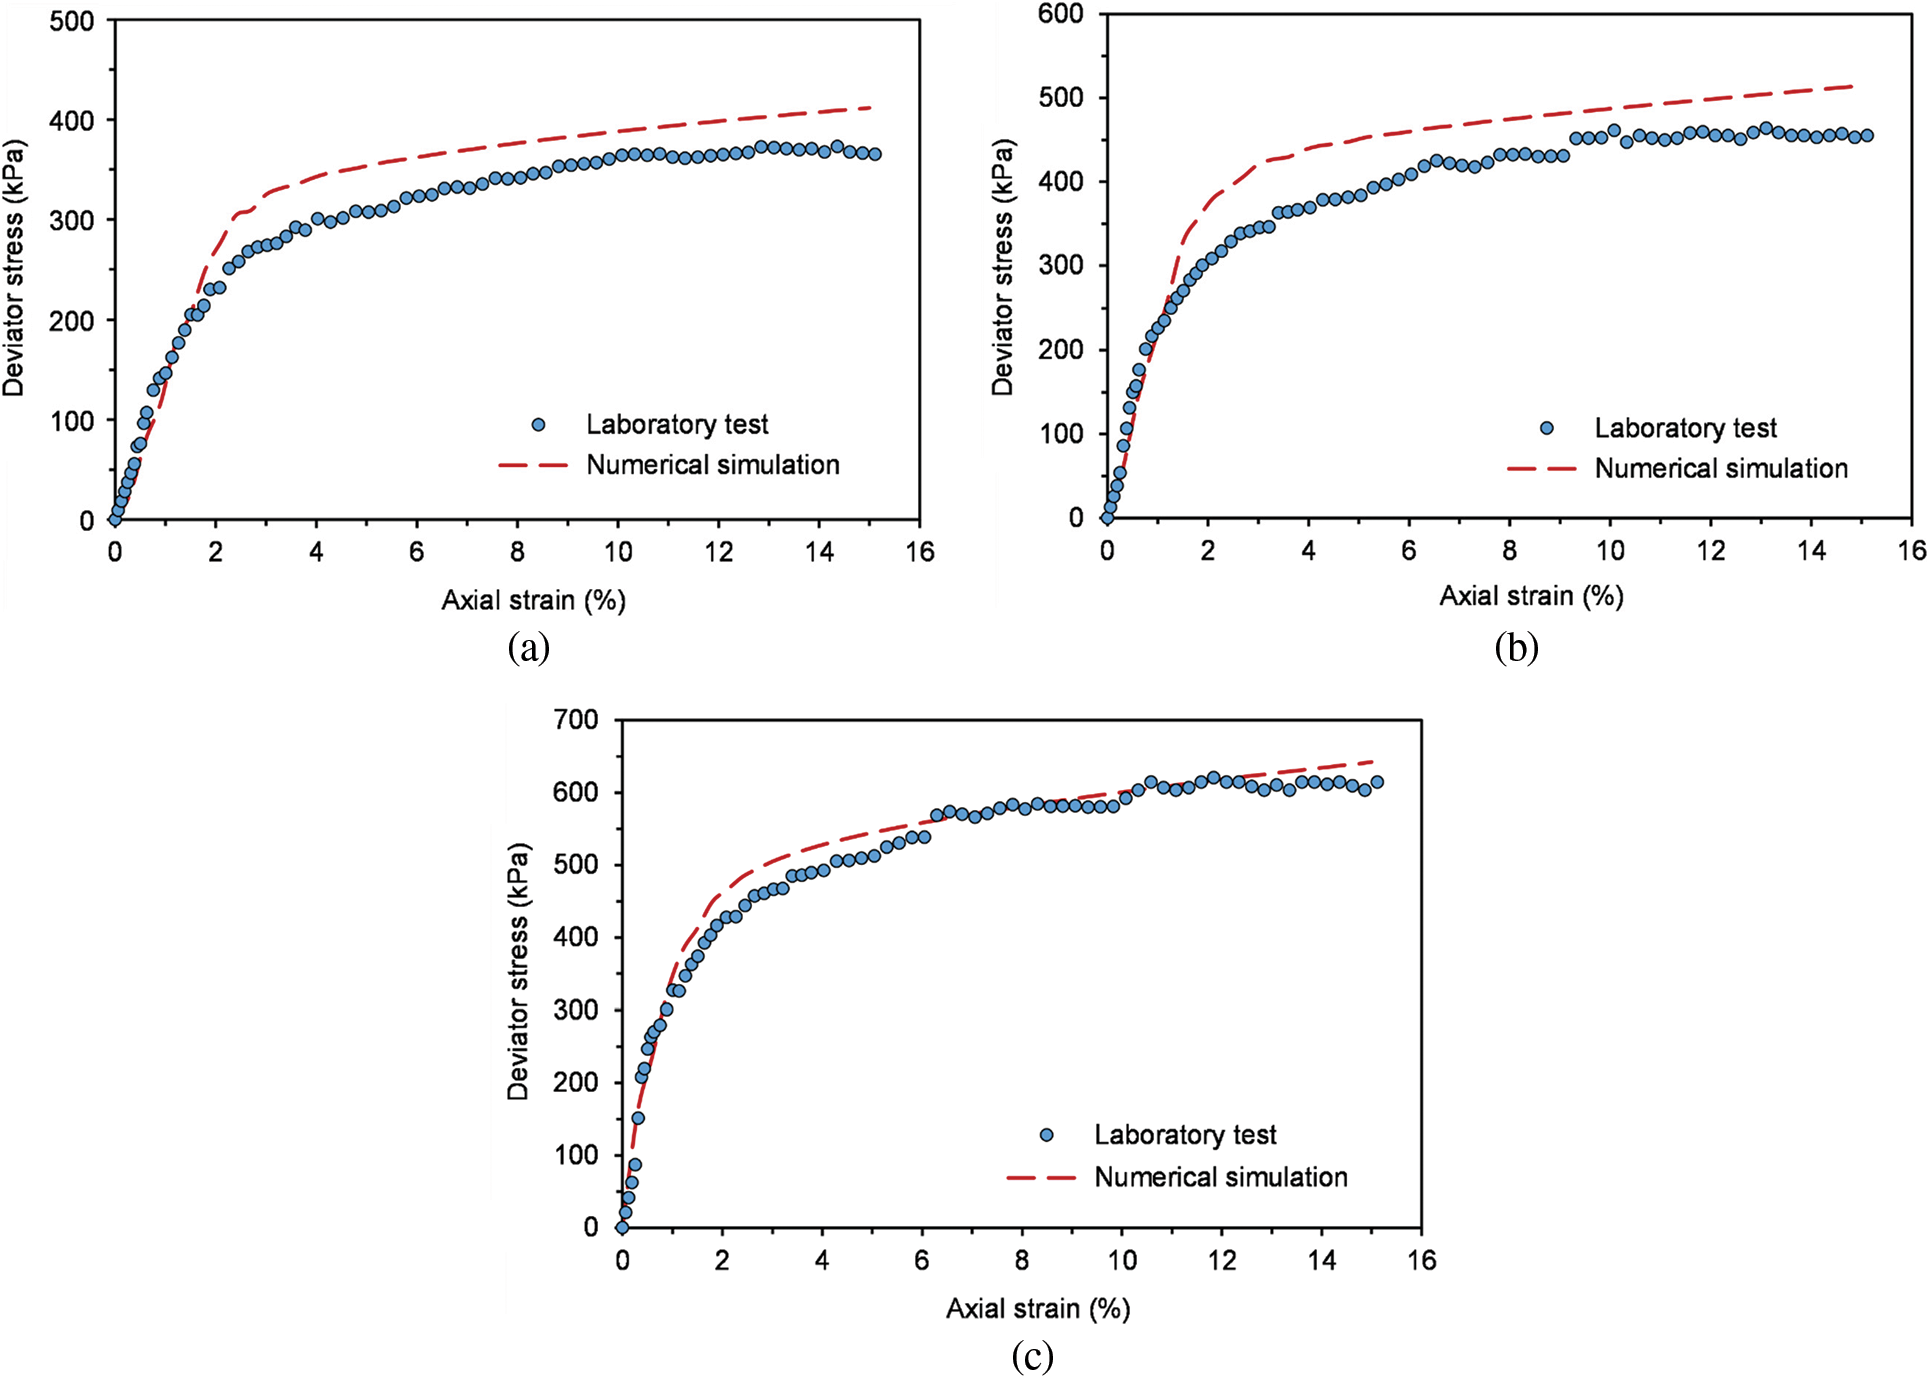
Figure 20: Numerical simulation of triaxial tests on SRM under confining pressure of 200 kPa, comparing with the experimental results realized in Section 2. (a) RBC = 30%; (b) RBC = 50%; (c) RBC = 70%
In addition, volumetric strain-axial strain curves for various confining pressures with different RBCs are provided, as shown in Figs. 21 and 22. It can be observed that the volume of SRM is shrinking at first, then dilating with the shearing process. In addition, the compression of low RBCs is also more significant than that of high RBCs. That is because there is high soil content with low RBCs, and it is easy to be compressed. Furthermore, yielding zones (the darker shade of grey) on the internal surface x = 50.5 mm for different RBCs under confining pressure of 100 and 200 kPa are shown in Figs. 23 and 24. It can be observed that the failure zone is no longer an apparent conjugated “X” pattern, there are multiple failure surfaces, and the angle of the failure zone is no longer 45°. Moreover, we also can observe that with the growth of RBC, yielding zones become more diffuse, less yielding zones, and yielding zones are more likely in thin sections of soil matrix isolated by blocks of the specimen. In addition, the failure path avoids the rock block.
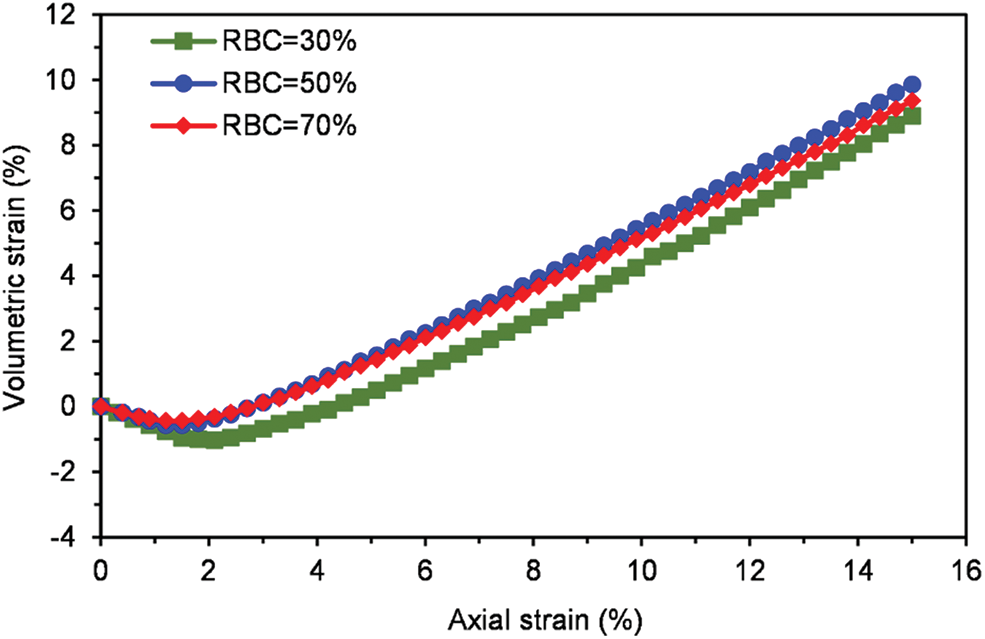
Figure 21: Volumetric strain-axial strain curves under confining pressure of 100 kPa
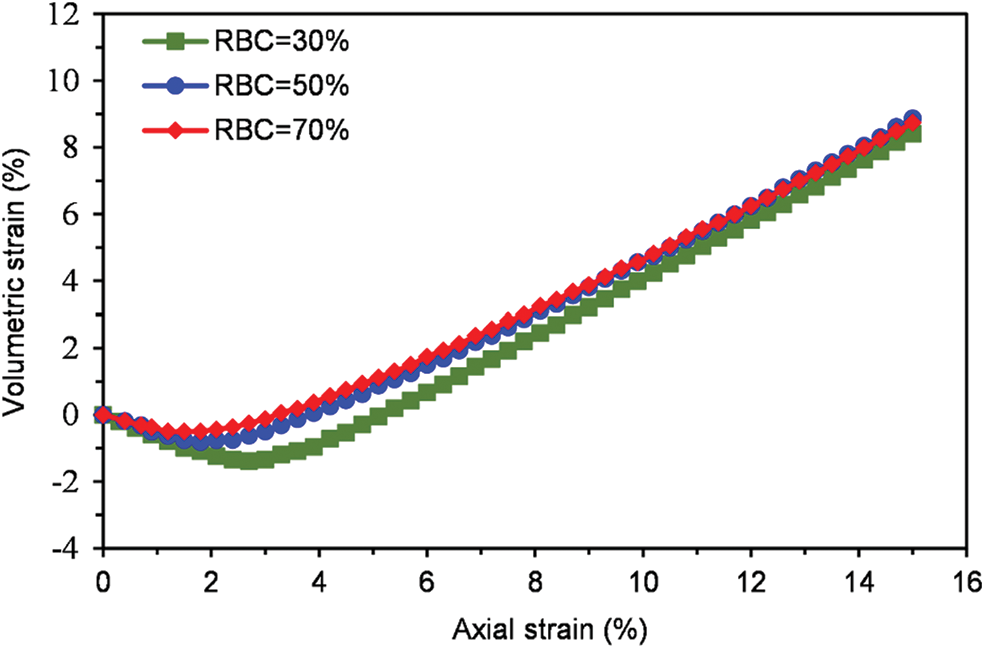
Figure 22: Volumetric strain-axial strain curves under confining pressure of 200 kPa
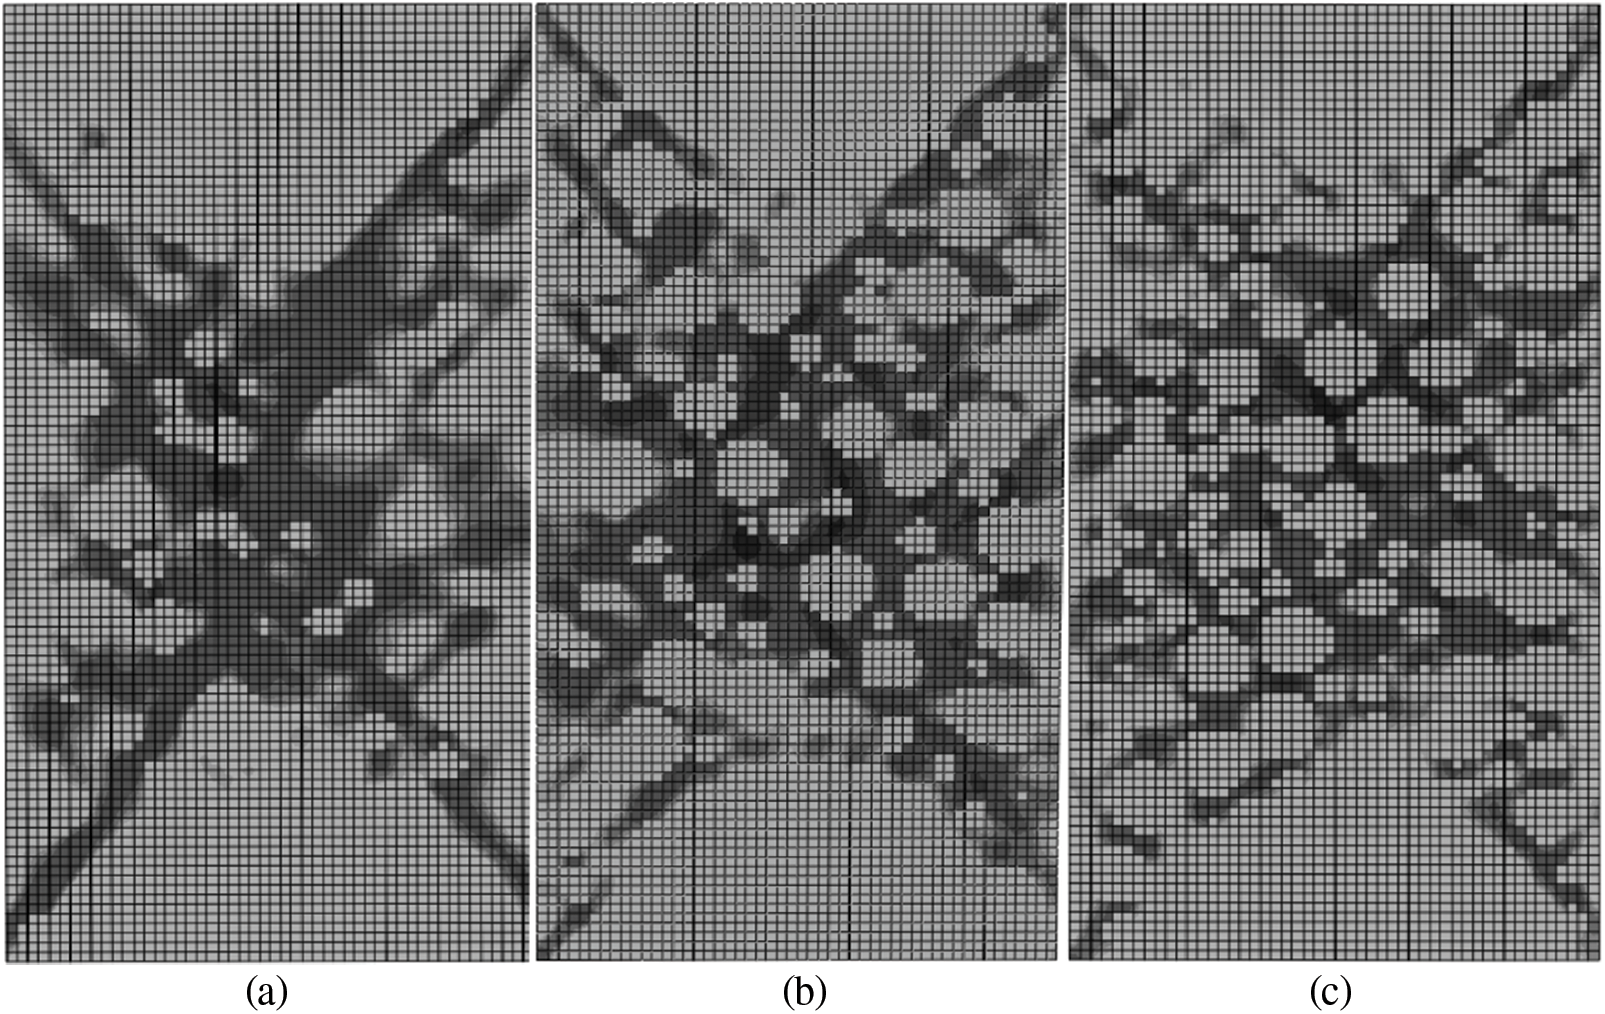
Figure 23: Yielding zones on the internal surface x = 50.5 mm under confining pressure of 100 kPa (a) RBC = 30%; (b) RBC = 50%; (c) RBC = 70%
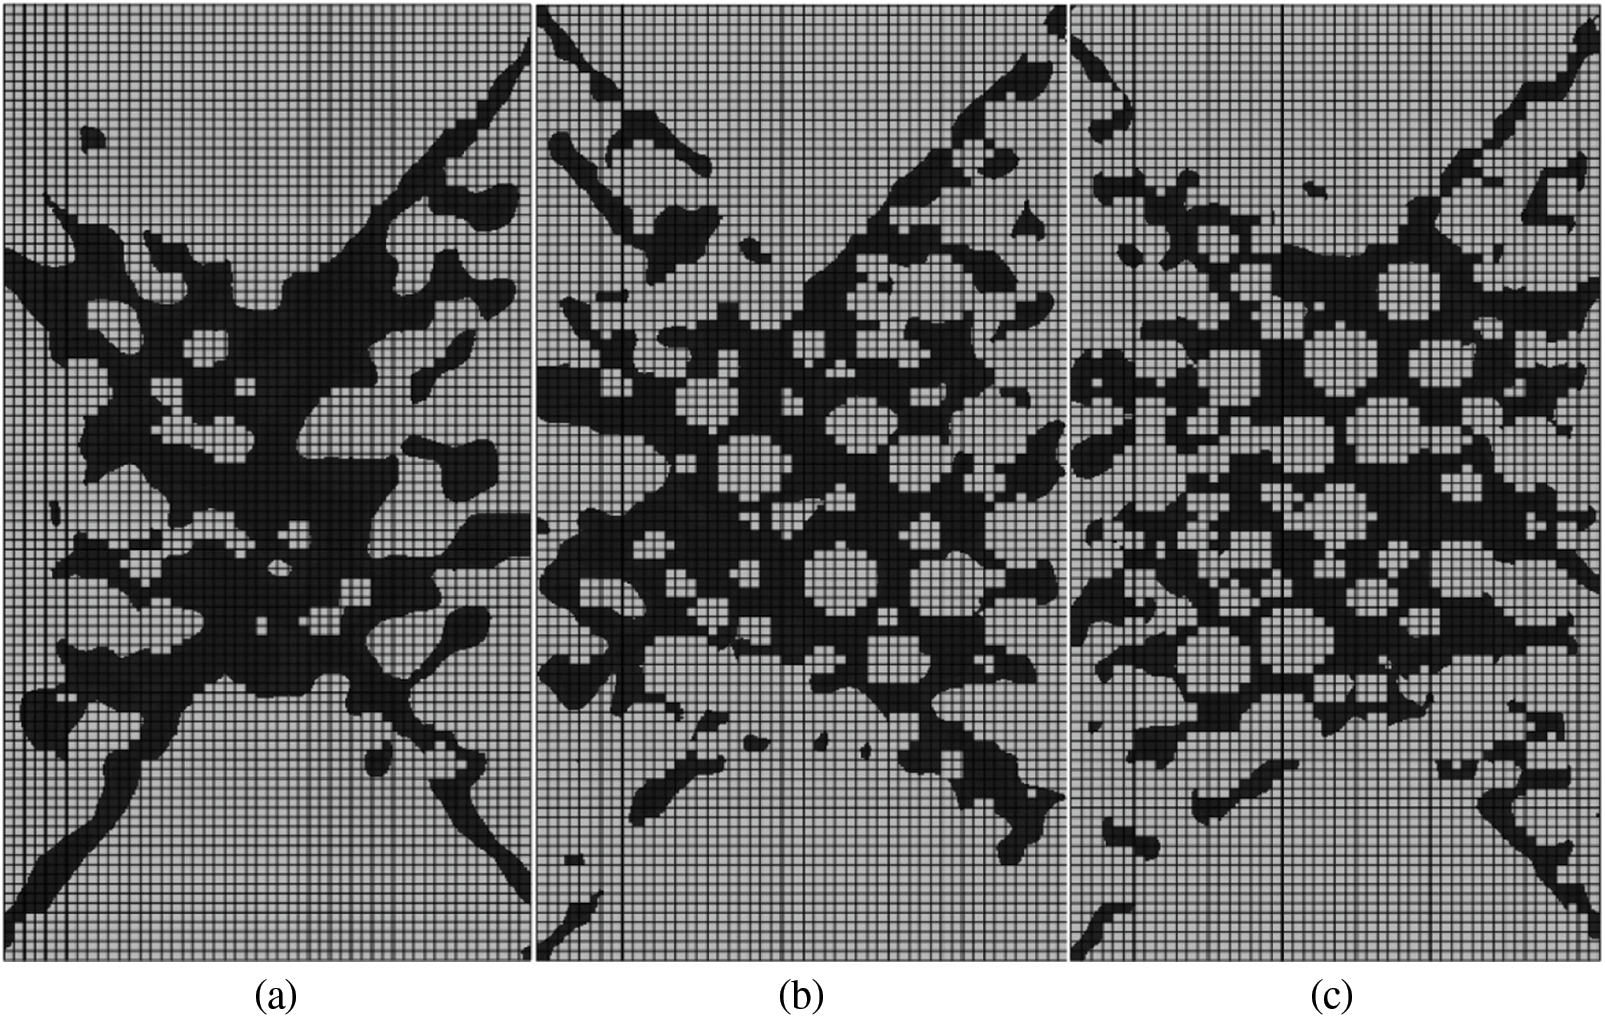
Figure 24: Yielding zones on the internal surface x = 50.5 mm under confining pressure of 200 kPa (a) RBC = 30%; (b) RBC = 50%; (c) RBC = 70%
Soil-rock mixture as the fillings in the Fault Zone, which is different from soil and rock, will affect the stability of the abutment and the dam foundation, and the safety of the arch dam. It is essential and crucial to investigate the mechanical properties and deformation laws of SRM based on mesostructure. However, only limited current studies take accounts of the influences of “rock block” on SRM filling in the fault zone. Additionally, the conduction of physical experiments requires specific conditions and designated sample dimensions, and observing the evolution of the internal structure is inconvenient in the physical experiments. This study aims to develop a viable mesoscopic numerical simulation method with a mesoscopic model generation technology and a reasonable parametric model for the research of macroscopic and microscopic mechanical properties and deformation mechanisms.
In this study, the triaxial compression tests of the soil matrix in SRM are carried out, which provide reliable parameters for the following numerical simulation tests of SRM. In addition, the triaxial compression tests of SRM with different rock block contents (RBC) are also carried out, from which we can see that the rock block increases the strength of SRM.
The numerical simulation method is adopted based on mesostructure to reveal the microscopic evolution process of the damage in SRM. Firstly, the random generation technique of the mesostructure model on the basis of the mapping grid method is proposed, which mainly includes the algorithm for the generation of the random block and the mapping algorithm. Then, the rock parameter model is proposed considering the rock size effect. Finally, the triaxial numerical compression tests of SRM with different RBCs have been performed. The numerical results can correspond well with the results of experimental tests, and the contents and sizes of rock blocks have remarkable influences on the strength of SRM. In addition, the result of yielding zones indicates that multiple failure surfaces with the angle of the failure zone being no longer 45° can be observed in yielding zones of SRM. The yielding zones of the specimen are more likely to occur in thin sections of soil matrix isolated by blocks with the failure path avoiding the rock block. The proposed numerical method is effective in investigating the meso-damage mechanism of SRM.
Funding Statement: This work has been supported by the Chinese National Natural Science Foundation (51739006), the Postgraduate Research & Practice Innovation Program of Jiangsu Province (SJKY19_0433), and the Fundamental Research Funds for the Central Universities (2019B65714).
Conflicts of Interest: The authors declare that they have no conflicts of interest to report regarding the present study.
Reference
1. Wittke, W., Leonards, G. A. (1987). Modified hypothesis for failure of malpasset dam. Engineering Geology, 24(1–4), 367–394. DOI 10.1016/0013-7952(87)90073-1. [Google Scholar] [CrossRef]
2. Meng, G. T., Xu, W. Y., Yang, S. Q., Liu, J. T., Yan, X. C. (2008). Genesis mechanism and engineering characteristics analysis of G_ (23) mylonitization and fractured belt in dam foundation of a hydropower station. Rock and Soil Mechanics, 29(6), 1691–1694. DOI 10.3969/j.issn.1000-7598.2008.06.049. [Google Scholar] [CrossRef]
3. Xu, W. Y., Meng, G. T., Jiang, T., Yang, Q. (2007). Numerical modeling on treatment of mylonitization and fracture belt in dam foundation. Journal of Hydraulic Engineering, 38(3), 312–318. DOI 10.3321/j.issn.0559-9350.2007.03.010. [Google Scholar] [CrossRef]
4. Ru, N. H., Jiang, Z. S. (1995). Dam failure and safety-arch dam. Beijing, China: China Water & Power Press. [Google Scholar]
5. Zhang, Y., Xu, W. Y., Gu, J. J., Wang, W. (2013). Triaxial creep tests of weak sandstone from fracture zone of high dam foundation. Journal of Central South University, 20(9), 2528–2536. DOI 10.1007/s11771-013-1765-7. [Google Scholar] [CrossRef]
6. Savely, J. P. (1990). Determination of shear strength of conglomerates using a caterpillar D9 ripper and comparison with alternative methods. International Journal of Mining and Geological Engineering, 8(3), 203–225. DOI 10.1007/BF01554042. [Google Scholar] [CrossRef]
7. Xu, W. J., Xu, Q., Hu, R. L. (2011). Study on the shear strength of soil-rock mixture by large scale direct shear test. International Journal of Rock Mechanics and Mining Sciences, 48(8), 1235–1247. DOI 10.1016/j.ijrmms.2011.09.018. [Google Scholar] [CrossRef]
8. Coli, N., Berry, P., Boldini, D. (2011). In situ non-conventional shear tests for the mechanical characterisation of a bimrock. International Journal of Rock Mechanics and Mining Sciences, 48(1), 95–102. DOI 10.1016/j.ijrmms.2010.09.012. [Google Scholar] [CrossRef]
9. Kuenza, K., Towhata, I., Orense, R. P., Wassan, T. H. (2004). Undrained torsional shear tests on gravelly soils. Landslides, 1(3), 185–194. DOI 10.1007/s10346-004-0023-3. [Google Scholar] [CrossRef]
10. Gao, W., Hu, R. L., Oyediran, I. A., Li, Z. Q., Zhang, X. Y. (2014). Geomechanical characterization of zhangmu soil-rock mixture deposit. Geotechnical and Geological Engineering, 32(5), 1329–1338. DOI 10.1007/s10706-014-9808-x. [Google Scholar] [CrossRef]
11. Wang, Y., Li, X. (2015). Experimental study on cracking damage characteristics of a soil and rock mixture by UPV testing. Bulletin of Engineering Geology and the Environment, 74(3), 775–788. DOI 10.1007/s10064-014-0673-x. [Google Scholar] [CrossRef]
12. Li, W. S., Ding, X. L., Wu, A. Q., Xiong, S. H. (2007). Shear strength degeneration of soil and rock mixture in three gorges reservoir bank slopes under influence of impounding. Rock and Soil Mechanics, 28(7), 1338–1342. DOI 10.3969/j.issn.1000-7598.2007.07.010. [Google Scholar] [CrossRef]
13. Liu, L. Q., Mao, X. S., Xiao, Y. J., Wu, Q., Tang, K. et al. (2019). Effect of rock particle content on the mechanical behavior of a soil-rock mixture (SRM) via large-scale direct shear test. Advances in Civil Engineering, 2019(3), 1–16. DOI 10.1155/2019/6452657. [Google Scholar] [CrossRef]
14. Chang, W. J., Phantachang, T. (2016). Effects of gravel content on shear resistance of gravelly soils. Engineering Geology, 207, 78–90. DOI 10.1016/j.enggeo.2016.04.015. [Google Scholar] [CrossRef]
15. Shakoor, A., Cook, B. D. (1990). The effect of stone content, size, and shape on the engineering properties of a compacted silty clay. Bulletin of the Association of Engineering Geologists, 27(2), 245–253. DOI 10.2113/gseegeosci.xxvii.2.245. [Google Scholar] [CrossRef]
16. Hamidi, A., Salimi, N., Yazdanjou, V. (2011). Shape and size effects of gravel particles on shear strength characteristics of sandy soils. Journal of Geoscience, 20(80), 189–196. DOI 10.22071/GSJ.2011.55251. [Google Scholar] [CrossRef]
17. Afifipour, M., Moarefvand, P. (2014). Failure patterns of geomaterials with block-in-matrix texture: Experimental and numerical evaluation. Arabian Journal of Geosciences, 7(7), 2781–2792. DOI 10.1007/s12517-013-0907-4. [Google Scholar] [CrossRef]
18. Fan, J. B., Hong, B. N., Liu, S. Q., Liu, X. (2014). Study on the effect of rock size on strength characteristics of soil-rock mixture. Science Technology and Engineering, 14(27), 268–272. DOI 10.3969/j.issn.1671-1815.2014.27.054. [Google Scholar] [CrossRef]
19. Sun, S. R., Zhu, F., Wei, J. H., Wang, W. C., Le, H. L. (2019). Experimental study on shear failure mechanism and the identification of strength characteristics of the soil-rock mixture. Shock and Vibration, 2019(4), 1–25. DOI 10.1155/2019/7450509. [Google Scholar] [CrossRef]
20. Fragaszy, R. J., Su, W., Siddiqi, F. H. (1990). Effects of oversize particles on the density of clean granular soils. Geotechnical Testing Journal, 13(2), 106–114. DOI 10.1520/GTJ10701J. [Google Scholar] [CrossRef]
21. Zhou, Z., Yang, H., Wang, X. C., Liu, B. C. (2017). Model development and experimental verification for permeability coefficient of soil–rock mixture. International Journal of Geomechanics, 17(4), 04016106. DOI 10.1061/(ASCE)GM.1943-5622.0000768. [Google Scholar] [CrossRef]
22. Wang, Y. G., Li, X. S., Zheng, B., Zhang, Y. X., Li, G. F. et al. (2016). Experimental study on the non-darcy flow characteristics of soil-rock mixture. Environmental Earth Sciences, 75(9), 1–18. DOI 10.1007/s12665-015-5218-5. [Google Scholar] [CrossRef]
23. Wang, Y. G., Li, X. S., Zheng, B., Li, S. D., Duan, Y. T. (2016). A laboratory study of the effect of confining pressure on permeable property in soil-rock mixture. Environmental Earth Sciences, 75(4), 284. DOI 10.1007/s12665-015-5193-x. [Google Scholar] [CrossRef]
24. Wang, Z. M., Kwan, A. K. H., Chan, H. C. (1999). Mesoscopic study of concrete I: Generation of random aggregate structure and finite element mesh. Computers & Structures, 70(5), 533–544. DOI 10.1016/S0045-7949(98)00177-1. [Google Scholar] [CrossRef]
25. Xu, W. X., Chen, H. S., Lv, Z. (2010). A 2D elliptical model of random packing for aggregates in concrete. Journal of Wuhan University of Technology–Materials Science Edition, 25(4), 717–720. DOI 10.1007/s11595-010-0078-z. [Google Scholar] [CrossRef]
26. Li, X., Liao, Q. L., He, J. M. (2004). In-situ tests and stochastic structural model of rock and soil aggregate in the three gorges reservoir area. International Journal of Rock Mechanics and Mining Sciences, 41(3), 494. DOI 10.1016/j.ijrmms.2003.12.030. [Google Scholar] [CrossRef]
27. Yue, Z. Q., Morin, I. (1996). Digital image processing for aggregate orientation in asphalt concrete mixtures. Canadian Journal of Civil Engineering, 23(2), 480–489. DOI 10.1139/l96-052. [Google Scholar] [CrossRef]
28. Yue, Z. Q., Chen, S., Tham, L. G. (2003). Finite element modeling of geomaterials using digital image processing. Computers and Geotechnics, 30(5), 375–397. DOI 10.1016/S0266-352X(03)00015-6. [Google Scholar] [CrossRef]
29. Xu, W. J., Yue, Z. Q., Hu, R. L. (2008). Study on the mesostructure and mesomechanical characteristics of the soil–rock mixture using digital image processing based finite element method. International Journal of Rock Mechanics and Mining Sciences, 45(5), 749–762. DOI 10.1016/j.ijrmms.2007.09.003. [Google Scholar] [CrossRef]
30. Pan, Y. W., Hsieh, M. H., Liao, J. J. (2008). Mechanical properties of virtual block-in-matrix colluvium. Proceedings of ARMA 2008, 42nd U.S. Rock Mechanics Symposium, pp. 1–8. San Francisco, American RockMechanics Association. [Google Scholar]
31. Wang, Y., Li, X. (2014). Research on damage cracking for rock and soil aggregate using calculation meso-mechanics. Chinese Journal of Rock Mechanics and Engineering, 33(S2), 4020–4031. DOI 10.13722/j.cnki.jrme.2014.s2.079. [Google Scholar] [CrossRef]
32. Wang, Y., Li, X., Li, S. D., Li, G. F., Zhao, Z. H. (2015). Cracking deformation characteristics for rock and soil aggregate under uniaxial compression tests. Chinese Journal of Rock Mechanics and Engineering, 34(S1), 3541–3552. DOI 10.13722/j.cnki.jrme.2014.0389. [Google Scholar] [CrossRef]
33. Liu, Q., Button, E., Klima, K. (2007). Investigation for probabilistic prediction of shear strength properties of clay-rich fault gouge in the Austrian Alps. Engineering Geology, 94(1–2), 103–121. DOI 10.1016/j.enggeo.2007.08.001. [Google Scholar] [CrossRef]
34. Sulem, J., Vardoulakis, I., Ouffroukh, H., Boulon, M., Hans, J. (2004). Experimental characterization of the thermo-poro-mechanical properties of the aegion fault gouge. Comptes Rendus Geoscience, 336(4–5), 455–466. DOI 10.1016/j.crte.2003.12.009. [Google Scholar] [CrossRef]
35. Rutter, E. H., Maddock, R. H. (1992). On the mechanical properties of synthetic kaolinite/quartz fault gouge. Terra Nova, 4(4), 489–500. DOI 10.1111/j.1365-3121.1992.tb00585.x. [Google Scholar] [CrossRef]
36. The Ministry of Water Resources of the P.R.C. (2005). Design speicification for concrete gravity dams (SL319-2005). Beijing, China: China Water & Power Press. [Google Scholar]
37. Dong, Y., Chai, H. J. (2007). Study on engineering synthetical classification of rock-soil aggregate mixture. Rock and Soil Mechanics, 28(1), 179–184. DOI 10.3969/j.issn.1000-7598.2007.01.033. [Google Scholar] [CrossRef]
38. Wu, S. F., Cai, H., Wei, Y. Q., Xiao, J. Z., Yan, J. (2019). Shear mechanism and shear strength component characteristics of soil-stone mixtures. Chinese Journal of Geotechnical Engineering, 41(S2), 230–234. DOI 10.11779/CJGE2019S2058. [Google Scholar] [CrossRef]
39. Liu, L. P., She, X. S. (2006). Study on compaction property of earth-rock mixture. Chinese Journal of Rock Mechanics and Engineering, 25(1), 206–210. DOI 10.3321/j.issn:1000-6915.2006.01.034. [Google Scholar] [CrossRef]
40. Shu, Z. L., Liu, X. R., Liu, B. X., Guo, Z. H. (2009). Study of strength properties of earth-rock aggregate based on fractals. Chinese Journal of Rock Mechanics and Engineering, 28(z1), 2651–2656. DOI 10.3321/j.issn:1000-6915.2009.z1.009. [Google Scholar] [CrossRef]
41. Jia, X. M., Chai, H. J., Zheng, Y. R. (2010). Mesomechanics research of large direct shear test on soil and rock aggregate mixture with particle flow code simulation. Rock and Soil Mechanics, 31(9), 2695–2703. DOI 10.3969/j.issn.1000-7598.2010.09.002. [Google Scholar] [CrossRef]
42. Weibull, W. (1939). The phenomenon of rupture in solids. Stockholm, SWE: Generalstabena Litografiska Anstalts Forlag. [Google Scholar]
43. Weibull, W. (1951). A statistical distribution function of wide applicability. Journal of Applied Mechanics, 18(3), 293–297. DOI 10.1115/1.4010337. [Google Scholar] [CrossRef]
44. McDowell, G. R., Bolton, M. D. (1998). On the micromechanics of crushable aggregates. Geotechnique, 48(5), 667–679. DOI 10.1680/geot.1998.48.5.667. [Google Scholar] [CrossRef]
45. Nakata, Y., Hyde, A. F. L., Hyodo, M., Murata, H. (1999). A probabilistic approach to sand particle crushing in the triaxial test. Geotechnique, 49(5), 567–583. DOI 10.1680/geot.1999.49.5.567. [Google Scholar] [CrossRef]
46. Liu, B. C., Zhang, J. S., Du, Q. Z. (1998). A study of size effect for compression strength of rock. Chinese Journal of Rock Mechanics and Engineering, 17(6), 611–614. DOI 10.3321/j.issn:1000-6915.1998.06.001. [Google Scholar] [CrossRef]
47. Jin, L., Zeng, Y. W., Li, J. J. (2015). Analysis on meso-mechanisms of influence of rock block shape on mechanical properties of cemented soil-rock mixture. Chinese Journal of Solid Mechanics, 36(6), 506–516. DOI 10.19636/j.cnki.cjsm42-1250/o3.2015.06.005. [Google Scholar] [CrossRef]
48. He, C. C., Hu, X. L., Gong, H., Tan, F. L., Zhang, H. et al. (2016). Analysis of mesoscopic damage and mechanical behaviors of soil-rock mixture based on template database of soft and hard rocks. Rock and Soil Mechanics, 37(10), 2993–3002. DOI 10.16285/j.rsm.2016.10.034. [Google Scholar] [CrossRef]
 | This work is licensed under a Creative Commons Attribution 4.0 International License, which permits unrestricted use, distribution, and reproduction in any medium, provided the original work is properly cited. |