| Computer Modeling in Engineering & Sciences |
DOI: 10.32604/cmes.2022.020507
ARTICLE
Numerical Study on the Suitability of Passive Solar Heating Technology Based on Differentiated Thermal Comfort Demand
School of Civil Engineering and Architecture, Xi’an University of Technology, Xi’an, 710048, China
*Corresponding Author: Yiyun Zhu. Email: zyyun@xaut.edu.cn
Received: 27 November 2021; Accepted: 20 December 2021
Abstract: Indoor thermal comfort and passive solar heating technologies have been extensively studied. However, few studies have explored the suitability of passive solar heating technologies based on differentiated thermal comfort demands. This work took the rural dwellings in Northwest China as the research object. First, the current indoor and outdoor thermal environment in winter and the mechanism of residents’ differentiated demand for indoor thermal comfort were obtained through tests, questionnaires, and statistical analysis. Second, a comprehensive passive optimized design of existing buildings was conducted, and the validity of the optimized combination scheme was explored using DesignBuilder software. Finally, the suitability of passive solar heating technology for each region in Northwest China was analyzed based on residents’ differentiated demand for indoor thermal comfort. The regions were then classified according to the suitability of the technology for these. The results showed that the indoor heating energy consumption was high and the indoor thermal environment was not ideal, yet the solar energy resources were abundant. Indoor comfort temperature indexes that match the functional rooms and usage periods were proposed. For the buildings with the optimized combination scheme, the average indoor temperature was increased significantly and the temperature fluctuation was decreased dramatically. Most regions in Northwest China were suitable for the development of passive solar heating technology. Based on the obtained suitability of the technology for the regions of Northwest China, these were classified into most suitable, more suitable, less suitable, and unsuitable regions.
Keywords: Rural dwellings; differentiated thermal comfort demand; optimization and simulation; statistical analysis; passive solar heating technology; suitability
Humans spend approximately 70–90% of their lifetime indoors, particularly the sick, weak, disabled, and elderly [1,2]. Thus, with the progress of science and technology and the improvement in living standards, higher demands have been put forward for the thermal comfort of the indoor environment [3,4]. However, the improvement in indoor thermal comfort is generally accompanied by a rapid increase in building energy consumption [5,6]. It has been reported that buildings account for 40% of the total global energy consumption, and this proportion continues to increase [7,8]. This study aims to effectively address this contradictory problem to possess a comfortable and energy-efficient indoor thermal environment.
Indoor temperature plays a vital role in the achievement of a comfortable indoor thermal environment. Additionally, building standards [9,10] emphasize that the energy demand of temperature control systems can be evaluated only after the indoor comfort temperature is determined. Evidently, it is crucial to determine the indoor comfort temperature index for developing comfortable and energy-efficient buildings. In thermal comfort research, however, the existing theories regarding indoor comfort temperature are poorly developed. Most of the existing studies are based on the assumption that residents have similar demands for indoor thermal comfort during day and night [11–13]. However, several studies have demonstrated that the human body has different demands for indoor comfort temperature in the active and sleeping states [14–16]. Additionally, previous studies generally regarded the indoor space of a building in its entirety [13,17,18]. Although this assumption is conducive to simplifying the analysis process in building thermal engineering, it does not consider the differentiated thermal comfort demands of residents for different functional rooms [19,20]. To summarize, the indoor comfort temperature varies with functional room and usage period. However, few discussions on this difference were undertaken in previous studies. This is highly unfavorable to the realization of energy-saving and comfortable buildings. Therefore, this study explored the differentiated indoor comfort temperature indexes by adopting a research method that differentiates functional rooms and usage periods.
The indoor temperature directly affects indoor thermal comfort and building energy consumption [21]. Meanwhile, the space form, space dimensions, thermal parameters, construction practices, and passive thermal response of the building directly influence its thermal performance and solar thermal utilization [22–25]. Thereby, these affect indoor temperature. However, previous studies have focused on exploring the role of individual influencing factors on the indoor thermal environment rather than the synergistic improvement effect of multi-factors [26–30]. To summarize, it is crucial to thoroughly consider each influencing factor in the design of schemes for improving the indoor thermal environment.
As is widely known, the application of passive solar heating technology can enable buildings to achieve certain heating functions without the aid of mechanical power. Given this, many scholars have conducted studies on passive technologies. It has been demonstrated that the application of passive solar heating technology can significantly improve the indoor environment and reduce building energy consumption [31,32]. Nevertheless, the application effect of this technology depends significantly on the regional climatic conditions [33,34]. In addition, it is noteworthy that few documents are available to guide the promotion of passive solar heating technology in rural areas of China. In particular, there are rarely specifications or studies that can guide designers in the selection of suitable region and the corresponding optimal type [35–37]. Undoubtedly, the suitability zoning of passive solar heating technology in rural areas would contribute significantly to the realization of comfortable and energy-efficient rural dwellings.
As a rapidly-developing country, China’s construction industry is undergoing rapid development and innovation. Nevertheless, the existing schemes for improving the thermal environment of rural dwellings are imperfect. The problems of low indoor thermal comfort and high heating energy consumption continue to be prominent [38–40]. The main reason is the deficiency of scientific theoretical guidance for rural buildings [41,42]. Most regions in Northwest China are located in cold or severe cold climate zones. Here, the climate conditions are harsh, and the ecological environment is vulnerable [43]. As a result, the above-mentioned problems of the indoor environment are particularly prominent in the rural areas of Northwest China. However, most of Northwestern China has abundant solar energy resources. Considering the above analysis, this study takes the rural dwellings in Northwest China as the research object to explore the suitability of passive solar heating technology.
The investigation of the suitability of passive solar heating technology involves an analysis of the building thermal process under geographical zoning. An issue that needs to be focused upon while discussing building thermal processes is the heat transfer in the building envelope. To clarify the heat transfer condition of the envelope, it is necessary to solve the differential equation of heat conduction. The solving of the equation involves its discretization. At present, the commonly used discretization methods include the finite-volume method (FVM), finite-element method (FEM), and finite-difference method (FDM). However, a comprehensive comparison revealed that the FVM has a low computational accuracy [44]. The FEM has limitations such as complex procedures and substantial calculations [45]. It is noteworthy that the FDM exhibits strong applicability, computational efficiency, optional accuracy, and convenience to implement on a computer [46]. In summary, the FDM is a highly effective numerical calculation method.
In addition, the two main specialized computer-aided engineering software programs for building thermal simulation are EnergyPlus and DesignBuilder (DB). EnergyPlus is a building energy simulation engine developed by the U.S. Department of Energy and Lawrence Berkeley National Laboratory. It is based on the building heat balance equation and the FDM to analyze building thermal performance, solar energy utilization scheme, and indoor temperature fields under unsteady heat transfer [47]. It is noteworthy that with the development of science and technology, a variety of user-graphic interface software has emerged for EnergyPlus. Of these, and DB is one of the most powerful [47]. Compared with EnergyPlus, DB has the characteristics of rapid modeling, convenient use, and powerful functions. Additionally, DB passed the ASHRAE test in 2006. This indicates that the simulation results of DB are consistent with those of EnergyPlus. Hence, DB is adopted in this study to simulate and analyze the suitability of passive solar heating technology.
To develop a comfortable and energy-efficient indoor thermal environment, this study undertook the following tasks with the rural dwellings in Northwest China as the research object:
• The current indoor and outdoor thermal environment in winter and the mechanism of residents’ differentiated demand for indoor thermal comfort were obtained through tests, questionnaires, and statistical analysis.
• The indoor comfort temperature indexes that match the functional rooms and usage periods were explored.
• A comprehensive passive optimized design of existing buildings is conducted, and the validity of the optimized combination scheme was explored using DB.
• The suitability of passive solar heating technology for each region in Northwest China was analyzed using the obtained differentiated comfort temperature indexes. Furthermore, the regions were classified according to the suitability of the technology.
Ningxia is located in inland Northwest China (Fig. 1a). The architectural forms and climate characteristics here are representative of Northwest China [7]. Therefore, this study takes the rural dwellings in Ningxia, Northwest China, as the research object. We conducted a field survey on rural dwellings in Ningxia, Northwest China, during January 16–20, 2015, and January 15–17, 2017. The site photographs of the test and questionnaire are shown in Fig. 2.
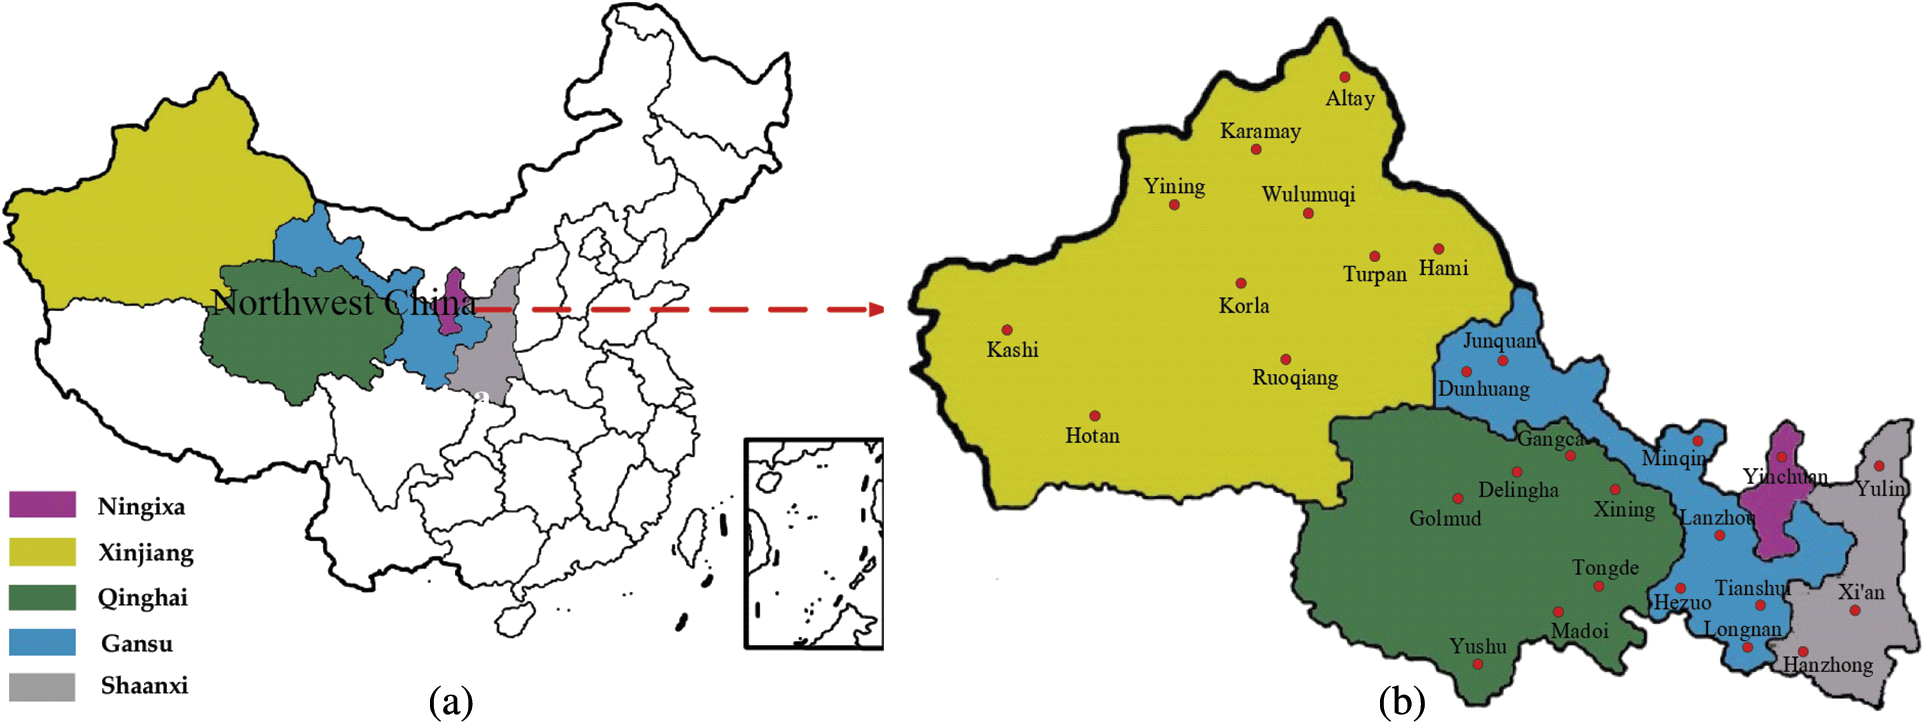
Figure 1: Location of the study regions. (a) Location of Ningxia in China map; (b) Location of 28 representative regions in Northwest China
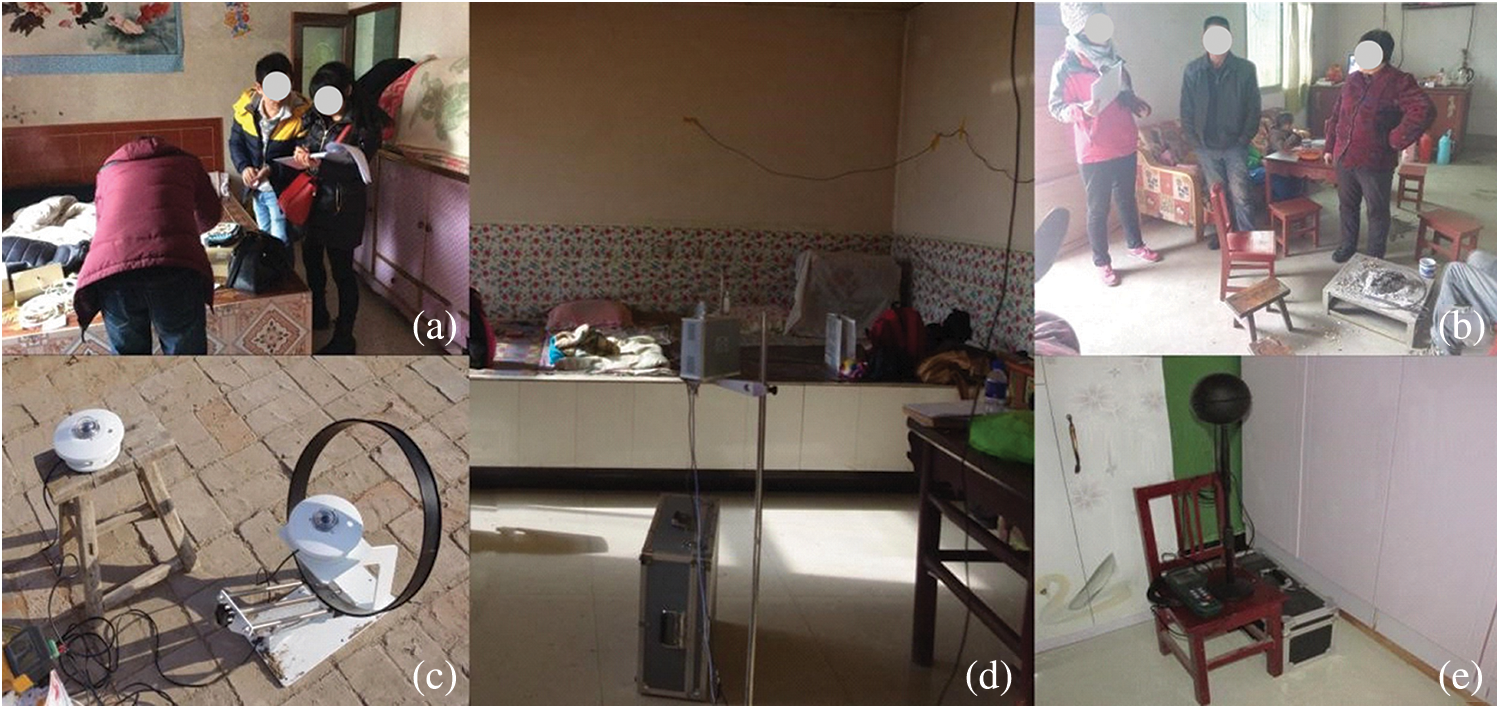
Figure 2: Site photographs of the test and questionnaire. (a) Recording of test data; (b) Questionnaire for face-to-face; (c) Testing of solar radiation intensity; (d) Testing of indoor air temperature and relative humidity; (e) Testing of indoor black-globe temperature
The field survey revealed two types of local rural dwellings: earth buildings (7%) and brick-concrete buildings (93%). A majority of the local dwellings were approximately square. The internal and external walls were made of solid clay bricks. The thicknesses of the internal and external walls were 370 mm and 240 mm, respectively. The external walls were decorated with 10 mm-thick white tiles or fair-faced concrete. The internal walls were painted with lime mortar. The roof was generally single sloped or double sloped. Only the bedroom had a suspended ceiling (gypsum board). The windows were generally made of single-glass aluminum alloy. The door and indoor door were made of aluminum alloy and wood, respectively. A representative brick-concrete dwelling (Fig. 3a) was selected for the thermal environment test. The layout of indoor and outdoor measuring points is shown in Fig. 3b.
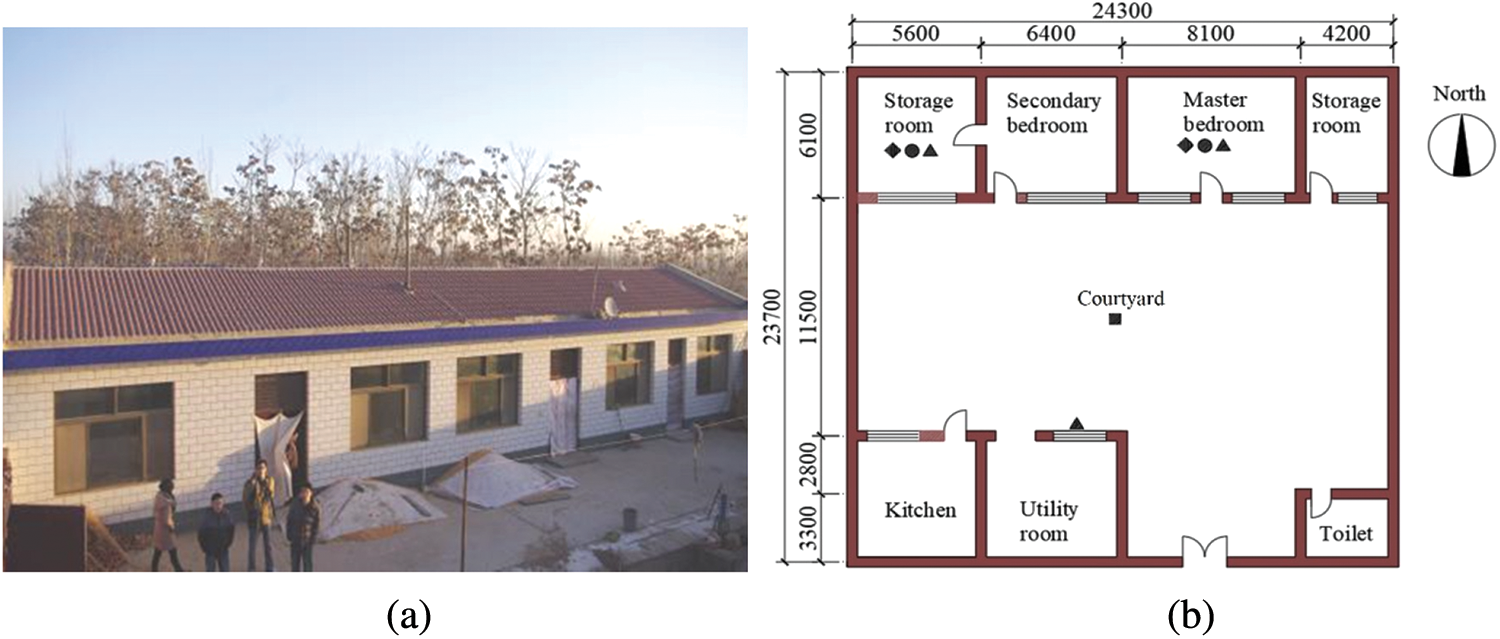
Figure 3: Measured dwelling and layout of measuring points. (a) Image of measured dwelling; (b) Layout of indoor and outdoor measuring points
2.1.2 Test Contents and Instruments
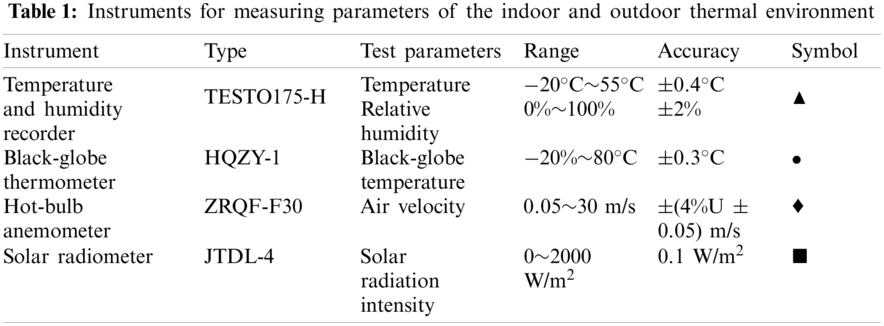
The test site was located in Heilin Village, Ningxia, Northwest China. The data were collected from January 16 to 20, 2015. The solar radiation intensity, relative humidity and temperature of air, air velocity, and black-globe temperature were measured. Considering the complexity involved in the measurement, the mean radiation temperature was assumed to be approximately equal to the black-globe temperature [48]. The instruments used are presented in Table 1.
The measurement duration of solar radiation intensity was 10 h, and the acquisition time interval was 1 h. The measuring point was located outdoors without shelter. The monitoring period for the relative humidity and temperature of the air was 24 h, and the acquisition time interval was 10 min. The measuring points are approximately 1.1 m above the ground.
The mean radiant temperature and air velocity were not recorded continuously owing to the inconvenience of placing the black-globe thermometer and hot-bulb anemometer in the respondent’s home for a long time. The mean radiation temperature and air velocity were measured every 2 h. The globe thermometer and hot-bulb anemometer were placed approximately 1.1 m above the ground.
Verbal and written informed consent was obtained from the participants prior to the questionnaire survey. The participants were villagers who had lived in the region for a long time. To ensure that the participants completed the written questionnaire conveniently and effectively, each question in it was explained before they executed it. In the experiment, the participants were asked to maintain daily habits and emotional stability. They were paid after they had participated in the entire experiment. In addition, to induce the participants to support this experiment, we assured them that positive performers would be provided additional rewards.
The data were collected during January 16–20, 2015 and January 15–17, 2017. A total of 610 participants were received face-to-face questionnaires. Finally, 583 valid questionnaires were recovered, which corresponded to an effective recovery rate of 95.6%. The questionnaires included basic life information and subjective perceptions of the participants. The thermal sensation votes (TSVs) were determined using the ASHRAE 7-point scale [49]: cold (–3), cool (–2), slightly cool (–1), neutral (0), slightly warm (+1), warm (+2), and hot (+3). The thermal sensation votes corresponding to acceptability were –1 to +1. The thermal preference votes used a three-level metric: cooler (–1), no change (0), and warmer (+1).
The thermal parameters and construction methods of the existing rural houses in Ningxia were optimized by combining the building standards [50,51] and field survey. The optimized thermal parameters and construction methods are presented in Table 2. Furthermore, the forms and dimensions of the indoor spaces in existing buildings were optimized based on the field survey and building standards [50,51]. The results are displayed in Fig. 4.
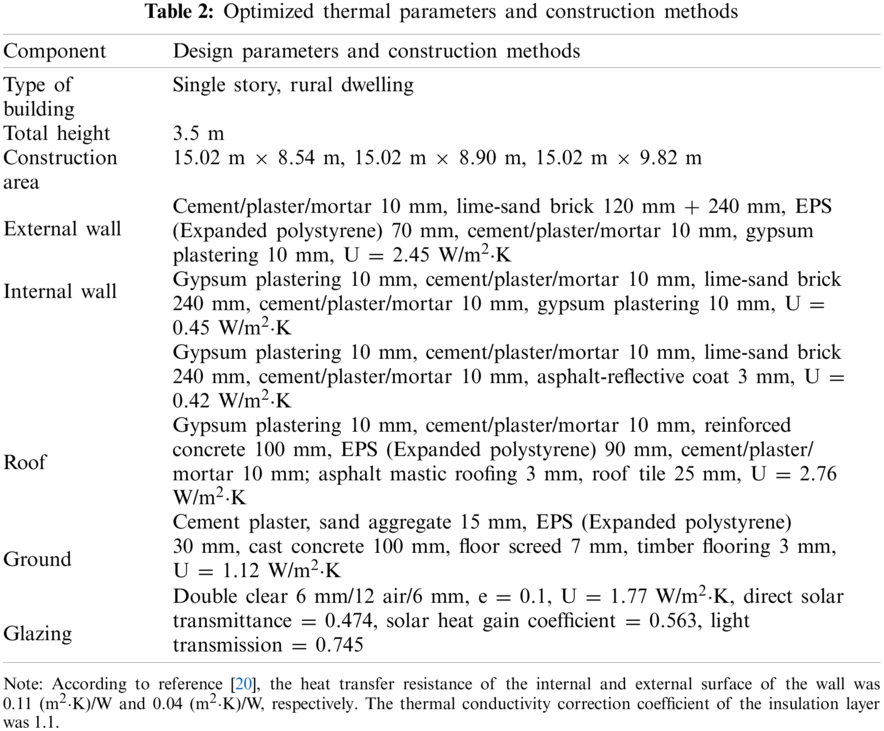
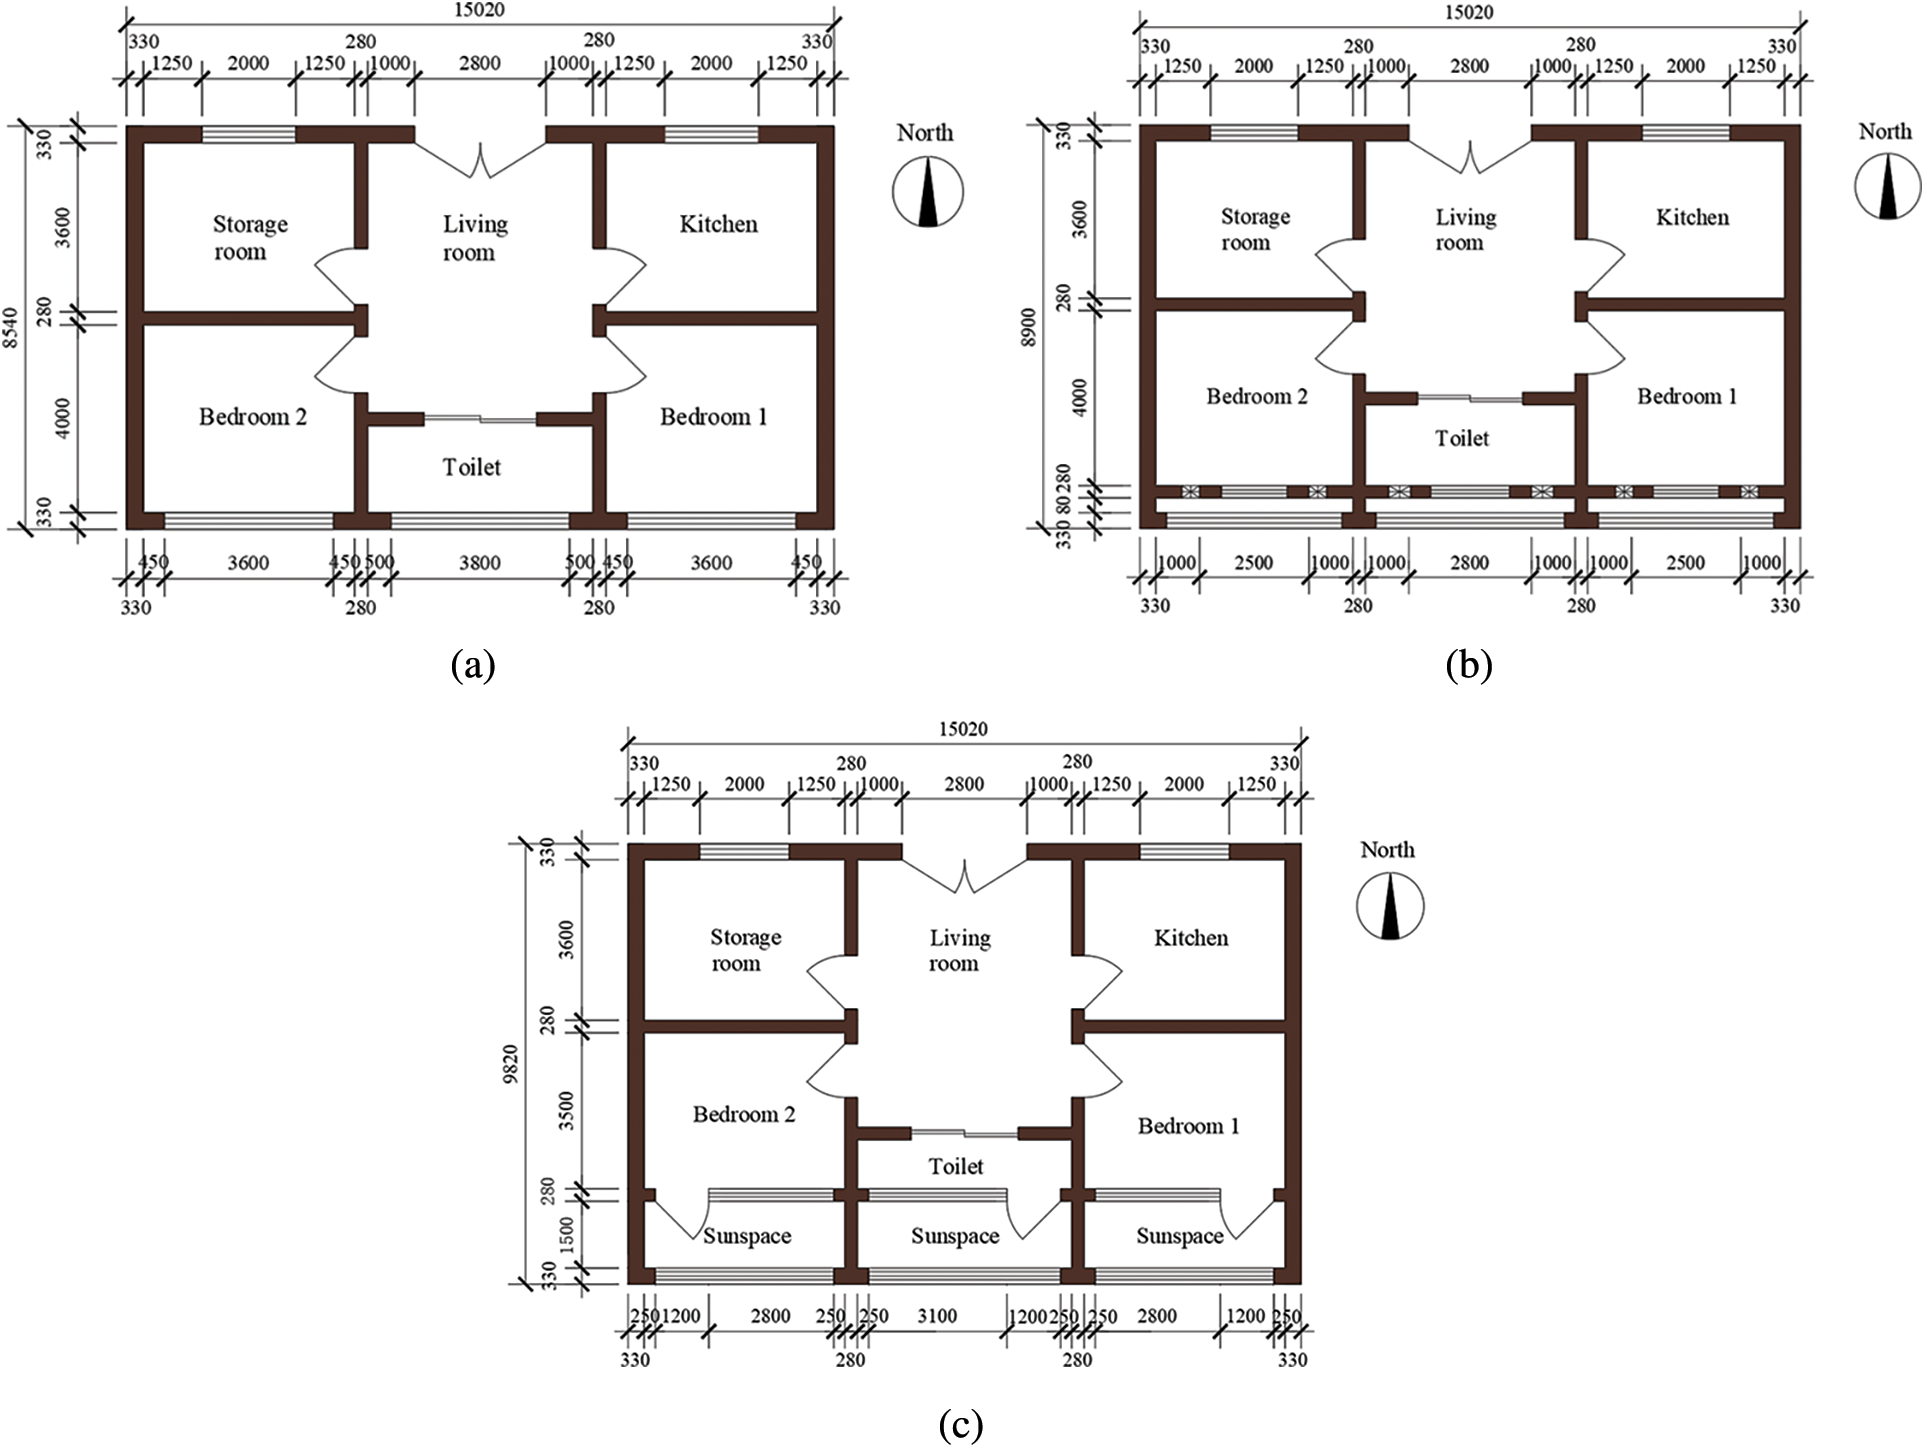
Figure 4: Optimized floor plans of three types of passive solar houses. (a) Direct-gain window passive solar house; (b) Trombe wall + direct-gain window passive solar house; (c) Attached sunspace passive solar house
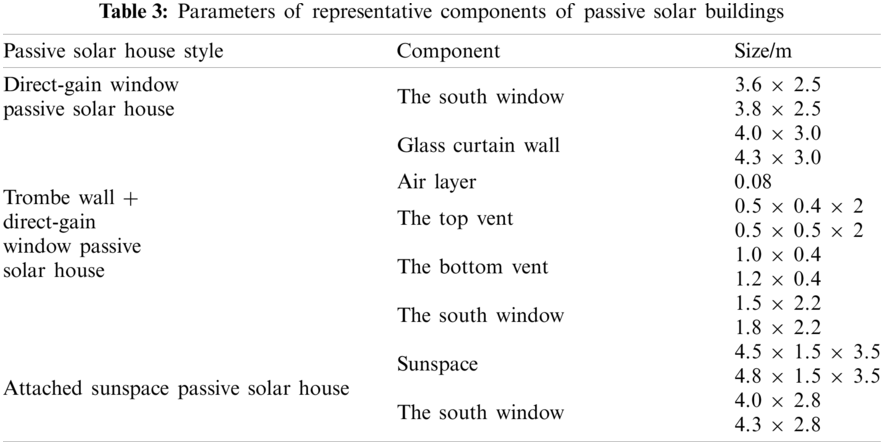
To investigate the impact of different types of passive solar houses on the indoor thermal environment, three types of passive solar houses were introduced in the design. The optimized floor plans of these three types of houses are shown in Fig. 4. The parameters of the representative components of passive solar houses are presented in Table 3. In addition, to facilitate comparative analysis, the rooms with the least favorable heat gain on the north and south sides were defined as room1 and room2, respectively. The direct-gain window passive solar house, Trombe wall + direct-gain window passive solar house, and attached sunspace passive solar house were denoted as mode1, mode2, and mode3, respectively.
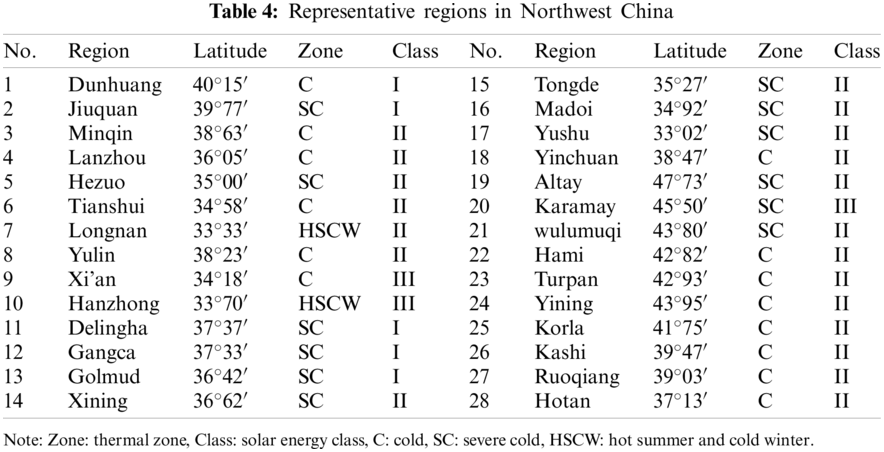
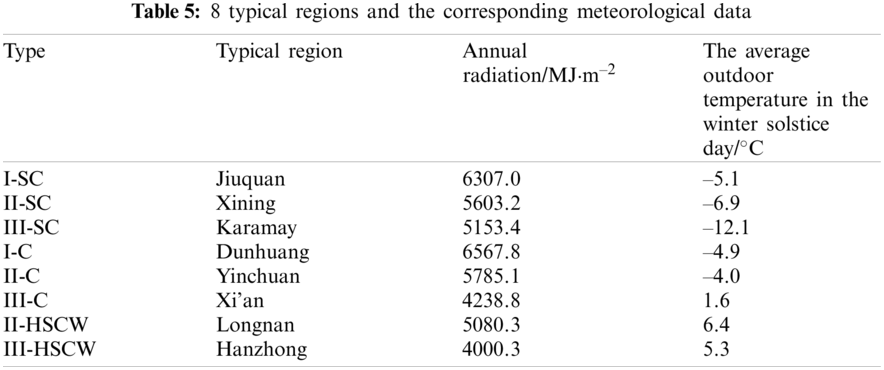
Northwest China includes the three provinces Shaanxi, Gansu and Qinghai and the two autonomous regions of Ningxia and Xinjiang (Fig. 1a). Here, the outdoor climatic conditions vary substantially across regions [52]. 28 representative regions in Northwest China were selected in this study by combining solar radiation classes, building thermal zone, and administrative-geographical divisions [51,53] (see Fig. 1b and Table 4). To further facilitate the analysis of the suitability law of passive solar heating technology in Northwest China, 8 typical regions were selected from the 28 regions [54]. The 8 regions and the corresponding meteorological data are shown in Table 5 [10,55].
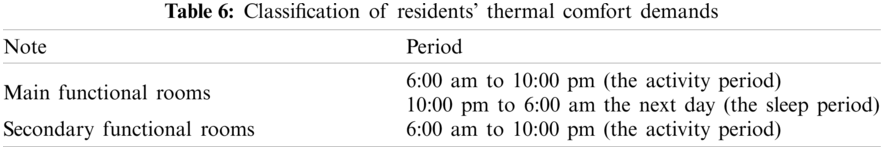
2.3.3 Classification of Thermal Comfort Demands
The residents’ demand for indoor thermal comfort was classified based on the responses to the questionnaire (see Table 6).
Under natural operation, the indoor thermal environment of a building is determined by the building thermal process. This process involves a series of heat balance equations and thermal transfer equations. The heat balance equations include those of the internal (external) surface of the non-transparent envelope, internal (external) surface of the transparent envelope, and indoor air.
The heat balance equation of the external surface of the non-transparent envelope is expressed as [56]
where
The heat balance equation for the internal surface of the non-transparent envelope is expressed as [56]
where
The heat balance equation of the internal and external surfaces of the transparent envelope can be expressed as (for double-glazed windows as an example) [56]
where
The heat balance equation of indoor air is [56]
where
An issue that should be focused upon in the solution of the heat balance equation is the heat transfer by the envelope.
The indoor temperature varies continuously owing to the variation in outdoor weather conditions with time. Therefore, the heat transfer phenomenon of the envelope structure is considered to be an unsteady heat transfer process. The differential equation of unsteady heat conduction in the three-dimensional (3D) Cartesian coordinate system is expressed as [21]
where x, y and z are the 3D Cartesian system coordinates,
However, considering that the height (length) and width of the external envelope are 8–10 times the thickness, the unsteady heat transfer of the external envelope is considered as a one-dimensional unsteady heat transfer process. The one-dimensional differential equation of unsteady heat conduction is expressed as [56]
where
Engineering calculation problems can be solved effectively and rapidly using the FDM. Using this method, the temperature gradient from the center of the k – 1-th (k-th) floor to the center of the k-th (k + 1-th) floor at time m is expressed as
where
Based on Eqs. (9) and (10), we obtain
where
Eq. (11) is substituted into Eq. (9) to get
where
Because the envelope is a homogeneous material layer, Eq. (12) can be simplified as
where
To determine the specific heat transfer conditions, the initial and boundary conditions need to be specified in addition to the heat conduction equation.
The boundary condition is [56]
where
The initial condition is [56]
The finite difference equation system (matrix expression form) of one-dimensional unsteady thermal conductivity is obtained according to Eqs. (15)–(17).
Further, the sequential Gaussian elimination method was used to solve the equation system to obtain the temperature of the surface of the envelope at each moment.
The process of the simulation using DB is as follows: (1) establishment of 3D model, (2) meshing, (3) setting of parameters, (4) setting of boundary conditions, and (5) verification of the model. It was worth noting that the meshing was done automatically by the DB in the running background. Therefore, this step was not shown during the simulation.
(1) 3D models
The 3D models for the simulation were established according to Fig. 4 in Section 2.3.1. The results are shown in Fig. 5.
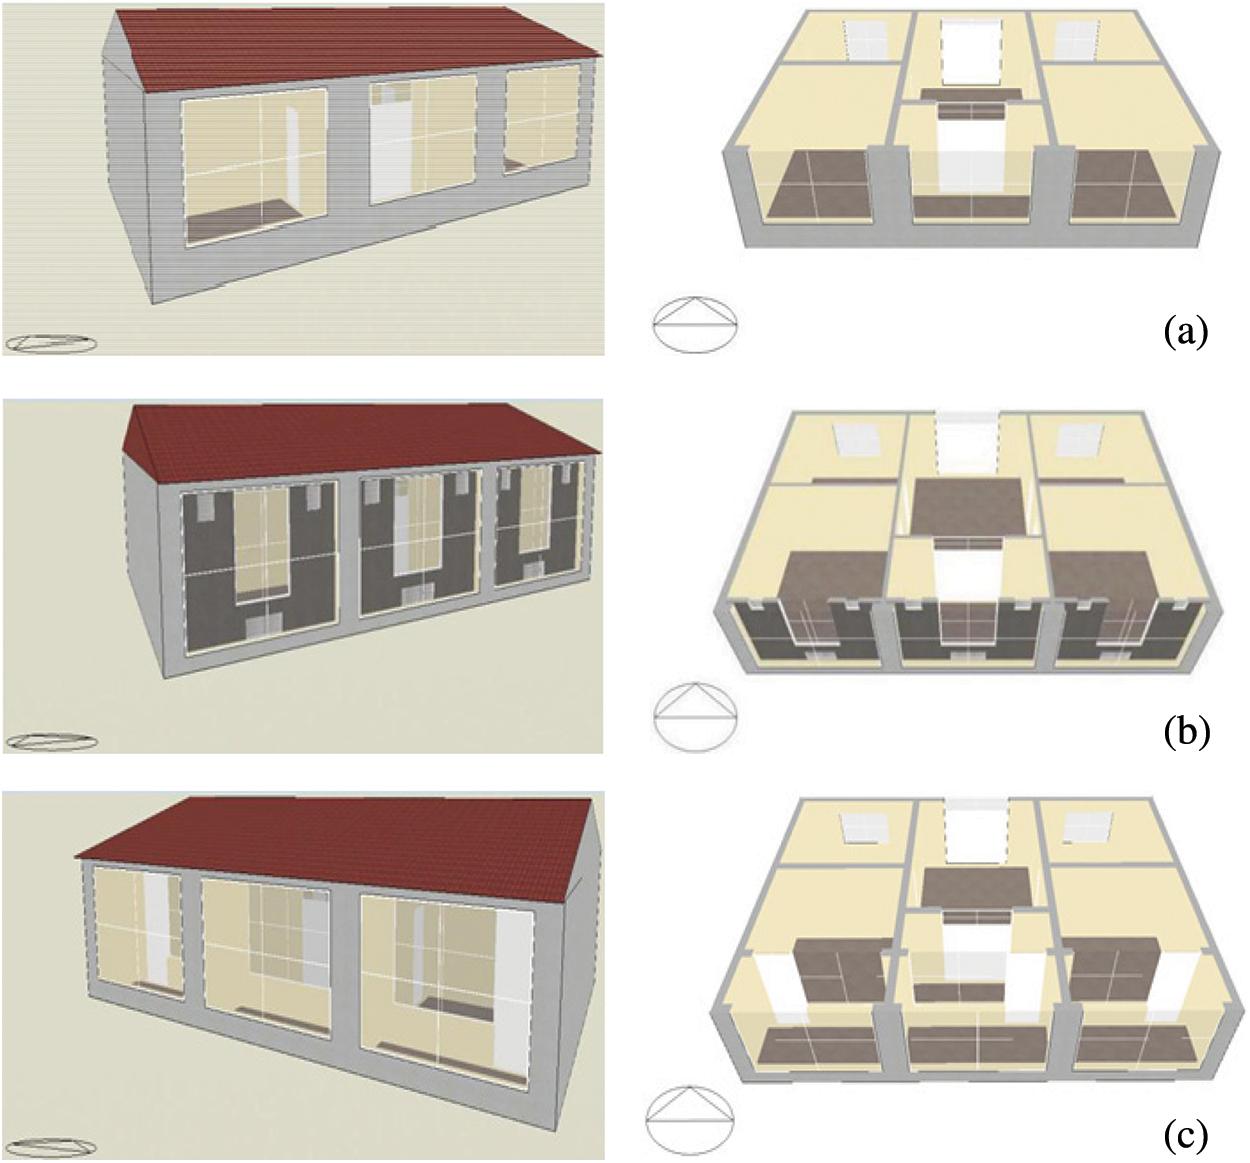
Figure 5: Developed 3D models. (a) Direct-gain window passive solar building; (b) Trombe wall + direct-gain window passive solar building; (c) Attached sunspace passive solar building
(2) Setting of parameters
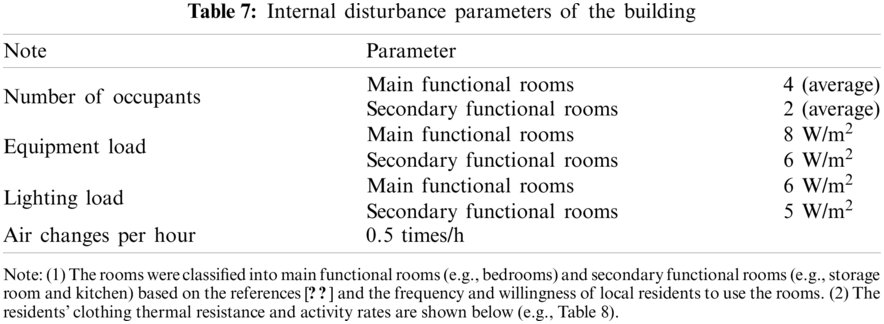
The construction parameters of the building are shown in Table 2. The internal disturbance parameters of the building are listed in Table 7. During the simulation, the timestep was set to 12. The grid size was automatically selected by DB.
(3) Setting of boundary conditions
China is located in the northern hemisphere of the earth. The day with the shortest sunshine time and the lowest solar altitude angle is the winter solstice. From the perspective of passive heat collection, the solar radiation conditions on this day are the worst for the year. Therefore, the winter solstice day was considered as the simulated weather date to explore the suitability of passive solar heating technology for each region in Northwest China.
(4) Validation of the model
The correctness of the model was verified to compare the tested data with the simulated data. The tested data were the indoor temperature of the tested dwelling on January 19, 2016. The comparison results between the simulated data and the tested data are presented in Fig. 6.
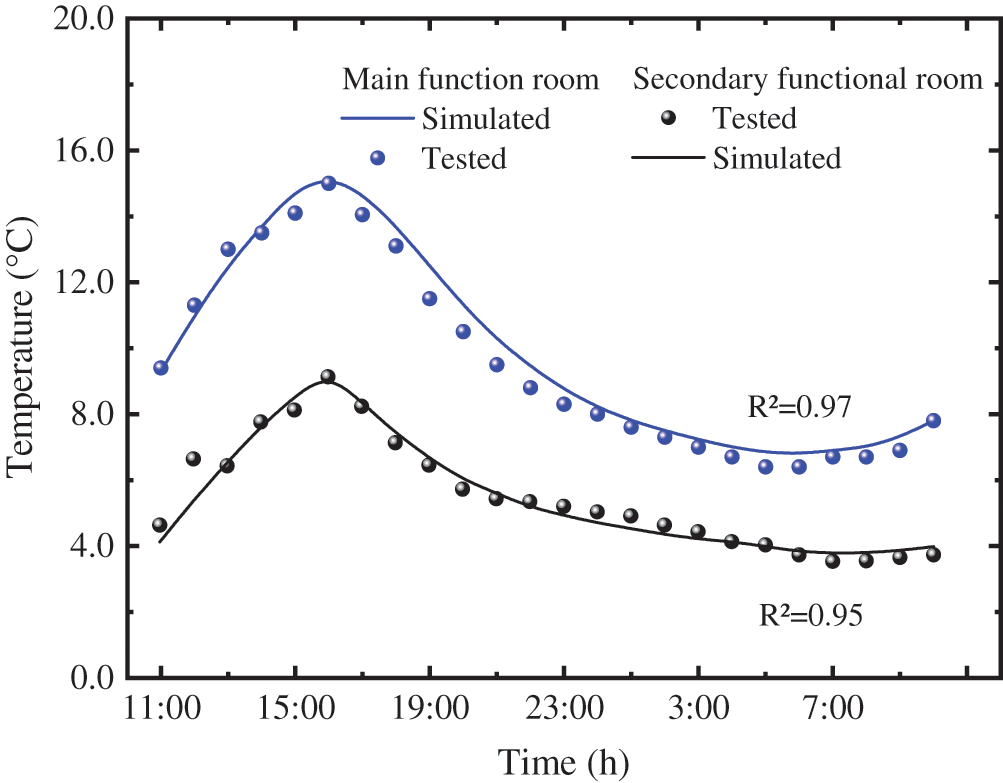
Figure 6: Comparison between measured and simulated results
As shown in Fig. 6, the measured temperature was highly consistent with the simulation temperature. The R-square values of the main and secondary functional rooms were 0.97 and 0.95, respectively. The deviation between the simulated and measured values are likely to have resulted from (1) the objective errors of the data test instruments and (2) the effect of infiltration of cold air during the measurement because of closing or opening of windows and doors. Given these reasons, the error is considered acceptable. Therefore, the numerical model established by DB is considered valid.
During the test, only the bedroom had a simple heating device (coal stove). It was operated from 6:00 am to 10:00 pm. The meteorological data of a sunny day (January 19, 2015) during the test period were selected for analysis in this study.
The variations in indoor and outdoor meteorological parameters during the test are shown in Fig. 7.
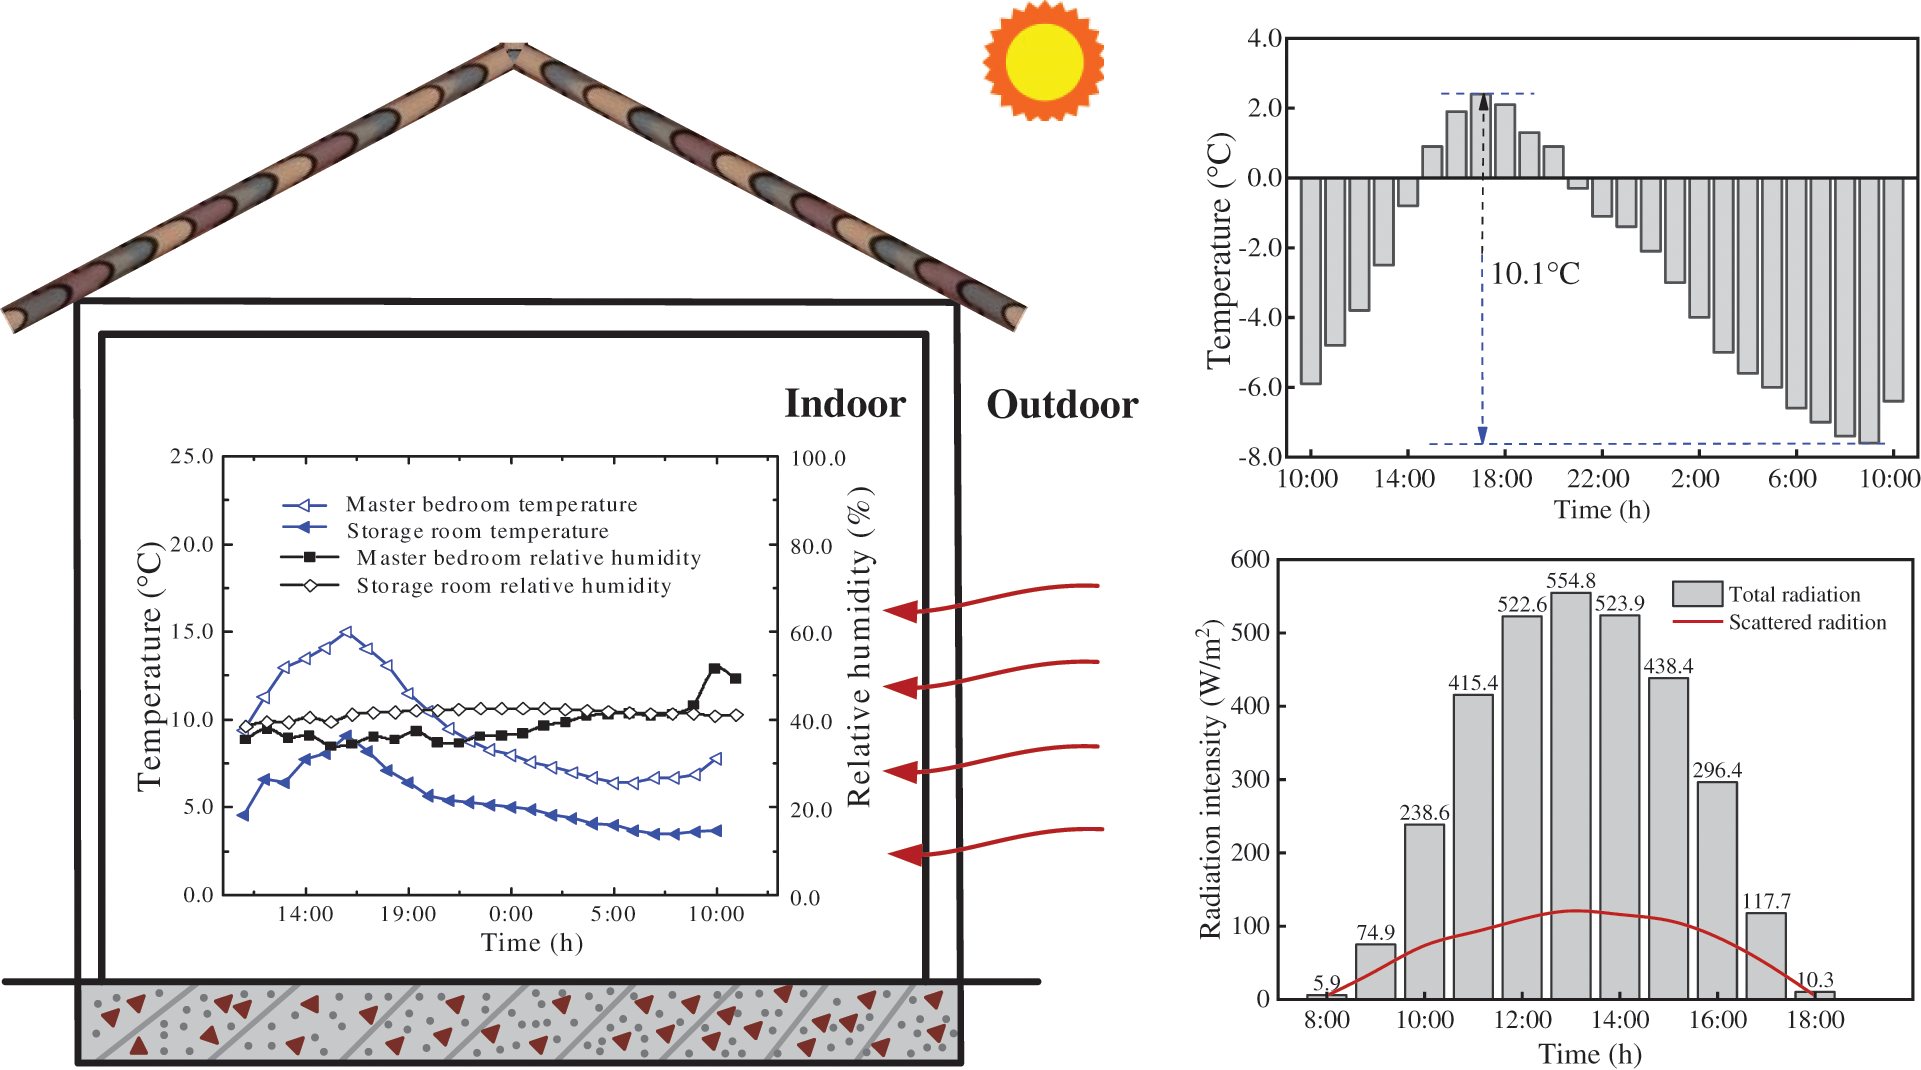
Figure 7: Variations in solar radiation intensity, air temperature, and relative humidity
As shown in Fig. 7, the outdoor temperature showed an increasing trend from 10:00 am to 6:00 pm, and a decreasing trend from 6:00 pm to 10:00 am the next day. The outdoor temperature varied from –7.6°C to 2.5°C, with a temperature fluctuation of 10.1°C and an average temperature of –2.7°C. Additionally, the total solar radiation intensity was 290.8 W/m2 on average. The peak value was 544.8 W/m2, which appeared at approximately 1:00 pm. The average direct radiation intensity was 216.7 W/m2, which accounted for 74.5% of the total radiation intensity. The indoor relative humidity of the main bedroom (main functional room) and storage room (secondary functional room) varied within the ranges 45%–52% and 30%–43%, respectively. This implied that the indoor relative humidity satisfied the thermal comfort demands of the human body [50]. Fig. 7 also shows that the average indoor temperature of main and secondary functional rooms from 6:00 am to 10:00 pm was 10.5°C and 5.8°C, respectively. From 10:00 pm to 6:00 am, the average indoor temperature of the main functional room was 7.3°C. The indoor temperature obtained in this field test is similar to that obtained in the previous study for Northwest China [58,59,60]. That is, the indoor temperature is low, and the temperature varies substantially across functional rooms and usage periods.
In addition, the intermittent test results demonstrated that there was a marginal difference between the indoor mean radiation temperature and indoor air temperature (±0.5°C). The indoor airflow was significantly weak (within 0.1 m/s, which is lower than the human body’s air-flow-perception threshold of 0.2 m/s [7]).
During the data measurement, we also surveyed the indoor heating in winter. The survey showed that most families heated only the bedrooms. Each dwelling consumed approximately 3t of coal through the coal stove during the heating period. When all the rooms were heated, the heating energy consumption would be 2–3 times the present energy consumption.
To sum up, the outdoor temperature was low, and the temperature difference in winter in this area was large. Notwithstanding the high energy consumption for heating, the indoor thermal environment was still not ideal. However, the area was rich in solar energy resources. Given this, passive solar buildings can be developed according to local conditions.
3.2 Residents’ Differentiated Demands for Indoor Thermal Comfort
The determination of indoor comfort temperature index was influenced by the regional climate, residents’ behavior habits, psychological activities, etc. [61].
Using a research method that differentiates functional rooms and usage periods, a detailed investigation was carried out on the clothing conditions of rural residents in Northwest China in winter. Further, the thermal resistance of residents’ clothing during the activity period was obtained according to the ASHRAE Standard 55-2013. The results are presented in Fig. 8.
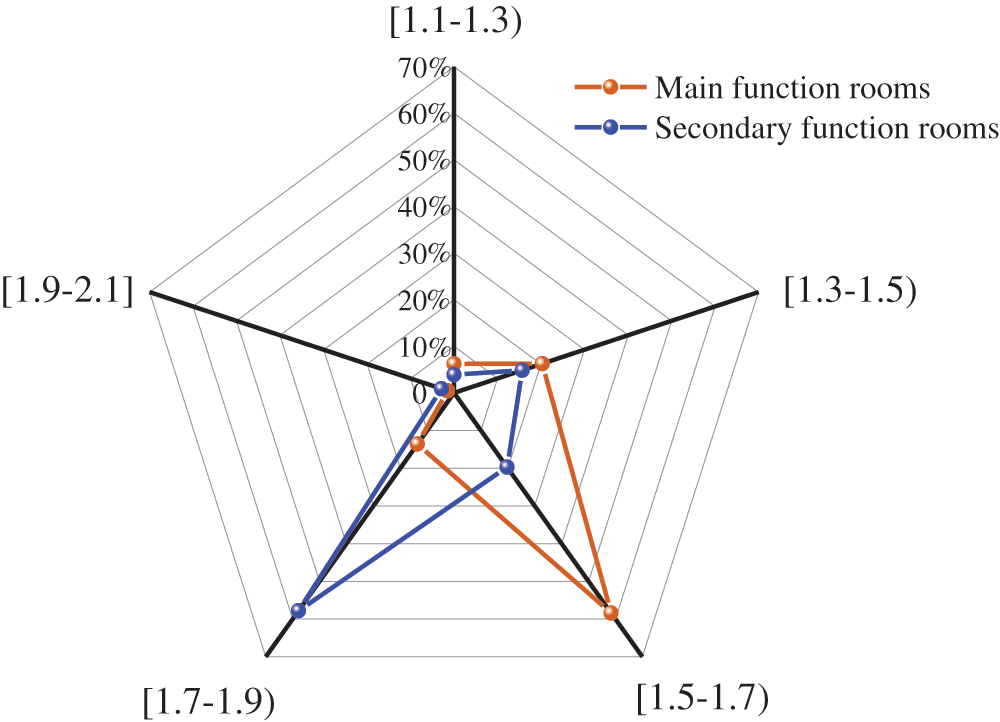
Figure 8: Distribution ratio of the thermal resistance of residents’ clothing during the activity period
Fig. 8 illustrates that the clothing thermal resistance of residents in the main functional rooms was in the range of 1.5 to 1.7 clo (58.4%), with an average value of 1.6 clo. The clothing thermal resistance in the secondary functional rooms was in the range of 1.7 to 1.9 clo (57.8%), with an average of 1.8 clo. The main reason for this difference is that the region belongs to the cold region, where indoor heating is required in winter. However, most rural dwellings heat only the main functional rooms owing to economic constraints. Consequently, residents need to wear a thick coat as additional clothing whenever they enter the secondary functional rooms. Furthermore, the thermal resistance of clothing obtained in this study is significantly higher than the 0.9 clo specified by ASHRAE Standard 55-2013. The main reason is that the indoor thermal environment in winter is not ideal, and the economic capability of local residents to improve the thermal environment is weak. Therefore, local residents need to wear more clothes to ensure their thermal comfort.
In addition, the survey found that during the nighttime sleep period, the local rural residents were used to wearing pajamas and covering thick quilts. The thermal resistance of pajamas and thick quilts were 0.38 clo and 2.86 clo, respectively [49,62].
In summary, the thermal resistance of winter clothing of rural residents in Northwest China was large. Besides, the thermal resistance of residents’ clothing varies significantly across functional rooms. The residents’ demand for thermal resistance varies substantially across usage periods.
The activity rate of residents in a room is defined as the number of residents in the room as a percentage of the total number of individuals in all the rooms. The activity rate of residents in different functional rooms was investigated at intervals of 1 h. The activity rate of residents in different functional rooms during the activity period is presented in Fig. 9.
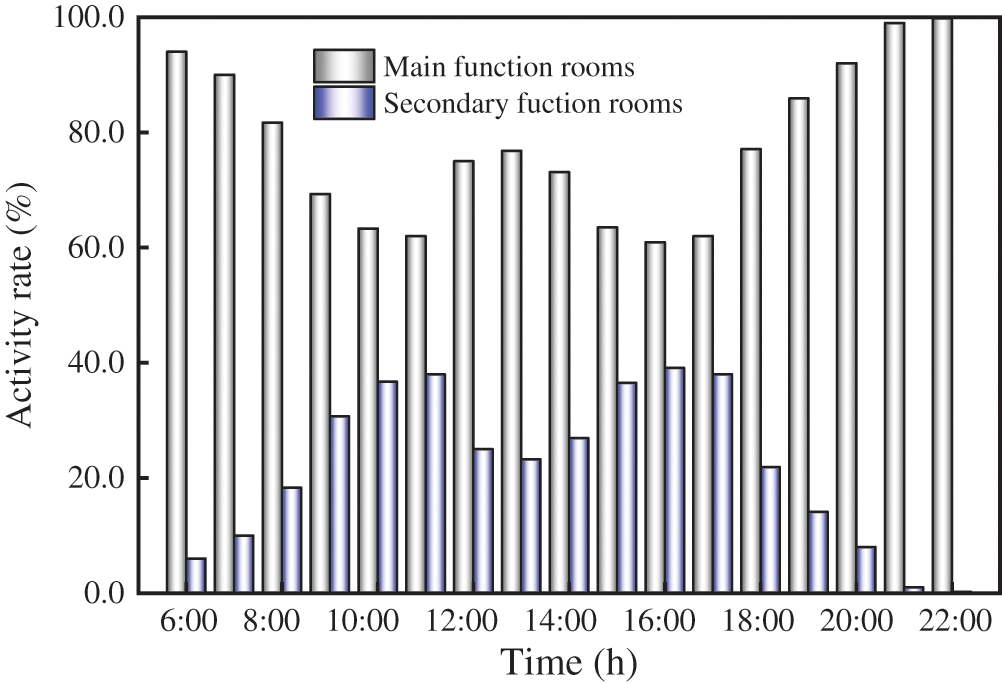
Figure 9: Activity rate of residents in the rooms during the activity period
Fig. 9 indicates that the activity rate for the main functional rooms during the activity period (from 6:00 am to 10:00 pm) showed a decreasing–increasing–decreasing–increasing trend with an average value of 78%. Correspondingly, the activity rate for the secondary functional rooms showed an increasing–decreasing–increasing–decreasing trend, with an average value of 22%.
Moreover, the survey found that during the sleep period (from 10:00 pm to 6:00 am the next day), only the main functional rooms constituted the activity space of the local rural residents. Accordingly, the residents’ demands for indoor thermal comfort of secondary functional rooms at night are not discussed in the subsequent analysis. Referring to the ASHRAE Standard 55-2013, the metabolic rate of residents during sleep at night was 45 W/m2. The survey also found that the local rural residents were in the period of agricultural leisure during winter. During the activity period, the activities of the residents in the main functional rooms were watching TV, chatting, and sleeping for brief periods, whereas those of the residents in the secondary activity rooms were cooking, sewing, knitting, and maintenance. The metabolic rate of residents in main and secondary functional rooms was 85 W/m2 and 95 W/m2, respectively, according to the ASHRAE Standard 55-2013.
To summarize, the activity rate of the same functional room varied across usage periods. Furthermore, the activity rates of different functional rooms varied across the same usage periods.
The temperature was grouped with 0.5°C as the group distance. For each temperature group, the thermal acceptance rate (the ratio of the number of residents with voting values of –1 to +1 as a percentage of the total number of voters) was calculated. Finally, a polynomial fit was performed on the thermal acceptance rate and indoor air temperature. The fitting results are shown in Figs. 10 and 11.
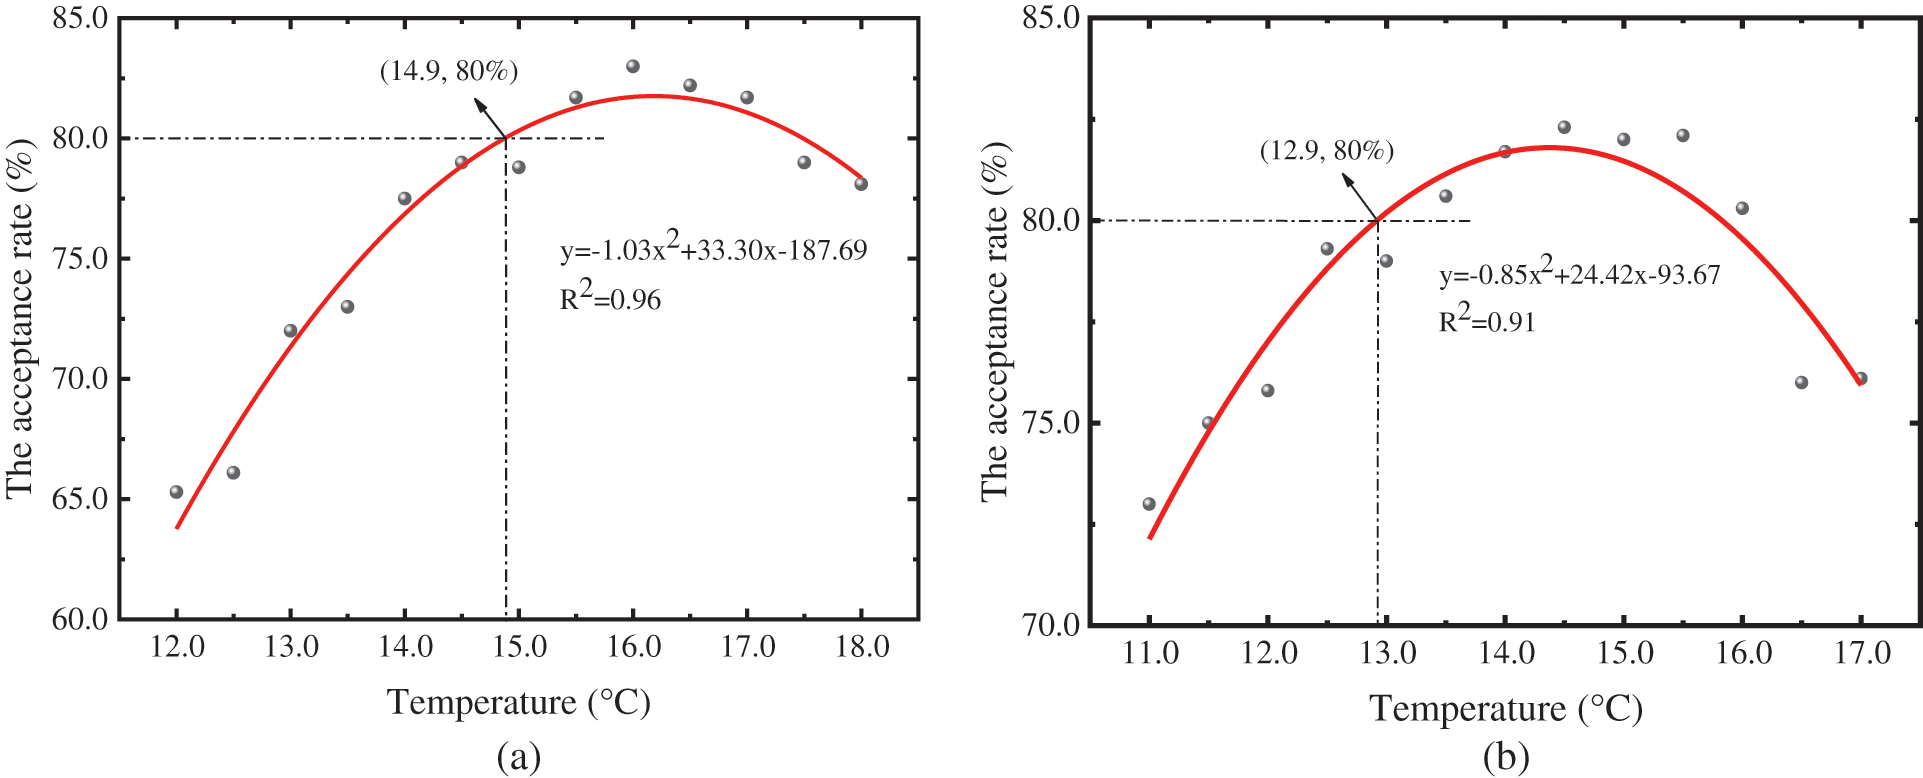
Figure 10: Acceptance temperature of main functional rooms. (a) The activity period; (b) The sleep period
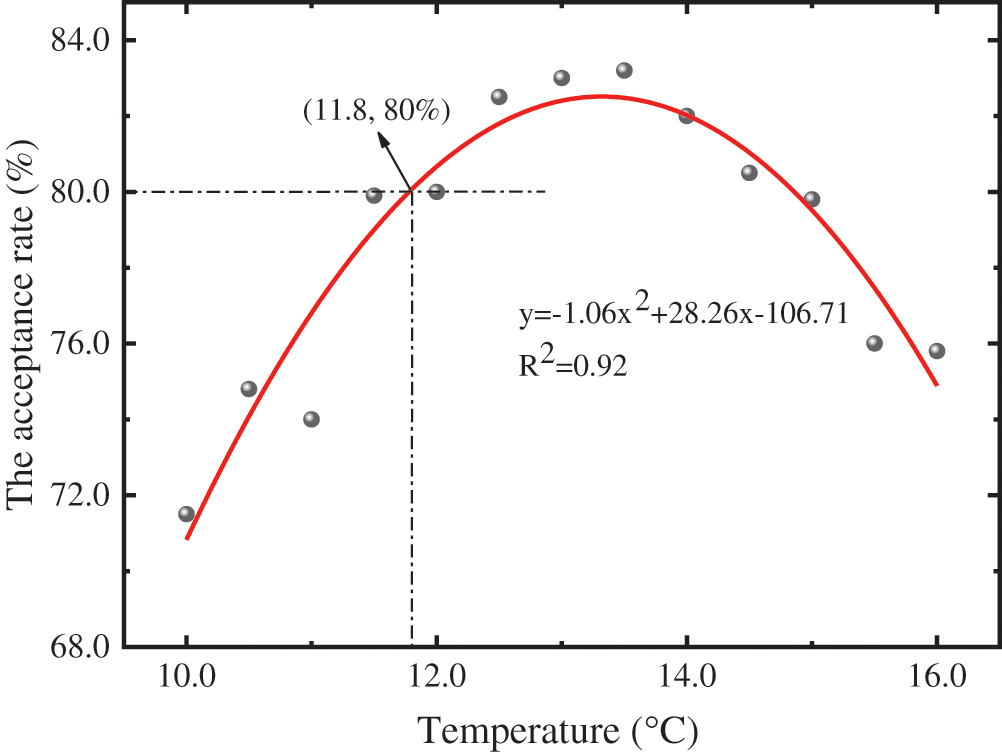
Figure 11: Acceptance temperature of the secondary functional rooms
The acceptance rate of 80% of residents is regarded as the acceptable range of thermal environment [49,50,63]. Fig. 10 shows that the lower limits of the acceptance temperature for the main functional rooms in winter during the activity period and sleep period were 14.9°C and 12.9°C, respectively. Fig. 11 shows that the lower limit of the acceptable temperature for the secondary functional room during the activity period was 11.8°C. Evidently, the acceptance temperature varied across functional rooms and usage periods.
First, the temperature was grouped within 0.5°C as the group difference. Second, the percentage of people who expect the environment to be hotter or colder than the current environment was counted, and linear regression was performed with the air temperature, respectively. The results are shown in Figs. 12 and 13.
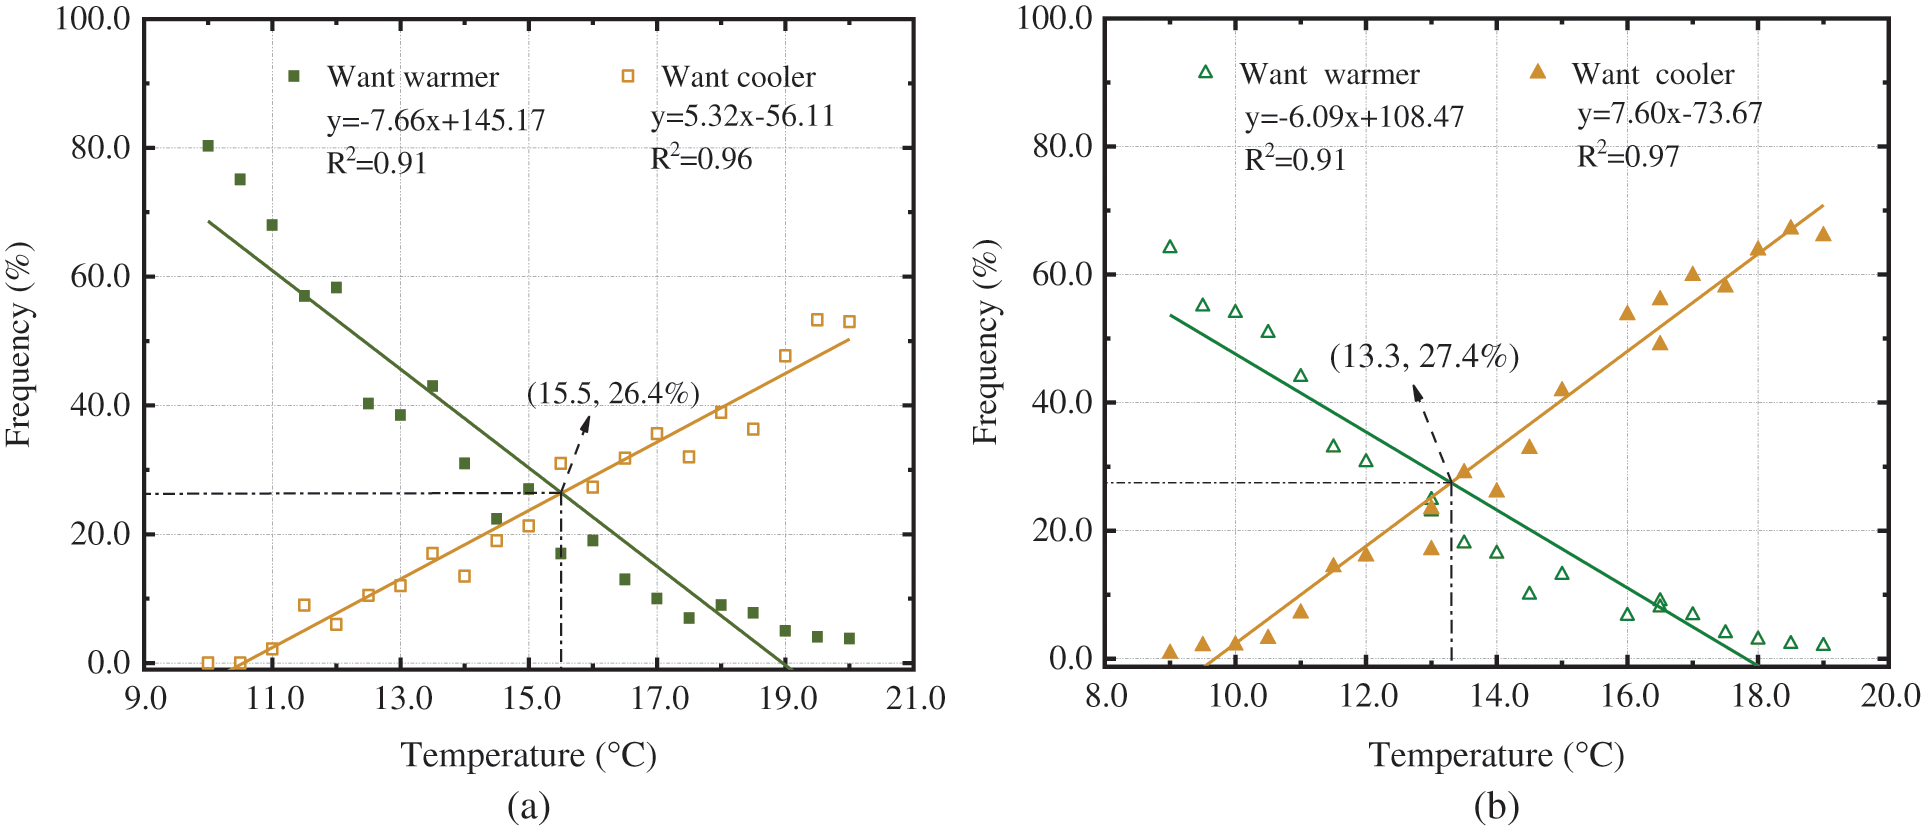
Figure 12: Preferred temperature of the main functional rooms. (a) The activity period; (b) The sleep period
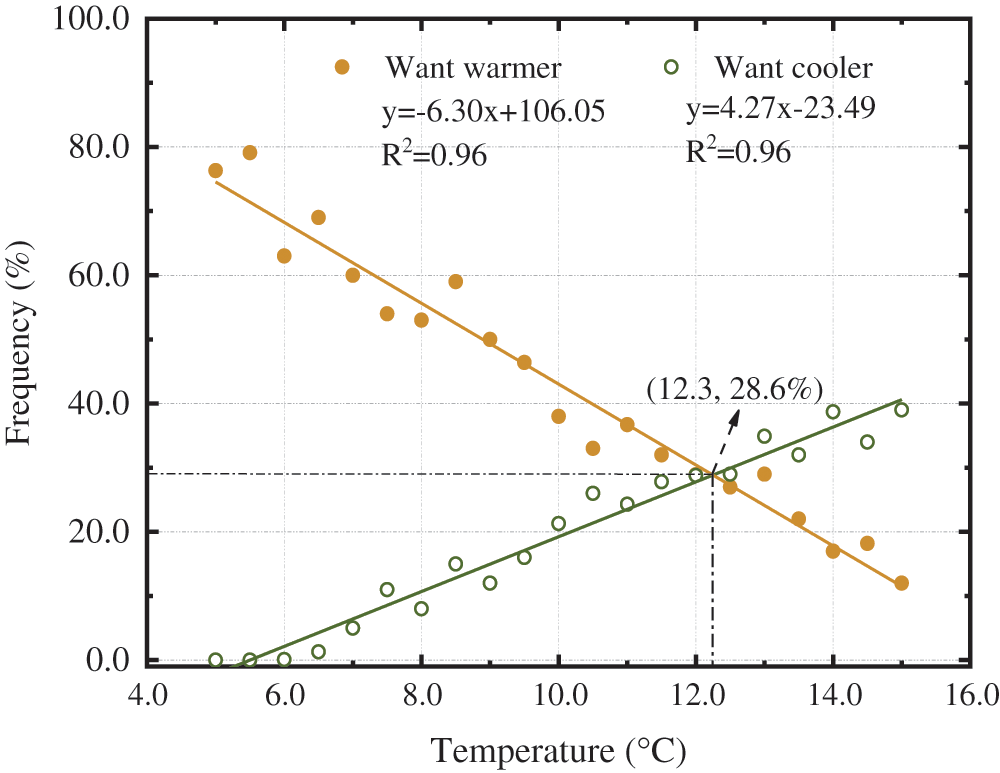
Figure 13: Preferred temperature of the secondary functional rooms
Fig. 12 shows that the preferred temperature for the main functional rooms during the activity and sleep periods were 15.5°C and 13.3°C, respectively. The difference in preferred temperature between these two periods was 2.2°C. Fig. 13 displays that the preferred temperature for the secondary functional rooms during the activity period was 12.3°C. Based on the above analysis, the preferred temperature of the same functional room varied across usage periods. Furthermore, the preferred temperature differs across functional rooms for the same usage period.
3.3 Determination of Thermal Comfort Indexes
The thermal comfort demands of the local rural residents varied across functional rooms during the same period. Besides, the thermal comfort demands of the same functional room varied across usage periods. Thus, the indoor thermal comfort evaluation indexes based on residents' differentiated thermal demand should be explored.
The widely used indoor thermal comfort evaluation indexes are Operative Temperature (Top), Standard Effective Temperature (SET*), Predicted Mean Vote (PMV), and Subjective Temperature (Tsub). Top was proposed as an indoor thermal comfort evaluation index based on the apparent heat transfer between the surrounding environment and human body by convection and radiation [64]. The greater the indoor air velocity, the closer is the operating temperature to the air temperature. However, the indoor air velocity of rural dwellings in winter is generally significantly low. This implies that there is a limitation to the use of Top as an indoor thermal comfort evaluation index. The SET* was put forward as an indoor thermal comfort evaluation index based on a dynamic two-node model of the human temperature regulation [65]. It is perfect as an evaluation index. However, the difficulty of calculating skin temperature and wettability hinders the acquisition of SET* [35]. Fanger [66] recommended the use of PMV-PPD to evaluate indoor thermal comfort. This index integrates a variety of factors that affect human thermal comfort, wherefore it is considered to be a fairly comprehensive evaluation index. However, many scholars consider that it is difficult for most rural dwellings in China to achieve the standard of PMV = –0.5 to 0.5 [7]. McIntyre [67] recommended the use of Tsub as an evaluation index of indoor thermal comfort. Tsub was defined as the temperature of the standard environment when the subjective thermal sensation of a person in a certain actual environment was the same as in the standard environment. This implies that the Tsub can be used to guide the evaluation and design of indoor thermal environments. The standard environment was a uniform enclosed space with Ta = Tr, v = 0.1 m/s, relative humidity of 50%, and air temperature equal to the mean radiation temperature [49].
Based on the above analysis, it is considered that Tsub was effective and feasible as an indoor thermal environment evaluation index. It can be calculated using Eq. (20) [49].
where Tsub is the subjective temperature (°C), Rclo is the total clothing thermal resistance (clo), and M is the metabolic rate (%).
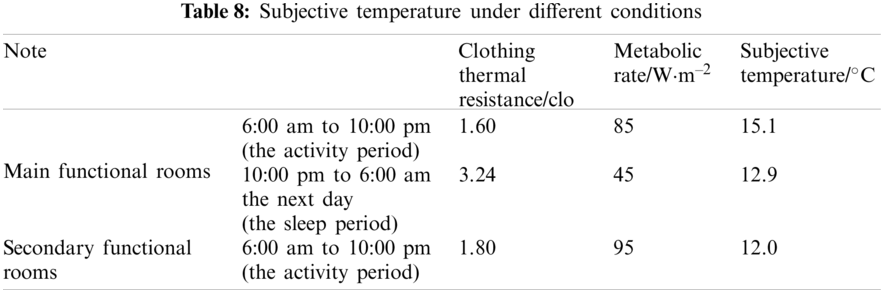
The Tsub under different conditions was obtained based on Section 3.2 and Eq. (20). The results are listed in Table 8.
Table 8 demonstrates that the comfort temperature of the main functional rooms during the activity period (6:00 am to 10:00 pm) was 15.1°C. The comfort temperature during the sleep period (10:00 pm to 6:00 am the next day) was 12.9°C. The comfortable temperature of the secondary functional rooms during the activity period was 12.0°C.
Meanwhile, the comfort temperature was estimated using Griffiths’ method, as shown in Eq. (21) [68,69]. The results are shown in Table 9.
where Tc is comfort temperature (°C), Ti is indoor air temperature (°C), 0 is ‘neutral’ thermal sensation vote, and ɑ is Griffiths constant, with a value of 0.5 [32,68].
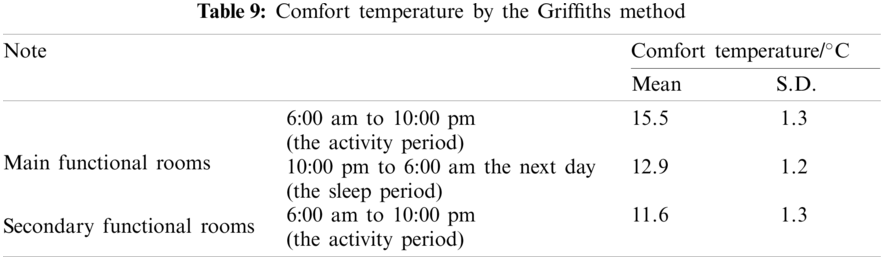
A comparison of Tables 8 and 9 shows that the thermal comfort temperature indexes calculated by subjective temperature are basically consistent with those estimated by Griffiths’ method. Therefore, it is considered that the comfort temperature obtained by subjective temperature is reliable and valid.
This study aims to develop a comfortable and energy-efficient indoor thermal environment. Given this, this study proposes that during the activity period (from 6:00 am to 10:00 pm), the average indoor temperature of the main and secondary functional rooms should be at least 15°C and 12°C, respectively. During the sleep period (from 10:00 pm to 6:00 am the next day), the average indoor temperature of the main functional rooms should be at least 13°C.
A comparison of the thermal comfort temperature indexes proposed in this study with the results of previous studies in Northwest China, it is found that the temperature range of the thermal comfort indexes is basically consistent [70–72]. However, many studies have shown that the indoor comfort temperature varies with the functional rooms and usage periods, but this difference has not been taken into account in previous studies. The studies would have been more interesting if these had involved the exploration of indoor comfort temperature indicators that matched the functional rooms and usage periods.
3.4.1 Comparison of Indoor Temperature before and after Adoption of Optimized Combination Scheme
There was no heating source in the room during the numerical simulation. Comparison of indoor temperature before and after optimization. The results are presented in Table 10.
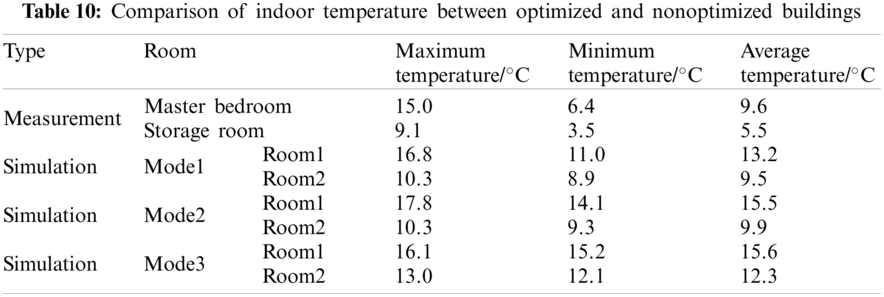
Table 10 shows that the average indoor temperature of the main and secondary functional rooms in the optimized building was higher than the measured indoor temperature by at least 3.6°C and 4.0°C, respectively. Table 10 shows that compared with the measured indoor temperature, the average indoor temperature of the main and secondary functional rooms in the optimized building was increased, at least by 3.6°C and 4.0°C, respectively. The temperature fluctuation was reduced by at least 32.6% and 75.0%, respectively. Evidently, the average indoor temperature of the building with the passive optimized combination scheme was increased significantly, and temperature fluctuation was decreased dramatically without an increase in energy consumption.
3.4.2 Suitability of Passive Solar Heating Technology
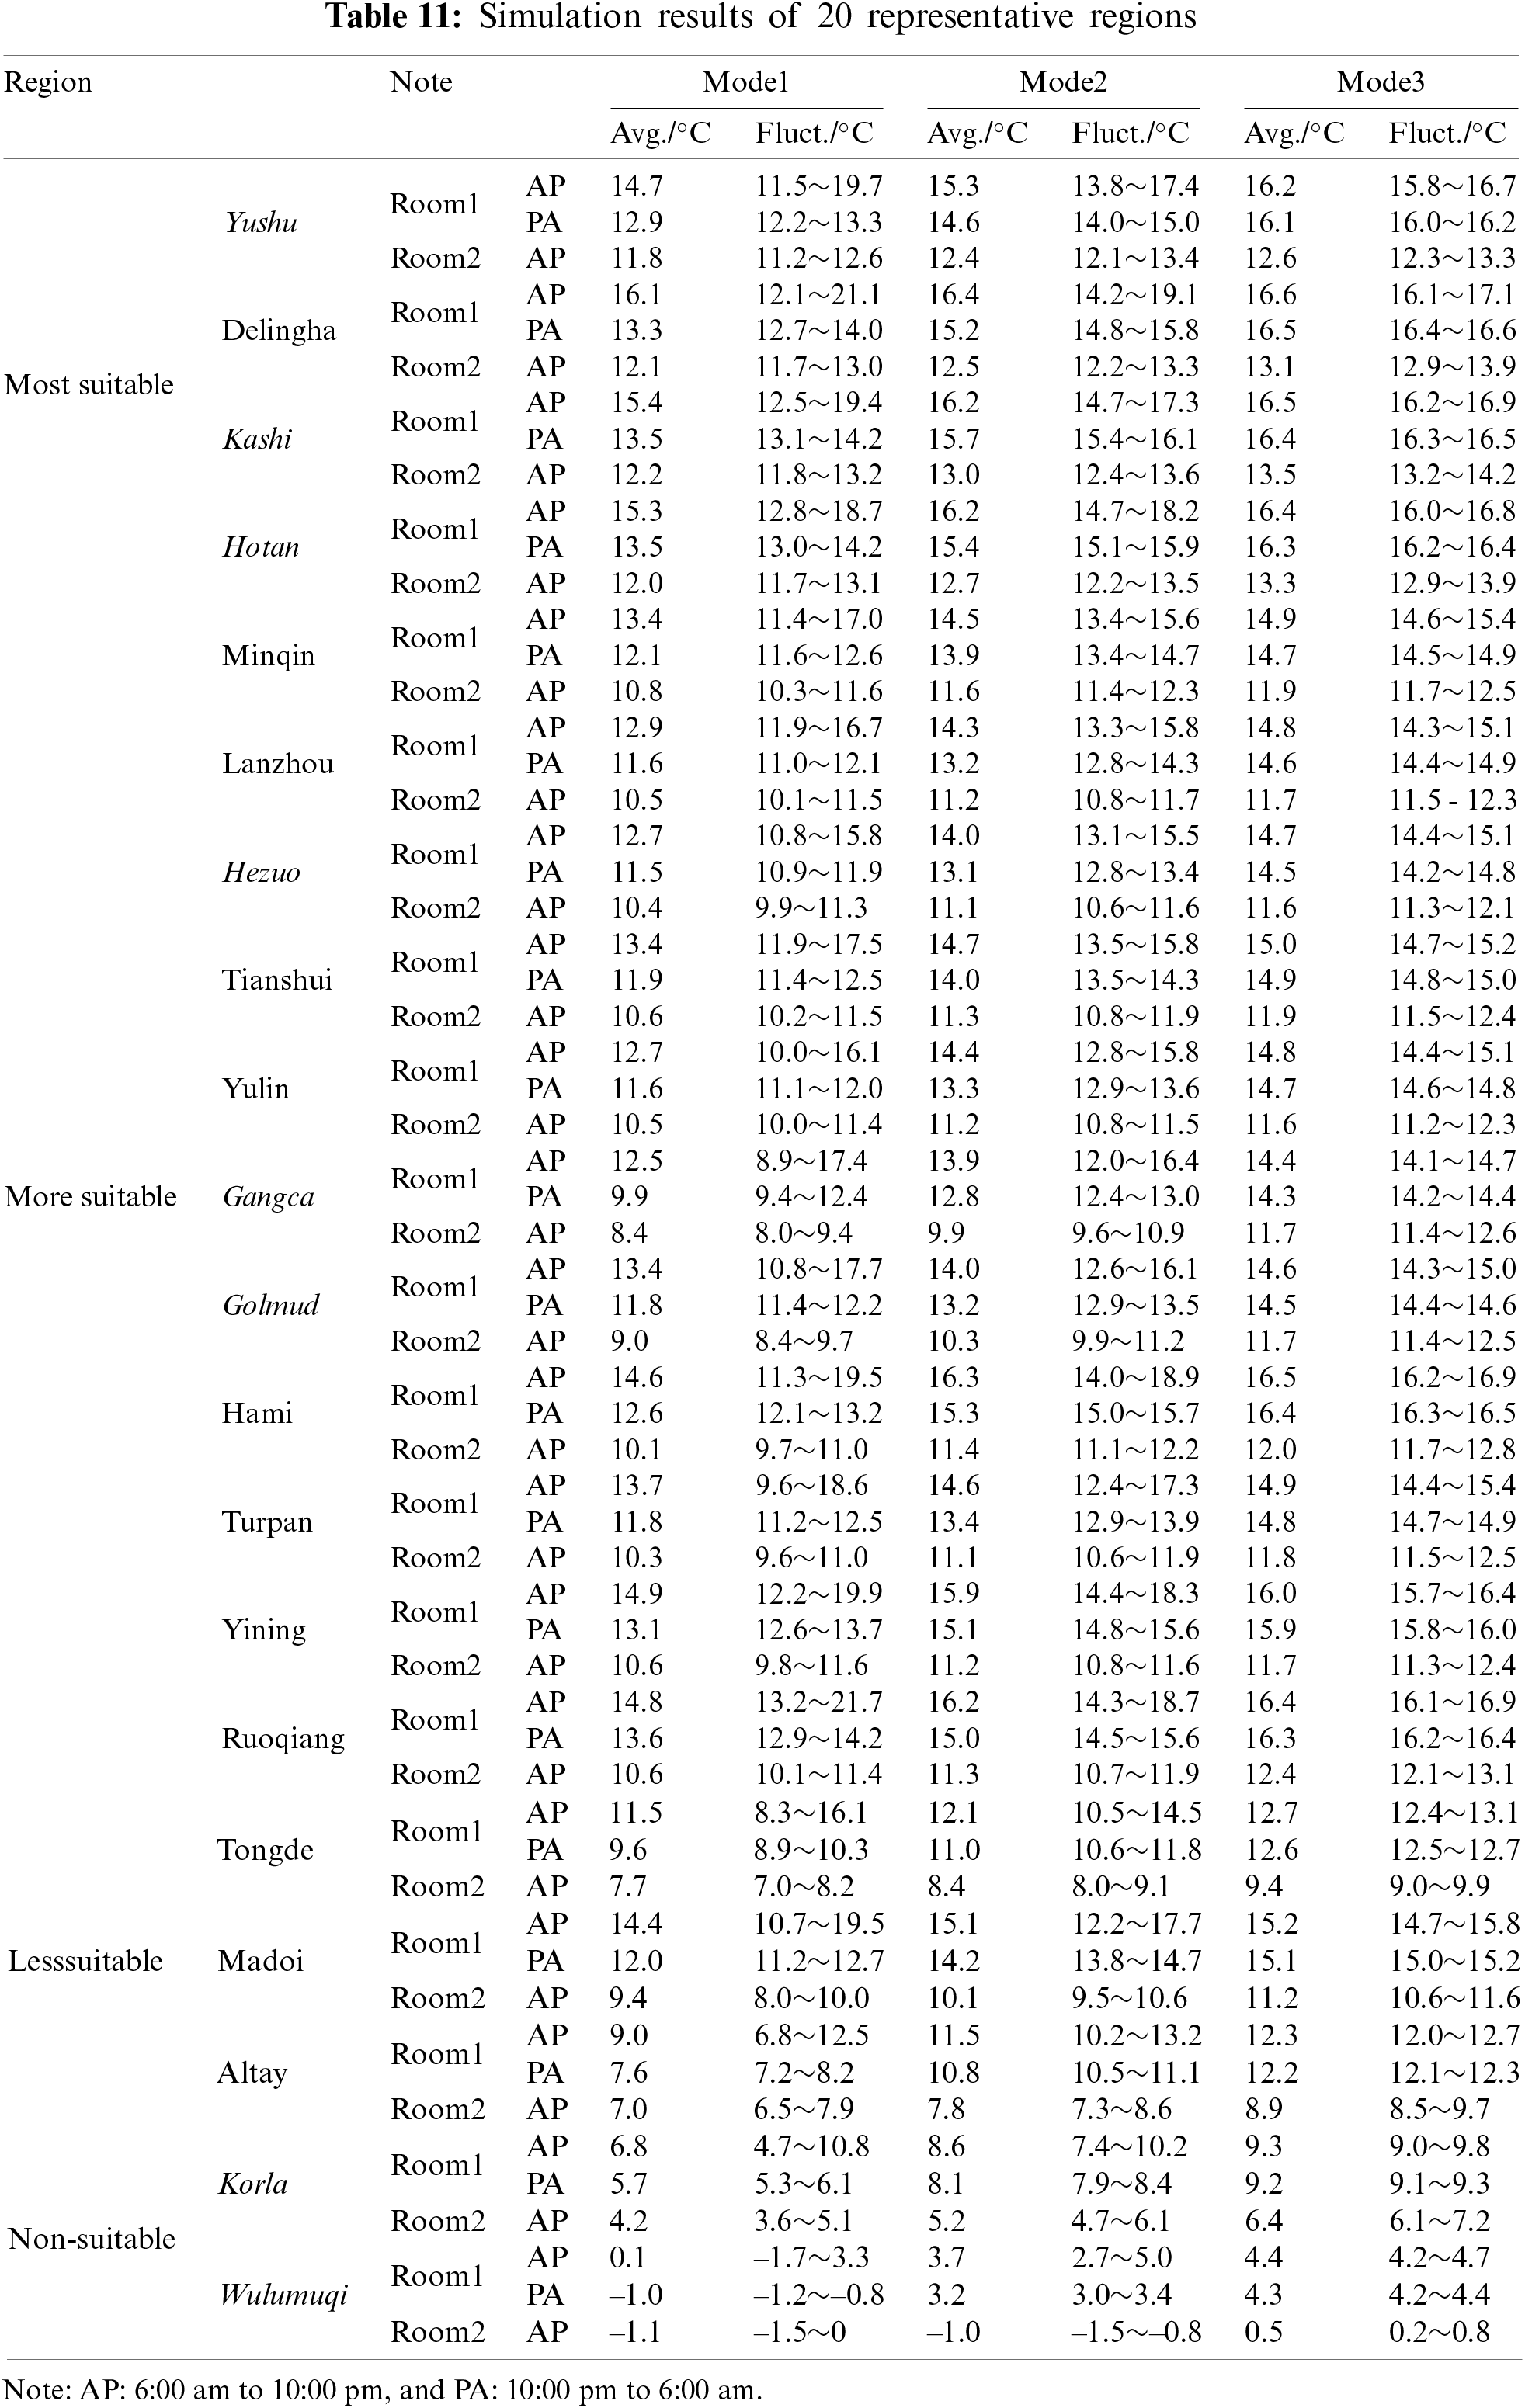
For brevity, the simulation results of 8 typical regions are expounded. The simulation results of the other 20 representative regions are listed in Table 11.
Most suitable region: Dunhuang and Jiuquan are located in the I-Cold and I-Severe Cold regions, respectively, which are extremely rich in solar energy resources. Longnan is located in the II-HSCW region, where the average outdoor temperature on the winter solstice day is 6.4°C. Although the solar radiation intensity in Longnan is marginally lower than that in Dunhuang and Jiuquan, its average outdoor temperature is significantly higher than that of Dunhuang and Jiuquan.
As shown in Fig. 14, the indoor temperature of the three types of passive solar houses could satisfy the thermal comfort standard proposed by this research. During the activity period (from 6:00 am to 10:00 pm), the average indoor temperature of the main and secondary functional rooms was at least 15°C and 12°C, respectively. During the sleeping period (10:00 pm to 6:00 am the next day), the average indoor temperature of the main functional rooms was at least 13°C. Owing to the buffering effect provided by the attached sunspace, the temperature fluctuation in the room with attached sunspace is significantly smaller than that in the room with Trombe wall + direct-gain window or direct-gain window. Prior studies have also shown that the indoor thermal comfort of passive solar houses is affected not only by the average temperature, but also by temperature fluctuation [19,20,73]. Therefore, it is strongly recommended to adopt passive solar heating technology in these regions. The passive solar house with attached sunspace is preferred by designers. The other two types of passive houses are available as alternatives.
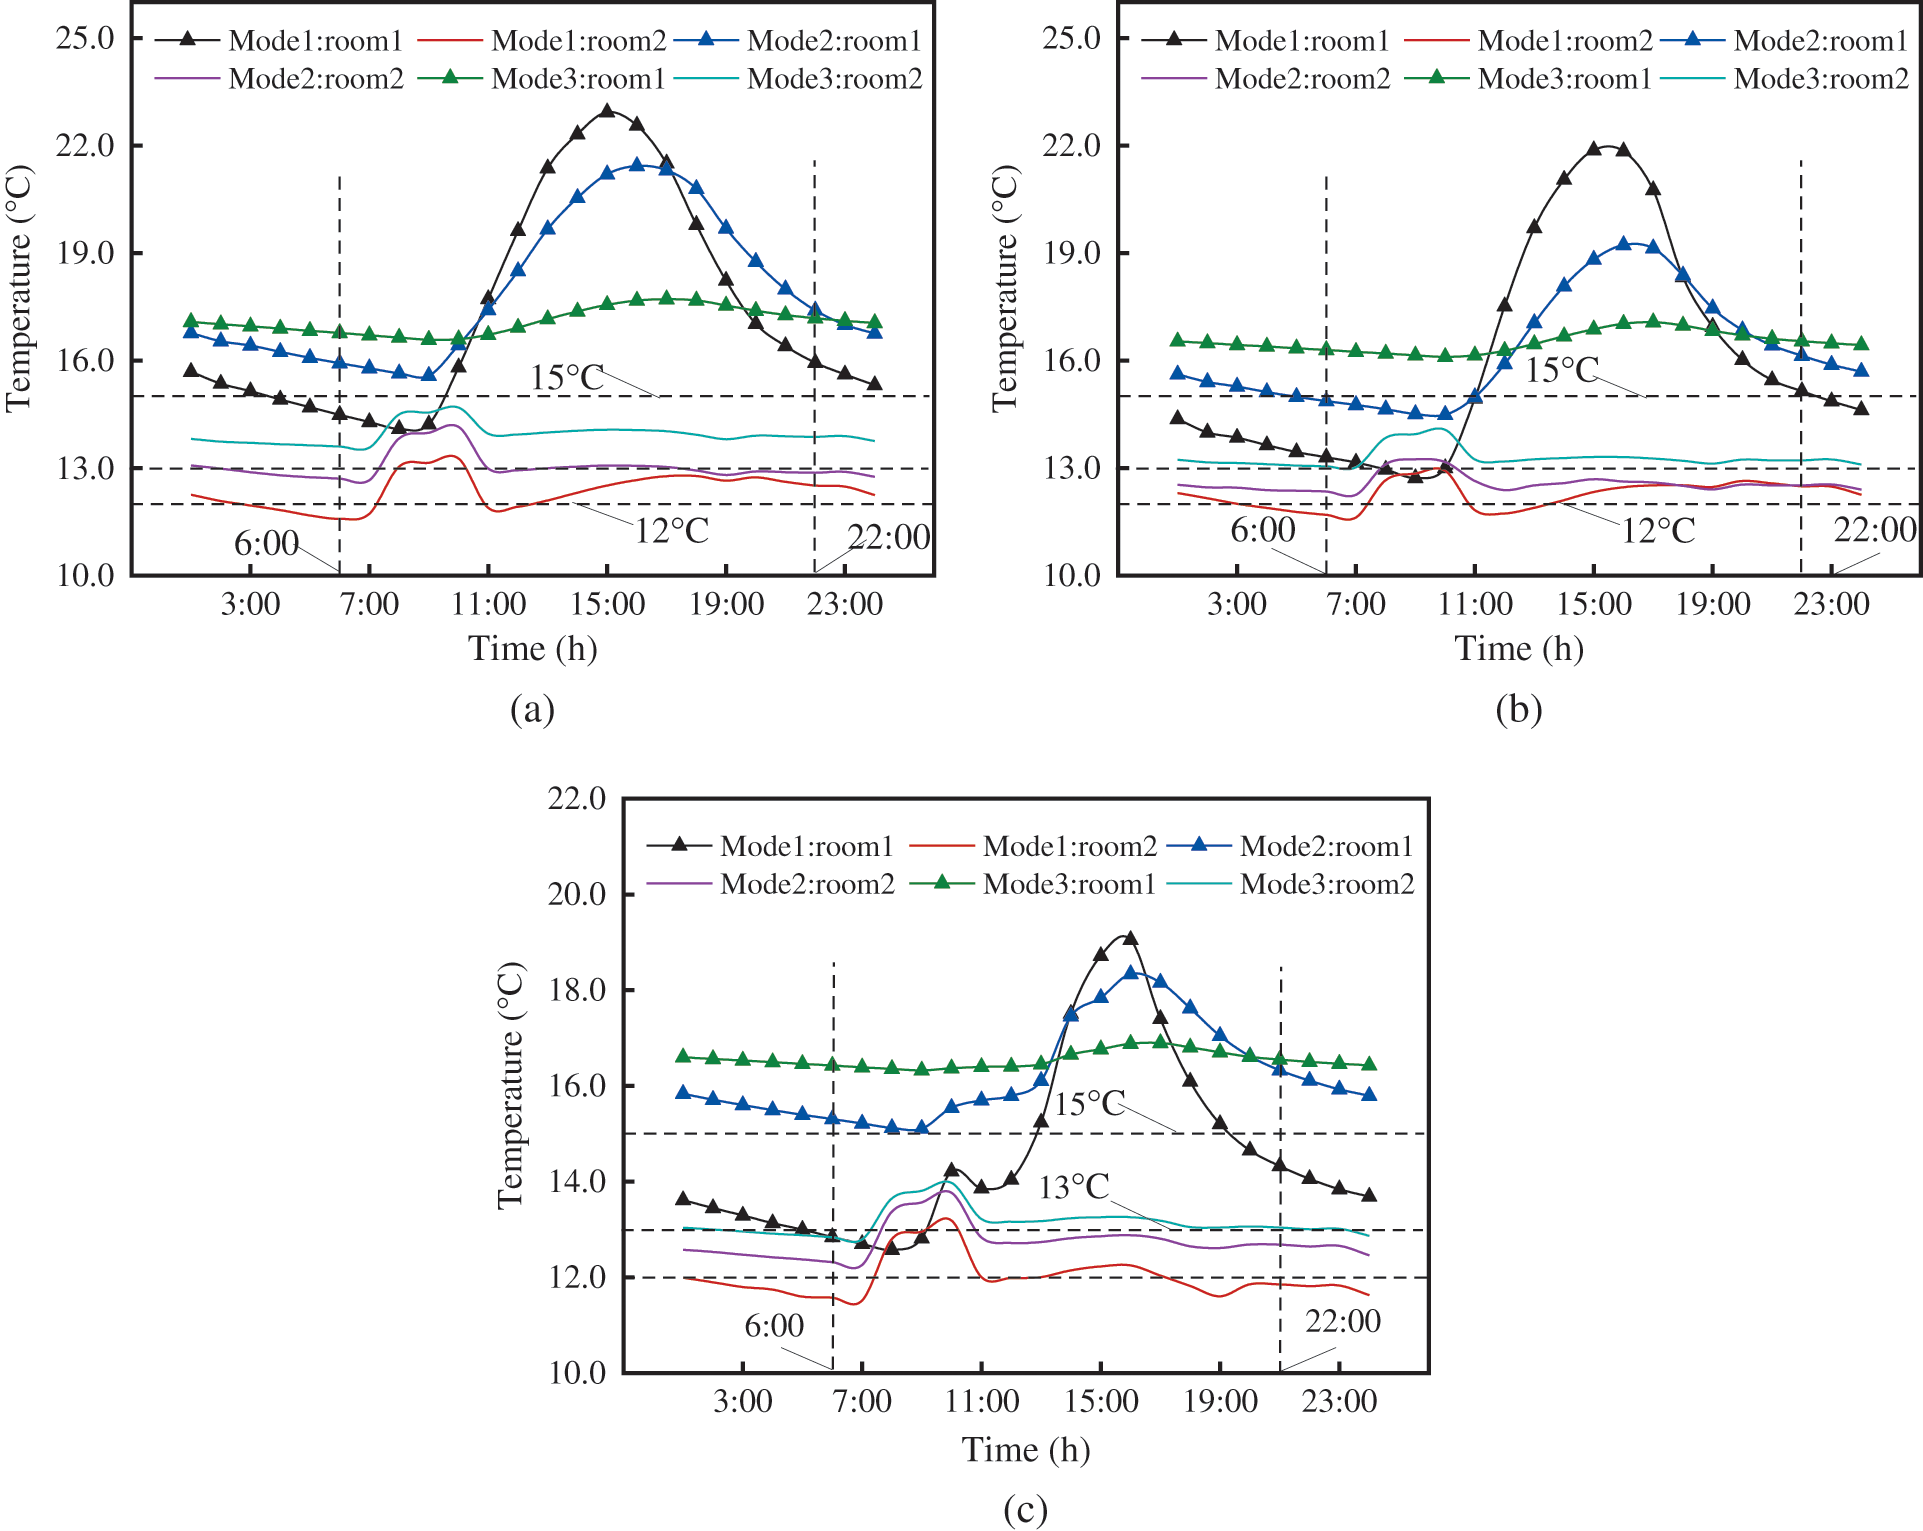
Figure 14: Indoor temperature curves of different passive solar houses. (a) Dunhuang; (b) Jiuquan; (c) Longnan
More suitable region: Yinchuan is located in the II-Cold region, which is rich in solar energy resources. The average outdoor temperature on the winter solstice day is –4.0°C.
Fig. 15 demonstrates that only the passive solar house with attached sunspace could satisfy the requirement that the average indoor temperature of the main and secondary functional rooms from 6:00 am to 10:00 pm was at least 15°C and 12°C, respectively. The average indoor temperature of the main functional rooms from 10:00 pm to 6:00 am the next day was at least 13°C. If the passive solar house with direct-gain window or Trombe wall + direct-gain window is adopted, auxiliary heating should be provided to the room, especially for the passive solar house with the direct-gain window. Thus, it is recommended to adopt passive solar heating technology in this region, and the design scheme of the passive solar house design with attached sunspace should be selected.
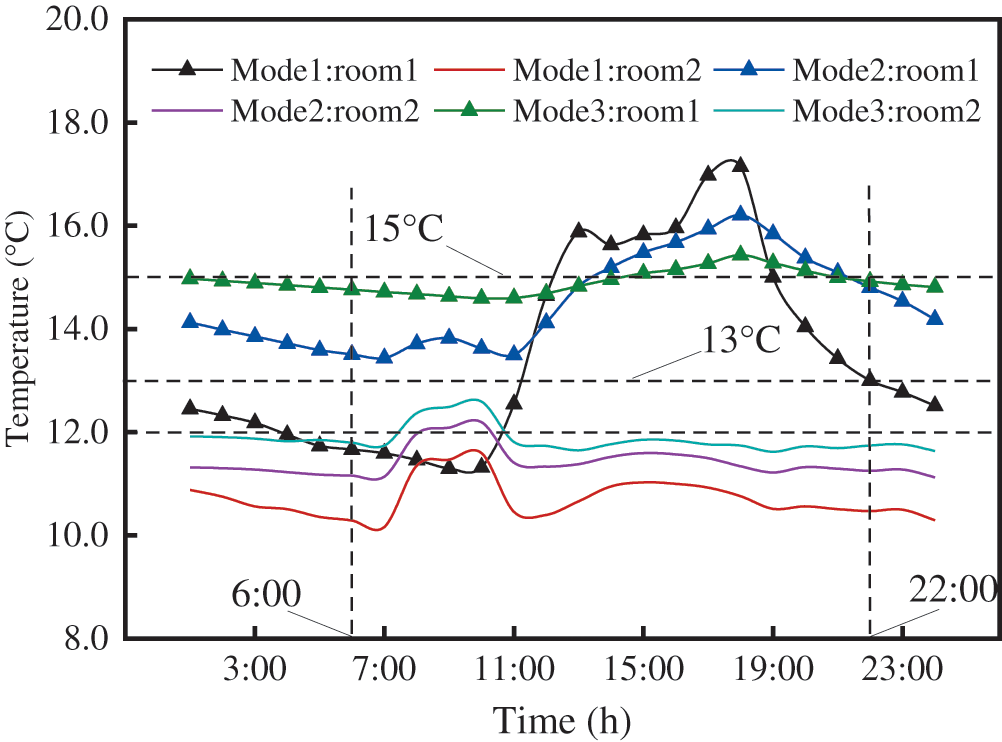
Figure 15: Indoor temperature curves of different passive solar houses in Yinchuan
Less suitable region: Xining is located in the II-Severe Cold region, where the average outdoor temperature on the winter solstice day is –6.9°C. The region has abundant solar energy resources. Xi’an is located in the III-Cold region. The average outdoor temperature on the winter solstice day is 1.6°C, which is marginally higher than that in Xining. However, the level of solar energy resources here is lower than that in Xining. Hanzhong is located in the III-HSCW region. The average outdoor temperature on the winter solstice day is higher, with a value of 5.3°C.
Fig. 16 illustrates that the indoor temperature of the passive solar house with attached sunspace was higher than that of the passive solar house with Trombe wall + direct-gain window or direct-gain window. However, no matter the type of passive solar house was considered, an individual passive heating technology could not satisfy the indoor thermal comfort demands of rural residents in Northwest China. That is, it could not satisfy the demand that the average indoor temperature of the main and secondary functional rooms from 6:00 am to 10:00 pm was at least 15°C and 12°C, respectively. The average indoor temperature of the main functional rooms from 10:00 pm to 6:00 am the next day was at least 13°C. However, the solar energy resources in these regions have a relatively high potential for application. Thus, it is recommended that these regions develop passive solar heating technology to the extent feasible. To satisfy indoor thermal comfort standards, active solar heating technology may be adopted on the basis of the development of passive solar heating technology.
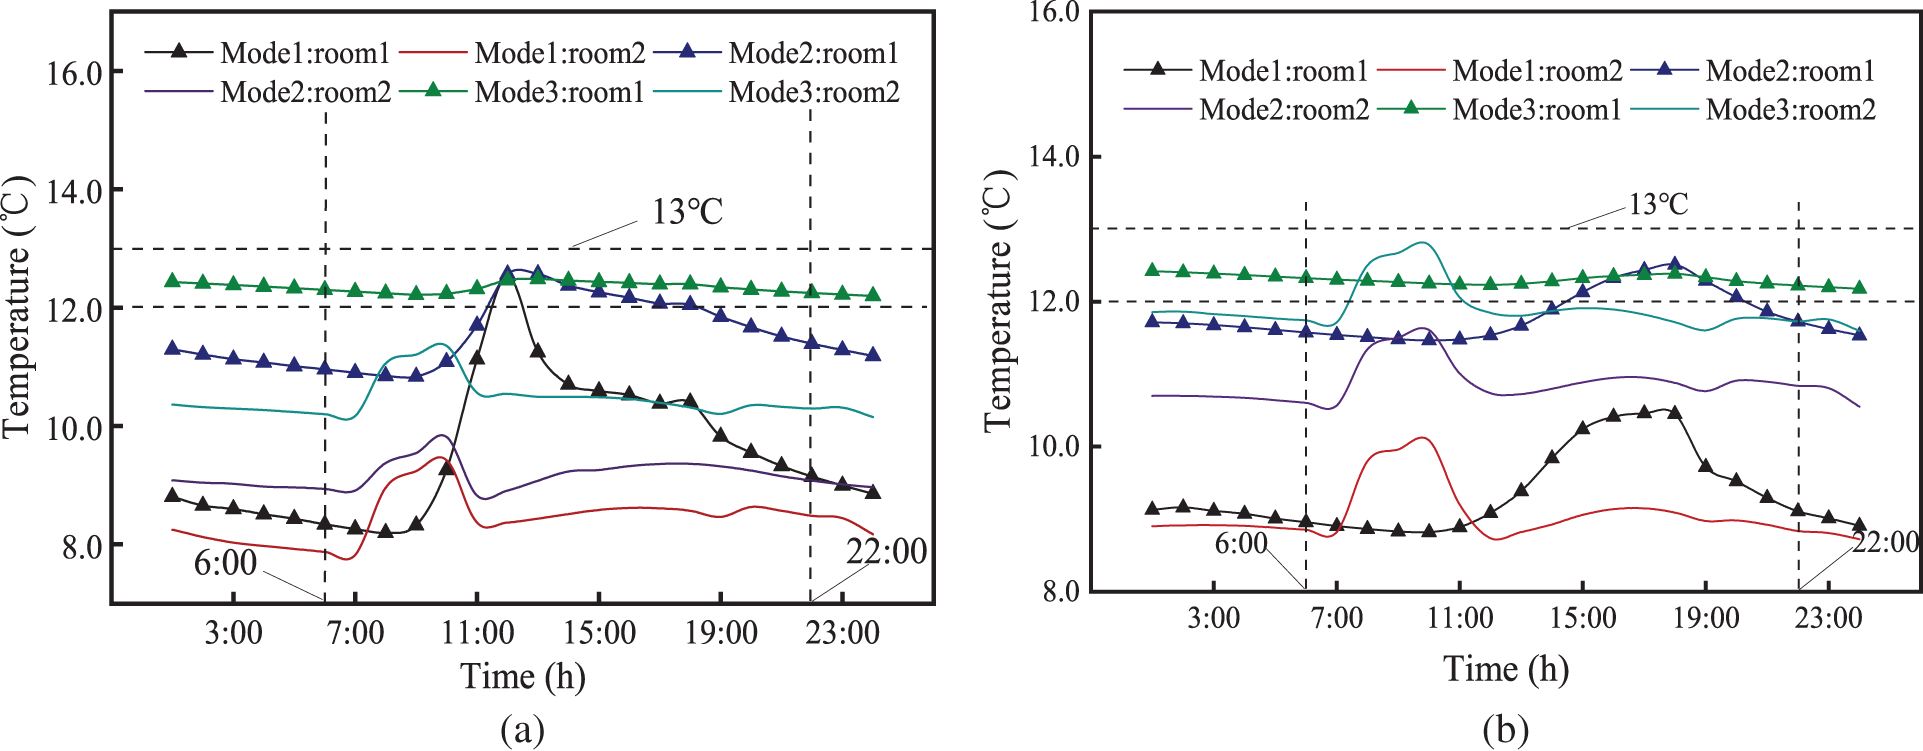
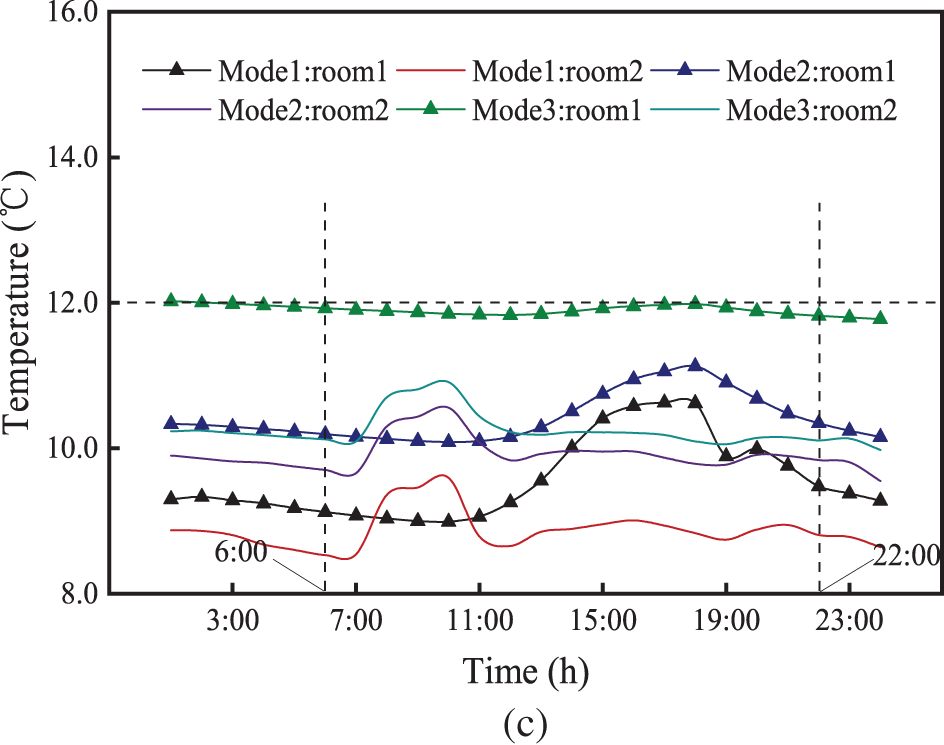
Figure 16: Indoor temperature of different passive solar houses. (a) Xining; (b) Xian; (c) Hanzhong
Unsuitable region: Karamay is located in the III-Severe Cold region. The average outdoor temperature on the winter solstice day is exceptionally low with –12.1°C.
Fig. 17 indicates that regardless of the type of passive solar room design adopted in this study, the indoor temperature cannot satisfy the requirement of at least 12°C. In fact, all the types of passive solar house in this study are far from satisfying this requirement, including the passive solar house with attached sunspace. The main reason is the low outdoor temperature and solar radiation intensity in this region. To summarize, active solar heating technology can be considered for this region to achieve indoor thermal comfort.
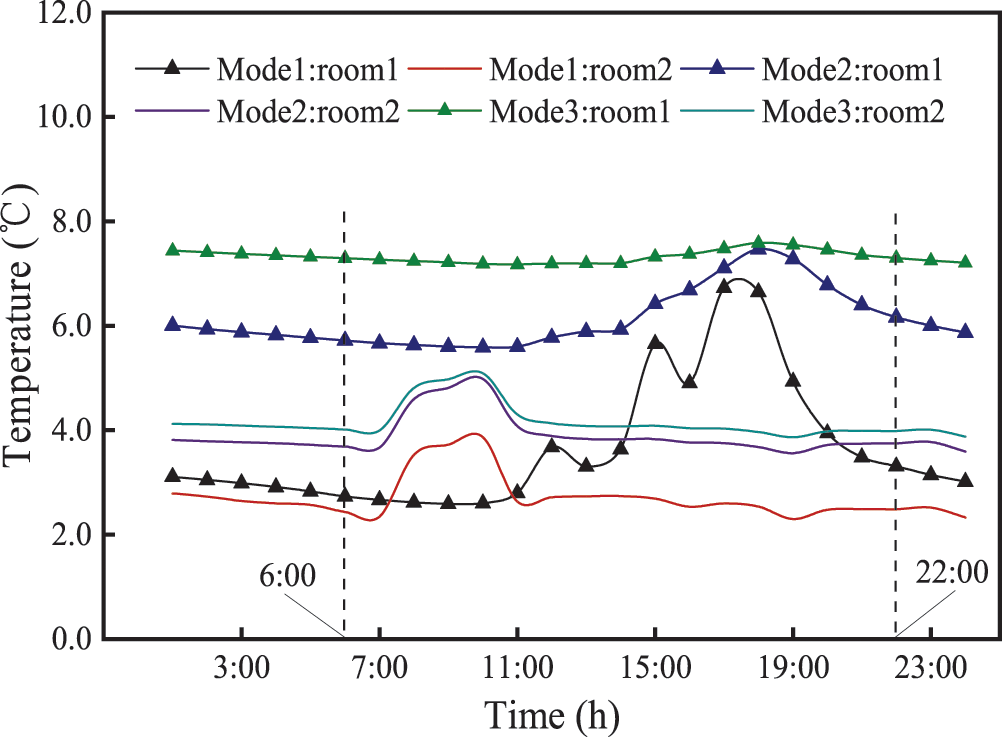
Figure 17: Indoor temperature of different passive solar houses in Karamay
Based on the above analysis, the suitability of passive solar heating technology in different regions of Northwest China was obtained. It can be learned that most regions in Northwest China are suitable for the development of passive solar heating technology. Moreover, over 70% of the regions in Northwest China comply with the following law: I-C is the most suitable region, II-Cold is the more suitable region, II-Severe Cold and III-Cold are the less suitable regions, and III-Severe Cold is the unsuitable region. However, this regularity is not apparent in certain regions of Xinjiang and Qinghai (italics in Table 11). This may be owing to the differences in topography [54]. However, this difference is not discussed in this study and will be considered in the follow-up study.
This work took the rural dwellings in Northwest China as the research object. The current indoor and outdoor thermal environment in winter and the mechanism of residents’ differentiated demand for indoor thermal comfort were analyzed. On this basis, suitable differentiated indoor comfort temperature indexes and the passive optimized combination scheme for improving the indoor thermal environment were explored. Finally, the suitability of passive solar heating technology for each region of Northwest China was analyzed based on residents’ differentiated demand for indoor thermal comfort. The conclusions are summarized below:
(1) In winter, the outdoor temperature was low and the temperature difference between day and night was large in the rural areas of Northwest China. Although the heating energy consumption was high, the indoor thermal environment was still not ideal. However, the area was rich in solar energy resources.
(2) It was proposed that during the activity period (from 6:00 am to 10:00 pm), the average indoor temperature of the main and secondary functional rooms should be at least 15°C and 12°C, respectively. During the sleep period (from 10:00 pm to 6:00 am the next day), the average indoor temperature of the main functional rooms should be at least 13°C.
(3) The indoor thermal environment of the buildings with optimized combination schemes was improved significantly. The average indoor temperature of the main and secondary functional rooms increased by at least 3.6°C and 4.0°C, respectively, and the temperature fluctuation decreased by at least 32.6% and 75.0%, respectively.
(4) The suitability of passive solar heating technology for each region of Northwest China was obtained. According to the suitability, the regions were classified into most suitable, more suitable, less suitable, and unsuitable regions.
Funding Statement: This research was supported by the National Natural Science Foundation of China (Grant Nos. 52078419 and 51678483). This research was supported by the Doctoral Dissertation Innovation Fund of Xi’an University of Technology (310–252072116).
Conflicts of Interest: The authors declare that they have no conflicts of interest to report regarding the present study.
1. Jamrozik, A., Clements, N., Hasan, S. S., Zhao, J., Zhang, R. P. et al. (2019). Access to daylight and view in an office improves cognitive performance and satisfaction and reduces eyestrain: A controlled crossover study. Building and Environment, 165, 1–13. DOI 10.1016/j.buildenv.2019.106379. [Google Scholar] [CrossRef]
2. Lowther, S. D., Jones, K. C., Wang, X. M., Whyatt, D. (2019). Particulate matter measurement indoors: A review of metrics, sensors, needs, and applications. Environmental Science and Technology, 53(20), 1–35. DOI 10.1021/acs.est.9b03425. [Google Scholar] [CrossRef]
3. Li, Z., Dai, J., Chen, H., Lin, B. (2019). An ANN-based fast building energy consumption prediction method for complex architectural form at the early design stage. Building Simulation, 12(4), 665–681. DOI 10.1007/s12273-019-0538-0. [Google Scholar] [CrossRef]
4. Lin, Y., Zhong, S., Yang, W., Hao, X., Li, C. Q. (2020). Towards zero-energy buildings in China: A systematic literature review. Journal of Cleaner Production, 276(10), 123297. DOI 10.1016/j.jclepro.2020.123297. [Google Scholar] [CrossRef]
5. Sheikh, W. T., Asghar, Q. (2018). Adaptive biomimetic facades: Enhancing energy efficiency of highly glazed buildings. Frontiers of Architectural Research, 8(3), 319–331. DOI 10.1016/j.foar.2019.06.001. [Google Scholar] [CrossRef]
6. Ahn, J. (2020). Improvement of the performance balance between thermal comfort and energy use for a building space in the mid-spring season. Sustainability, 12(22), 1–14. DOI 10.3390/su12229667. [Google Scholar] [CrossRef]
7. Zhu, Y. Y., Fan, X. N., Wang, C. J., Sang, G. C. (2018). Analysis of heat transfer and thermal environment in a rural residential building for addressing energy poverty. Applied Sciences, 8(11), 1–13. DOI 10.3390/app8112077. [Google Scholar] [CrossRef]
8. Xu, X., Mumford, T., Zou, P. (2020). Life-cycle building information modelling (BIM) engaged framework for improving building energy performance. Energy and Buildings, 231(7), 110496. DOI 10.1016/j.enbuild.2020.110496. [Google Scholar] [CrossRef]
9. Parliament, E. (2020). Directive 2002/91/EC of the European Parliament and of the council of 16 December 2002 on the energy performance of buildings. Cambridge, UK: Cambridge University Press. [Google Scholar]
10. MOHURD (2018). Design standard for energy efficiency of residential buildings in severe and cold zones: JGJ26-2018. Beijing, China: China Architecture Building Press. [Google Scholar]
11. Lan, L., Lian, L., Huang, H., Lin, Y. (2014). Experimental study on thermal comfort of sleeping people at different air temperatures. Building and Environment, 73(5), 24–31. DOI 10.1016/j.buildenv.2013.11.024. [Google Scholar] [CrossRef]
12. Pan, L., Lian, Z., Lan, L. (2012). Investigation of gender differences in sleeping comfort at different environment temperatures. Indoor and Built Environment, 21(6), 811–820. DOI 10.1177/1420326X11425967. [Google Scholar] [CrossRef]
13. Wang, Y. Y., Liu, Y. F., Song, C., Liu, J. P. (2015). Appropriate indoor operative temperature and bedding micro climate temperature that satisfies the requirement of sleep thermal comfort. Building and Environment, 92(3–4), 20–29. DOI 10.1016/j.buildenv.2015.04.015. [Google Scholar] [CrossRef]
14. Liu, Y. F., Song, C., Wang, Y. Y., Wang, D. J., Liu, J. P. (2014). Experimental study and evaluation of the thermal environment for sleeping. Building and Environment, 82(1), 546–555. DOI 10.1016/j.buildenv.2014.09.024. [Google Scholar] [CrossRef]
15. Manu, S., Shukla, Y., Rawal, R., Thomas, L. E., de Dear, R.(2016). Field studies of thermal comfort across multiple climate zones for the subcontinent: India model for adaptive comfort (IMAC). Building and Environment, 98, 55–70. DOI 10.1016/j.buildenv.2015.12.019. [Google Scholar] [CrossRef]
16. Zhang, N., Cao, B., Zhu, Y. X. (2018). Indoor environment and sleep quality: A research based on online survey and field study. Building and Environment, 137(7063), 198–207. DOI 10.1016/j.buildenv.2018.04.007. [Google Scholar] [CrossRef]
17. Rijal, H. B., Humphreys, M. A., Nicol, J. F. (2019). Adaptive model and the adaptive mechanisms for thermal comfort in Japanese dwellings. Energy and Buildings, 202(597), 109371. DOI 10.1016/j.enbuild.2019.109371. [Google Scholar] [CrossRef]
18. Zhu, Y. Y., Liu, J. P. (2010). Research on the indoor thermal environment of rural architecture in winter in northwestern areas. China Civil Engineering Journal, 43, 1500–1503. DOI 10.15951/j.tmgcxb.2010.s2.068. [Google Scholar] [CrossRef]
19. Cui, X. L., Zhang, Y. K., Sang, G. C., Wang, W. K., Zhang, L. (2019). Coupling effect of space-arrangement and wall thermal resistance on indoor thermal environment of passive solar single-family building in Tibet. Applied Sciences, 9(17), 1–19. DOI 10.3390/app9173594. [Google Scholar] [CrossRef]
20. Zhao, Q., Fan, X. N., Wang, Q., Sang, G. C., Zhu, Y. Y. (2020). Research on energy-saving design of rural building wall in Qinba mountains based on uniform radiation field. Mathematical Problems in Engineering, 9(1), 1–16. DOI 10.1155/2020/9786895. [Google Scholar] [CrossRef]
21. Fan, X. N., Guo, Y., Zhao, Q., Zhu, Y. (2021). Structural optimization and application research of alkali-activated slag ceramsite compound insulation block based on finite element method. Mathematics, 9(19), 2488. DOI 10.3390/math9192488. [Google Scholar] [CrossRef]
22. Fan, X. N., Zhu, Y. Y., Sang, G. C. (2017). Optimization design of enclosure structure of solar energy building in Northwest China based on indoor zoning. 2017 6th International Conference on Energy and Environmental Protection, pp. 30–40. Zhuhai, China: Atlantis Press. [Google Scholar]
23. Lei, W., Feng, Y., Cao, Y., Yu, N. (2013). Thermal performance optimization of solar heating building envelope in Tibet of China. Architectural and Environmental Engineering, 35(2), 86–91. DOI 10.3969/j.issn.1674-4764.2013.02.014. [Google Scholar] [CrossRef]
24. Sang, G. C., Han, Y., Zhu, Y. Y., Chen, D. Y., Zhao, Q. (2016). Study of the non-uniform effect of space division on passive solar house indoor temperature. Acta Energiae Solaris Sinica, 37(11), 2902–2907. [Google Scholar]
25. Shao, N., Zhang, J., Ma, L. (2017). Analysis on indoor thermal environment and optimization on design parameters of rural residence. Journal of Building Engineering, 12, 229–238. DOI 10.1016/j.jobe.2017.05.003. [Google Scholar] [CrossRef]
26. Chan, H. Y., Riffat, S. B., Zhu, J. (2010). Review of passive solar heating and cooling technologies. Renewable & Sustainable Energy Reviews, 14(2), 781–789. DOI 10.1016/j.rser.2009.10.030. [Google Scholar] [CrossRef]
27. Gou, S. Q., Nik, V. M., Scartezzini, J. L., Li, Z. R. (2018). Passive design optimization of newly-built residential buildings in Shanghai for improving indoor thermal comfort while reducing building energy demand. Energy and Buildings, 169, 484–506. DOI 10.1016/j.enbuild.2017.09.095. [Google Scholar] [CrossRef]
28. Lu, S., Tang, X., Ji, L., Tu, D. (2017). Research on energy-saving optimization for the performance parameters of rural-building shape and envelope by TRNSYS-GenOpt in HSCW zone of China. Sustainability, 9, 1–18. DOI 10.3390/su9020294. [Google Scholar] [CrossRef]
29. Zhai, Y. N., Wang, Y., Huang, Y. Q., Meng, X. J. (2019). A multi-objective optimization methodology for window design considering energy consumption, thermal environment and visual performance. Renewable Energy, 134(4), 1190–1191. DOI 10.1016/j.renene.2018.09.024. [Google Scholar] [CrossRef]
30. Liu, J. P., Yang, Y., Liu, Y. F., Tian, G. M. (2011). Key technological research and application of low energy consumption building design in Tibet. Engineering Sciences, 10, 40–46. DOI 10.3969/j.issn.1009-1742.2011.10.006. [Google Scholar] [CrossRef]
31. Fuller, R. J., Zahnd, A., Thakuri, S. (2009). Improving comfort levels in a traditional high altitude Nepali house. Building and Environment, 44(3), 479–489. DOI 10.1016/j.buildenv.2008.04.010. [Google Scholar] [CrossRef]
32. Shahi, D. K., Rijal, H. B., Kayo, G., Shukuya, M. (2021). Study on wintry comfort temperature and thermal improvement of houses in cold, temperate, and subtropical regions of Nepal. Energy and Buildings, 191(3), 107569. DOI 10.1016/j.buildenv.2020.107569. [Google Scholar] [CrossRef]
33. Badescu, V., Laaser, N., Crutescu, R., Crutescu, M., Dobrovicescu, A. et al. (2011). Modeling, validation and time-dependent simulation of the first large passive building in Romania. Renewable Energy, 36(1), 142–157. DOI 10.1016/j.renene.2010.06.015. [Google Scholar] [CrossRef]
34. Sadineni, S. B., Madala, S., Boehm, R. F. (2011). Passive building energy savings: A review of building envelope components. Renewable & Sustainable Energy Reviews, 15(8), 3617–3631. DOI 10.1016/j.rser.2011.07.014. [Google Scholar] [CrossRef]
35. Wang, W. L., Tian, Z. (2013). Investigation on the influencing factors of energy consumption and thermal comfort for a passive solar house with water thermal storage wall. Energy and Buildings, 64(6), 218–223. DOI 10.1016/j.enbuild.2013.05.007. [Google Scholar] [CrossRef]
36. Wang, C., Zhu, Y., Guo, X. F. (2019). Thermally responsive coating on building heating and cooling energy efficiency and indoor comfort improvement. Applied Energy, 253, 113506. DOI 10.1016/j.apenergy.2019.113506. [Google Scholar] [CrossRef]
37. Zhou, Y., Wang, Z., Yang, C., Xu, L., Chen, W. (2019). Influence of Trombe wall on indoor thermal environment of a two-story building in rural Northern China during summer. Science and Technology for the Built Environment, 5(4), 438–449. DOI 10.1080/23744731.2018.1550994. [Google Scholar] [CrossRef]
38. Chen, N. C., Hall, M., Yu, K. K., Qian, C. (2019). Environmental satisfaction, residential satisfaction, and place attachment: The cases of long-term residents in rural and urban areas in China. Sustainability, 11(22), 1–20. DOI 10.3390/su11226439. [Google Scholar] [CrossRef]
39. Liu, D. R., Ren, Z. G., Wei, S., Song, Z., Li, P. P. et al. (2019). Investigations on the winter thermal environment of bedrooms in Zhongxiang: A case study in rural areas in hot summer and cold winter region of China. Sustainability, 11(17), 1–25. DOI 10.3390/su11174720. [Google Scholar] [CrossRef]
40. Rui, J. W., Zhang, H. B., Shi, C. N., Pan, D., Chen, Y. et al. (2019). Survey on the indoor thermal environment and passive design of rural residential houses in the HSCW zone of China. Sustainability, 11(22), 1–20. DOI 10.3390/su11226471. [Google Scholar] [CrossRef]
41. Gong, X., Akashi, Y., Sumiyoshi, D. (2012). Optimization of passive design measures for residential buildings in different Chinese areas. Building and Environment, 58(8), 46–57. DOI 10.1016/j.buildenv.2012.06.014. [Google Scholar] [CrossRef]
42. Zhou, P. F., Chi, Z. (2018). Influence of the passive design of a building facade on the indoor thermal comfort of residential buildings. Journal of Architectural Engineering Technology, 7(1), 1–5. DOI 10.4172/2168-9717.1000218. [Google Scholar] [CrossRef]
43. Li, Y., Conway, D., Wu, Y. J., Gao, Q. Z., Rothausen, S. et al. (2013). Rural livelihoods and climate variability in Ningxia, Northwest China. Climatic Change, 119(3–4), 891–904. DOI 10.1007/s10584-013-0765-9. [Google Scholar] [CrossRef]
44. Mazumder, S. (2016). The finite volume method. Numerical Models for Differential Problems, 1, 277–338. DOI 10.1016/B978-0-12-849894-1.00006-8. [Google Scholar] [CrossRef]
45. Gilbert, S. W., George, J. F., George, D. S. (1973). An analysis of the finite element method. Journal of Applied Mechanics, 41(1), 62. DOI 10.1115/1.3423272. [Google Scholar] [CrossRef]
46. Mazumder, S. (2016). The finite difference method. Numerical Methods for Partial Differential Equations, 12, 51–101. DOI 10.1016/B978-0-12-849894-1.00002-0. [Google Scholar] [CrossRef]
47. Liu, X., Zhang, H. Y. (2007). Graphic interface designing software design builder of energy plus and its application. Journal of Xi’an Aerotechnical College, 25, 33–37. DOI 10.3969/j.issn.1008-9233.2007.05.012. [Google Scholar] [CrossRef]
48. ISO 7726 (1985). Thermal environments instruments and methods for measuring physical quantities. Geneva, Switzerland: International Standardization Organization. [Google Scholar]
49. ASHRAE (2013). Thermal environmental conditions for human occupancy. New York: America Society of Heating. [Google Scholar]
50. MOHURD (2013). Design standard for energy efficiency of rural residential buildings: GB/T50824-2013. Beijing, China: China Architecture Building Press. [Google Scholar]
51. MOHURD (2012). Technical code for passive solar buildings: JGJ/T 267-2012. Beijing, China: China Architecture Building Press. [Google Scholar]
52. Zhang, Q., Joe, H. (2014). Chinese standard weather databank for building. Beijing, China: Machine Industry Press. [Google Scholar]
53. MOHURD (2016). Code for thermal design of civil building: CB50176-2016. Beijing, China: China Architecture Building Press. [Google Scholar]
54. Liu, Y. F., Jiang, J., Wang, D. J., Liu, J. P. (2017). The passive solar heating technologies in rural school buildings in cold climates in China. Journal of Building Physics, 41(4), 339–359. DOI 10.1177/1744259117707277. [Google Scholar] [CrossRef]
55. Wang, Y. (2012). Annual solar radiation date of China. Beijing, China: China Construction Industry Press. [Google Scholar]
56. Yan, Q. S., Zhao, Q. Z. (1986). Building thermal process. Beijing, China: China Architecture Building Press. [Google Scholar]
57. MOHURD (2012). Design standard for energy-efficient of detached rural housing: CECS 332-2012. Beijing, China: China Architecture Building Press. [Google Scholar]
58. Wang, D. J., Liu, Y. F., Liu, J. P., Wang, Y. Y. (2010). Analysis of thermal performance and indoor thermal environment in winter of rural building in Northwest of China. Industrial Construction, 40, 24–27. DOI 10.13204/j.gyjz2010.s1.185. [Google Scholar] [CrossRef]
59. Liu, Y. F., Li, T., Song, C., Wang, T. J., Liu, J. P. (2018). Field study of different thermal requirements based on the indoor activities patterns of rural residents in winter in Northwest China. Science and Technology for the Built Environment, 24(8), 867–877. DOI 10.1080/23744731.2018.1435122. [Google Scholar] [CrossRef]
60. Zhang, Q., Zhu, Y. Y., Liu, J. P., Liang, R. (2010). Practice and real testing analysis of rural house passive solar design in Northwest China. Journal of Xi’an University of Technology, 26, 477–481. DOI 10.3969/j.issn.1006-4710.2010.04.020. [Google Scholar] [CrossRef]
61. Nicol, F., Rijal, H. B., Imagawa, H., Thapa, R. (2020). The range and shape of thermal comfort and resilience. Energy and Buildings, 224(7), 110277. DOI 10.1016/j.enbuild.2020.110277. [Google Scholar] [CrossRef]
62. Lin, Z. P., Deng, S. M. (2008). A study on the thermal comfort in sleeping environments in the subtropics-developing a thermal comfort model for sleeping environments. Building and Environment, 43(1), 70–81. DOI 10.1016/j.buildenv.2006.11.026. [Google Scholar] [CrossRef]
63. ISO 7730 (1995). Moderate thermal environments: Determination of PMV and PPD indices and specification of the conditions for thermal comfort. Berlin, Germany: International Standardization Organization. [Google Scholar]
64. Rupp, R. F., Kim, J., Ghisi, E., de Dear, R. (2019). Thermal sensitivity of occupants in different building typologies: The Griffiths constant is a variable. Energy and Buildings, 200(1), 11–20. DOI 10.1016/j.enbuild.2019.07.048. [Google Scholar] [CrossRef]
65. Gagge, A. P., Fobelets, A. P., Berglund, L. G. (1986). A standard predictive index of human response to the thermal. https://www.researchgate.net/publication/236424692. [Google Scholar]
66. Fanger, P. O. (1970). Thermal comfort. Copenhagen, Denmark: Danish Technical Press. [Google Scholar]
67. Mcintyre, D. A. (1980). Indoor climate. London, UK: Applied Science Publisher. [Google Scholar]
68. Humphreys, M. A., Rijal, H. B., Nicol, J. F. (2013). Updating the adaptive relation between climate and comfort indoors; new insights and an extended database. Building and Environment, 63(5), 40–55. DOI 10.1016/j.buildenv.2013.01.024. [Google Scholar] [CrossRef]
69. Rijal, H. B., Yoshida, K., Humphreys, M. A., Nicol, J. F. (2020). Development of an adaptive thermal comfort model for energy-saving building design in Japan. Architectural Science Review, 4, 1–14. DOI 10.1080/00038628.2020.1747045. [Google Scholar] [CrossRef]
70. Fan, X. N., Zhu, Y. Y., Sang, G. C., Cui, X. L. (2020). Research on indoor thermal comfort of Ningxia rural houses in winter based on different functional rooms. Xi’an University of Technology, 12, 1–10. DOI 10.19322/j.cnki.issn.1006-4710.2021.02.001. [Google Scholar] [CrossRef]
71. Wang, Q. (2019). Study on low energy consumption structure system of Qinba Mountainous building (Master Thesis). China: Xi’an University of Technology. [Google Scholar]
72. Wang, S. D., Liu, Y. F., Ma, C. (2014). Relationship between northwest rural residents behavior trace and indoor thermal environment in winter. Architecture Technology, 45, 1030–1032. DOI 10.3969/j.issn.1000-4726.2014.11.019. [Google Scholar] [CrossRef]
73. Zhu, Y. Y., Wang, X. L. (2020). Thermal insulation performance of radiant barrier roofs for rural buildings in the Qinba mountains. Mathematical Problems in Engineering, 29(12), 1–13. DOI 10.1155/2020/5612403. [Google Scholar] [CrossRef]
 | This work is licensed under a Creative Commons Attribution 4.0 International License, which permits unrestricted use, distribution, and reproduction in any medium, provided the original work is properly cited. |