| Computer Modeling in Engineering & Sciences |
DOI: 10.32604/cmes.2022.019914
ARTICLE
An Intelligent Prediction Model for Target Protein Identification in Hepatic Carcinoma Using Novel Graph Theory and ANN Model
1Computer Science and Engineering, Karunya Institute of Technology and Sciences, Coimbatore, 641114, India
2Centre for Nanotechnology & Advanced Biomaterials (CeNTAB), School of Chemical & Biotechnology, SASTRA Deemed to be University, Thanjavur, 613401, India
3Department of ECE, Karunya Institute of Technology and Sciences, Coimbatore, 641114, India
4Department of Mechanical Engineering, College of Engineering, Taif University, Taif, 21944, Saudi Arabia
5Institute of Research and Development, Duy Tan University, Danang, 550000, Vietnam
6Faculty of Information Technology, Duy Tan University, Danang, 550000, Vietnam
*Corresponding Author: Dac-Nhuong Le. Email: ledacnhuong@duytan.edu.vn
Received: 23 October 2021; Accepted: 25 February 2022
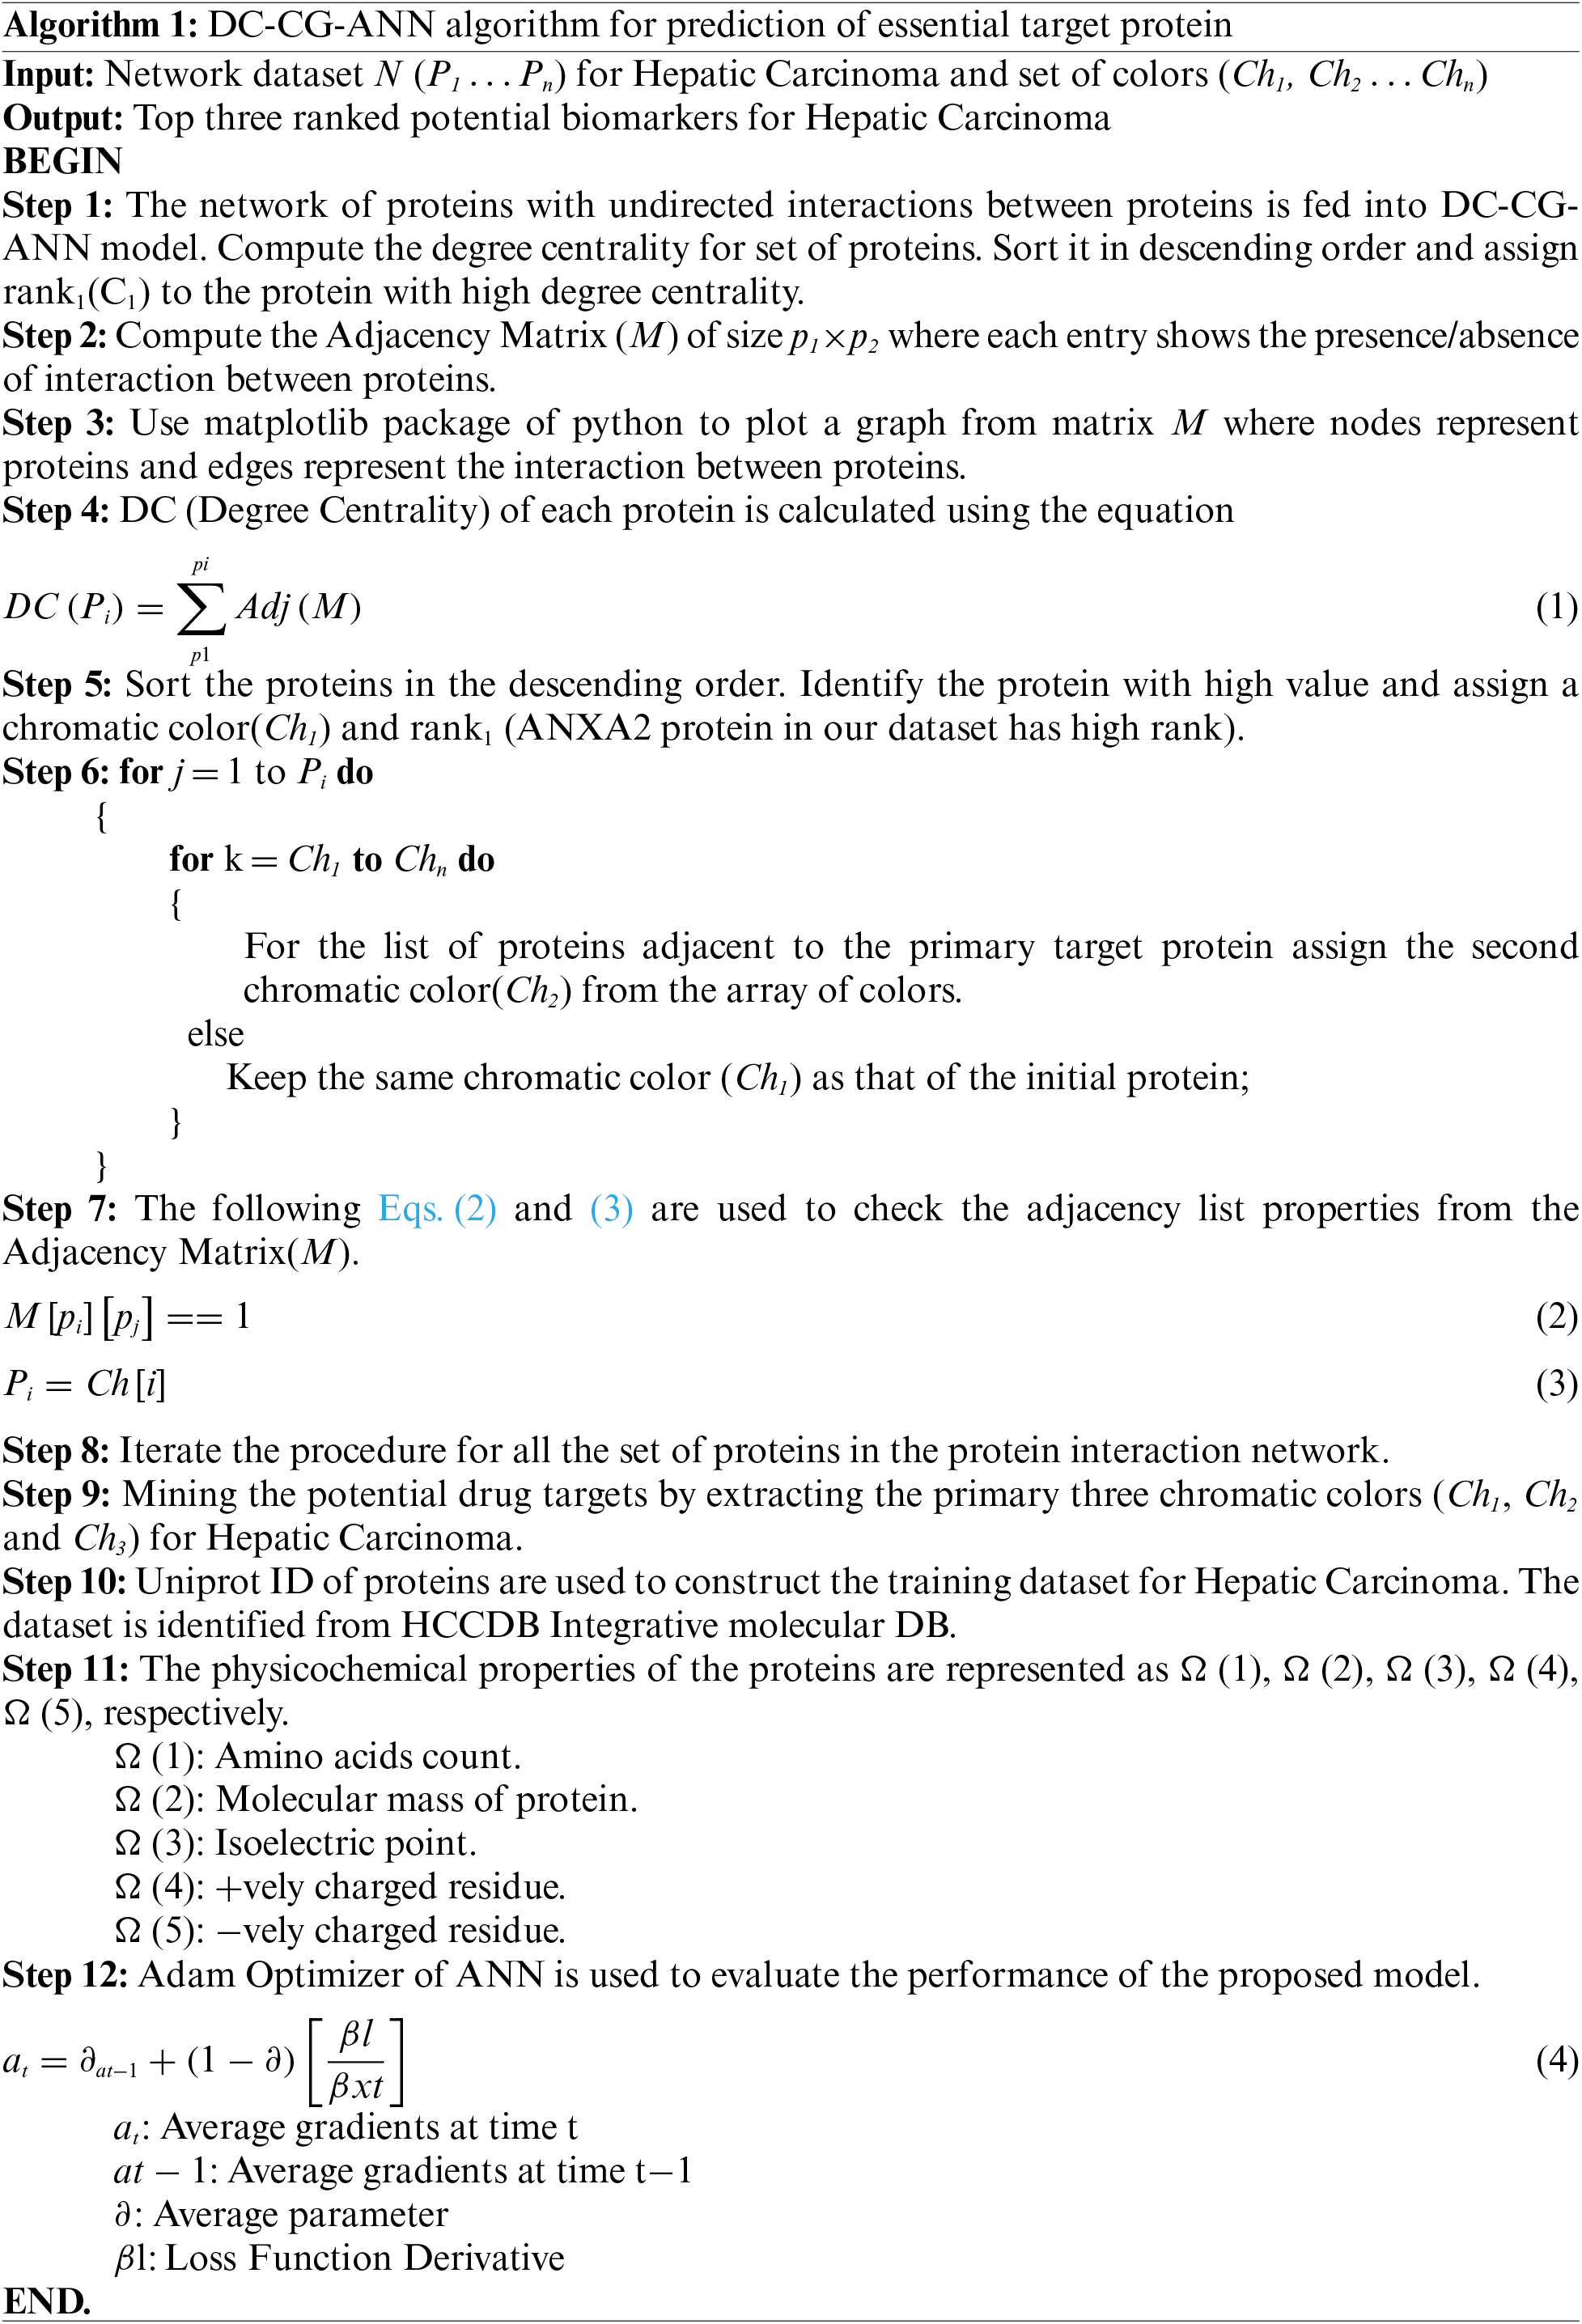
Abstract: Hepatocellular carcinoma (HCC) is one major cause of cancer-related mortality around the world. However, at advanced stages of HCC, systematic treatment options are currently limited. As a result, new pharmacological targets must be discovered regularly, and then tailored medicines against HCC must be developed. In this research, we used biomarkers of HCC to collect the protein interaction network related to HCC. Initially, DC (Degree Centrality) was employed to assess the importance of each protein. Then an improved Graph Coloring algorithm was used to rank the target proteins according to the interaction with the primary target protein after assessing the top ranked proteins related to HCC. Finally, physio-chemical proteins are used to evaluate the outcome of the top ranked proteins. The proposed graph theory and machine learning techniques have been compared with six existing methods. In the proposed approach, 16 proteins have been identified as potential therapeutic drug targets for Hepatic Carcinoma. It is observable that the proposed method gives remarkable performance than the existing centrality measures in terms of Accuracy, Precision, Recall, Sensitivity, Specificity and F-measure.
Keywords: Drug target detection; hepatic carcinoma; degree centrality; graph coloring; artificial neural network model
Due to the enormous vitality developed for big data research, it is necessary to utilize and apply that information in various fields like industry and clinical [1]. This can be complimented mainly by two different computer learning approaches, such as Artificial Intelligence (AI) and Machine Level Learning (ML), for using different mathematical algorithms [1,2]. Prognosis and diagnosis of the particular disease are enormous challenges even though we employ other sophisticated techniques such as ELISA, RT-PCR, and biopsy techniques [2–4]. There is a chance for false-positive results and given wrong treatment modalities to the patients. Later, the researchers move on to develop an array of markers using LCMS. GCMS, RIA, DNA and RNA, protein microarray [5,6], and Next Generation Sequencing of a particular disease to pick out and give correct treatment and advice to the patient [4]. On the other hand, picking out a group of biomarkers from this result is one of other big challenges in the field of clinical research [7].
Based on this interest, several reports in the literature indicated that AI and ML had been widely used to find and validate the particular biomarker for the prognosis and diagnosis of the disease [7,8]. Among the different clinical applications, AI and ML techniques help is vigorously needed for the diagnosis of cancer and to increase the life of an individual [7]. Even though we are utilizing AI for clinical applications, we should remind our drawbacks accordingly to strengthen the protocol and develop a dataset to minimize the errors from the technique. So, the researchers have also been used different algorithms along with ML that includes support vector machines, artificial neural networks and convolutional neural networks [9]. Among the three, SVM and ANN have been widely used for numerical data sets [10] rather CVN used for medical images to predict the target as well as particular marker to identify the disease in a better accuracy [11]. The use of backdated data set used in AI techniques by many of these researchers would affect the accuracy of the result [12]. This may be due to the bias already available in the single data set used for the study. So, it is essential to address the issues mentioned above through well designed and structured protocol, collecting datasets from multiple resources and developing new algorithms [12].
So, the present work is aimed to evaluate and predict suitable biomarkers for the prognosis and diagnosis of hepatocellular carcinoma. The literature scan strongly indicated that AI and ML had been widely employed to diagnose and treat different hepatic disorders [13]. Among the various pathological conditions of the liver, hepatocellular carcinoma is a significant disease that leads to maximum deaths worldwide and is very common [14]. As per the American Chemical Society record, in the year 2020, around 42,810 people are affected by hepatocellular carcinoma (HCC) [15]. Among that, about 30,160 people die from the disease. Generally, HCC has been diagnosed by different modes like serum analysis and various imaging techniques such as abdominal ultrasound, computerized abdominal tomography or abdominal magnetic resonance imaging (MRI), positron emission tomography (PET) and histology [16]. AI and ML have also been employed majorly for image-based diagnosis. From the literature, very few papers are available for using numerical datasets for disease diagnosis and prognosis, particularly for HCC [16–25]. Many computational methods have traditionally been developed to extract useful information by employing protein sequence features [26–28]. With the technical advancement in soft computing and web security-based applications, numerous models have been introduced to focus on the security of health care records [29–32].
So, the present work utilizes the new computer-based algorithms for predicting the particular biomarker for the prognosis and diagnosis of hepatic cancer.
In this research work, we have employed network topological measure and Machine Learning method to predict the target proteins associated with Hepatic Cancer. The combination of Graph theory and Machine Learning approaches can be used for wide varieties of infectious diseases [17]. The uniprot ID of proteins are used to extract the physicochemical properties of the proteins. Among all the Machine Learning techniques ANN model shows an improved performance than other classifiers. The outcome of the Graph theory measure has been validated using training dataset constructed for Hepatic Carcinoma.
The major contributions of the research are as follows:
(a) A novel mathematical measure (DC) to identify the most targeted proteins related to Hepatic Carcinoma.
(b) Rank all the proteins according to the descending order of Degree Centrality (DC).
(c) Start the protein with high rank as the seed protein and extract the primary and secondary interactions of the seed protein through Graph Coloring algorithm.
(d) Physio-chemical proteins are used to build the training dataset related to HCC.
(e) Adam Optimizer of ANN model is used to compare the performance of the proposed model with other existing centrality measures.
Fig. 1 shows the work flow of the proposed work. The proposed involves multiple stages from the importing protein interaction dataset from biological databases till the identification of potential drug targets for Hepatic Carcinoma. The dataset has been imported from different biological databases such as String DB, DIP and IntAct. From the collected network of proteins, edge list has been prepared which hold information about the interaction between proteins. From the generated edge list, the proteins have been ranked using different graph theory models such Graph Coloring, Degree Centrality, Betweenness Centrality, Closeness Centrality, Network Centrality, Subgraph Centrality and Information Centrality. The set of training dataset based on secondary features of proteins for Hepatic Carcinoma has been collected from HCCDB Integrative Molecular Database. Seven different centrality measures have been evaluated on the network of proteins. Furthermore, three models have been trained for 15 epochs on the training dataset. After training and testing on Hepatic Carcinoma set, the validation accuracy of the models DC, BC, CC, EC, NC, SC, IC has been calculated. The proposed methods focus on employing a novel mathematical and deep learning technique for target protein prediction with improved accuracy. The structural model focuses on improving the prediction accuracy of target proteins for Hepatic Carcinoma by incorporating a novel graph theoretical approach and deep learning model. The proposed model focuses on ranking the target proteins related to HCC by checking the adjacency between proteins. The protein with unique color is given a higher rank and from these most targeted proteins the primary and secondary interactions of the top ranked protein is used to predict the next higher rank proteins related to HCC.
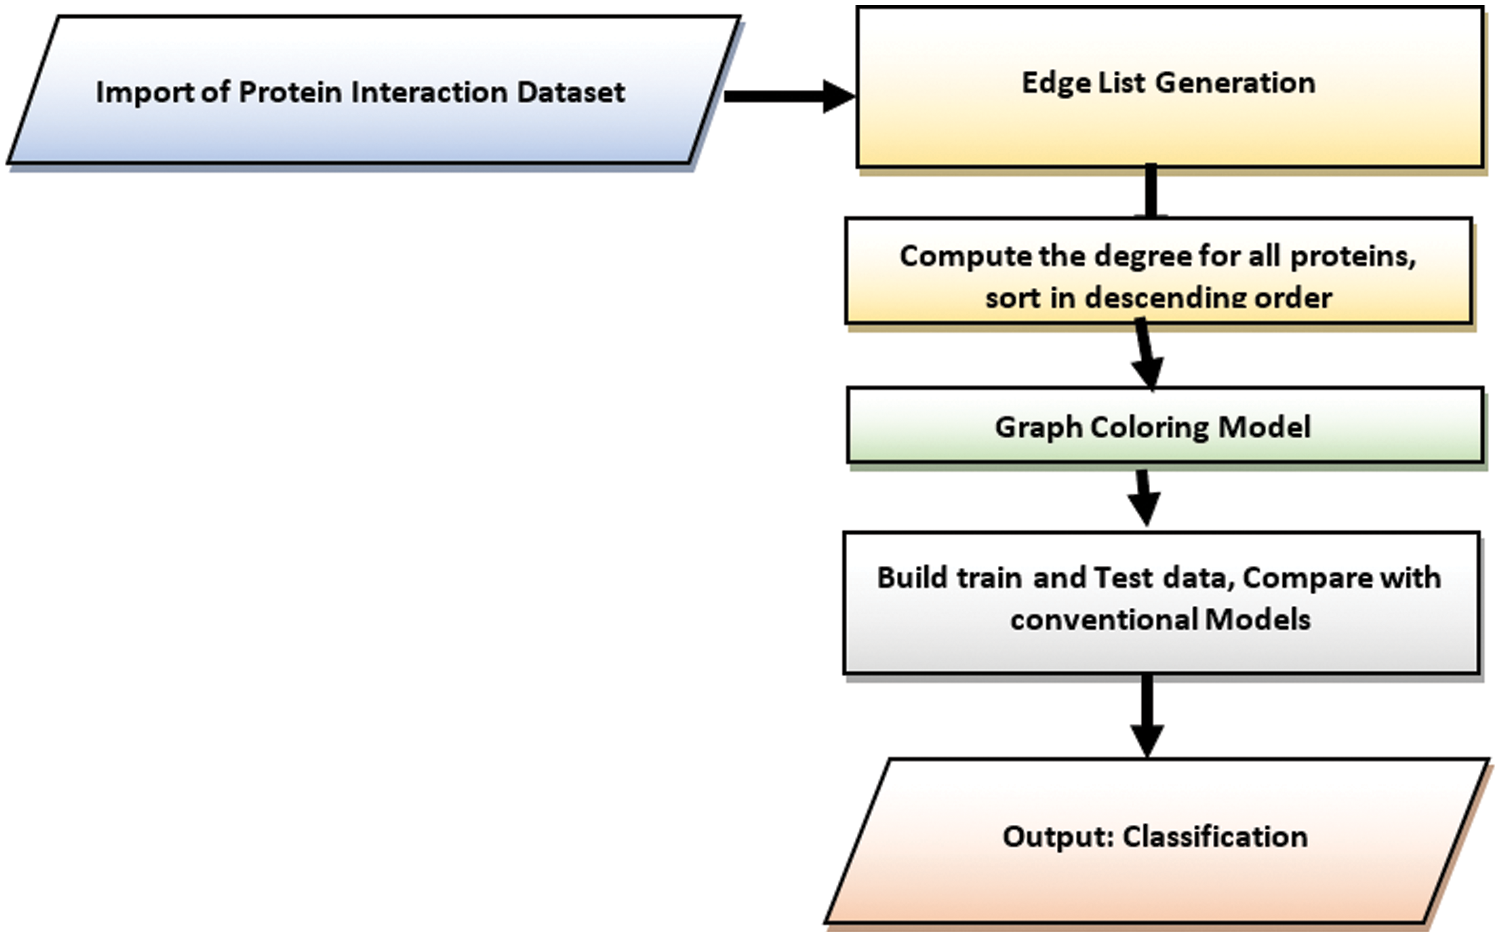
Figure 1: Stepwise process flow chart for the proposed study
The dataset used for the proposed research work has been collected from biological databases such as String DB, IntAct and DIP. The dataset used for our study consists of different types of network dataset with 24.001 proteins, 55.400 proteins and 75.000 proteins. The figure shown in Fig. 2 is the sample of network dataset collected from String DB. In which circular nodes represent the proteins and the links represent the interaction between proteins [18] shows the reference of dataset used for experimental evaluation.
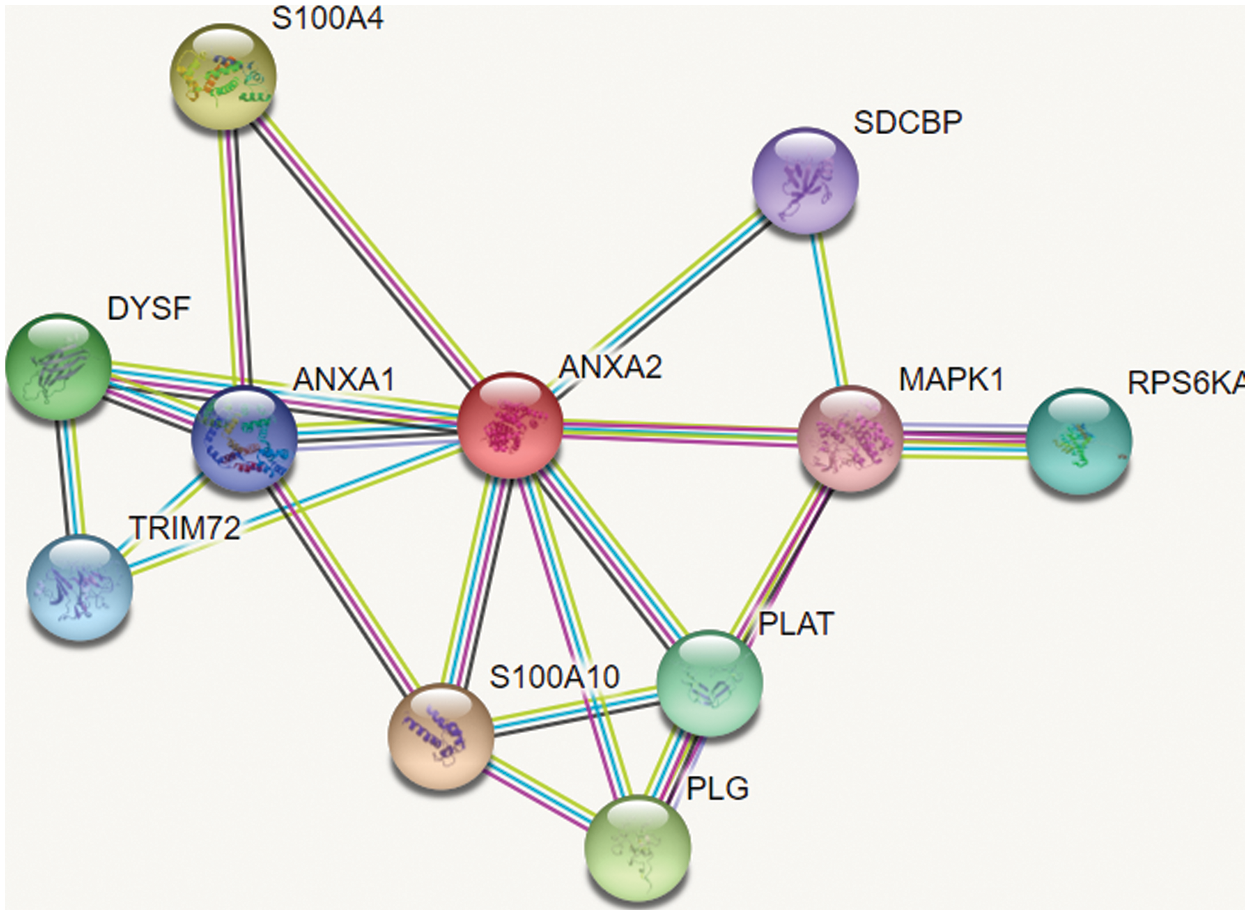
Figure 2: Sample of dataset collected from String DB
Fig. 3 shows the model of 3D structure of proteins made up of a chain of amino acids. The large chain of amino acids fold in a particular way to determine the shape of protein. The elements of protein include helix, sheet and loop. They have buried binding site that is suitable for identifying drug targets. The genetic variation in the amino acids of protein causes the protein to be identified as the most essential targets for drug.
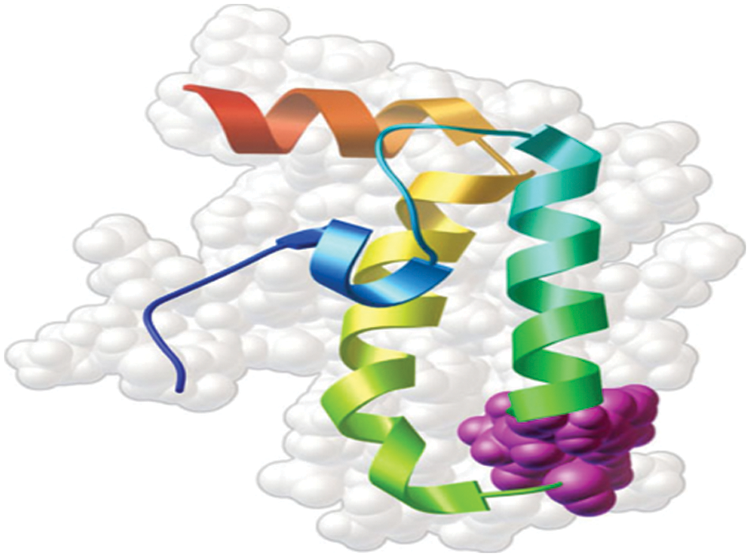
Figure 3: Sample of 3D structure of protein
DC-CG-ANN architecture is shown in Fig. 4. It consists eight layers of processing. It consists of protein network construction from various biological databases, computing the degree of each protein and sorting it into descending order of degree values, implementation of graph Coloring algorithm, extracting the primary and secondary colors from the array of colors, building training and test dataset from HCCDB Integrative Molecular Database, build various machine learning models for the proposed and state-of-art methodologies. Evaluate and compare the performance of proposed and existing methods [19].
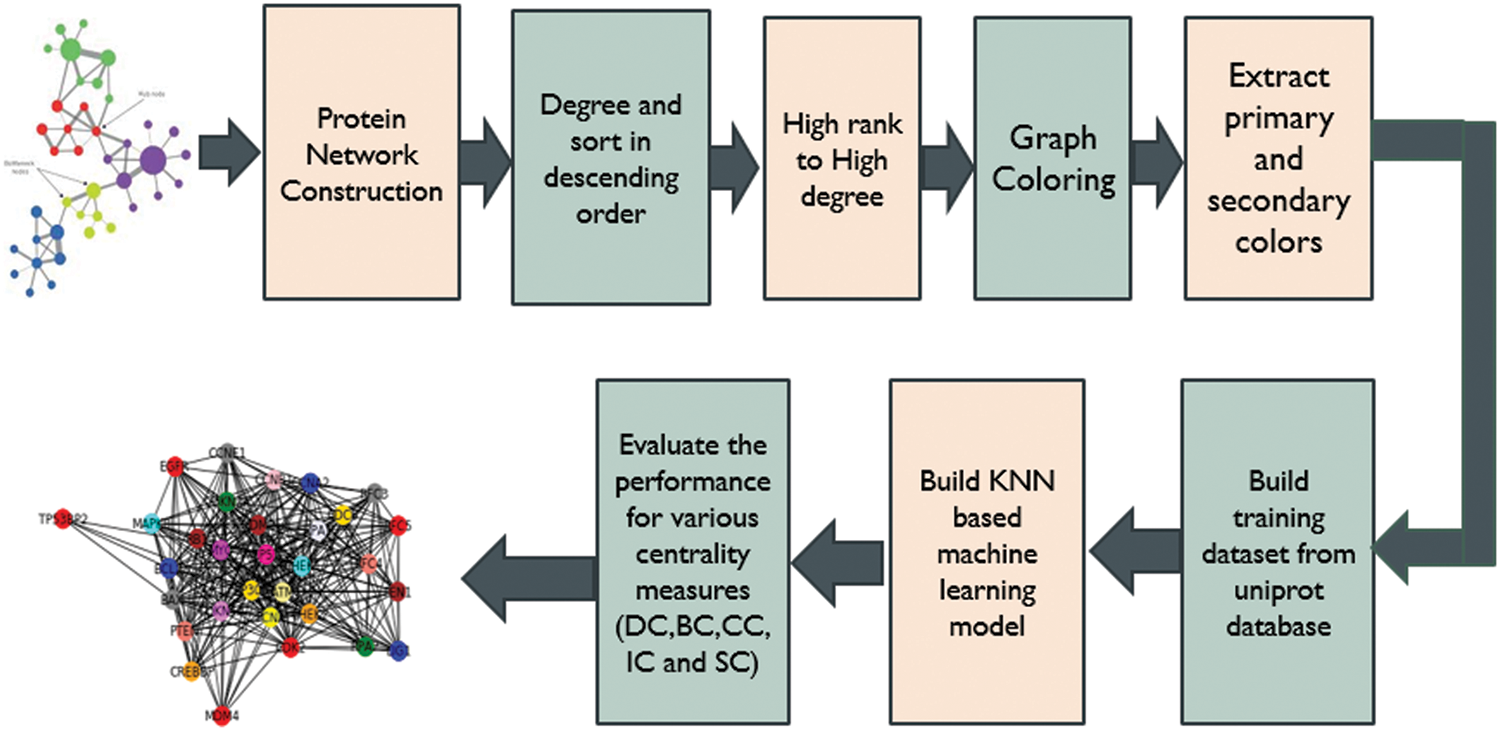
Figure 4: DC-CG-ANN model architecture
2.3 Protein Interaction Network Construction
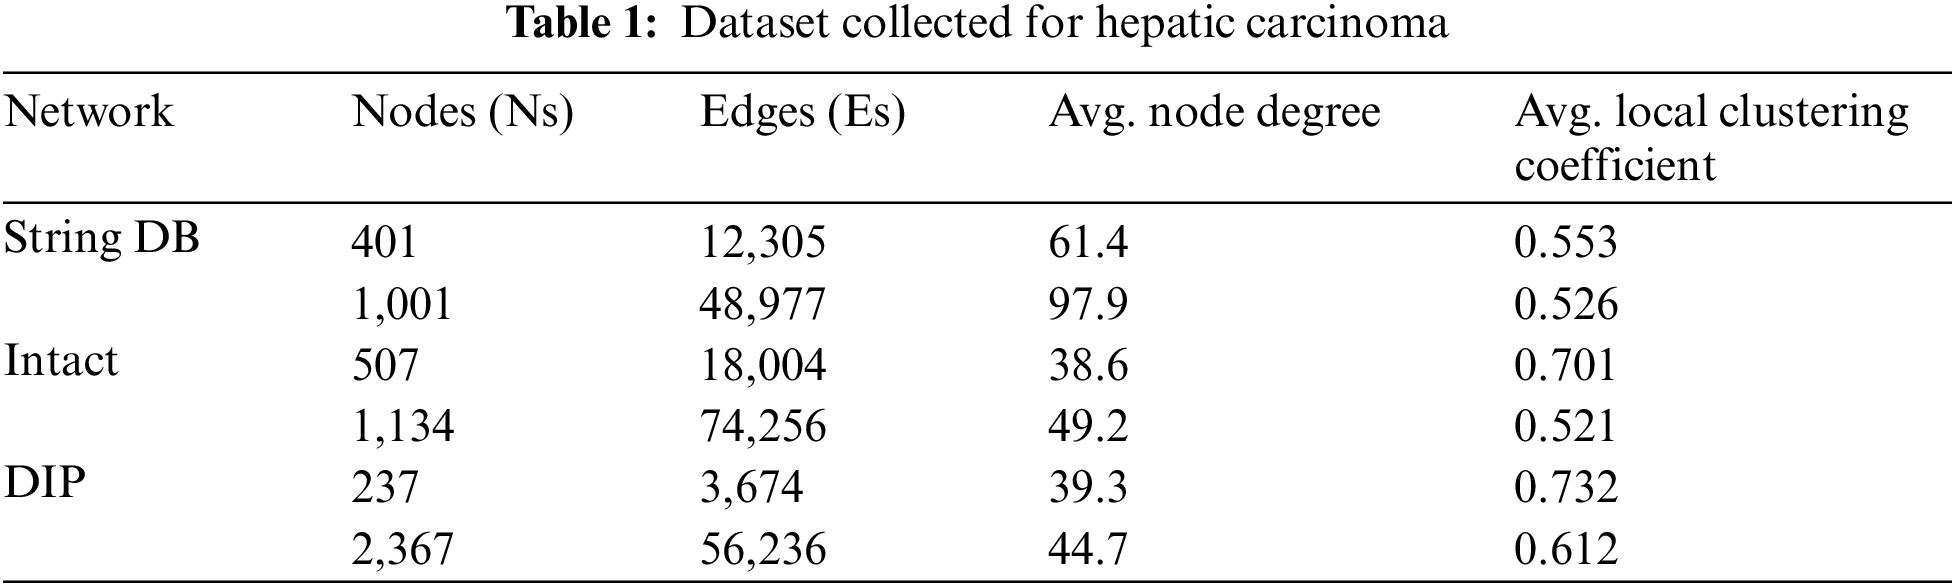
The protein interaction network for the proposed methodology has been collected from String DB, Intact and DIP. Table 1 shows the information about the dataset used for proteins related to Hepatic Carcinoma. It tabulates much information like number of proteins, interaction between the proteins, average node degree and average local clustering coefficient used in the experimental evaluation.
2.4 Computation of Degree of Proteins
The sample represented of the type of input graph used for the experimental evaluation is shown in Fig. 5.
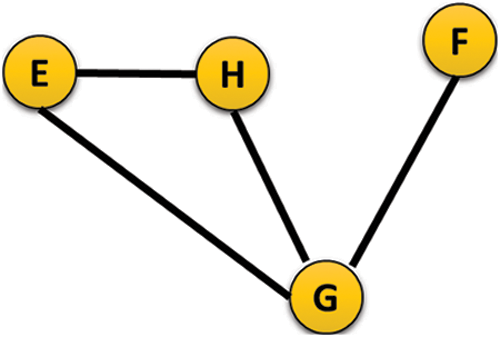
Figure 5: Sample representation of undirected graph
From the sample of input graph shown above adjacency matrix is generated and from the generated adjacency matrix, the degree of interaction for each protein is calculated from the protein interaction network.
Eq. (5) shows the formula for computing the degree of each protein. For the network of proteins considering the undirected interaction between proteins, the proteins with a greater number of interactions is identified as high rank protein. The procedure is repeated for the computation of number of interactions for each protein.
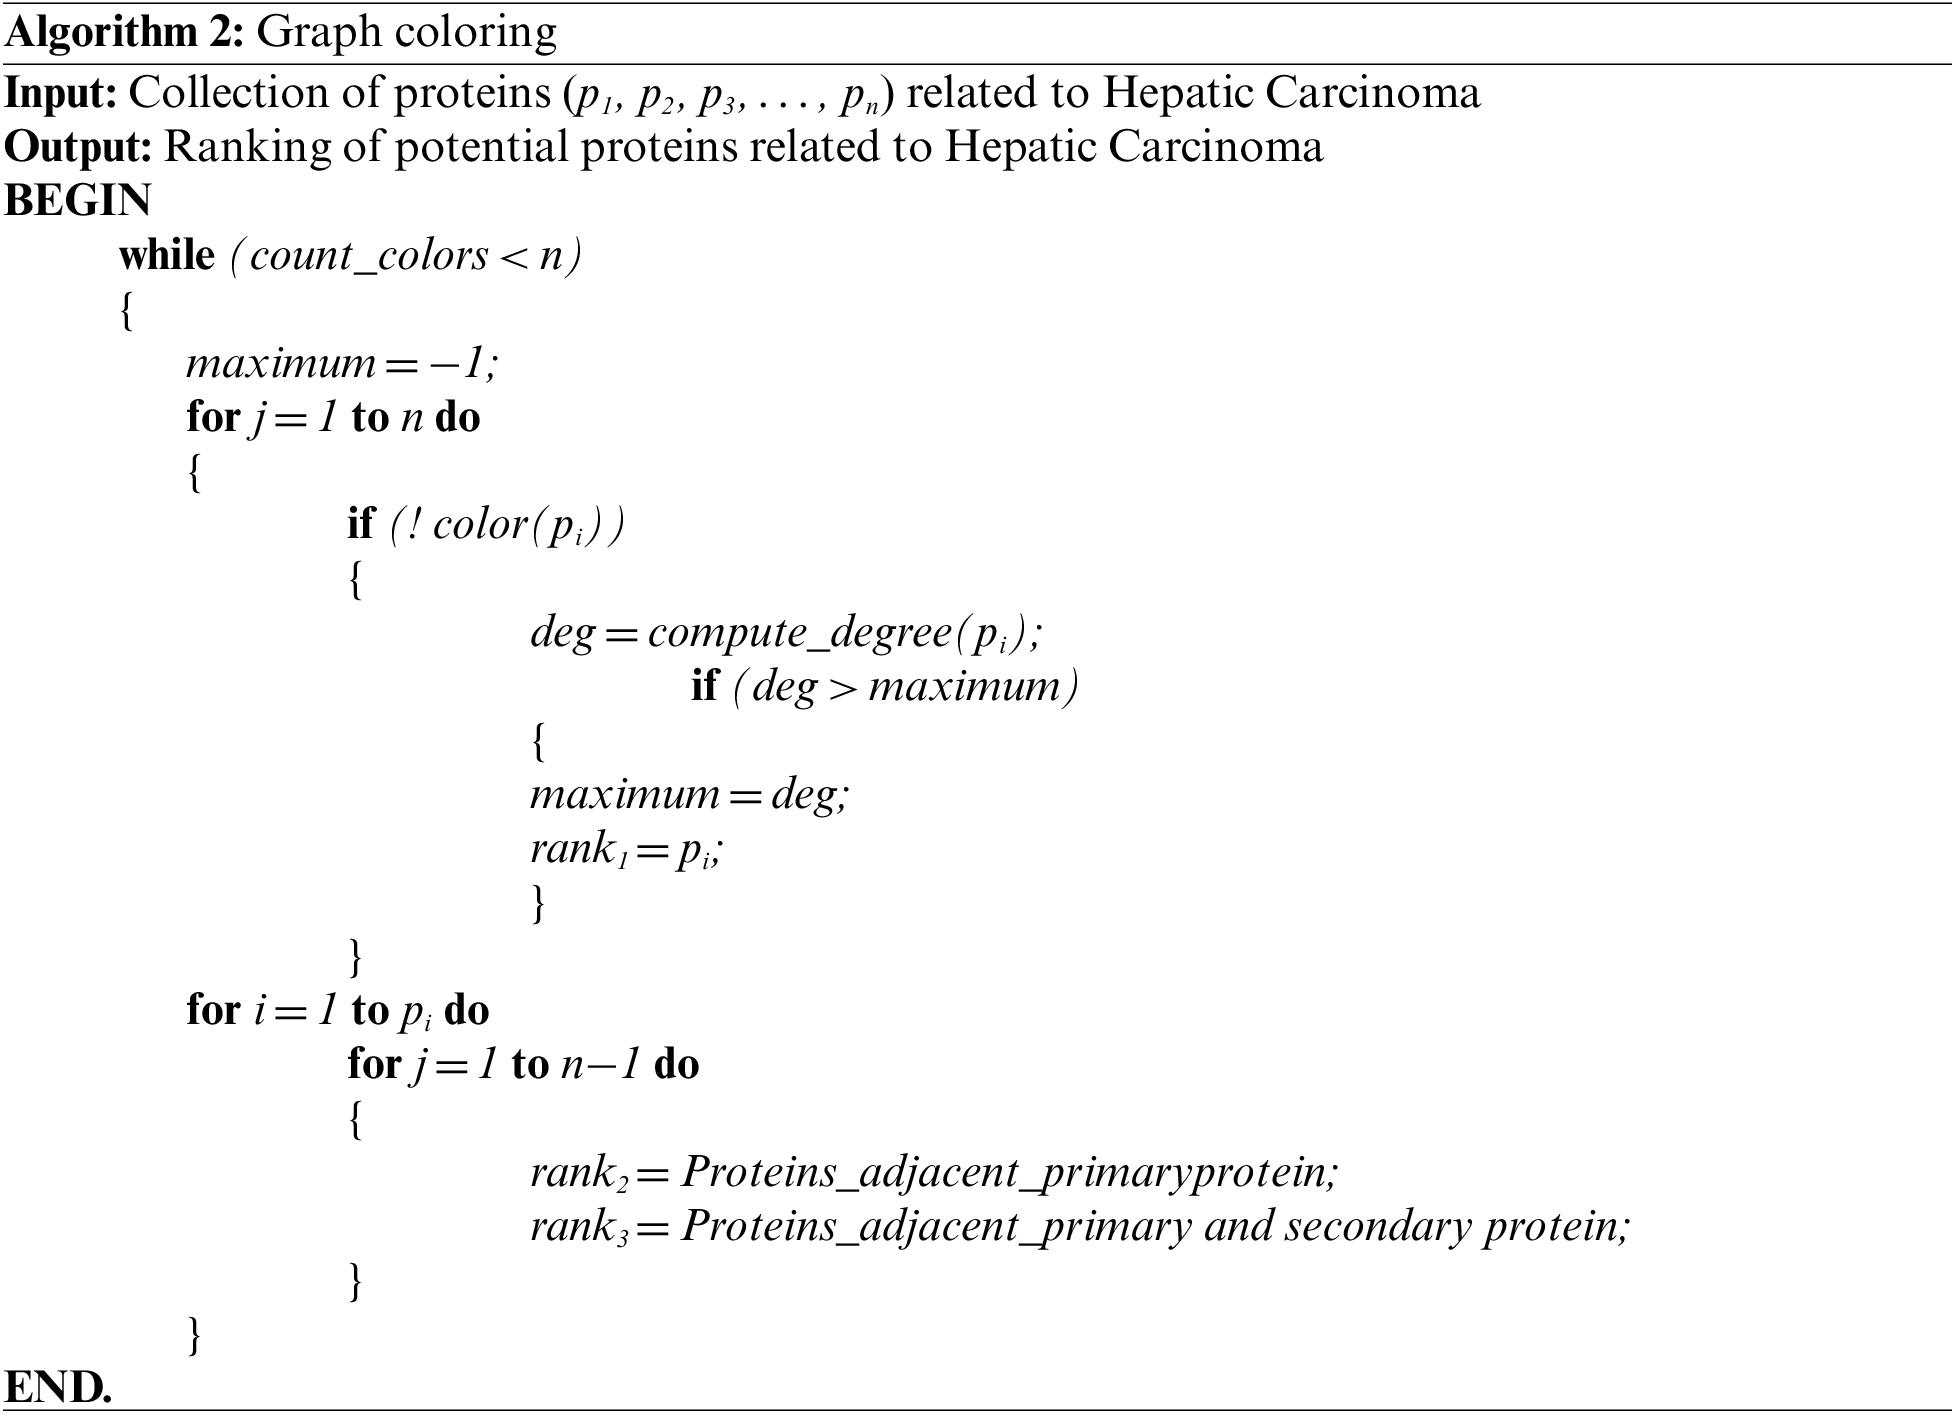
The proposed approach proceeds by coloring the protein identified in previous step with a unique color.
2.6 Construction of Positive and Negative Dataset
The set of positive datasets related to Hepatic Carcinoma has been collected from HCCDB Integrative Molecular Database. This database consists of gene expression related to Hepatic Carcinoma. The set of 317 positive samples has been identified and set of and set of 16,200 samples has been identifies as negative samples. Since there are many genes are under clinical test there are few samples in positive class and many samples in negative class. Since the dataset collected is highly imbalanced ANN model is used to evaluate the performance of the proposed model. The performance of the proposed and existing methods such as DC, BC, CC, IC, SC and NC has been compared to evaluate the performance of the proposed model.
Four models were trained and tested on the input dataset consisting of secondary protein features related to Hepatic Carcinoma. The same set of pre-processing has been applied for all the models. In this research paper six metrics such as Accuracy, precision, recall, F-score, sensitivity and specificity score were used to evaluate the performance of the proposed model. The ultimate task is to find the best performing model to predict the drug targets for Hepatic Carcinoma. Accuracy is one of the measures to assess the outcome of the essential protein prediction. Higher value of accuracy leads to improved essential protein prediction. Precision is the measure used to predict the accuracy of the proposed work. Higher the value of precision leads to improved essential protein prediction [20,21].
A signifies the number of real key target proteins classified accurately, B signifies the count of non-key target proteins incorrectly predicted as key target ones, C represents the count of non-key proteins accurately predicted as non-key target proteins, and D represents the count of accurate target proteins incorrectly neglected. Figs. 6 and 7 show the outcome of Graph Coloring algorithm.
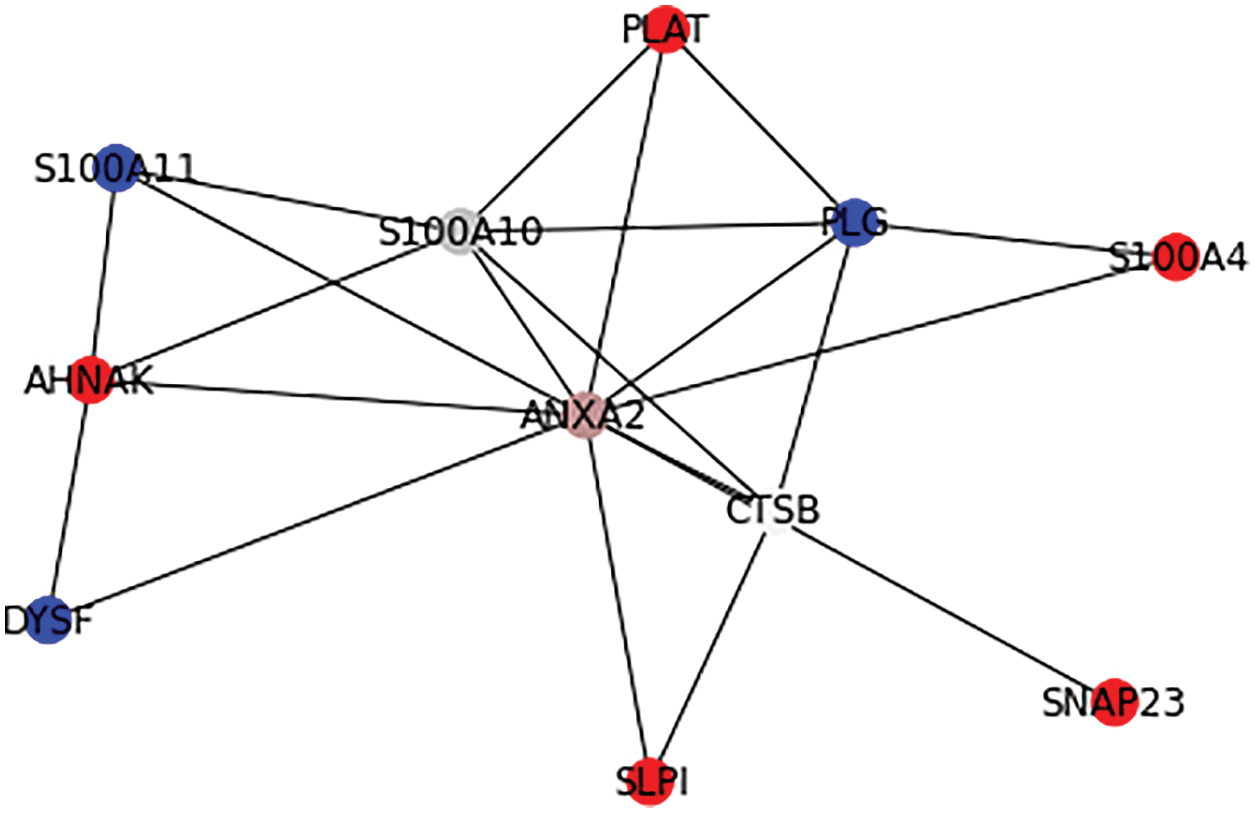
Figure 6: Application of Graph Coloring algorithm in PPI
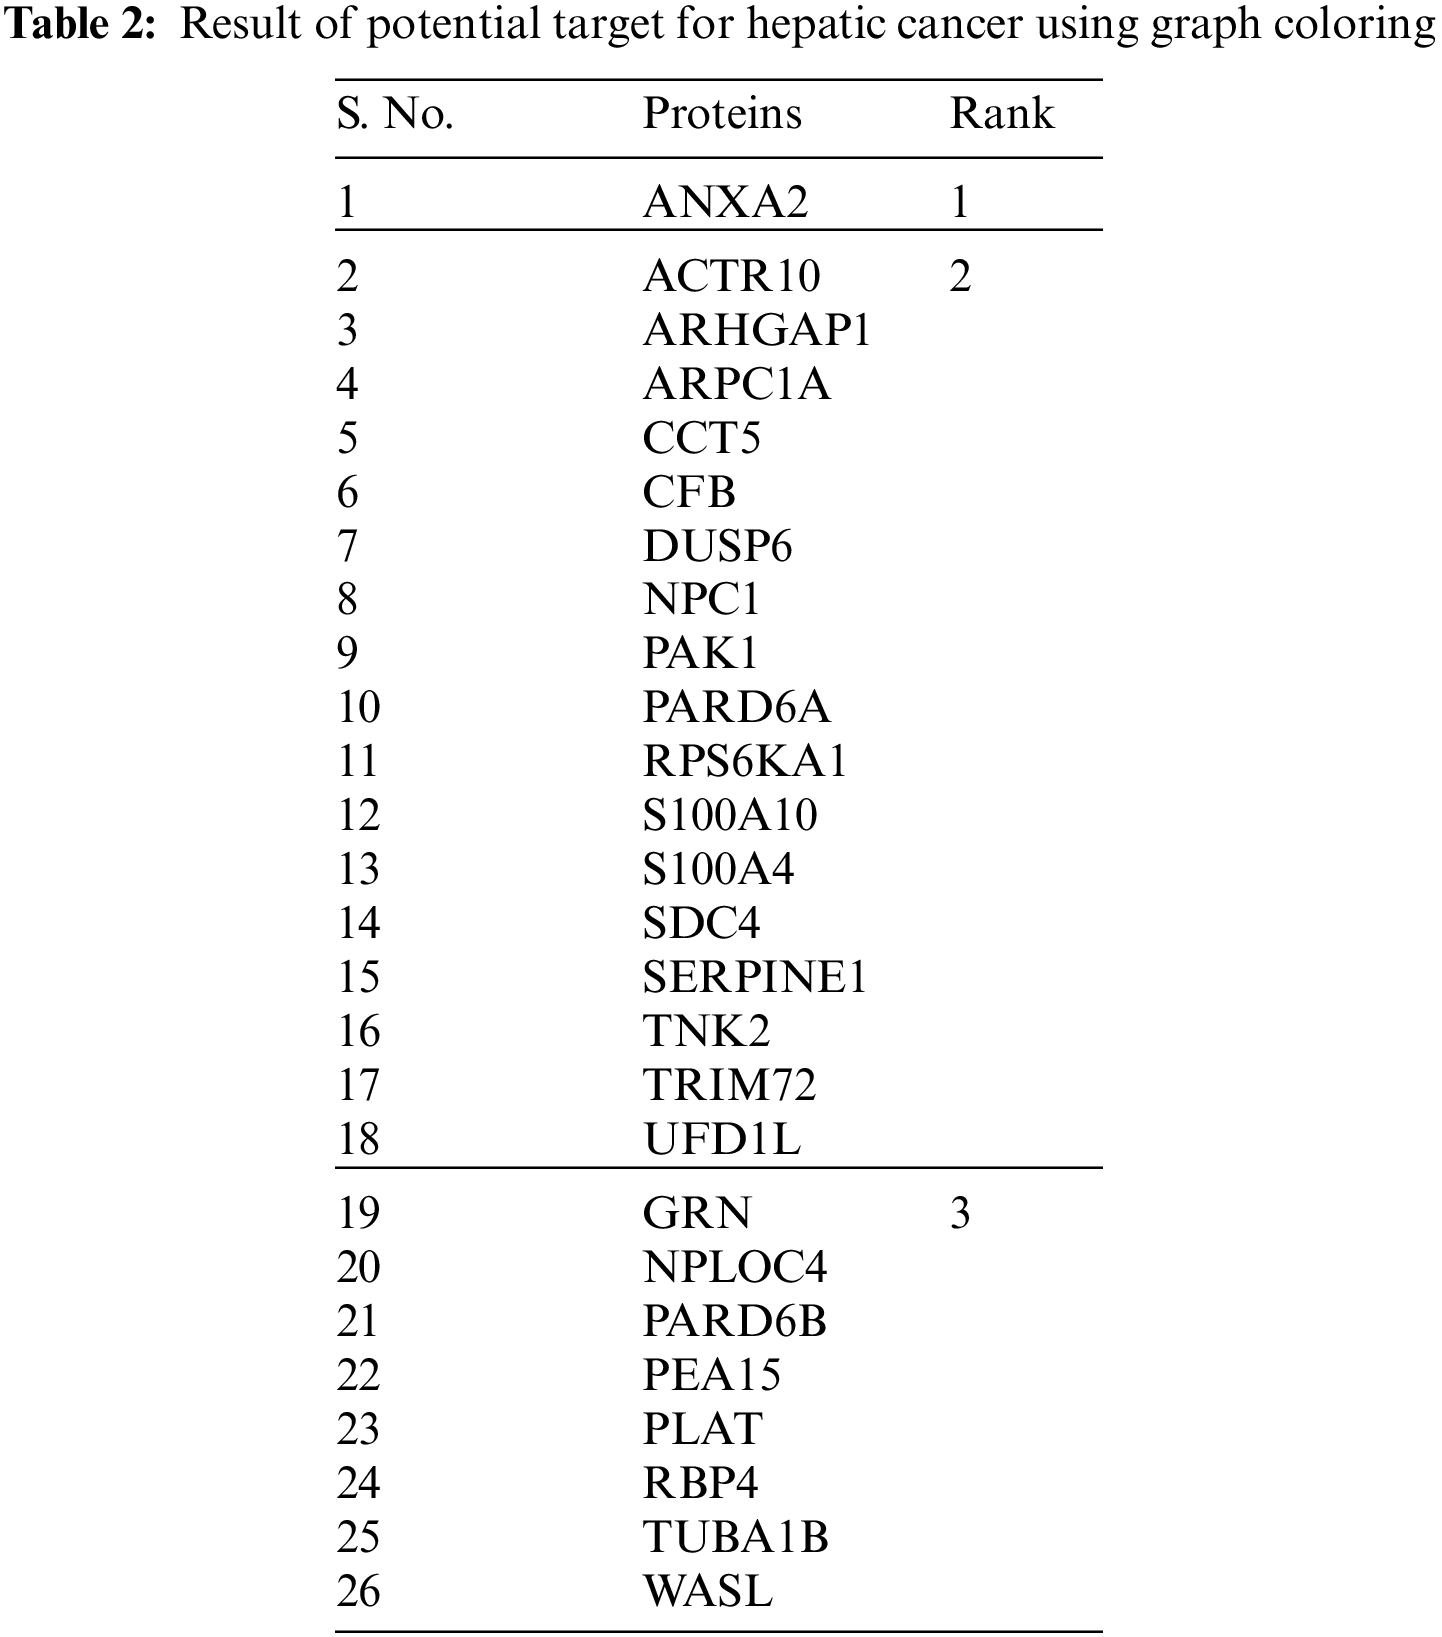
From Fig. 6, it is observable that ANXA2 protein has higher rank(rank1) and it is assigned a unique color and the primary interactions of ANXA2 such as ACTR10, ARHGAP1, ARPC1A, CCT5, CFB, DUSP6, NPC1, PAK1, PARD6A, RPS6KA1, S100A10, S100A4, SDC4, SERPINE1, TNK2, TRIM72, UFD1L proteins has next higher rank(rank2) according to the prediction of the proposed algorithm.
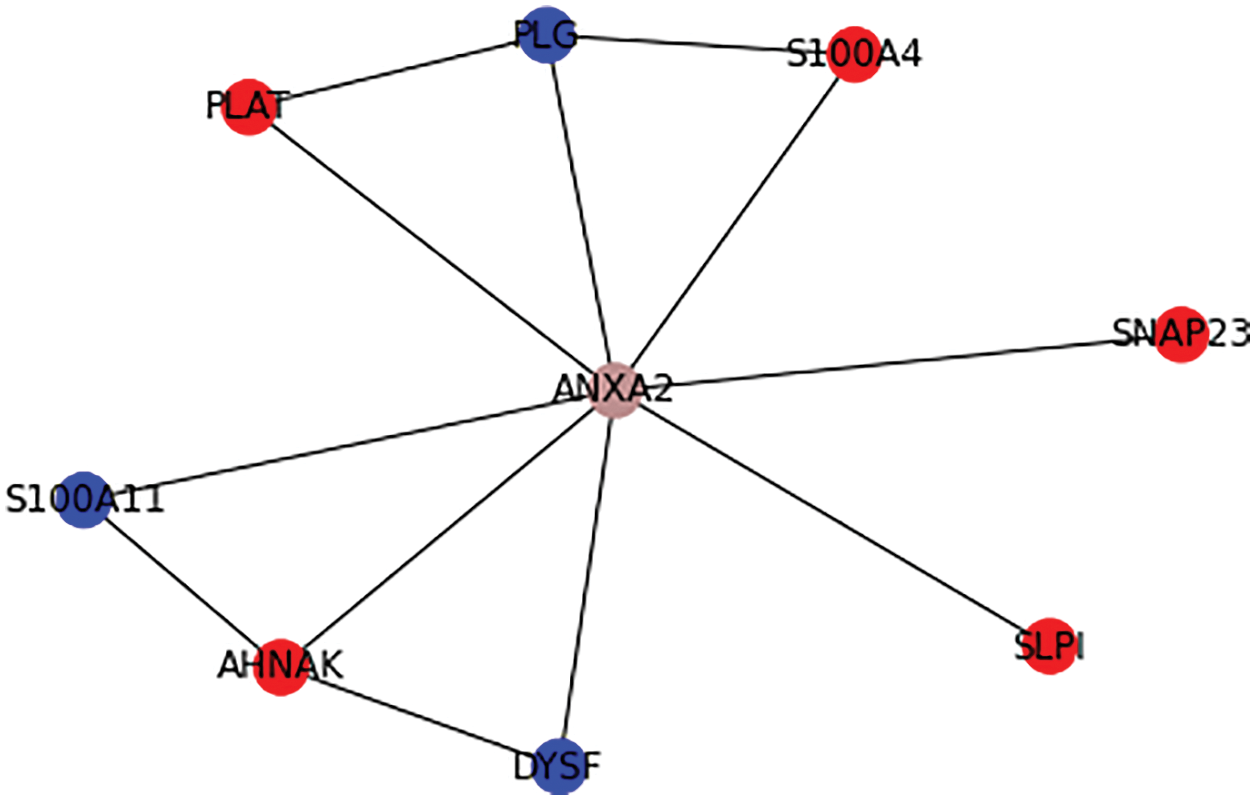
Figure 7: Ranking the possible drug target for hepatic cancer
Table 2 shows the tabulation of top ranked proteins related to Hepatic Carcinoma. The proteins are ranked according to the primary and secondary interactions between the proteins.
3.1 Analysis of DC-CG-ANN Model
Fig. 8A--8D show the Confusion matrix of proposed DC-CG-ANN model and the existing models. It is clearly visible that the proposed method shows remarkable improvement than existing methods. The following confusion matrices shows the experimental result evaluations of two classes, potential targets and non-potential targets of Hepatic Carcinoma. The confusion matrices shown below shows the performance of the potential target protein prediction model on the test set of secondary features of the protein. Confusion matrices of the DC-CG-ANN (Degree Centrality Graph Coloring ANN model and other models such as BC (Betweenness Centrality), CC (Closeness Centrality) and EC (Eigen Vector Centrality) models are shown below.
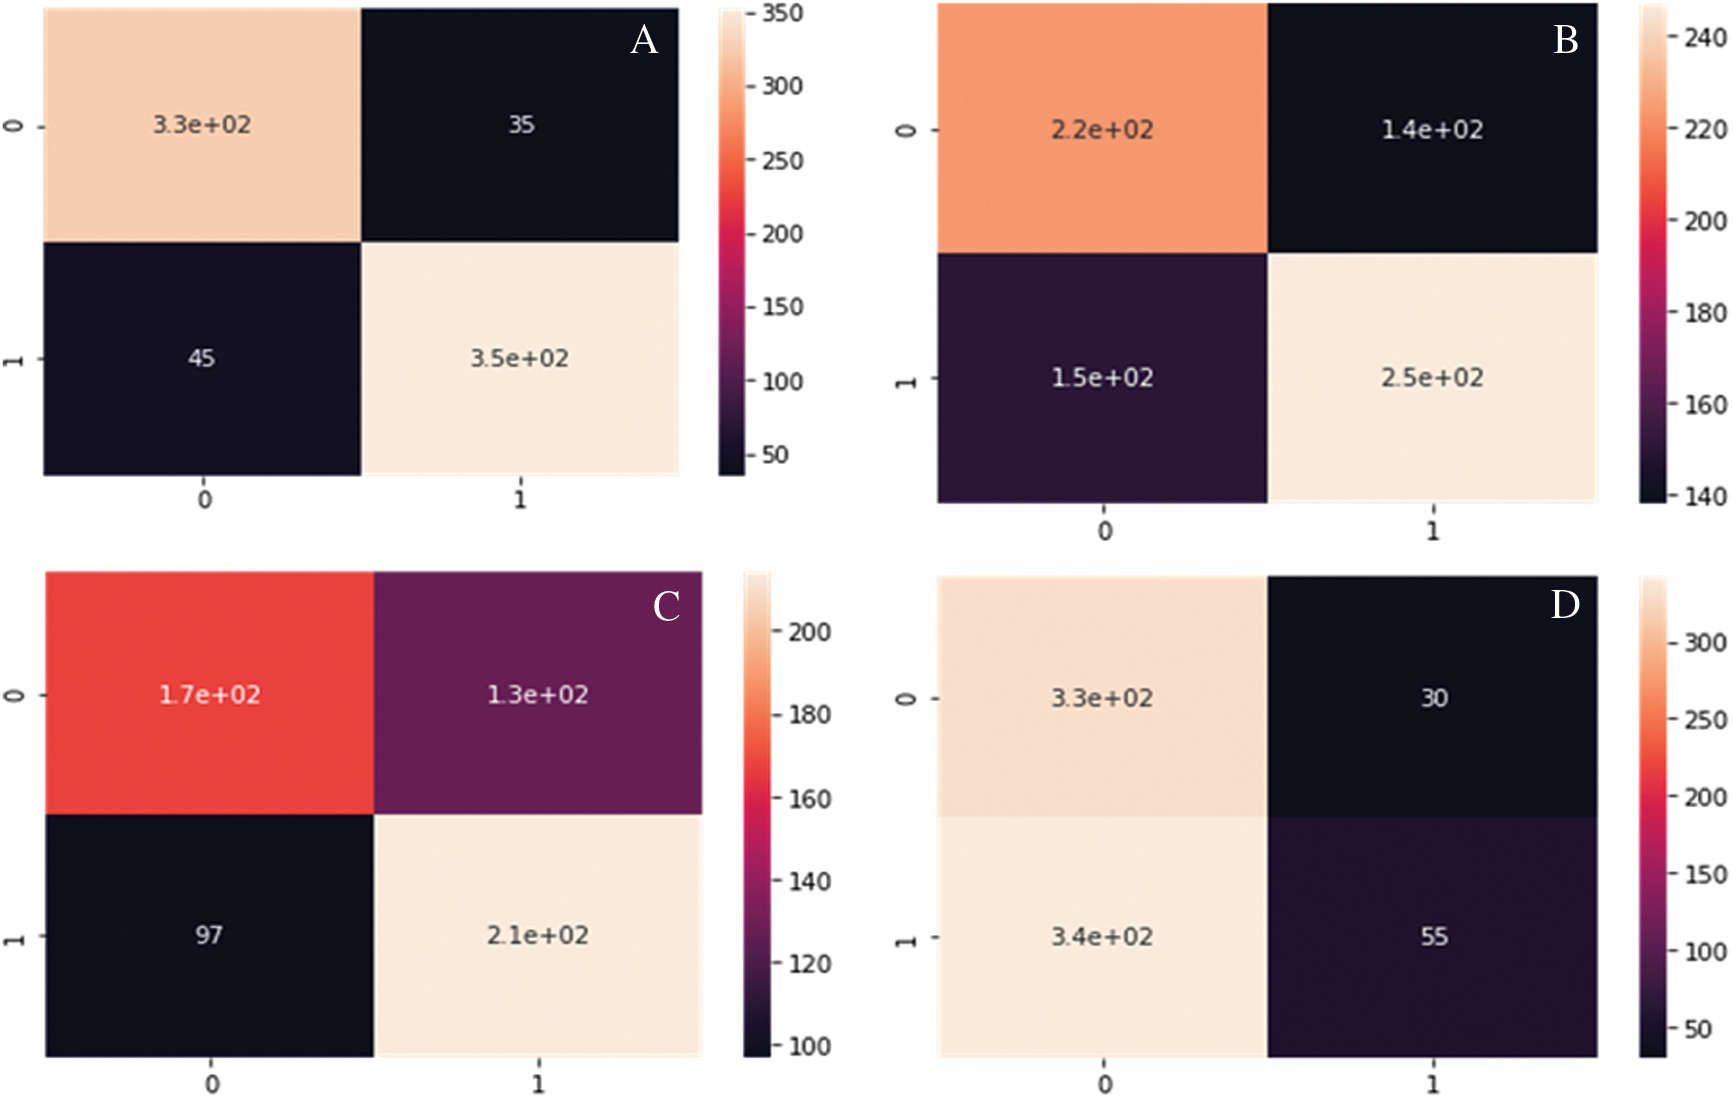
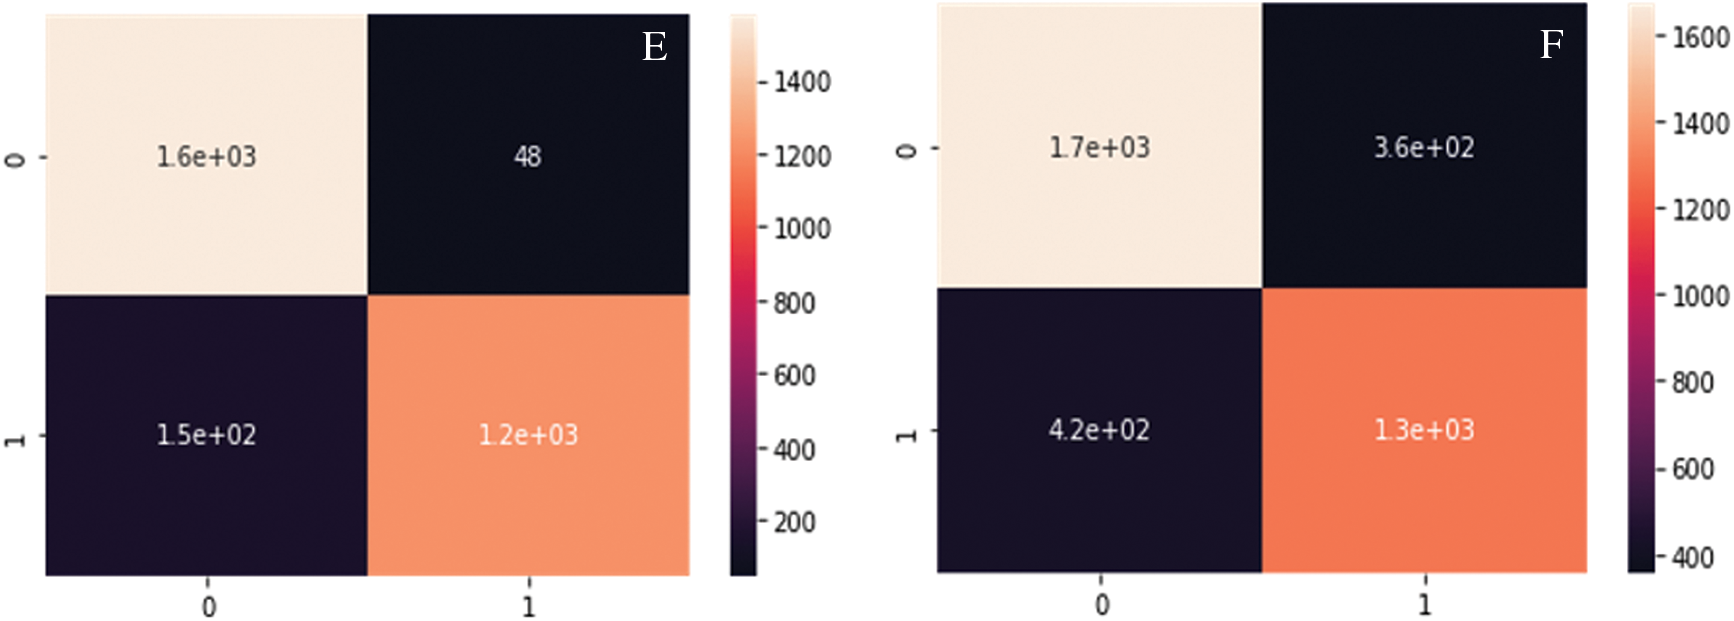
Figure 8: Confusion matrix developed using different mathematical modelling. A. DC-CG-ANN model, B. BC model. C. CC model, D. EC model, E. IC model F. SC model
Table 3 shows the summary of experimental results obtained using the average of 10 iterations of proposed and existing methods for String DB dataset. It is observable from the Table 3, the proposed shows the performance improvement of 5.7% than BC (Betweenness Centrality), 14.7% than CC (Closeness Centrality), 7.7% than EC (Eigen Vector), 5.7% than IC (Information Centrality), 4.7% than SC (Subgraph Centrality) and 5.7% than NC (Network Centrality) in accuracy. Similarly, the proposed model brings an improvement of 9% than BC (Betweenness Centrality), 9.5% than CC (Closeness Centrality), 6.7% than EC (Eigen Vector), 5% than IC (Information Centrality), 4% than SC (Subgraph Centrality) and 6% than NC (Network Centrality) in precision according to Fig. 9.
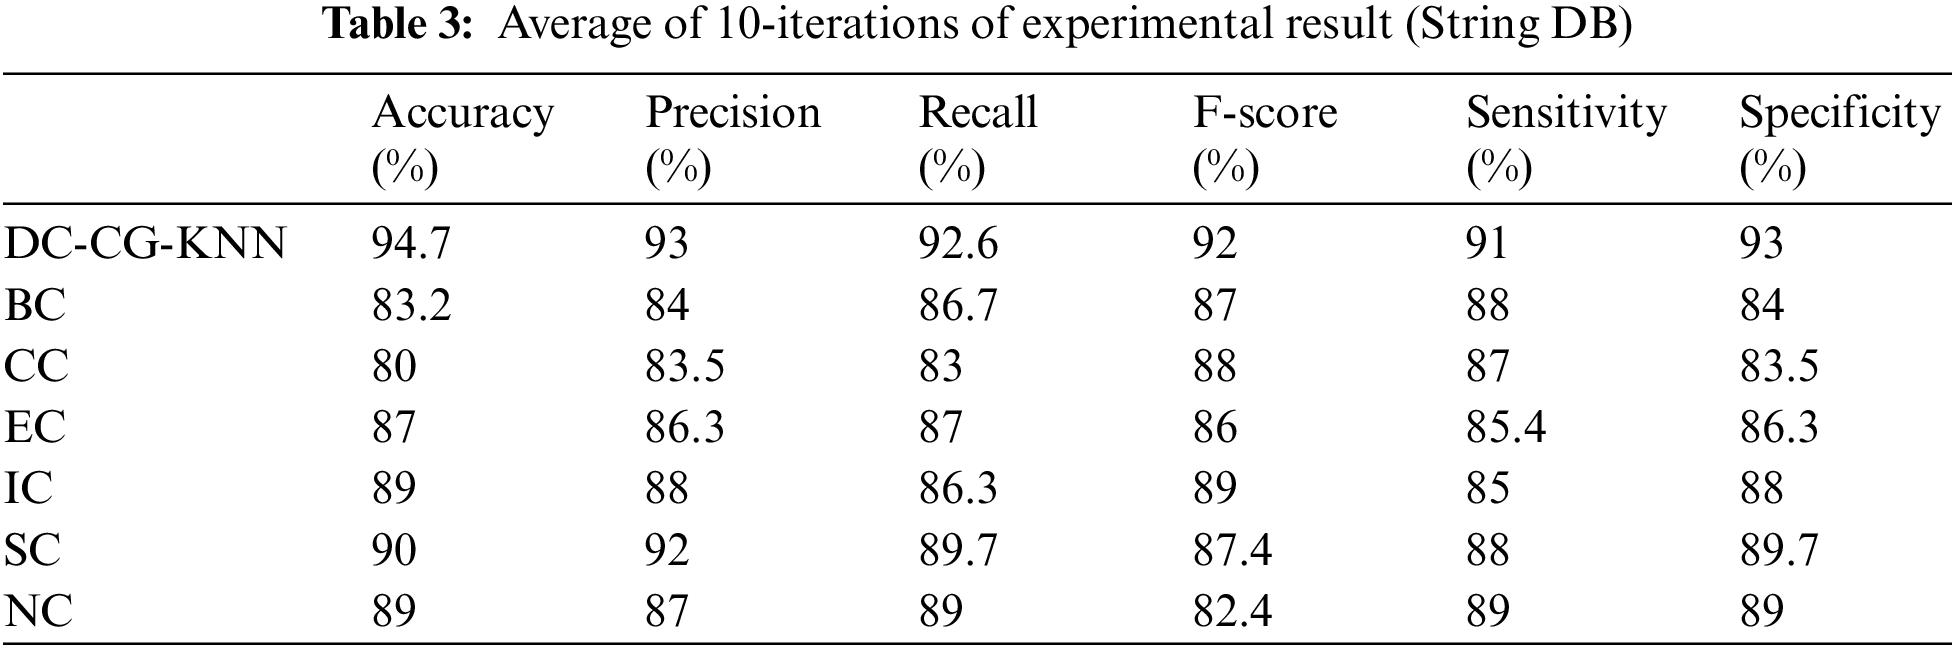
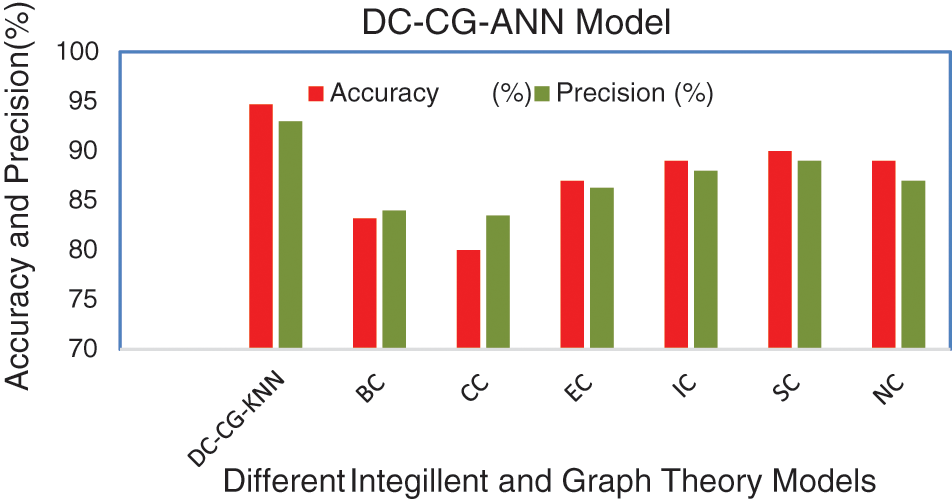
Figure 9: Comparison of accuracy and precision
Fig. 9 shows the performance comparison of different intelligent based prediction models for target protein prediction. It is also observable from Fig. 9, the proposed shows the performance improvement of 3% than BC (Betweenness Centrality), 4% than CC (Closeness Centrality), 5.6% than EC (Eigen Vector), 6% than IC (Information Centrality), 3% than SC (Subgraph Centrality) and 2% than NC (Network Centrality) in sensitivity. Similarly, the proposed model brings an improvement of 9% than BC (Betweenness Centrality), 9.5% than CC (Closeness Centrality), 6.7% than EC (Eigen Vector), 5% than IC (Information Centrality), 3.3% than SC (Subgraph Centrality) and 4% than NC (Network Centrality) in specificity according to Fig. 10.
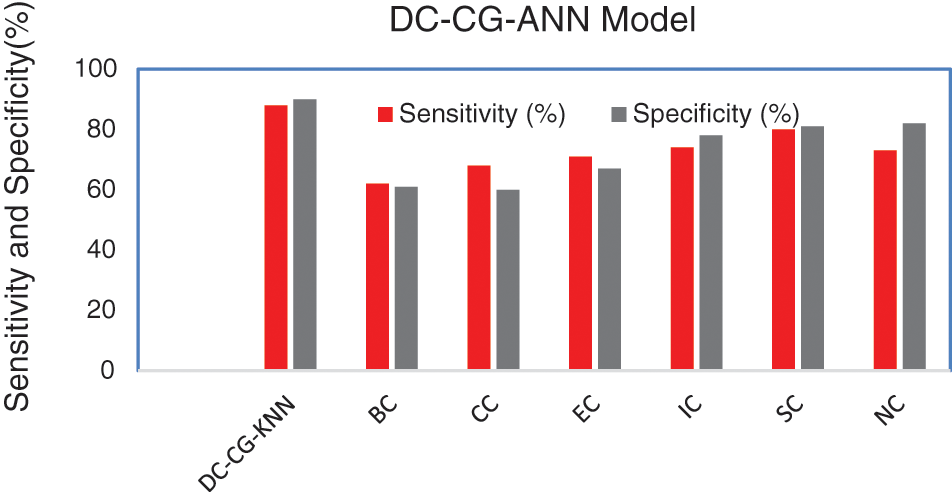
Figure 10: Comparison of sensitivity and specificity
Fig. 10 shows the performance comparison of different intelligent based prediction models for target protein prediction. On an average the proposed model brings an average sensitivity value of 3% than existing methods and 6.25% improvement in specificity that existing graph theory techniques. It is also observable from Fig. 9, the proposed shows the performance improvement of 5.9% than BC (Betweenness Centrality), 9.6% than CC (Closeness Centrality), 5.6% than EC (Eigen Vector), 6.3% than IC (Information Centrality), 2.9% than SC (Subgraph Centrality) and 3.6% than NC (Network Centrality) in sensitivity. Similarly, the proposed model brings an improvement of 5% than BC (Betweenness Centrality), 4% than CC (Closeness Centrality), 6% than EC (Eigen Vector), 3% than IC (Information Centrality), 4.6% than SC (Subgraph Centrality) and 9.6% than NC (Network Centrality) in specificity according to Fig. 11.
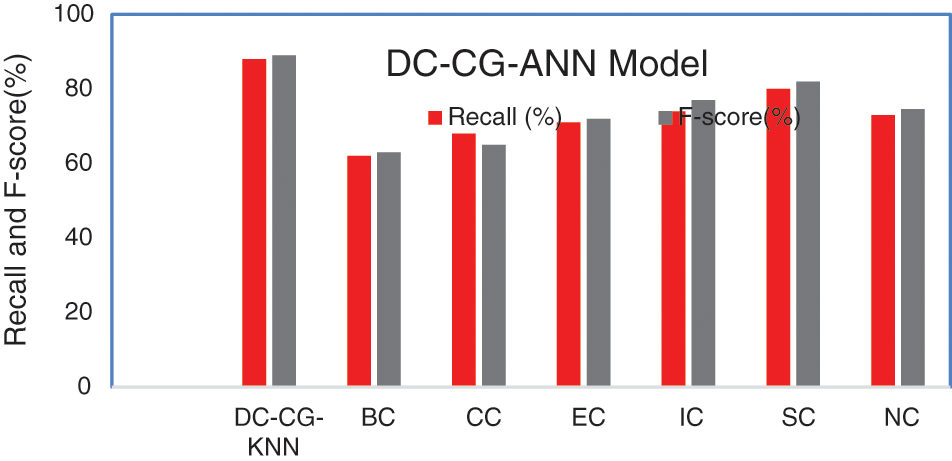
Figure 11: Comparison of recall and F-score
Fig. 10 shows the performance comparison of different Intelligent based prediction models for target protein prediction. On an average the proposed model brings an average sensitivity of 5.65% than existing methods and an average of specificity value of 5.36% improvement than existing graph theory and deep learning techniques.
It is observable from the Table 4, the proposed shows the performance improvement of 30% than BC (Betweenness Centrality), 28% than CC (Closeness Centrality), 19% than EC (Eigen Vector), 17% than IC (Information Centrality), 12% than SC (Subgraph Centrality) and 16% than NC (Network Centrality). In precision, the proposed model brings an improvement of 27% than BC (Betweenness Centrality), 29% than CC (Closeness Centrality), 24% than EC (Eigen Vector), 20% than IC (Information Centrality), 13% than SC, 15% (Subgraph Centrality) than NC (Network Centrality).
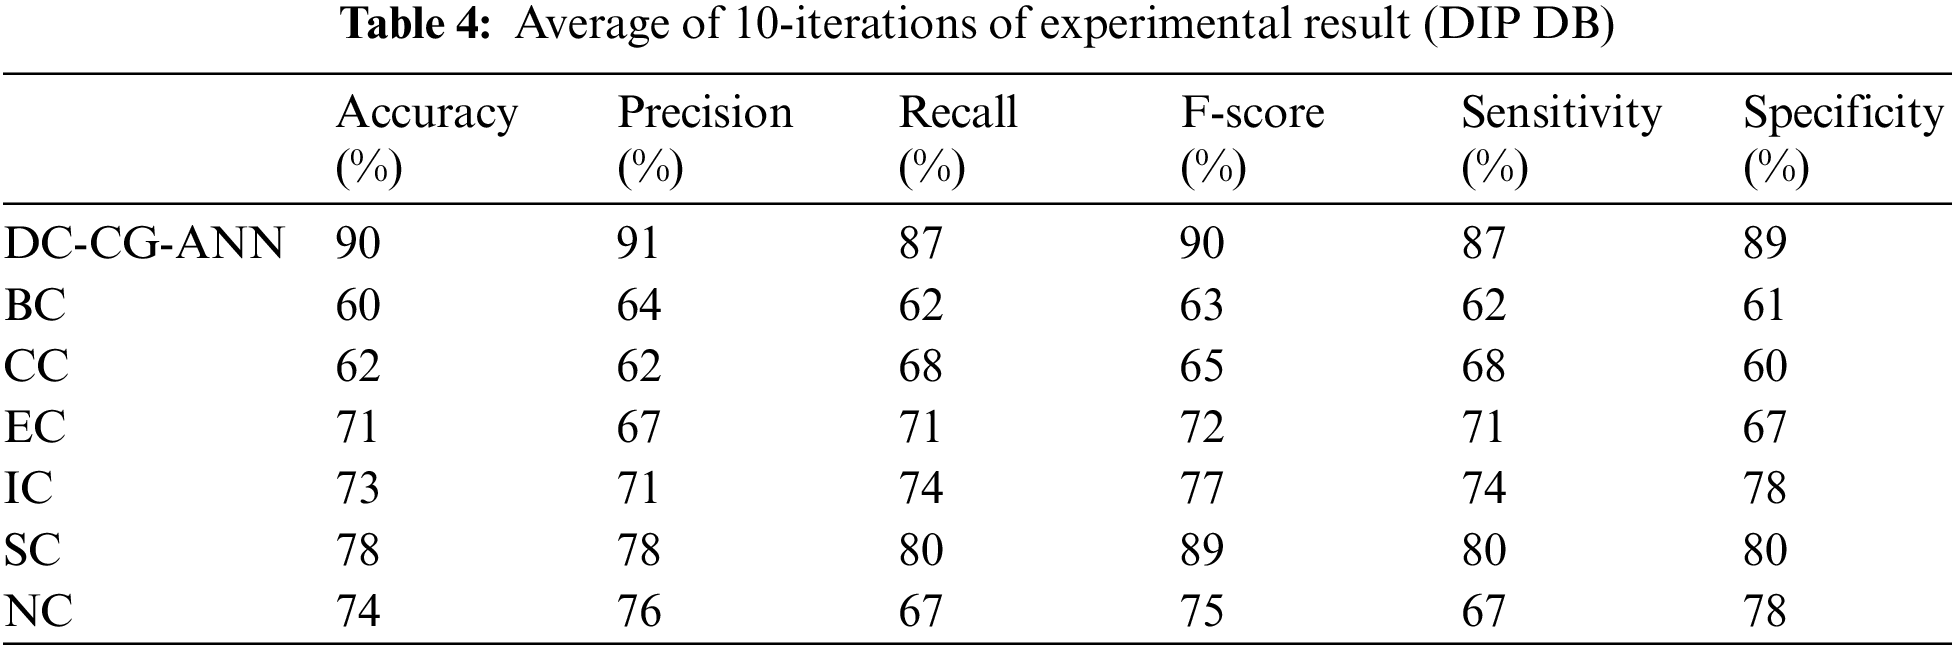
On an average the proposed model brings an improvement of 16.5% than existing computational methods for F-score, 17% improvement than existing computational models in terms of sensitivity and 18% improvement than existing computational models in terms of specificity.
In this research, a novel graph theory measure and Deep Learning techniques (DC-CG-ANN) have been employed to identify the potential target proteins associated with Hepatic Carcinoma using the topology of protein network and physiochemical properties. The proposed approach shows remarkable performance than existing centrality measure. It is also observed that the proposed model predicts 16 proteins associated with Hepatic Carcinoma and the outcome of the predicted proteins has been validated using machine learning technique. The proposed model also shows remarkable performance in terms of accuracy, precision, F-score, sensitivity and specificity. The proposed model can be improved in future by integrating a web interface for target protein prediction in various diseases.
Acknowledgement: The authors would like to thank the Deanship of Scientific Research at Taif University for the grant received for this research. This research was supported by Taif University with Research Grant (TURSP-2020/77).
Funding Statement: Taif University Researchers Supporting Project No. (TURSP-2020/77), Taif University, Taif, Saudi Arabia.
Conflicts of Interest: The authors declare that they have no conflicts of interest to report regarding the present study.
References
1. Chan, Y. K., Chen, Y. F., Pham, T., Chang, W., Hsieh, M. Y. (2018). Artificial intelligence in medical applications. Journal of Healthcare Engineering, 2018, 4827875. DOI 10.1155/2018/4827875. [Google Scholar] [CrossRef]
2. Amisha, P. M., Pathania, M., Rathaur, V. K. (2019). Overview of artificial intelligence in medicine. Journal of Family Medicine and Primary Care, 8(7), 2328. DOI 10.4103/jfmpc.jfmpc_440_19. [Google Scholar] [CrossRef]
3. Behne, T., Copur, M. S. (2012). Biomarkers for hepatocellular carcinoma. International Journal of Hepatology, 2012, 859076. DOI 10.1155/2012/859076. [Google Scholar] [CrossRef]
4. Sinibaldi, A. (2021). Cancer biomarker detection with photonic crystals-based biosensors: An overview. Journal of Lightwave Technology, 39(12), 3871–3881. DOI 10.1109/JLT.2021.3056225. [Google Scholar] [CrossRef]
5. Barderas, R., Srivastava, S., LaBaer, J. (2021). Protein microarray-based proteomics for disease analysis. Methods in Molecular Biology, 2344, 3–6. DOI 10.1007/978-1-0716-1562-1. [Google Scholar] [CrossRef]
6. Liu, Y., Zhou, K., Guo, S., Wang, Y., Ji, X. et al. (2021). NGS-Based accurate and efficient detection of circulating cell-free mitochondrial DNA in cancer patients. Molecular Therapy-Nucleic Acids, 23, 657–666. DOI 10.1016/j.omtn.2020.12.017. [Google Scholar] [CrossRef]
7. Huang, S., Yang, J., Fong, S., Zhao, Q. (2020). Artificial intelligence in cancer diagnosis and prognosis: Opportunities and challenges. Cancer Letters, 471, 61–71. DOI 10.1016/j.canlet.2019.12.007. [Google Scholar] [CrossRef]
8. Iqbal, M. J., Javed, Z., Sadia, H., Qureshi, I. A., Irshad, A. et al. (2021). Clinical applications of artificial intelligence and machine learning in cancer diagnosis: Looking into the future. Cancer Cell International, 21(1), 1–11. DOI 10.1186/s12935-021-01981-1. [Google Scholar] [CrossRef]
9. Nindrea, R. D., Aryandono, T., Lazuardi, L., Dwiprahasto, I. (2018). Diagnostic accuracy of different machine learning algorithms for breast cancer risk calculation: A meta-analysis. Asian Pacific Journal of Cancer Prevention, 19(7), 1747–1752. DOI 10.22034/APJCP.2018.19.7.1747. [Google Scholar] [CrossRef]
10. Ubaidillah, S. H. S. A., Sallehuddin, R., Ali, N. A. (2013). Cancer detection using aritifical neural network and support vector machine: A comparative study. Jurnal Teknologi, 65(1), 73–81. DOI 10.11113/jt.v65.1788. [Google Scholar] [CrossRef]
11. Alanazi, S. A., Kamruzzaman, M. M., Islam Sarker, M. N., Alruwaili, M., Alhwaiti, Y. et al. (2021). Boosting breast cancer detection using convolutional neural network. Journal of Healthcare Engineering, 2021, 5528622. DOI 10.1155/2021/5528622. [Google Scholar] [CrossRef]
12. Cruz, J. A., Wishart, D. S. (2006). Applications of machine learning in cancer prediction and prognosis. Cancer Informatics, 2, 59–77. DOI 10.1177/117693510600200030. [Google Scholar] [CrossRef]
13. Ahn, J. C., Connell, A., Simonetto, D. A., Hughes, C., Shah, V. H. (2021). Application of artificial intelligence for the diagnosis and treatment of liver diseases. Hepatology, 73(6), 2546–2563. DOI 10.1002/hep.31603. [Google Scholar] [CrossRef]
14. Khemlina, G., Ikeda, S., Kurzrock, R. (2017). The biology of hepatocellular carcinoma: Implications for genomic and immune therapies. Molecular Cancer, 16(1), 1–10. DOI 10.1186/s12943-017-0712-x. [Google Scholar] [CrossRef]
15. McGlynn, K. A., Petrick, J. L., London, W. T. (2015). Global epidemiology of hepatocellular carcinoma: An emphasis on demographic and regional variability. Clinics in Liver Disease, 19(2), 223–238. DOI 10.1016/j.cld.2015.01.001. [Google Scholar] [CrossRef]
16. Attwa, M. H., El-Etreby, S. A. (2015). Guide for diagnosis and treatment of hepatocellular carcinoma. World Journal of Hepatology, 7(12), 1632. DOI 10.4254/wjh.v7.i12.1632. [Google Scholar] [CrossRef]
17. Danon, L., Ford, A. P., House, T., Jewell, C. P., Keeling, M. J. et al. (2011). Networks and the epidemiology of infectious disease. Interdisciplinary Perspectives on Infectious Diseases, 2011, 284909. DOI 10.1155/2011/284909. [Google Scholar] [CrossRef]
18. Szklarczyk, D., Gable, A. L., Lyon, D., Junge, A., Wyder, S. et al. (2019). STRING v11: Protein–protein association networks with increased coverage, supporting functional discovery in genome-wide experimental datasets. Nucleic Acids Research, 47(D1), D607–D613. DOI 10.1093/nar/gky1131. [Google Scholar] [CrossRef]
19. Lian, Q., Wang, S., Zhang, G., Wang, D., Luo, G. et al. (2018). HCCDB: A database of hepatocellular carcinoma expression atlas. Genomics, Proteomics & Bioinformatics, 16(4), 269–275. DOI 10.1016/j.gpb.2018.07.003. [Google Scholar] [CrossRef]
20. Narmadha, D., Pravin, A. (2019). An intelligent computational model to predict target genes for infectious disease. 2019 11th International Conference on Advanced Computing (ICoAC), pp. 346–349. Chennai, Tamilnadu, India. [Google Scholar]
21. Sundar, G. N., Narmadha, D. (2021). An automated model for target protein prediction in PPI. Current Bioinformatics, 16(4), 601–609. DOI 10.2174/1574893615999200831142241. [Google Scholar] [CrossRef]
22. Ashour, A. S., Dey, N., Le, D. N. (2017). Biological data mining: Techniques and applications. Mining Multimedia Documents, 1(4), 161–172. DOI 10.1201/9781315399744. [Google Scholar] [CrossRef]
23. Le Van, C., Le Nguyen, B., Puri, V., Thao, N. T., Le, D. N. (2021). Detecting lumbar implant and diagnosing scoliosis from Vietnamese X-ray imaging using the pre-trained API models and transfer learning. Computers, Materials & Continua, 66(1), 17–33. DOI 10.32604/cmc.2020.013125. [Google Scholar] [CrossRef]
24. Doss, S., Paranthaman, J., Gopalakrishnan, S., Duraisamy, A., Pal, S. et al. (2021). Memetic optimization with cryptographic encryption for secure medical data transmission in IoT-based distributed systems. Computers, Materials & Continua, 66(2), 1577–1594. DOI 10.32604/cmc.2020.012379. [Google Scholar] [CrossRef]
25. Nguyen, P. T., Huynh, V. D. B., Vo, K. D., Phan, P. T., Elhoseny, M. et al. (2021). Deep learning based optimal multimodal fusion framework for intrusion detection systems for healthcare data. Computers, Materials & Continua, 66(3), 2555–2571. DOI 10.32604/cmc.2021.012941. [Google Scholar] [CrossRef]
26. Yang, X., Yang, S., Li, Q., Wuchty, S., Zhang, Z. (2020). Prediction of human-virus protein-protein interactions through a sequence embedding-based machine learning method. Computational and Structural Biotechnology Journal, 18, 153–161. DOI 10.1016/j.csbj.2019.12.005. [Google Scholar] [CrossRef]
27. Cheng, Y., Wang, K., Geng, L., Sun, J., Xu, W. et al. (2019). Identification of candidate diagnostic and prognostic biomarkers for pancreatic carcinoma. eBioMedicine, 40, 382–393. DOI 10.1016/j.ebiom.2019.01.003. [Google Scholar] [CrossRef]
28. Zhong, J., Tang, C., Peng, W., Xie, M., Sun, Y. et al. (2021). A novel essential protein identification method based on PPI networks and gene expression data. BMC Bioinformatics, 22(1), 1–21. DOI 10.1186/s12859-021-04175-8. [Google Scholar] [CrossRef]
29. Kaur, J., Khan, A. I., Abushark, Y. B., Alam, M. M., Khan, S. A. et al. (2020). Security risk assessment of healthcare web application through adaptive neuro-fuzzy inference system: A design perspective. Risk Management and Healthcare Policy, 13, 355--371. DOI 10.2147/RMHP.S233706. [Google Scholar] [CrossRef]
30. Sahu, K., Alzahrani, F. A., Srivastava, R. K., Kumar, R. (2021). Evaluating the impact of prediction techniques: Software reliability perspective. Computers, Materials & Continua, 67(2), 1471–1488. DOI 10.32604/cmc.2021.014868. [Google Scholar] [CrossRef]
31. Sahu, K., Srivastava, R. K. (2019). Revisiting software reliability. Data Management, Analytics and Innovation, 808(1), 221–235. DOI 10.1007/978-981-13-1402-5. [Google Scholar] [CrossRef]
32. Zardecki, C., Dutta, S., Goodsell, D. S., Lowe, R., Voigt, M. et al. (2022). PDB-101: Educational resources supporting molecular explorations through biology and medicine. Protein Science, 31, 129–140. DOI 10.1002/pro.4200. [Google Scholar] [CrossRef]
 | This work is licensed under a Creative Commons Attribution 4.0 International License, which permits unrestricted use, distribution, and reproduction in any medium, provided the original work is properly cited. |