| Computer Modeling in Engineering & Sciences |
DOI: 10.32604/cmes.2022.021383
ARTICLE
A Multi-Scale Grasp Detector Based on Fully Matching Model
School of Engineering Science, University of Science and Technology of China, Hefei, 230027, China
*Corresponding Authors: Erbao Dong. Email: ebdong@ustc.edu.cn; Heng’an Wu. Email: wuha@ustc.edu.cn
Received: 11 January 2022; Accepted: 17 March 2022
Abstract: Robotic grasping is an essential problem at both the household and industrial levels, and unstructured objects have always been difficult for grippers. Parallel-plate grippers and algorithms, focusing on partial information of objects, are one of the widely used approaches. However, most works predict single-size grasp rectangles for fixed cameras and gripper sizes. In this paper, a multi-scale grasp detector is proposed to predict grasp rectangles with different sizes on RGB-D or RGB images in real-time for hand-eye cameras and various parallel-plate grippers. The detector extracts feature maps of multiple scales and conducts predictions on each scale independently. To guarantee independence between scales and efficiency, fully matching model and background classifier are applied in the network. Based on analysis of the Cornell Grasp Dataset, the fully matching model can match all labeled grasp rectangles. Furthermore, background classification, along with angle classification and box regression, functions as hard negative mining and background predictor. The detector is trained and tested on the augmented dataset, which includes images of 320 × 320 pixels and grasp rectangles ranging from 20 to more than 320 pixels. It performs up to 98.87% accuracy on image-wise dataset and 97.83% on object-wise split dataset at a speed of more than 22 frames per second. In addition, the detector, which is trained on a single-object dataset, can predict grasps on multiple objects.
Keywords: Grasp detection; deep convolutional neural network; anchor box; parallel-plate gripper
Robotic grasping is becoming more challenging nowadays, as robots are indispensable in both industrial and domestic environments. High-precision robotic manipulation [1] and various grippers, such as vacuum and soft grippers [2–5], make demands for efficient grasp strategies. Traditionally, grasp detection consists of object localization, pose estimation and grasp estimation [6]. Object localization aims at finding locations of target objects in the given data. In this part, object detection [7–17], object segmentation [18,19] and object localization without classification [20–24] are the widely used approaches. The 6D pose estimation is to reconstruct objects in a camera coordinate system [25–28]. Given reliable object models, grasp estimation is carried out. Analytical methods are firstly proposed to evaluate the ability of the applied grasp to resist external disturbance, which is defined as force closure [29,30]. Meanwhile, combining humanlike robotic hands and analytical methods, stable and precise grasps are conducted in both simulated and real-world problems [31]. Some of other studies focus on grasp positions and styles [32] directly. However, the approaches above cost time and require models of high quality. It puts forward requirements for quick detection and easy application.
Utilizing convolutional neural networks and various datasets, empirical approaches take fewer stages and less time to generate the final grasp detection. Criteria and labeled data are abstracted from previous studies and used for training. For novel objects or those without the entire information, some of the methods generate candidate grasps with contact points based on point clouds [33,34]. In other cases where complete 3D models are provided, approaches learn grasp gestures or positions that are applied on the whole object [35,36]. Although grasp detection for multi-fingered robotic hands is reliable in most conditions, it relies heavily on the completeness of the model and is still not fast enough. Considering that rigid objects are the main targets in most cases, specialized algorithms are designed for vacuum and parallel-plate grippers to perform real-time grasp. Mahler et al. [2,3] trained a Grasp Quality Convolutional Neural Network on Dex-Net 3.0, which is a dataset containing 2.8 million pieces of point clouds and labels for suction grippers. Jiang et al. [37] proposed an efficient five-dimensional representation method for parallel-plate grippers, laying the foundation for the proceeding works. With grasps expressed as
In this paper, a one-stage multi-scale grasp detector is proposed. This network utilizes several feature maps of different scales to independently predict grasps, according to SSD [7] and FPN [8]. Top-down pathways are added between multi-scale features to improve the performance of high-resolution features. Improvements also include an efficient fully matching model designed for boxes from different scales based on analysis of the Cornell Grasp Dataset [44]. Anchor boxes in every single layer are arranged as oriented anchor boxes [47] with different directions and ground truth (GT) boxes are replaced by cover boxes, which guarantees that matching scores are consistent with the similarity of center position and size between every two boxes. A background predictor is designed along with grasp classification and box regression [45]. This mechanism separates the possible grasp region from grasp prediction and also prevents the network from considering labels emanating from other scales as negative examples in training as well. Contributions are summarized as follows:
• A multi-scale object detector is applied in grasp detection, consisting of multiple feature maps and effective connections between layers.
• An efficient fully matching model based on dataset analysis is proposed to ensure a high-quality combination between anchor boxes and labels from all scales.
• A branch of the background classifier functions as hard negative mining and enhances the generalization ability of the network.
In the following parts, Section 2 presents researches related to grasp detection, convolutional neural networks and anchor boxes. The proposed matching model and multi-scale grasp detector are presented in Sections 3 and 4, respectively. The evaluation metric and experiment details are given in Section 5. In Sections 6 and 7, results are analyzed and conclusions are drawn.
2.1 Object and Grasp Detections
Neural networks have been used in many fields, such as medicine [54–56] and material analysis [57]. Object detection is one of the widely studied issues, which predicts classification and bounding boxes on input data. Recent researches about grasp detections are based on two main approaches of object detectors, two-and one-stage detectors [58]. The training process of two-stage detectors generates predictions from coarse to fine. RCNN [9] proposed the first two-stage style, which extracted object proposals by selective search, put resized feature maps into a CNN network and used linear SVMs for final predictions. To reuse feature maps, SPPNet [10] introduced a Spatial Pyramid Pooling layer, which did feature computation only once. Fast RCNN [11] replaced SVM training with neural networks and realized training end-to-end after selective search. Faster RCNN [12] abandoned the time-consuming selective search and introduced Region Proposal Network (RPN), which firstly trained a two-stage object detector end-to-end. One-stage object detectors make predictions only in one step. YOLO [13] employed a new strategy to evenly divide feature maps and make predictions on each grid simultaneously, which achieved an unprecedentedly fast speed. SSD [7] used a feature pyramid and made predictions independently on each different feature map, significantly improving the accuracy of one-stage methods to detect small targets. FPN [8] and RetinaNet [15] were proposed to improve the accuracy for multi-scale object detection of both two-and one-stage detectors. Most of the works that followed, applied object detectors for their tasks. Zheng et al. [59] applied FPN for parking space detection on street. Ma et al. [60] adapted Faster RCNN to detect pavement cracks. Different from previous works, DiTNet [61] used 3D point clouds to directly track ID to objects.
Similar to object detection and its applications, studies on grasp detection using neural networks began with a two-stage detector. Lenz et al. [44] proposed a model consisting of two neural networks for grasp proposals and scores respectively, which was the first two-stage detector to be realized completely using a neural network. Shortly after that invention, Redmon et al. [45] presented a direct regression grasp model, which was the first one-stage detector even before YOLO. The following approaches include two-stage methods [40–43] and one-stage methods [47–51]. Two-stage networks were usually adapted based on specific grasp strategies. Chu et al. [40] adapted RPN for grasp candidate proposals. Dong et al. [41] segmented mask area and then generated grasp predictions. Wang et al. [42] used RGB data for grasp proposals and merged point cloud data for final proposals. Furthermore, most models in previous studies used pre-trained feature extractors.
Anchor boxes are pre-defined boxes that help precisely predict bounding boxes in object detection. Early researches [43–46] used direct regression, which directly generates coordinates of predicted boxes from fully connected layers. Ren et al. [12] proposed sliding windows and anchors for region proposal network in Faster RCNN. A sliding window went over all grid cells of feature maps and anchor boxes of 3 scales and 3 aspect ratios were centered at the sliding window. Intersection-over-union (IoU) was the used metric for matching between anchor and GT boxes, shown as Eq. (1).
Anchor boxes with IoU higher than the threshold were labeled as positive examples. Giving scores and parameterized coordinates to anchors, region proposals were generated by transforming pre-defined anchor boxes. This approach mapped relative positions of features to those of real images and used a box regression method to train parameterized coordinates. SSD [7] designed anchor boxes of linearly increasing sizes for increasing scales while YOLO9000 [14] used k-means to generate anchor boxes based on datasets. Different from object detection, grasp detection considers angles and aspect ratios of GT boxes, which largely affect the average IoU during matching. Guo et al. [38] divided 180° into 18 classes and applied anchor boxes of 3 scales at each feature map grid. Zhou et al. [47] took a different strategy using oriented anchor boxes of several directions and adding angle prediction to box regression. As angle regression provided more precise angle prediction, fewer angle categories were required. Therefore, oriented anchor boxes are used in the following works [39,49,50].
The five-dimensional representation uses
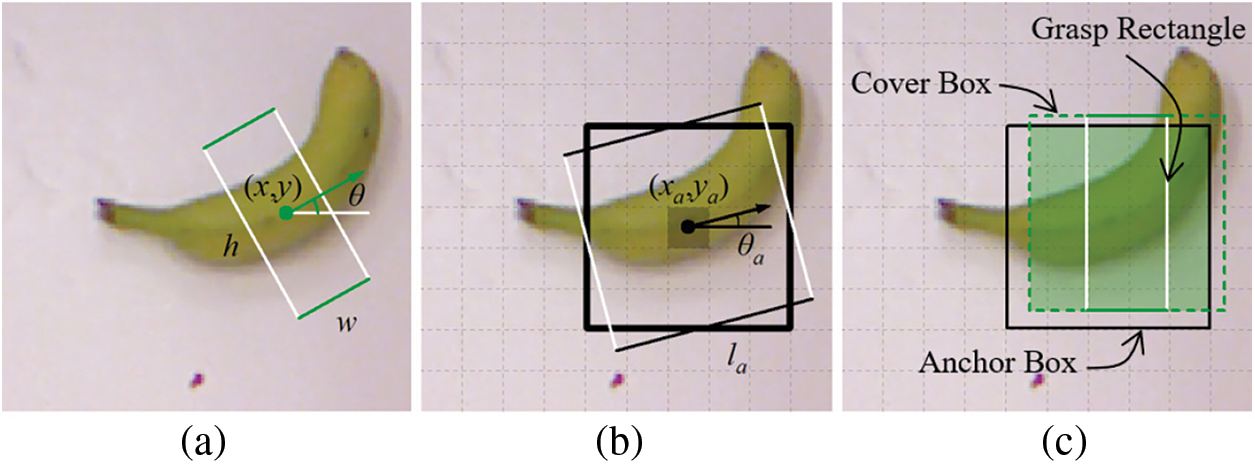
Figure 1: (a) A grasp rectangle. (b) Grouped anchor boxes. (c) Matching between a cover box and an anchor box
Like most studies conducted previously, Cornell Grasp Dataset, which consists of 885 images from 240 objects, is used in this research. Each object has several images containing RGB and point cloud information. For each image, multiple positive grasp rectangles are labeled and few negative grasps are given as well. Here only positive ones are included in the training.
In object detection tasks, a bounding box represents the smallest box that covers the whole object. Since bounding boxes are represented as
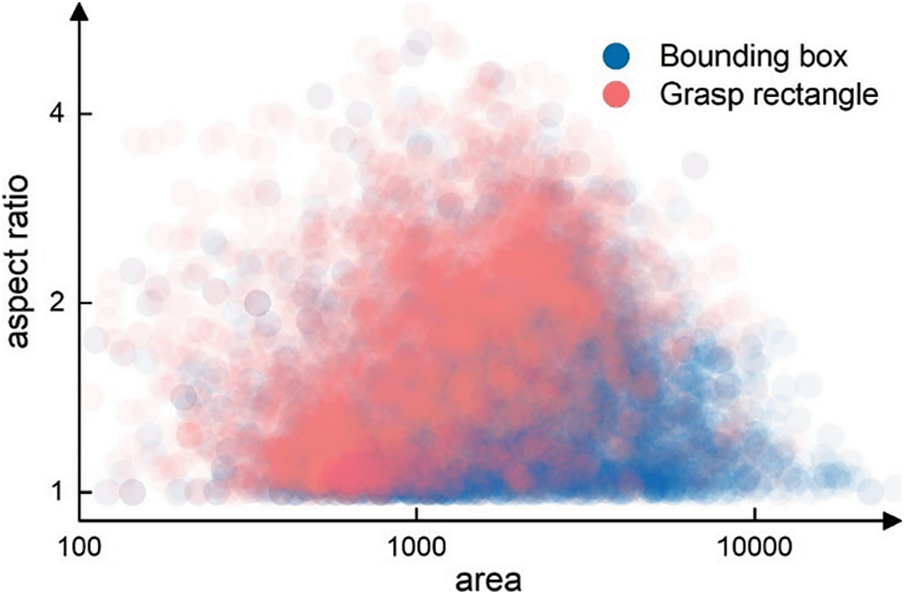
Figure 2: Aspect ratio-area scatter plot of bounding boxes and grasp rectangles
In previous works, anchor boxes with multiple aspect ratios and areas are used to match GT boxes with similar shapes. Inspired by this idea, transformation is made on both anchor and GT boxes. In this work, square anchor boxes with directions, named oriented anchor boxes [47], and cover boxes are used for matching.
Traditional methods provide
where
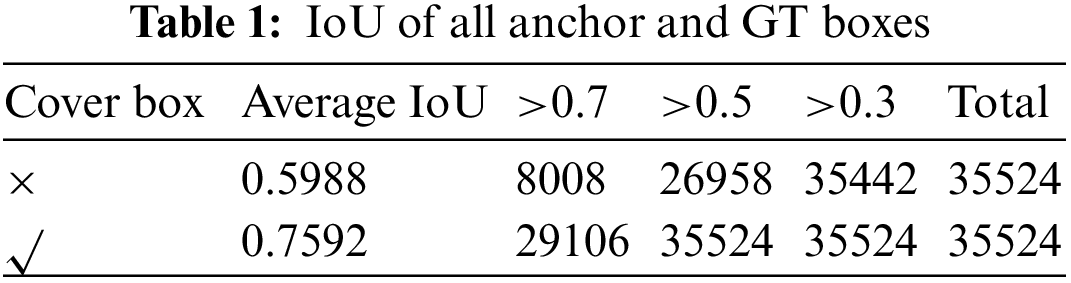
Although square anchor boxes reduce the parameters needed, they lower the average IoU of GT boxes with a large aspect ratio, which results in failure to match part of GT boxes. In this work, cover boxes are proposed to replace GT boxes during the matching process. The cover box is the smallest square that can cover the GT box. The center of the cover box is the same as the GT box while the length of the side of the cover box is equal to the length of the long side of the GT box. Cover boxes pay attention to the center position and the maximum one-dimensional length of GT boxes, which is different from traditional methods where aspect ratio and size are focused on. Combining cover boxes with oriented anchor boxes, the average IoU of matching is highly improved. In Fig. 3, IoU with anchor boxes rotating around fixed GT boxes are discussed in each part. The size of anchor and GT boxes is set to 1 and the center distance is 0.2. Each graph contains three GT boxes and one anchor box. The thick lines stand for GT and anchor boxes while the colored thin lines indicate IoU values in polar coordinates. GT boxes are set with sizes of 1 and aspect ratios of {1:1,2:1,1:3} while anchor boxes are of different shapes in every situation. The filled shadow areas indicate regions of intersection between GT and anchor boxes, and the pure shadow areas reveal the range of the variation of IoU. The baseline of 0.5, as is the threshold used in many previous works, is marked in black thin line. Every anchor box is drawn at an angle of
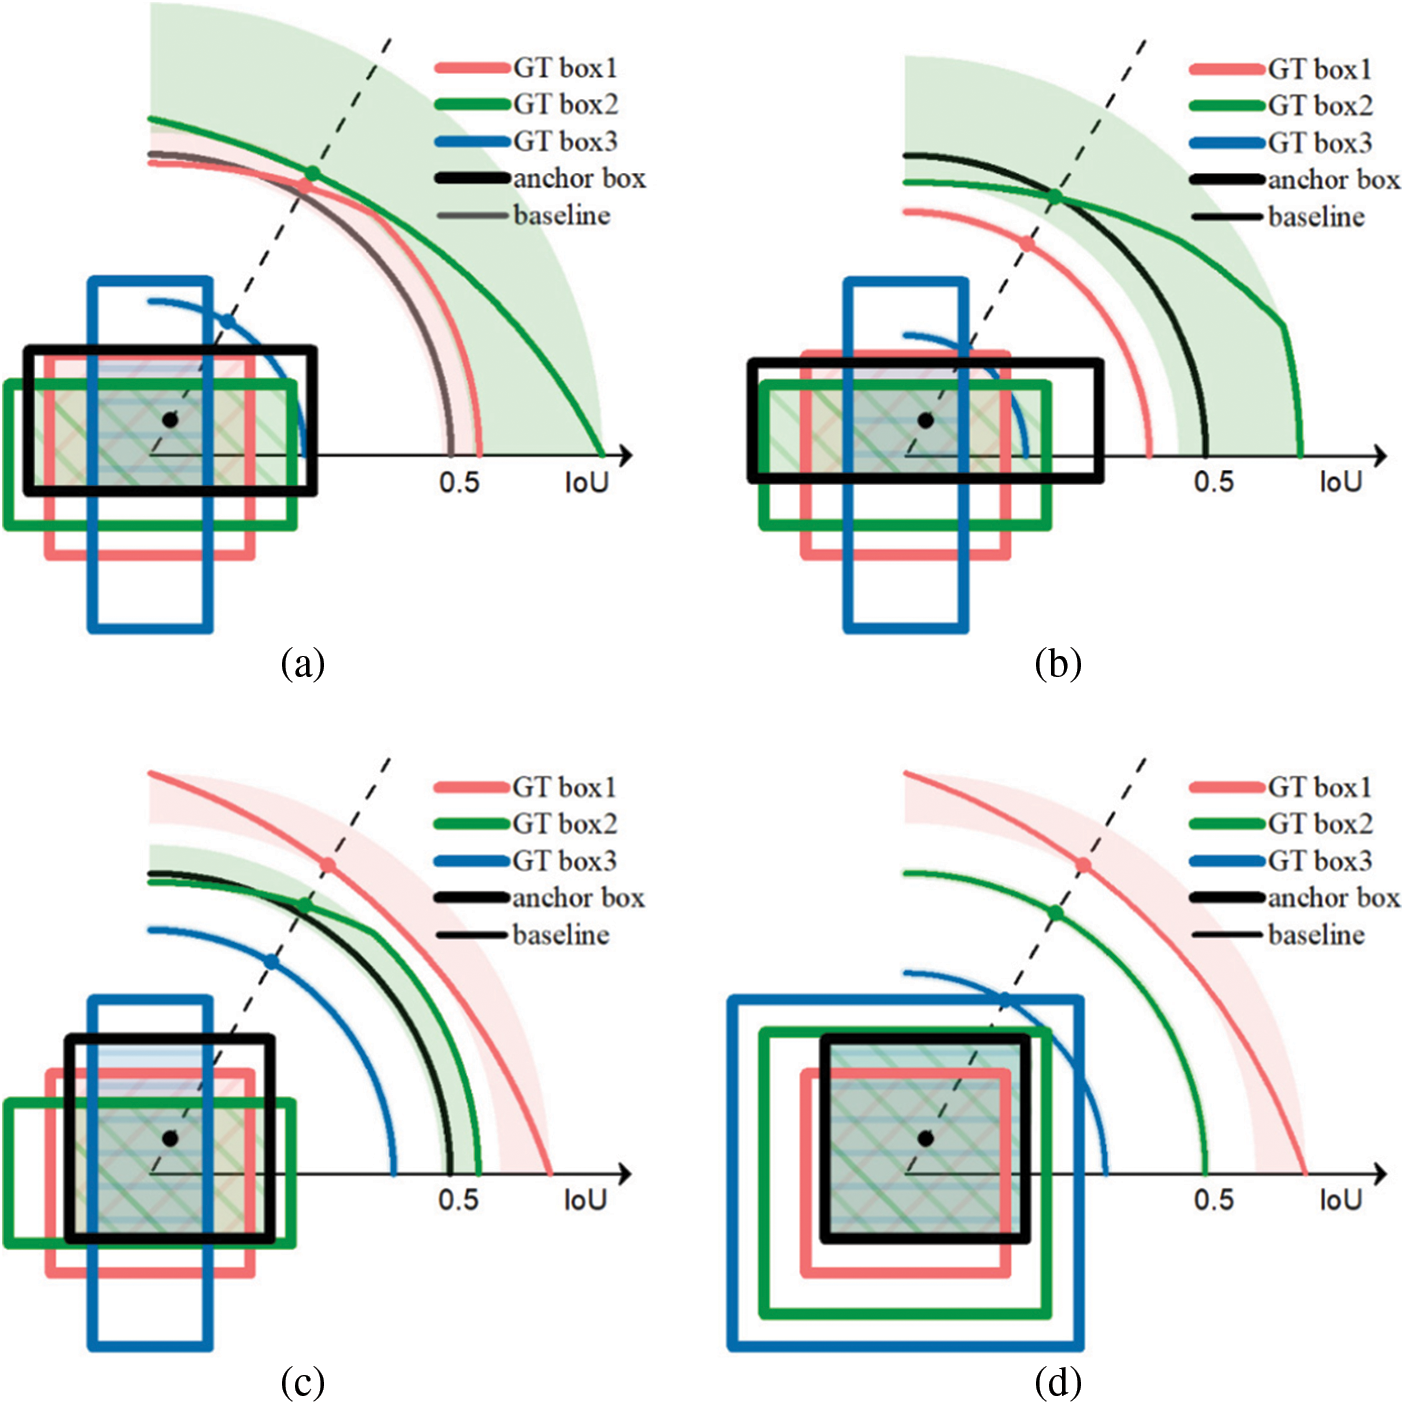
Figure 3: IoU between three GT boxes and four anchor boxes
With cover boxes replacing GT boxes, anchor and GT boxes are both square boxes. Sizes of anchor boxes become computable because IoUs are only depended on relative positions and sizes, and a unified standard can be achieved. To ensure high-quality matching, the minimum IoU between GT boxes and any anchor boxes of each scale is calculated, and the maximum value among them is supposed to be above the baseline. In other words, cover boxes of any size and aspect ratio should have at least one anchor box of IoU larger than the threshold. As anchor boxes are evenly distributed at the centers of feature map grids, the minimum value appears in the middle of the four neighboring anchor boxes, as shown in Fig. 4a. Dotted lines represent how feature maps are divided and anchor box1 stands for anchor boxes of the corresponding scale. Anchor box2 represents anchor boxes from the next upper scale, and its density is only a quarter of the former. Point1 and point2 mark minimum points on each scale respectively. With the position indicated, the minimum IoU in each scale can be expressed by a fixed Eq. (3).
where
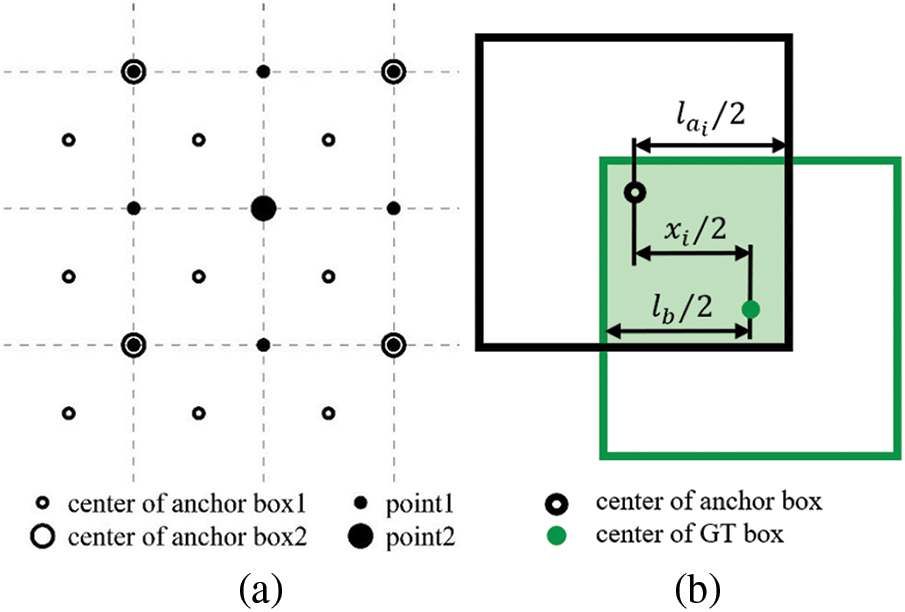
Figure 4: (a) Center positions of GT boxes that get the minimum
Furthermore, exponentially increasing anchor sizes are adopted in this work. Given images of 320 × 320 pixels, feature maps have sizes of {40 × 40, 20 × 20, 10 × 10, 5 × 5, 3 × 3}, and anchor box offsets of {8 × 8, 16 × 16, 32 × 32, 64 × 64, 106 × 106} pixels are generated, which will be explained in the following part. Compared with linearly increasing anchor sizes used in previous works, exponentially increasing anchor sizes perform better when dealing with GT boxes of widely ranging sizes. Meanwhile, the detector uses anchor boxes of two sizes at each grid point to make up for the relatively low IoU between scales and to increase the probability of matching. The set of anchor box sizes can be expressed as
As GT boxes from all scales can get matched anchor boxes, a multi-scale multi-grasp detector is proposed. The detector is made up of a backbone and three predictors, as shown in Fig. 5.
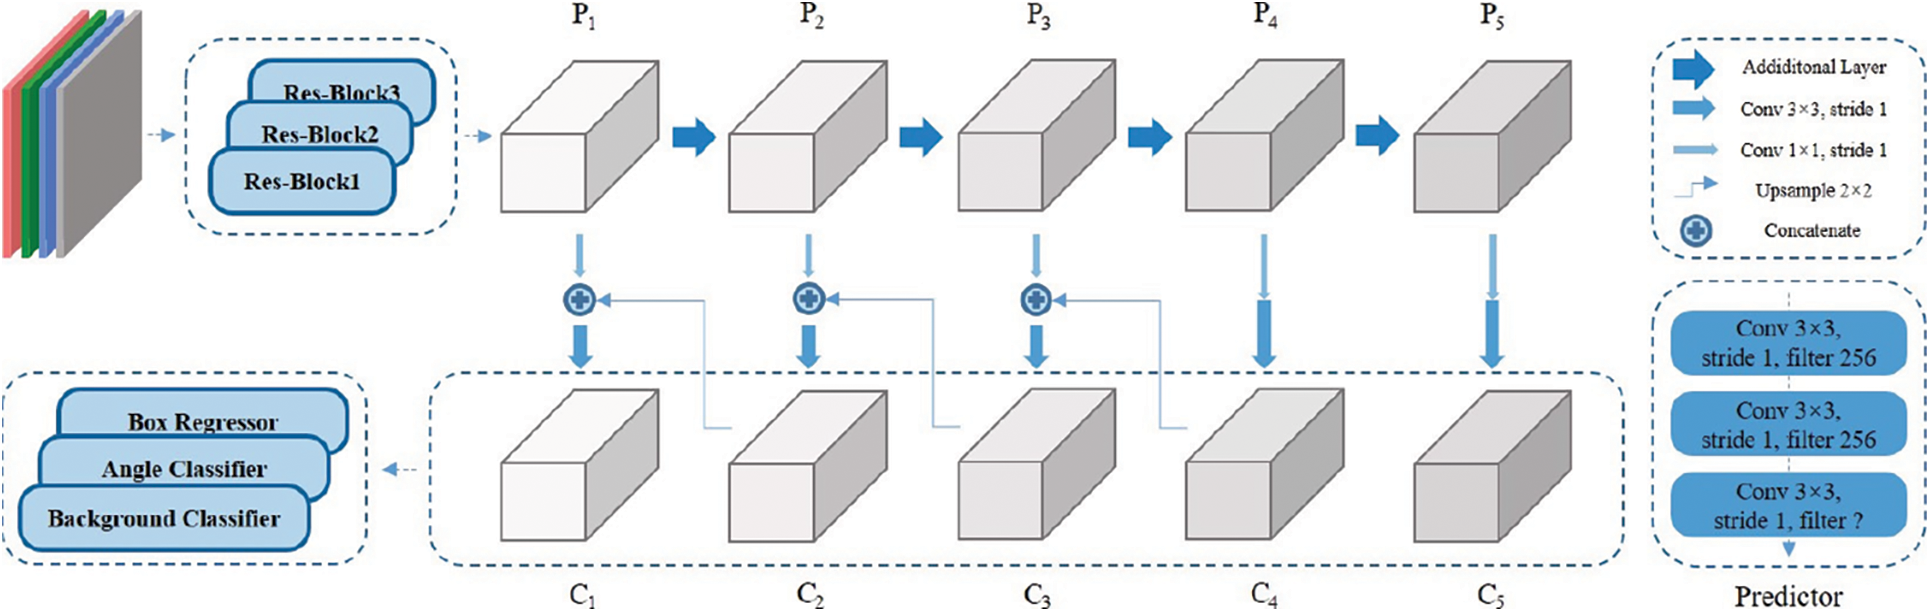
Figure 5: Network architecture
The backbone uses truncated Resnet-50 [62] as the basic extractor. ResNet-50 consists of 4 blocks and the first three blocks are reserved, and the three blocks have 3, 4 and 6 building blocks respectively. Each building block includes a shortcut as the residual layer and a group of 3 Conv layers. The 3 × 3-S2 Conv layer of the first branch of shortcut in block 3 is replaced by a 3 × 3-S1 Conv layer. These three blocks take an image of 320 × 320 pixels as input and then produce an output of a 40 × 40 feature map. They are followed by a group of additional layers to further extract the feature maps. An additional layer is made up of 1 × 1-S1 and 3 × 3-S2 Conv layers. The extractor takes an RGB-D or RGB image of 320 × 320 as input and output feature maps as {40 × 40, 20 × 20, 10 × 10, 5 × 5, 3 × 3} which are denoted as
4.2 Predictor and Loss Function
Apart from the grasp classifier and the box regressor applied in many studies, a novel branch of the background classifier is added in this network. The three predictors are constructed according to subnetworks [15]. In this work, each predictor has three 3 × 3-S1 Conv layers as middle layers and a convolutional predict layer.
The background classifier acts as a criterion on whether to take a group of anchor boxes into the computation and uses a background threshold
where
The grasp classifier is used to predict grasp probability for each single anchor box. Furthermore, only anchor boxes in groups, that are considered positive in the background classifier, are used in the training process. The anchor boxes grouped as backgrounds are ignored, which is different from previous studies. Most works [14,15] regarded positive and negative examples as objects and backgrounds, and ignore data in the middle, which decreases accuracy once trained. However, the proposed fully matching model can encode all positive grasp examples and draw a clear line between the positive and negative examples. Therefore, the grasp classifier is aimed at focusing more on predicting angles than on distinguishing graspable region from backgrounds. With a grasp threshold
where
The box regressor predict grasp rectangles based on pre-defined anchor boxes, and only positive grasp examples are trained in this part. CIoU [16] and
where
The total loss is written as Eq. (7).
where
To exhibit the ability of the multi-scale grasp detector, Cornell Grasp Dataset is divided in two approaches:
• Image-wise split Images are randomly divided into training and validating set. This treatment tests the ability of the model to predict grasps on known objects.
• Object-wise split Images of the same object are divided into the same set, which represents the generalization ability of the model to predict grasps on novel objects.
5-Fold Cross-Validation is used in this work. At each time the dataset is randomly divided into 5 sets by different split approaches. RGB and RGB-D images are applied in training and predicting. When depth information is needed, RGB and depth images are concatenated together as 4-layer RGBD data. Since 885 images in the dataset are far from enough for training deep neural networks, data augmentation methods are applied on raw images, including up-down and left-right flipping, random scaling and Gaussian noise. Finally, augmented images are randomly cropped to 320 × 320 pixels containing at least one grasp rectangle. Side lengths of grasp rectangles after augmentation vary from 20 pixels to 400 pixels, which completely covers image size. The test sets consist of images with objects fixed at the center.
A widely accepted metric is adopted in this model, which consists of angle matching and overlapping:
• The angle between orientations of the predicted and GT grasp boxes is no greater than 30°.
• The Jaccard index of the predicted and GT grasp boxes is greater than 0.25.
The Jaccard index is expressed as Eq. (8).
where
The model is constructed in Tensorflow and computations are run on a NVIDIA RTX2080ti graphics card. The optimizer used in this work is Adam with weight decay, referred to as AdamW. The learning rate is set to 0.0001 and weight decay is set differently depending on input data and models. Learning rate decreases with increasing epochs. The model starts with random initialization requiring no pre-training and is trained end-to-end.
The angle class number
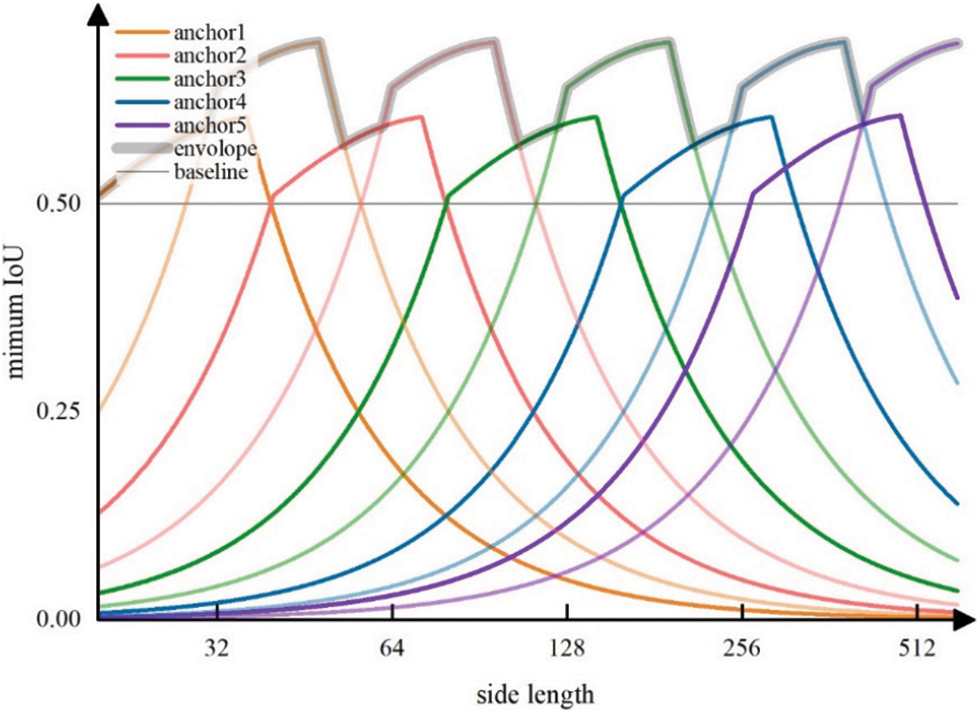
Figure 6: Minimum IoU of multi-scale anchor boxes and a GT box with certain side length
Single-grasp method, which generates a grasp with the highest score among all candidates as the final proposal, is used in this part. For each image in the test set, the predicted grasp is judged whether to be successful by the evaluation metric mentioned above and therefore the accuracy is generated after going through the test set. In Fig. 7, rows (a) and (c) show the best predictions and GT boxes, respectively. With RGB-D images, the proposed model achieves an average accuracy of 96.27% and 95.45% on the image-and object-wise split datasets respectively. In addition, the detector achieves up to 98.87% and 97.82% on each dataset. With RGB images, the detector performs with an average accuracy of 94.12% and 93.38% on two types of datasets and gets the maximum accuracy of 97.74% and 96.20%, respectively. Table 2 shows results in this work compared with previous studies and the proposed multi-scale grasp detector performs competitive accuracy on randomly scaled objects. Tables 3 and 4 present the variance of the best accuracy depending on angle and IoU threshold. As the angle threshold decreases to
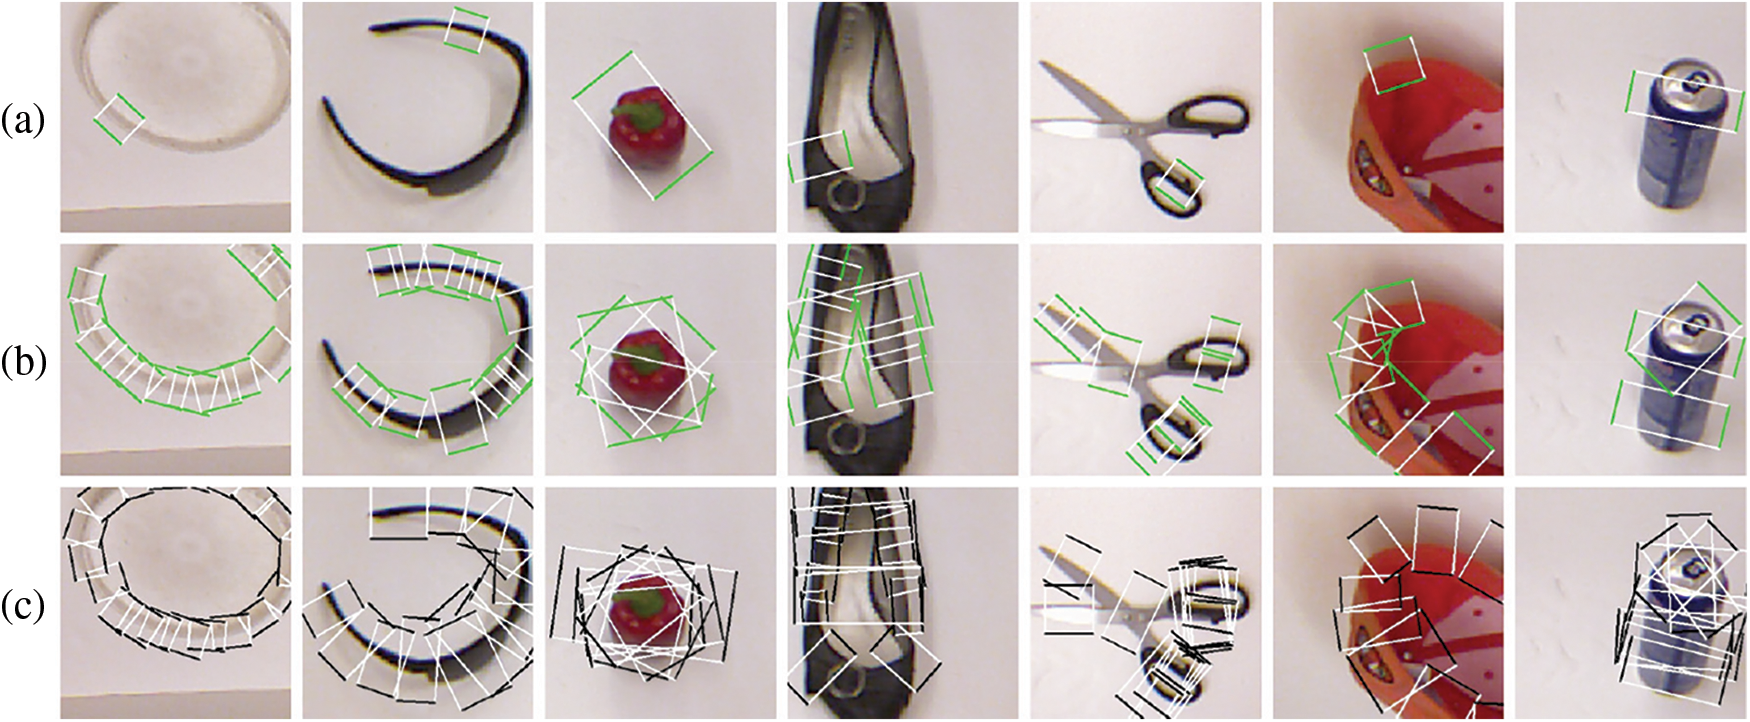
Figure 7: Examples of single grasp and multi-scale grasp prediction
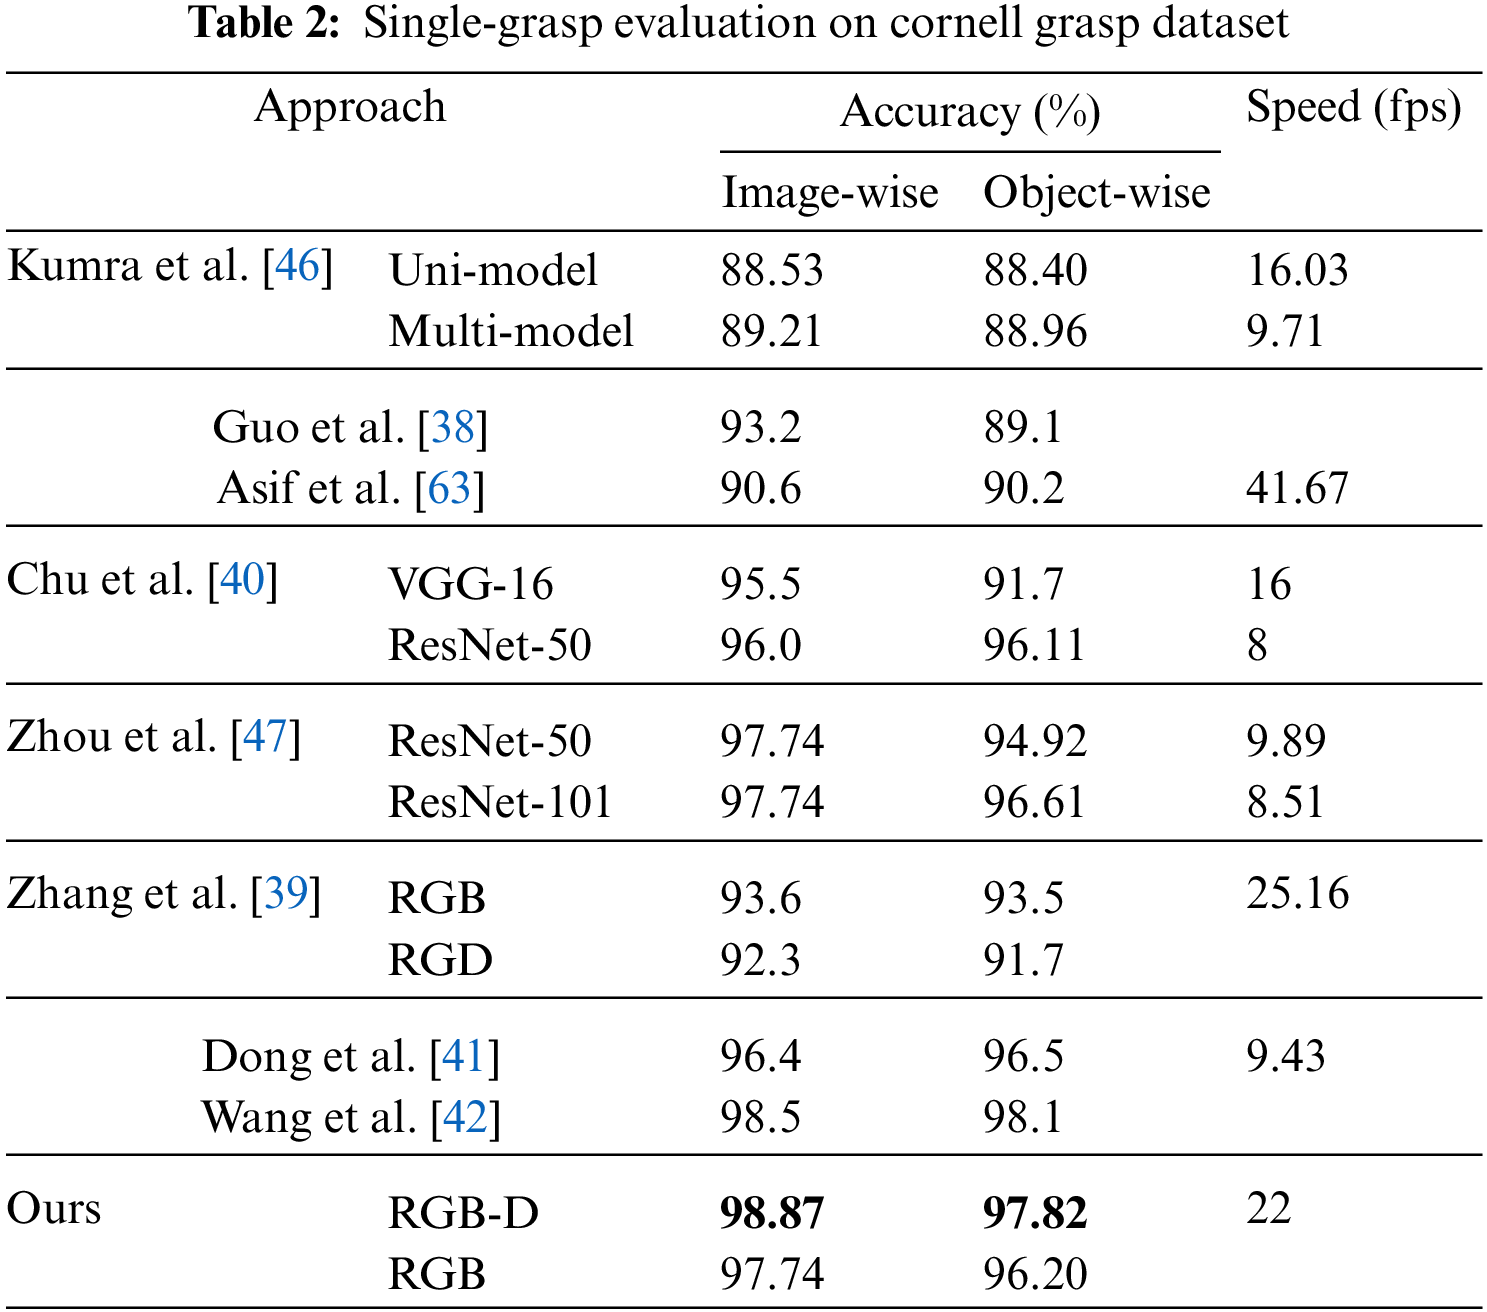
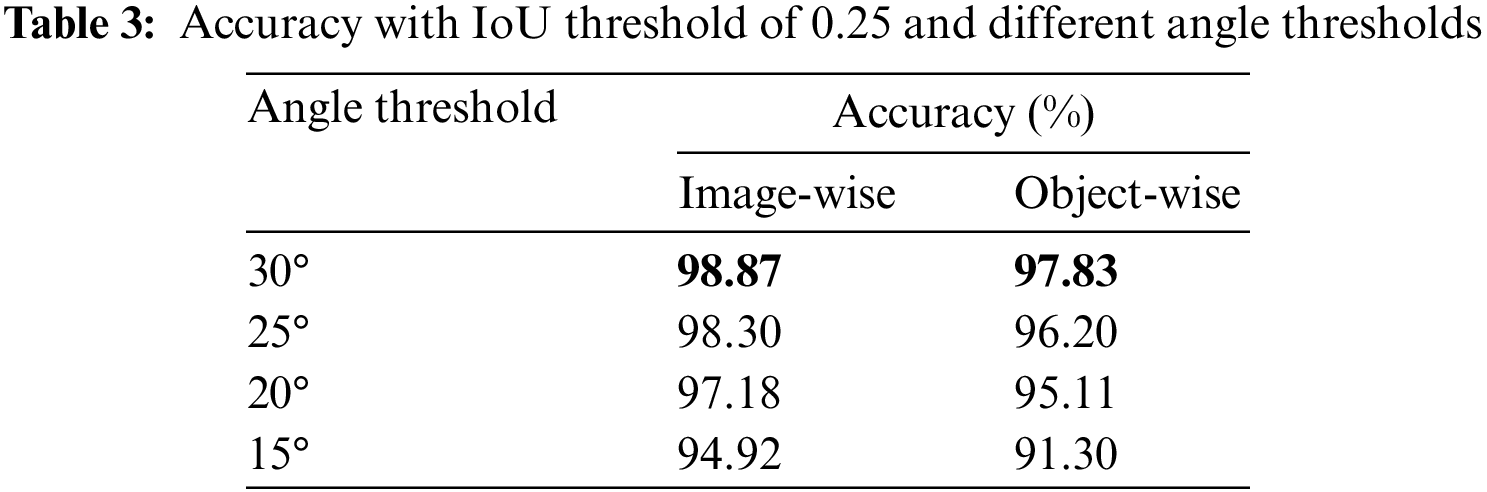
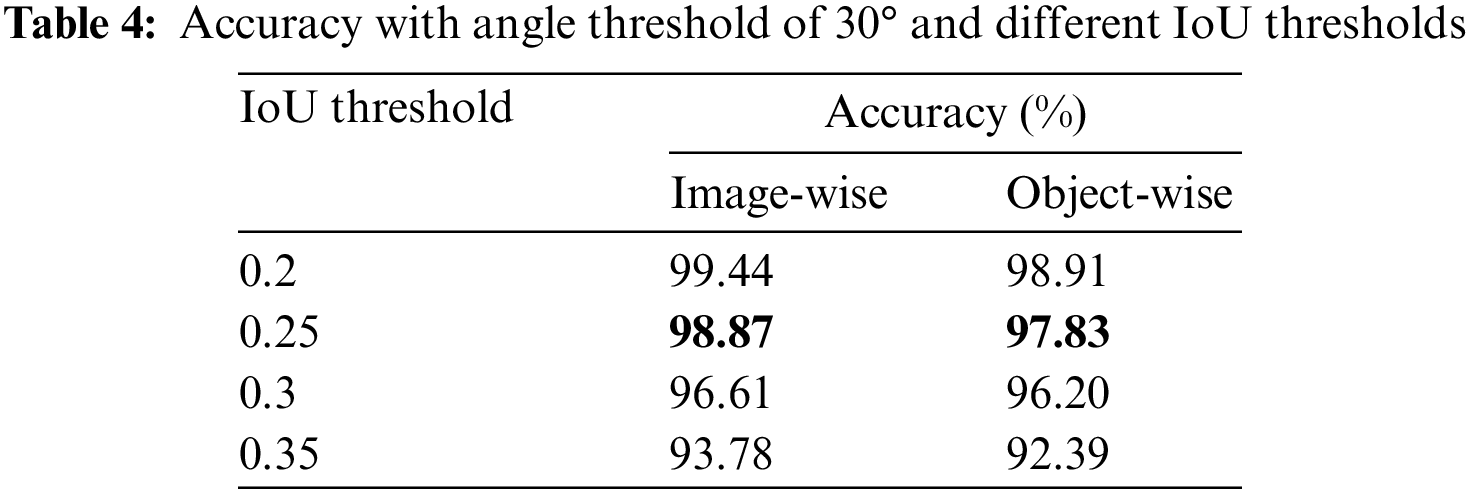
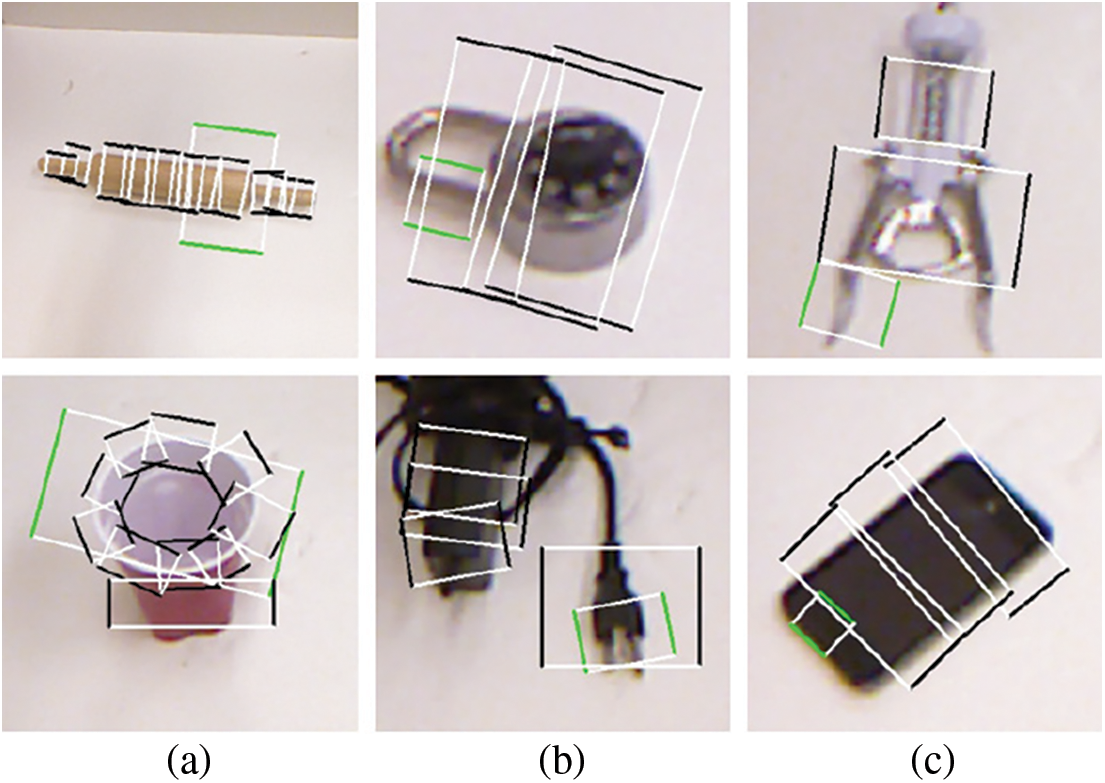
Figure 8: Unsuccessful grasp predictions
The multi-scale grasp detector performs grasps with changing object sizes. To exhibit predicted grasp rectangles of different sizes, a newly designed test is based on multi-grasp research, where grasps of top
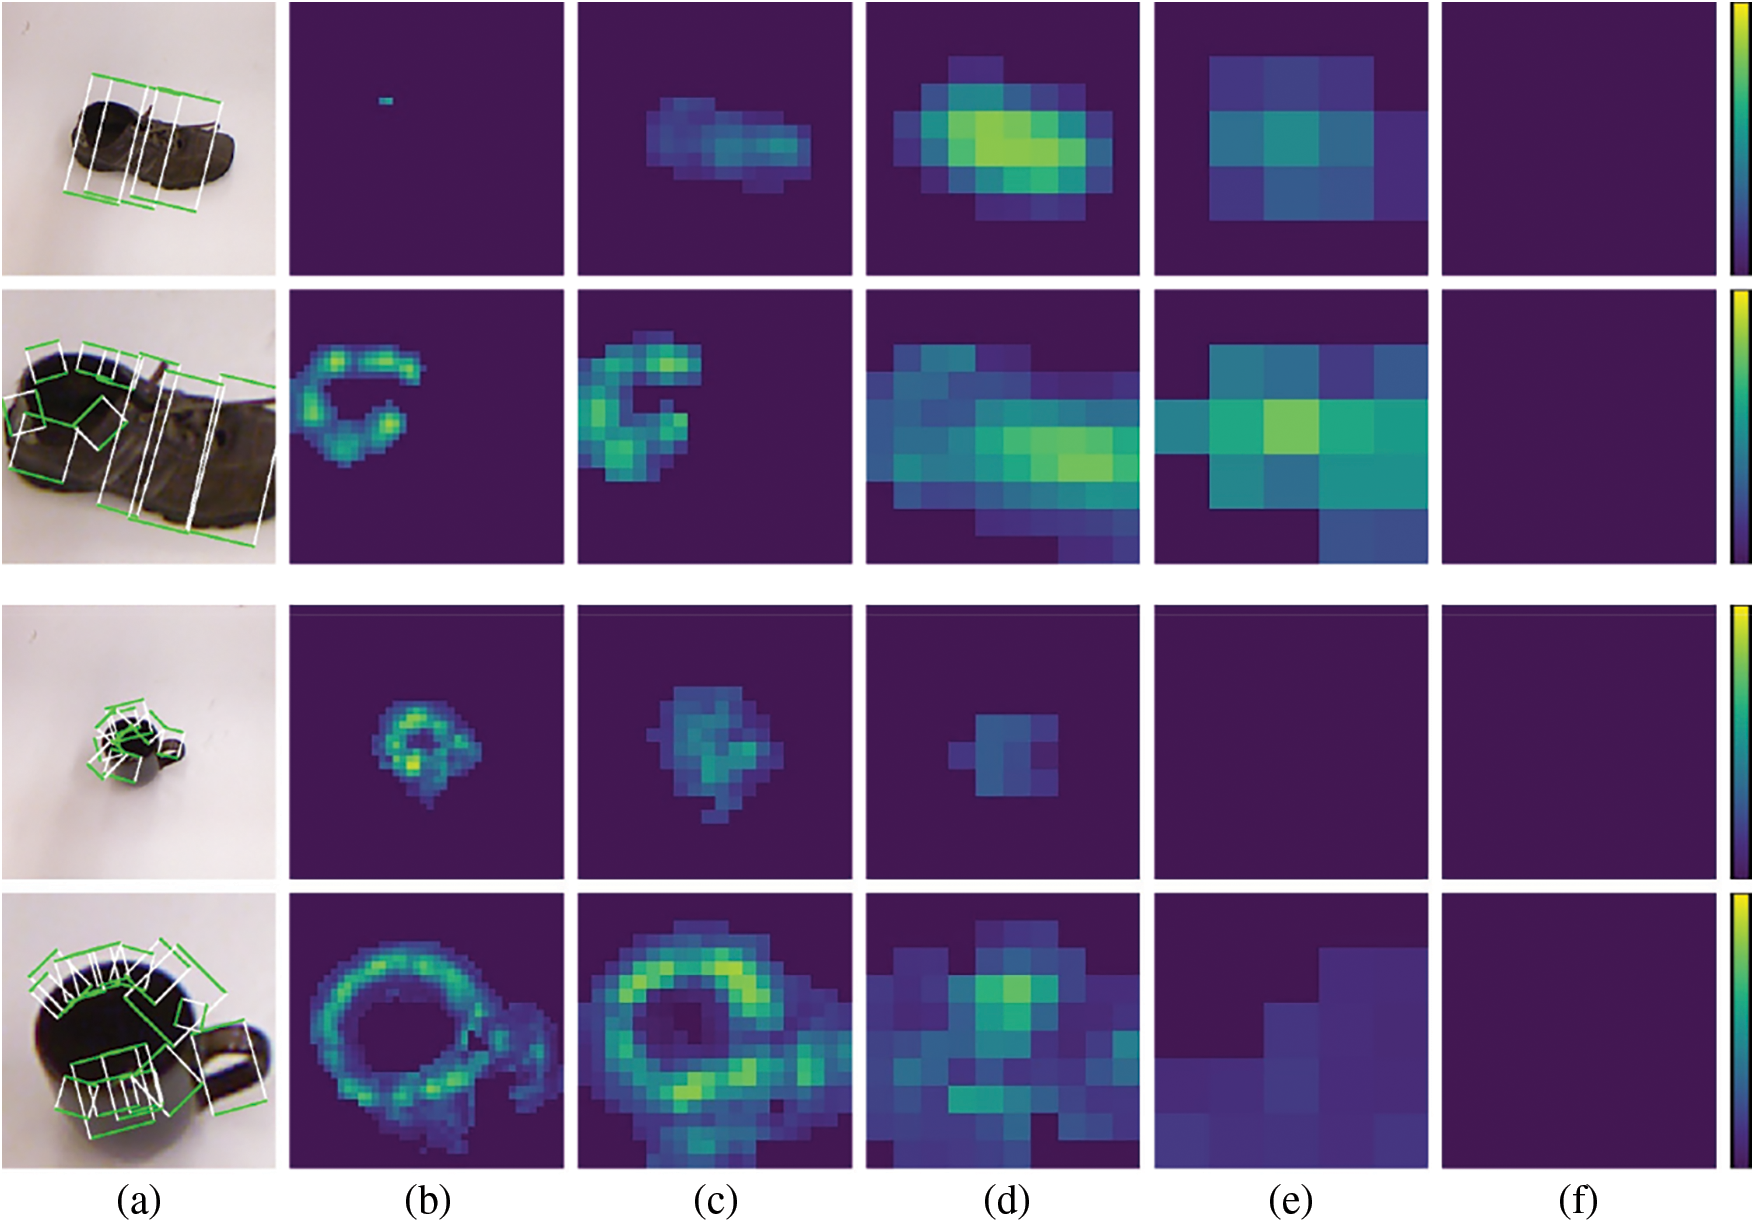
Figure 9: Heat maps of grasp scores on multiple feature maps
The ablation study is designed to examine the effectiveness of the proposed approaches. A set of controlled experiments is carried out on both image-and object-wise split RGB-D datasets and two modules are considered in this part, as the background classifier and the FPN connections. One of the two modules is abandoned at each time and all results are compared to the origin model. As shown in Table 5, the model without the background classifier performs with an average accuracy of 94.35% and 94.24% on the image-and object-wise datasets respectively and achieves an accuracy of up to 96.61% and 95.11%. The missing background branch brings a loss of nearly 2% accuracy on the image-wise split dataset and 1.2% on the object-wise split dataset. In addition, the lack of a background classifier makes positive predictions less separated from negative ones. Fig. 10 shows the output of heat maps by the controlled model after the same training epochs. Compared with those in Fig. 9, scores on feature maps of each scale show smaller differences between the maximum and minimum values, which proves the weakened ability of the model. Meanwhile, the detector without FPN connections achieves the average accuracy of 94.94% and 94.83% on two types of datasets and has the maximum accuracy of 98.30% and 96.34%, respectively. Compared with the background classifier, the FPN module leads to a smaller accuracy loss.
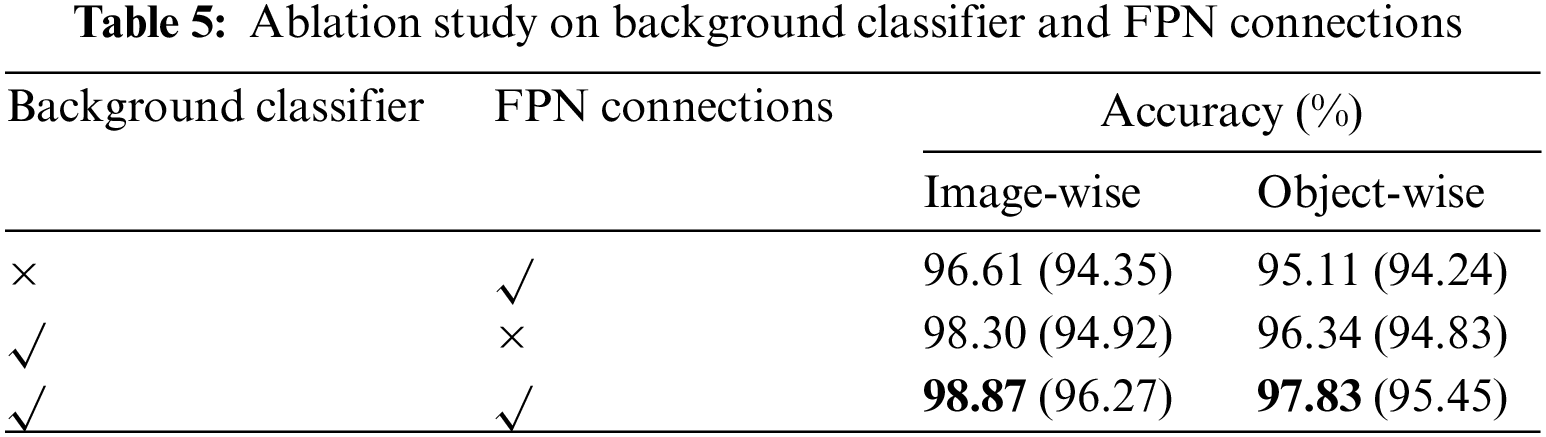
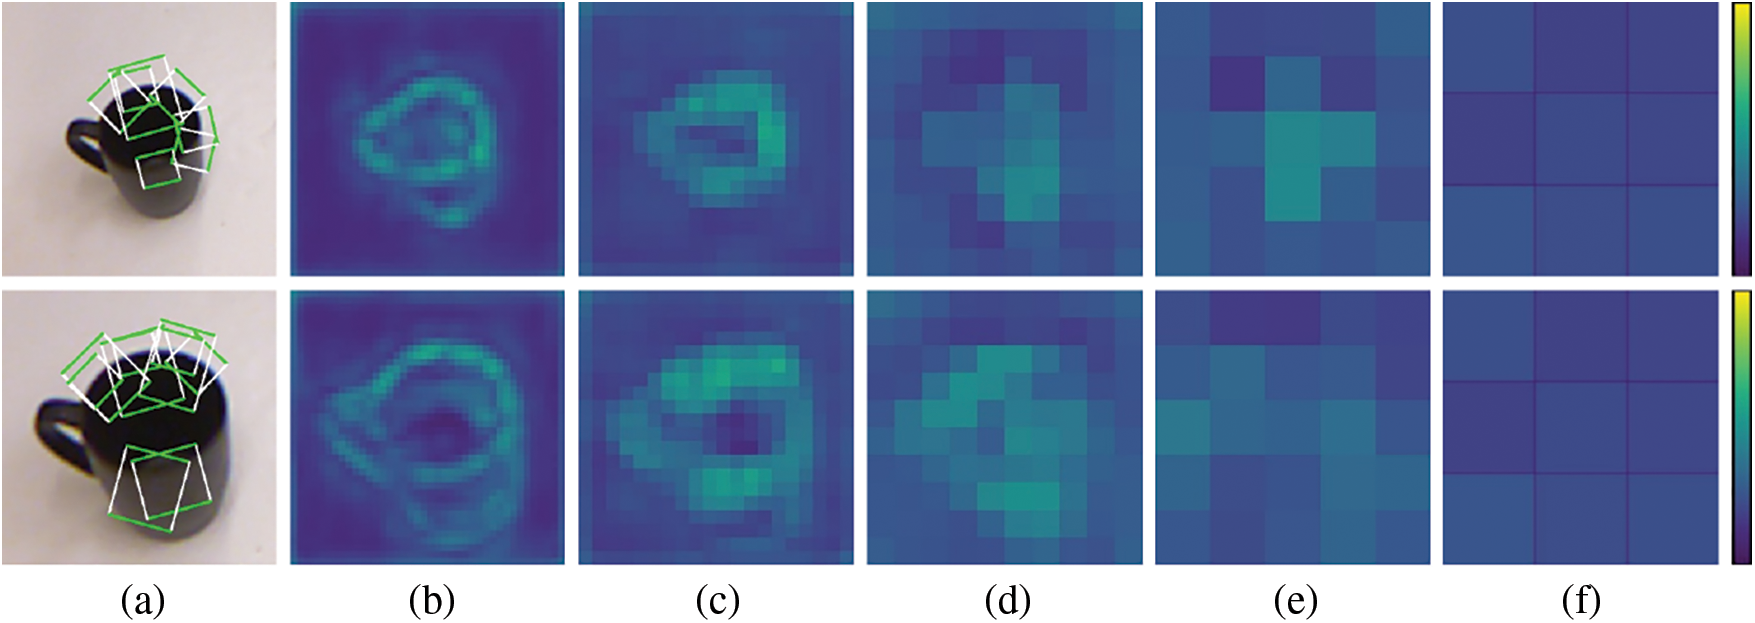
Figure 10: Heat maps of grasp scores of the controlled model
6.5 Grasp Detection on Novel Objects
The multi-scale detector is tested on novel objects in two approaches. The dataset used in this part is collected by an RGB-D camera placed on top of a robotic arm. The first test uses images captured during rotation and translation of the camera around objects, shown in Fig. 11. The proposed detector can make predictions dealing with the variance of the orientation and distance. Moreover, each image in the second group of images consists of multiple objects, shown in Fig. 12. Multiple grasps are performed on all objects contained in images. Both of the tests verify the generalization ability to grasp according to partial information. Furthermore, the detector predicts grasp rectangles with multiple sizes depending on the size of grasp features in one stage. The multiple grasp predictions given in Figs. 11 and 12 provide various options for different gripper sizes and orders of grasping rectangles. By combining the specific size and object to grasp, the best grasp prediction can be chosen from the multiple candidates. Therefore, single grasp tasks are not carried out on novel objects because the lack of relative semantic information.
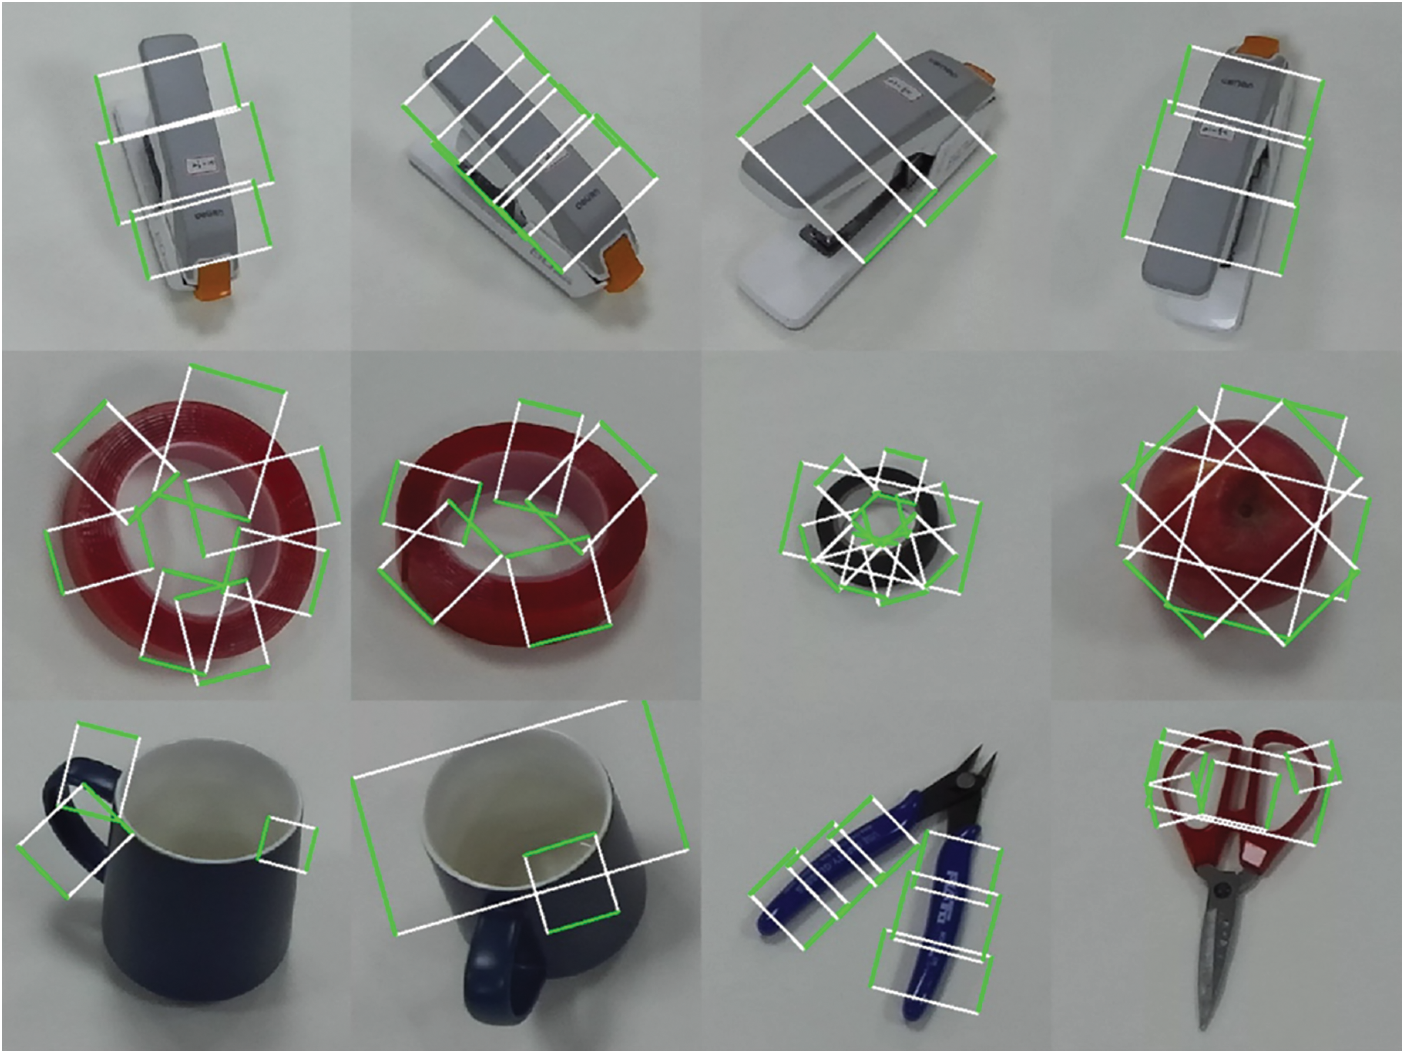
Figure 11: Multi-grasp on single objects from different relative positions
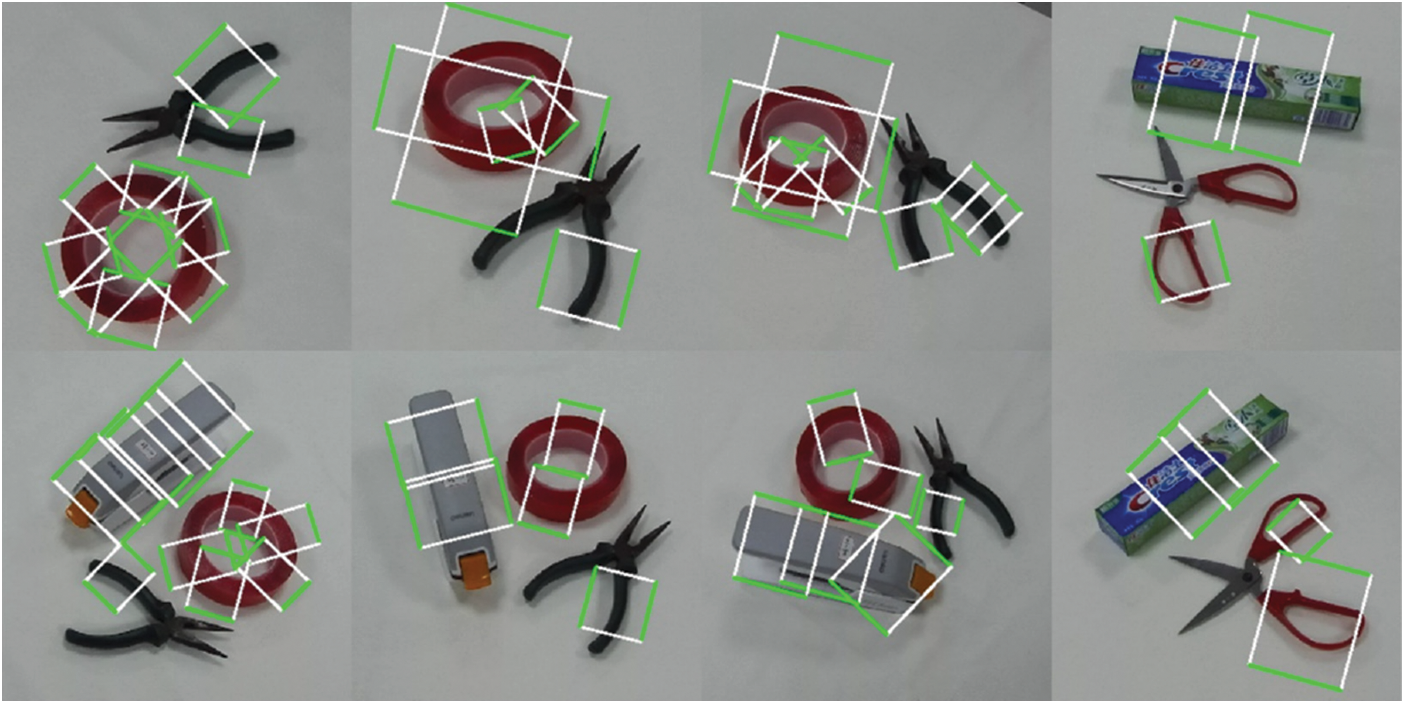
Figure 12: Multi-grasp on multiple objects
A multi-scale grasp detector is proposed using a fully matching model and multiple feature maps. It can predict multiple grasps of different scales through a single shot. With cover boxes replacing GT boxes in matching, the average IoU is highly increased and all positive examples are encoded through anchor boxes. The background classifier prevents large amounts of unwanted easy negative examples and focuses angle predictor on positive and hard negative examples, which brings better performance on grasp angle predicting and enhances the generalization ability especially on multiple scales. This model achieves an accuracy of up to 98.87% and 97.82% on the image-and object-wise split datasets at a real-time speed of 22 frames per second, which is competitive among the most advanced studies. Furthermore, the experiments on novel objects present the effectiveness of the proposed detector.
Acknowledgement: This work is supported by the Central Program of Basic Science of the National Natural Science Foundation of China (72088101) and the National Postdoctoral Program for Innovative Talents (BX2021285). The numerical calculations have been done on the supercomputing system in the Supercomputing Center of University of Science and Technology of China.
Funding Statement: This work received fundings from Central Program of Basic Science of the National Natural Science Foundation of China (72088101) and the National Postdoctoral Program for Innovative Talents (BX2021285).
Conflicts of Interest: The authors declare that they have no conflicts of interest to report regarding the present study.
References
1. Li, R., Qiao, H. (2019). A survey of methods and strategies for high-precision robotic grasping and assembly tasks—Some new trends. IEEE/ASME Transactions on Mechatronics, 24(6), 2718–2732. DOI 10.1109/TMECH.2019.2945135. [Google Scholar] [CrossRef]
2. Mahler, J., Liang, J., Niyaz, S., Laskey, M., Doan, R. et al. (2017). Dex-Net 2.0: Deep learning to plan robust grasps with synthetic point clouds and analytic grasp metrics. ArXiv Preprint ArXiv: 1703.09312. [Google Scholar]
3. Mahler, J., Matl, M., Liu, X., Li, A., Gealy, D. et al. (2018). Dex-Net 3.0: Computing robust vacuum suction grasp targets in point clouds using a new analytic model and deep learning. 2018 IEEE International Conference on Robotics and Automation (ICRA), pp. 5620–5627. Brisbane, Australia. [Google Scholar]
4. Tawk, C., Sariyildiz, E., Alici, G. (2021). Force control of a 3D printed soft gripper with built-in pneumatic touch sensing chambers. Soft Robotics, 6. DOI 10.1089/soro.2020.0190. [Google Scholar] [CrossRef]
5. Zhou, H., Tawk, C., Alici, G. (2021). A 3D printed soft prosthetic hand with embedded actuation and soft sensing capabilities for directly and seamlessly switching between various hand gestures. 2021 IEEE/ASME International Conference on Advanced Intelligent Mechatronics (AIM), pp. 75–80. Delft, The Netherlands. [Google Scholar]
6. Du, G., Wang, K., Lian, S., Zhao, K. (2021). Vision-based robotic grasping from object localization, object pose estimation to grasp estimation for parallel grippers: A review. Artificial Intelligence Review, 54(3), 1677–1734. DOI 10.1007/s10462-020-09888-5. [Google Scholar] [CrossRef]
7. Liu, W., Anguelov, D., Erhan, D., Szegedy, C., Reed, S. et al. (2016). SSD: Single shot multibox detector. European Conference on Computer Vision, pp. 21–37. Amsterdam, The Netherlands. [Google Scholar]
8. Lin, T. Y., Dollár, P., Girshick, R., He, K., Hariharan, B. et al. (2017). Feature pyramid networks for object detection. Proceedings of the IEEE Conference on Computer Vision and Pattern Recognition, pp. 2117–2125. Honolulu, Hawaii, USA. [Google Scholar]
9. Girshick, R., Donahue, J., Darrell, T., Malik, J. (2014). Rich feature hierarchies for accurate object detection and semantic segmentation. Proceedings of the IEEE Conference on Computer Vision and Pattern Recognition, pp. 580–587. Columbus, Ohio, USA. [Google Scholar]
10. He, K., Zhang, X., Ren, S., Sun, J. (2015). Spatial pyramid pooling in deep convolutional networks for visual recognition. IEEE Transactions on Pattern Analysis and Machine Intelligence, 37(9), 1904–1916. DOI 10.1109/TPAMI.2015.2389824. [Google Scholar] [CrossRef]
11. Girshick, R. (2015). Fast R-CNN. Proceedings of the IEEE International Conference on Computer Vision, pp. 1440–1448. Santiago, Chile. [Google Scholar]
12. Ren, S., He, K., Girshick, R., Sun, J. (2015). Faster R-CNN: Towards real-time object detection with region proposal networks. Advances in Neural Information Processing Systems, 28, 91–99. [Google Scholar]
13. Redmon, J., Divvala, S., Girshick, R., Farhadi, A. (2016). You only look once: Unified, real-time object detection. Proceedings of the IEEE Conference on Computer Vision and Pattern Recognition, pp. 779–788. Las Vegas, Nevada, USA. [Google Scholar]
14. Redmon, J., Farhadi, A. (2017). YOLO9000: Better, faster, stronger. Proceedings of the IEEE Conference on Computer Vision and Pattern Recognition, pp. 7263–7271. Honolulu, Hawaii, USA. [Google Scholar]
15. Lin, T. Y., Goyal, P., Girshick, R., He, K., Dollár, P. (2017). Focal loss for dense object detection. Proceedings of the IEEE International Conference on Computer Vision, pp. 2980–2988. Venice, Italy. [Google Scholar]
16. Bochkovskiy, A., Wang, C. Y., Liao, H. Y. M. (2020). YOLOV4: Optimal. Arxiv Preprint ArXiv: 2004.10934. [Google Scholar]
17. Zhou, Y., Tuzel, O. (2018). Voxelnet: End-to-end learning for point cloud based 3D object detection. Proceedings of the IEEE Conference on Computer Vision and Pattern Recognition, pp. 4490–4499. Salt Lake City, Utah, USA. [Google Scholar]
18. Pinheiro, P. O., Collobert, R., Dollár, P. (2015). Learning to segment object candidates. Arxiv Preprint Arxiv: 1506.06204. [Google Scholar]
19. Wang, W., Yu, R., Huang, Q., Neumann, U. (2018). SGPN: Similarity group proposal network for 3D point cloud instance segmentation. Proceedings of the IEEE Conference on Computer Vision and Pattern Recognition, pp. 2569–2578. Salt Lake City, Utah, USA. [Google Scholar]
20. Jiang, H., Wang, J., Yuan, Z., Wu, Y., Zheng, N. et al. (2013). Salient object detection: A discriminative regional feature integration approach. Proceedings of the IEEE Conference on Computer Vision and Pattern Recognition, pp. 2083–2090. Portland, Oregon, USA. [Google Scholar]
21. Peng, H., Li, B., Xiong, W., Hu, W., Ji, R. (2014). RGBD salient object detection: A benchmark and algorithms. European Conference on Computer Vision, pp. 92–109. Zurich, Switzerland. [Google Scholar]
22. Qi, Q., Zhao, S., Shen, J., Lam, K. M. (2019). Multi-scale capsule attention-based salient object detection with multi-crossed layer connections. 2019 IEEE International Conference on Multimedia and Expo (ICME), pp. 1762–1767. Shanghai, China. [Google Scholar]
23. Deng, Z., Gao, G., Frintrop, S., Sun, F., Zhang, C. et al. (2019). Attention based visual analysis for fast grasp planning with a multi-fingered robotic hand. Frontiers in Neurorobotics, 13, 60. DOI 10.3389/fnbot.2019.00060. [Google Scholar] [CrossRef]
24. Pang, Y., Zhang, L., Zhao, X., Lu, H. (2020). Hierarchical dynamic filtering network for RGB-D salient object detection. European Conference on Computer Vision, pp. 235–252. Glasgow, UK. [Google Scholar]
25. Rad, M., Lepetit, V. (2017). BB8: A scalable, accurate, robust to partial occlusion method for predicting the 3D poses of challenging objects without using depth. Proceedings of the IEEE International Conference on Computer Vision, pp. 3828–3836. Venice, Italy. [Google Scholar]
26. Zeng, A., Song, S., Nießner, M., Fisher, M., Xiao, J. et al. (2017). 3DMatch: Learning local geometric descriptors from RGB-D reconstructions. Proceedings of the IEEE Conference on Computer Vision and Pattern Recognition, pp. 1802–1811. Honolulu, Hawaii, USA. [Google Scholar]
27. Sundermeyer, M., Marton, Z. C., Durner, M., Brucker, M., Triebel, R. (2018). Implicit 3D orientation learning for 6D object detection from RGB images. Proceedings of the European Conference on Computer Vision (ECCV), pp. 699–715. Munich, Germany. [Google Scholar]
28. Wang, Y., Solomon, J. M. (2019). Deep closest point: Learning representations for point cloud registration. Proceedings of the IEEE/CVF International Conference on Computer Vision, pp. 3523–3532. Seoul, South Korea. [Google Scholar]
29. Sahbani, A., El-Khoury, S., Bidaud, P. (2012). An overview of 3D object grasp synthesis algorithms. Robotics and Autonomous Systems, 60(3), 326–336. DOI 10.1016/j.robot.2011.07.016. [Google Scholar] [CrossRef]
30. Rimon, E., Burdick, J. (1996). On force and form closure for multiple finger grasps. Proceedings of IEEE International Conference on Robotics and Automation, pp. 1795–1800. Minneapolis, Minnesota, USA. [Google Scholar]
31. Ciocarlie, M. T., Allen, P. K. (2009). Hand posture subspaces for dexterous robotic grasping. The International Journal of Robotics Research, 28(7), 851–867. DOI 10.1177/0278364909105606. [Google Scholar] [CrossRef]
32. Zhu, H., Kok, Y. Y., Causo, A., Chee, K. J., Zou, Y. et al. (2016). Strategy-based robotic item picking from shelves. 2016 IEEE/RSJ International Conference on Intelligent Robots and Systems (IROS), pp. 2263–2270. Daejeon, South Korea. [Google Scholar]
33. Ten Pas, A., Gualtieri, M., Saenko, K., Platt, R. (2017). Grasp pose detection in point clouds. The International Journal of Robotics Research, 36(13–14), 1455–1473. DOI 10.1177/0278364917735594. [Google Scholar] [CrossRef]
34. Qian, K., Jing, X., Duan, Y., Zhou, B., Fang, F. et al. (2020). Grasp pose detection with affordance-based task constraint learning in single-view point clouds. Journal of Intelligent Robotic Systems, 100(1), 145–163. DOI 10.1007/s10846-020-01202-3. [Google Scholar] [CrossRef]
35. Varley, J., DeChant, C., Richardson, A., Ruales, J., Allen, P. (2017). Shape completion enabled robotic grasping. 2017 IEEE/RSJ International Conference on Intelligent Robots and Systems (IROS), pp. 2442–2447. Vancouver, British Columbia, Canada. [Google Scholar]
36. Watkins-Valls, D., Varley, J., Allen, P. (2019). Multi-modal geometric learning for grasping and manipulation. 2019 International Conference on Robotics and Automation (ICRA), pp. 7339–7345. Montreal, Canada. [Google Scholar]
37. Jiang, Y., Moseson, S., Saxena, A. (2011). Efficient grasping from rgbd images: Learning using a new rectangle representation. 2011 IEEE International Conference on Robotics and Automation, pp. 3304–3311. Shanghai, China. [Google Scholar]
38. Guo, D., Sun, F., Liu, H., Kong, T., Fang, B. et al. (2017). A hybrid deep architecture for robotic grasp detection. 2017 IEEE International Conference on Robotics and Automation (ICRA), pp. 1609–1614. Singapore. [Google Scholar]
39. Zhang, H., Lan, X., Bai, S., Zhou, X., Tian, Z. et al. (2019). Roi-based robotic grasp detection for object overlapping scenes. 2019 IEEE/RSJ International Conference on Intelligent Robots and Systems (IROS), pp. 4768–4775. Madrid, Spain. [Google Scholar]
40. Chu, F. J., Xu, R., Vela, P. A. (2018). Real-world multiobject, multigrasp detection. IEEE Robotics and Automation Letters, 3(4), 3355–3362. DOI 10.1109/LRA.2018.2852777. [Google Scholar] [CrossRef]
41. Dong, M., Wei, S., Yu, X., Yin, J. (2021). MASK-GD segmentation based robotic grasp detection. Computer Communications, 178(4), 124–130. DOI 10.1016/j.comcom.2021.07.012. [Google Scholar] [CrossRef]
42. Wang, J., Li, S. (2021). Grasp detection via visual rotation object detection and point cloud spatial feature scoring. International Journal of Advanced Robotic Systems, 18(6), 17298814211055577. DOI 10.1177/17298814211055577. [Google Scholar] [CrossRef]
43. Wang, Z., Li, Z., Wang, B., Liu, H. (2016). Robot grasp detection using multimodal deep convolutional neural networks. Advances in Mechanical Engineering, 8(9), 1687814016668077. DOI 10.1177/1687814016668077. [Google Scholar] [CrossRef]
44. Lenz, I., Lee, H., Saxena, A. (2015). Deep learning for detecting robotic grasps. The International Journal of Robotics Research, 34(4–5), 705–724. DOI 10.1177/0278364914549607. [Google Scholar] [CrossRef]
45. Redmon, J., Angelova, A. (2015). Real-time grasp detection using convolutional neural networks. 2015 IEEE International Conference on Robotics and Automation (ICRA), pp. 1316–1322. Seattle, Washington, USA. [Google Scholar]
46. Kumra, S., Kanan, C. (2017). Robotic grasp detection using deep convolutional neural networks. 2017 IEEE/RSJ International Conference on Intelligent Robots and Systems (IROS), pp. 769–776. Vancouver, British Columbia, Canada. [Google Scholar]
47. Zhou, X., Lan, X., Zhang, H., Tian, Z., Zhang, Y. et al. (2018). Fully convolutional grasp detection network with oriented anchor box. 2018 IEEE/RSJ International Conference on Intelligent Robots and Systems (IROS), pp. 7223–7230. Madrid, Spain. [Google Scholar]
48. Park, D., Seo, Y., Chun, S. Y. (2020). Real-time, highly accurate robotic grasp detection using fully convolutional neural network with rotation ensemble module. 2020 IEEE International Conference on Robotics and Automation (ICRA), pp. 9397–9403. Host virtually. [Google Scholar]
49. Song, Y., Gao, L., Li, X., Shen, W. (2020). A novel robotic grasp detection method based on region proposal networks. Robotics and Computer-Integrated Manufacturing, 65(2), 101963. DOI 10.1016/j.rcim.2020.101963. [Google Scholar] [CrossRef]
50. Zhang, H., Zhou, X., Lan, X., Li, J., Tian, Z. et al. (2019). A real-time robotic grasping approach with oriented anchor box. IEEE Transactions on Systems, Man, and Cybernetics: Systems, 51(5), 3014–3025. DOI 10.1109/TSMC.2019.2917034. [Google Scholar] [CrossRef]
51. Yang, J., Xin, L., Huang, H., He, Q. (2021). An improved algorithm for the detection of fastening targets based on machine vision. Computer Modeling in Engineering & Sciences, 128(2), 779–802. DOI 10.32604/cmes.2021.014993. [Google Scholar] [CrossRef]
52. Wu, J., Sun, Y., Wang, M., Liu, M. (2019). Hand-eye calibration: 4-D procrustes analysis approach. IEEE Transactions on Instrumentation and Measurement, 69(6), 2966–2981. DOI 10.1109/TIM.2019.2930710. [Google Scholar] [CrossRef]
53. Morrison, D., Corke, P., Leitner, J. (2018). Closing the loop for robotic grasping: A real-time, generative grasp synthesis approach. Arxiv Preprint ArXiv: 1804.05172. [Google Scholar]
54. Deng, X., Shao, H., Shi, L., Wang, X., Xie, T. (2020). A classification-detection approach of COVID-19 based on chest X-ray and CT by using keras pre-trained deep learning models. Computer Modeling in Engineering & Sciences, 125(2), 579–596. DOI 10.32604/cmes.2020.011920. [Google Scholar] [CrossRef]
55. Tie, J., Peng, H., Zhou, J. (2021). MRI brain tumor segmentation using 3D U-Net with dense encoder blocks and residual decoder blocks. Computer Modeling in Engineering Sciences, 128(2), 427–445. DOI 10.32604/cmes.2021.014107. [Google Scholar] [CrossRef]
56. Zhang, Y., Zhang, X., Zhu, W. (2021). ANC: Attention network for COVID-19 explainable diagnosis based on convolutional block attention module. Computer Modeling in Engineering & Sciences, 127(3), 1037–1058. DOI 10.32604/cmes.2021.015807. [Google Scholar] [CrossRef]
57. Qu, T., Di, S., Feng, T., Wang, Y., Zhao, M. et al. (2021). Deep learning predicts stress-strain relations of granular materials based on triaxial testing data. Computer Modeling in Engineering & Sciences, 128(1), 129–144. DOI 10.32604/cmes.2021.016172. [Google Scholar] [CrossRef]
58. Zou, Z., Shi, Z., Guo, Y., Ye, J. (2019). Object detection in 20 years: A survey. Arxiv Preprint ArXiv: 1905. [Google Scholar]
59. Zheng, Y., Zhang, W., Wu, X., Zhao, B. (2019). 3D bounding box proposal for on-street parking space status sensing in real world conditions. Computer Modeling in Engineering & Sciences, 119(3), 559–576. DOI 10.32604/cmes.2019.05684. [Google Scholar] [CrossRef]
60. Ma, D., Fang, H., Xue, B., Wang, F., Msekh, M. A. et al. (2020). Intelligent detection model based on a fully convolutional neural network for pavement cracks. Computer Modeling in Engineering & Sciences, 123(3), 1267–1291. DOI 10.32604/cmes.2020.09122. [Google Scholar] [CrossRef]
61. Wang, S., Cai, P., Wang, L., Liu, M. (2021). DiTNet: End-to-end 3D object detection and track ID assignment in Spatio-temporal world. IEEE Robotics and Automation Letters, 6(2), 3397–3404. DOI 10.1109/LRA.2021.3062016. [Google Scholar] [CrossRef]
62. He, K., Zhang, X., Ren, S., Sun, J. (2016). Deep residual learning for image recognition. Proceedings of the IEEE Conference on Computer Vision and Pattern Recognition, pp. 770–778. Las Vegas, Nevada, USA. [Google Scholar]
63. Asif, U., Tang, J., Harrer, S. (2018). GraspNet: An efficient convolutional neural network for real-time grasp detection for low-powered devices. Proceedings of the Twenty-Seventh International Joint Conference on Artificial Intelligence (IJCAI-18), pp. 4875–4882. Stockholm, Sweden. [Google Scholar]
 | This work is licensed under a Creative Commons Attribution 4.0 International License, which permits unrestricted use, distribution, and reproduction in any medium, provided the original work is properly cited. |