| Computer Modeling in Engineering & Sciences |
DOI: 10.32604/cmes.2022.020791
ARTICLE
An Intelligent Cluster Verification Model Using WSN to Avoid Close Proximity and Control Outbreak of Pandemic in a Massive Crowd
1Department of Computer Science, Umm Al-Qura University, Makkah Al-Mukarmah, 24381, Saudi Arabia
2Department of Computer Sciences, College of Computer and Information Sciences, Princess Nourah Bint Abdulrahman University, Riyadh, 11671, Saudi Arabia
3College of Computing and Information Technology, University of Bisha, Bisha, 67714, Saudi Arabia
*Corresponding Author: Norah Saleh Alghamdi. Email: nosalghamdi@pnu.edu.sa
Received: 13 December 2021; Accepted: 28 March 2022
Abstract: Assemblage at public places for religious or sports events has become an integral part of our lives. These gatherings pose a challenge at places where fast crowd verification with social distancing (SD) is required, especially during a pandemic. Presently, verification of crowds is carried out in the form of a queue that increases waiting time resulting in congestion, stampede, and the spread of diseases. This article proposes a cluster verification model (CVM) using a wireless sensor network (WSN), single cluster approach (SCA), and split cluster approach (SpCA) to solve the aforementioned problem for pandemic cases. We show that SD, cluster approaches, and verification by WSN can overcome the management issues by optimizing the cluster size and verification time. Hence, our proposed method minimizes the chances of spreading diseases and stampedes in large events such as a pilgrimage. We consider the assembly points in the annual pilgrimage to Makkah Al-Mukarmah and Umrah for verification using Contiki/Cooja tool. We compute results such as verified cluster members (CMs) to define cluster size, success rate to determine the best success rate, and verification time to determine the optimal verification time for various scenarios. We validate our model by comparing the results of each approach with the existing model. Our results show that the SpCA with SD is the best approach with a 96% success rate and optimization of verification time as compared to SCA with SD and the existing model.
Keywords: Cluster verification model; wireless sensor network; social distancing; crowd; single approach; split approach
Crowd management of thousands or millions of people poses an important challenge, especially during pandemics. The physical management and verification of people during a pandemic is a difficult task for large gatherings such as pilgrimages (Hajj), political congregations, sporting events, and live concerts. Substandard management may result in congestion, leading to the spread of diseases. Wireless sensor networks (WSNs) are self-configured wireless networks that monitor physical or environmental conditions and pass their data to a central location or sink for processing. Using WSNs, we can better manage crowds to reduce the chances of congestion. Faster crowd verification prevents congestion or bottlenecks at the city checkpoints of the Holy Makkah, entrance at the places of Pilgrimage event. When a large crowd needs to be processed with time limitations, queue-up techniques with new technologies are usually used for crowd verification. These techniques speed up the verification process but are insufficient for large crowds; long queues are formed that cause congestion, missing people, casualties, and the spread of disease. In our previous work, Nawaz et al. [1], we computed the verification time for a group of people using the concept of WSN. However, this study did not follow the single cluster approach (SCA) and split cluster approach (SpCA) with SD. In this article, we present a CVM for crowd verification at the assembly point during Pilgrimage (Hajj) and Umrah. The details are given in Section 3.2. CVM model optimizes this problem by verifying the crowd in a cluster to minimize the time required for verification. This cluster verification model (CVM) with social distancing (SD) will control the congestion and reduce the risk of casualties, stampedes, and the spread of diseases. We used both SCA and SpCA approaches to check their efficiencies with social distancing. The SCA, SpCA, and existing models were compared to identify the best approach with SD. This investigation considers parameters such as the optimal number of CMs (group size), success rate, optimal verification time, and compares the verification time of the proposed method with that of the current approach. We used the Cooja/Contiki simulation tool to demonstrate the proposed verification model using WSN and the multi-hop protocol. Both approaches provide better performance than the previous approach as shown in the results in Sections 6 and 7.
In this article, Section 2 presents the related work, Section 3 presents present and proposed verification models. Section 4 and 5 represent methodology and scenarios for SCA and SpCA approaches. Section 6 presents result analysis, Section 7 presents discussion and at the end Section 8 presents the conclusion.
In this section, we review previous research and crowd management technologies. Perera et al. [2] investigated the problem of how data can be sensed and used by stakeholders. They solved this problem using a sensing-as-a-service model, but they did not discuss about validity of the data. Numerous devices pose a significant challenge to the standard approaches to database management. Cabral et al. [3] proposed a centralized dynamic clustering approach to solve the problem of the cluster head (CH) centralized control cluster process but they did not discuss what is the criteria if the CH is at low energy level. Bajaber et al. [4] studied the collection of data, transmission, and selection of a new CH but shortcoming is that if data is exceeding the memory limit, then what to do? Banerjee et al. studied the establishment of cluster networks in [5,6]; different phases have been suggested for clustering algorithms, but they did not study about hybrid nature of network.
Nawaz et al. [7] discussed group formation and developed a conceptual model with operational phases but no practical work is done. Naeem et al. [8] designed a WSN based identification model to address issues with crowd identification but how sensor device will be verified is not discussed. Nawaz et al. [9] discussed the problem of available capacity and used a WSN to estimate zone, building, or area capacity but issue how to initialize the capacity is not solved. The issue of supplying food to a crowd on time by estimating food demand using the WSN architecture has been discussed by Nawaz et al. [10] but they did not provide any data set to verify the pilgrim’s capacity. To avoid false positive and false negative attacks, Nam et al. [11] employed a context-aware architecture but in case of wrong feedback how to handle the situation is not discussed. Weppner et al. [12] considered the problem of crowd density estimation, optimizing crowd monitoring using a WiFi/Bluetooth interface to prepare datasets for localization and filtration as the WiFi/Bluetooth has limit range they did not consider in case of long and big crowd. Nawaz et al. [13] proposed another relevant method to avoid casualties by managing the crowd according to dynamic positions and capacity. But they did not propose the how scheduling will be done to control the flow. Kulshrestha et al. [14] proposed a solution for monitoring MAC IDs for individual devices. They used sensors to collect information about the location of the user, and an algorithm was designed to monitor the MAC IDs. If the device is off or out of order what should be the alternate has not been discussed. To solve the problem of social distancing, a BioCrowds model-based solution was proposed by Knob et al. [15] using Unity 3D for interaction and movement between agents in a crowd simulation. However, it is needed to discuss what is the maximum limit in case of massive crowd. An icrowd framework was proposed by Saeed et al. [16] to solve the problem of monitoring and tracking individuals. But they did not proposed solution if one area is overcrowded then what to do?
A deep convolutional neural network model was built by Kammoun et al. [17] to estimate crowd size in high- and low-density public places. What is the possibility that high-density place become low and low become high is not discussed? Sharma et al. [18] proposed a solution to avoid COVID-19 by scanning the information of passengers at public places where seats are available or less crowded. But they did not discuss who has the priority if the number of passengers is more than the available capacity. Hidayat et al. [19] considered the prevention of overcrowding at footpath tracks using computer vision and deep learning surveillance methods. However, they did not suggest the suitable alternate if nearby footpaths are already overcrowded. CCTV footage was observed by Hoeben et al. [20] to calculate the instances of violations of 1.5-m distance directives in the weeks before, during, and after these directives. However, it is required to discuss about proactive approach to follow social distancing. Shukla et al. [21] developed a model to compute the distance between persons using open computer vision and YOLO object detection. In case of big crowd how to maintain the distance has not been discussed. Shearston et al. [22] used models to quantify changes based on time-series decomposition. They did not quantify according to the event and places. To identify real-time crowded areas and generate alerts to authorities, CrowdTracing was introduced by Kanjo et al. [23], which utilizes ubiquitous WiFi probing and density-based clustering techniques. What are the criteria to define the area and if the WiFi or device is not working what is the alternate?
Social distance detection was presented by Ansari et al. [24] using deep learning models and convolutional neural networks (CNNs). However, it is needed to arrange the massive crowd in case of social distance is not maintained. Ajith et al. [25] proposed a framework to perform detection of person and social distancing violations using object detection, agglomeration, and CNNs. But after detection how management control the crowd is not discussed. To detect SD violations, Yang et al. [26] introduced an active surveillance system using a vision-based real-time system. If there are multiple surveillance, then how the redundancy is removed. Rupapara et al. [27] provided a solution to deliver near-field peer-to-peer communication using smartphones to convert messages into sound waves. If the sound waves are not useful in an area, then what is the alternate. Nguyen et al. [28] surveyed how emerging technologies can force social distancing and discussed their issues and challenges but future directions are needed to explain with detail. To recognize assembly points, alarms, available exits, safest and shortest paths, and overcrowding from real-time data gathered by sensors. Fedele et al. [29] presented an IoT-WSN and algorithm-based near-field communication (NFC) systems but in case of big crowd verification they did not provide the solution. Fernandez et al. [30] presented a two-phase density-based analysis for collectives and crowds (2PD-CC) as an innovative method for public data in location-based social networks (LBSNs), however, it is required to discuss how to handle where devices are overlapping. Okimoto et al. [31] used machine learning to observe recorded videos and obtain reliable surveillance; however, this method required sufficient target data. Felemban et al. [32] presented a priority-based routing framework for flying ad hoc networks (PRoFFAN) that reduces response time by prioritizing the sending and forwarding of critical image data from unmanned aerial vehicles (UAVs) to the control center. However, this framework did not classify the critical situations. Liu et al. [33] investigated the verification and safety of considerable unscrupulous data. They investigated the identification of the working patterns of data verification using grounded theory methodology and intuition-based methods of data verification. However, this investigation required to verify the big data sets. Mahdi et al. [34] proposed hybrid encryption algorithm to monitor transmission pipeline to provides the security and timely transmission of data in WSN. However, it required to implement file systems on hardware of sensor and check the performance like HMAC (Hashed or Hash-based Message Authentication Code) method. Yang et al. [35] smarted wearable device for detecting hand tremor to collect acceleration and angular velocity of fingers with help of 3-axis gyroscope and a 3-axis accelerometer. However, need to discuss how quick response can be obtained at user and management side. Many previous studies have discussed crowd management, evacuation, verification, and monitoring during public events. Some articles have discussed the use of WSN radio frequency identification (RFID), image processing, and other video data processing. In our previous study, Nawaz et al. [1] investigated the verification time for a single group of people without considering the split approach and social distancing using a WSN.
The literature review shows different solutions for crowd management, real-time monitoring, and SD using simulations, techniques, and different technologies such as WSN, WiFi, Bluetooth, smartphones, algorithms, wearable devices and CCTV. But they did not study verification of the massive crowd in group with social distance to avoid bottleneck to prevent from pandemic diseases. In this article, we present a CVM model with social distancing (SD) to control the congestion and reduce the risk of casualties, stampedes, and the spread of diseases. We used both SCA and SpCA approaches to check their efficiencies with social distancing. The SCA, SpCA, and existing models were compared to identify the best approach with SD. This investigation considers parameters such as the optimal number of CMs (group size), success rate, optimal verification time, and compares the verification time of the proposed method. The proposed approaches show better performance than existing model and approaches with SD for different scenarios.
3 Present and Proposed Crowd Verification Models
In this section, we discuss the proposed crowd verification model. Presently, crowd verification involves queue verification using mobile apps. The proposed CVM involves cluster verification and sensor devices using the SCA and SpCA approaches with SD.
3.1 Present Crowd Verification Model
Currently, large crowds are verified using queues, as shown in Fig. 1. This happens at various locations, such as entrances to cities, airports, assembly points, Masjid Al-Haram, or other religious locations. It causes congestion and can lead to the spread of disease.
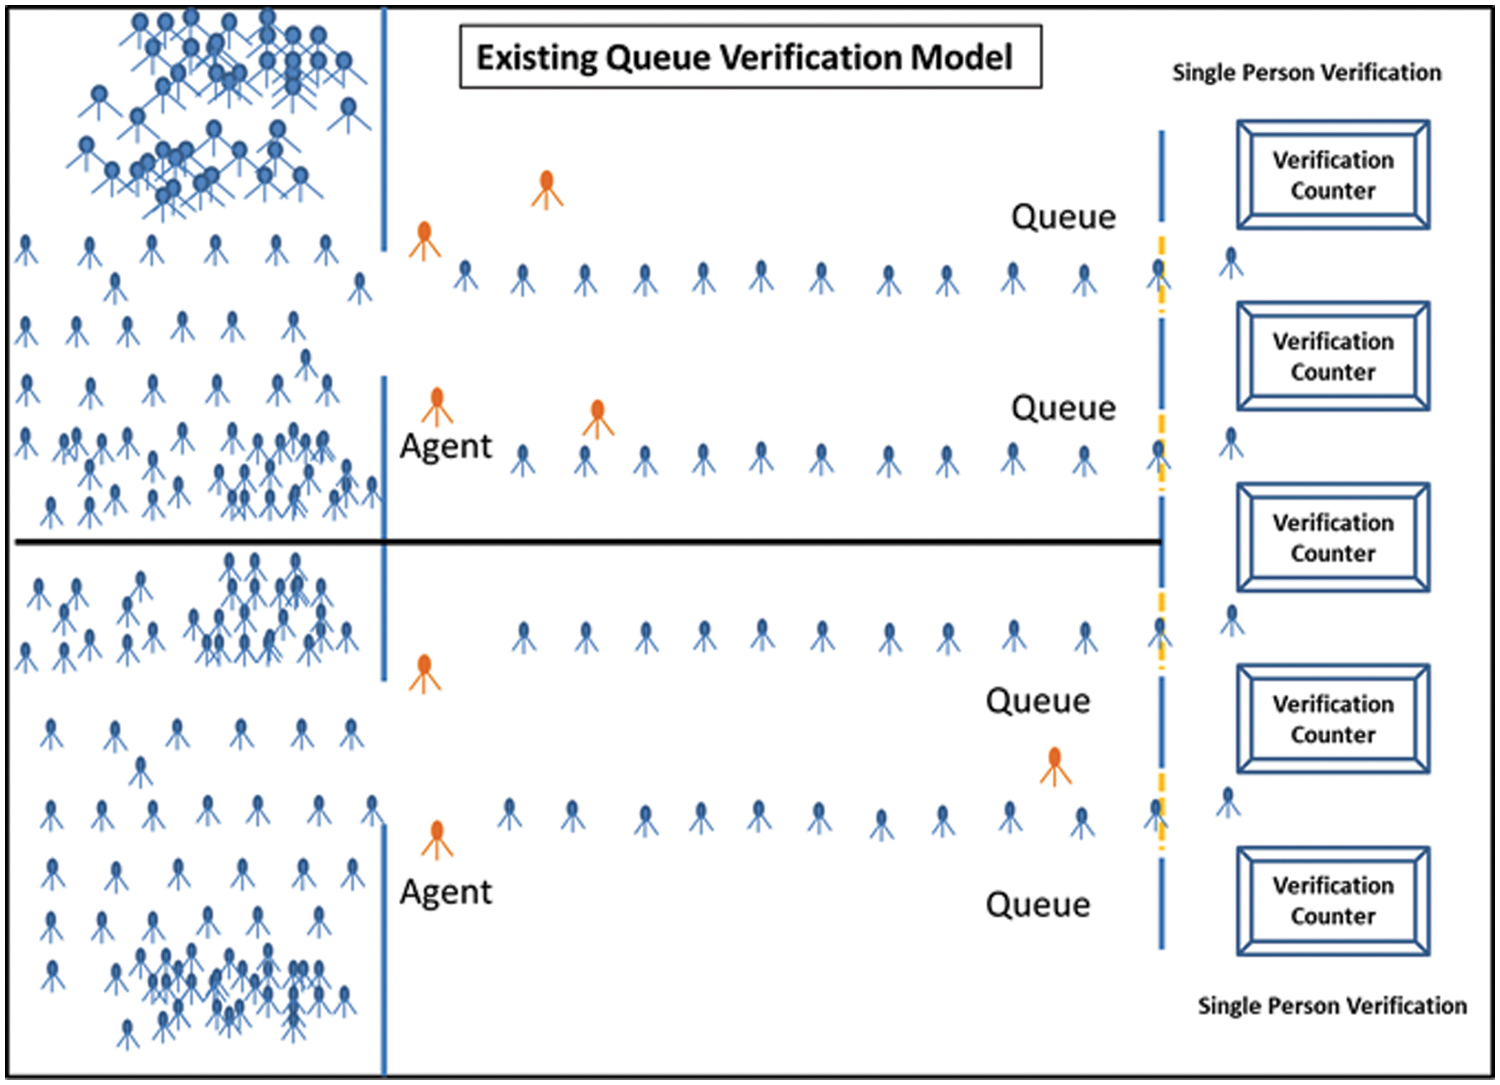
Figure 1: Existing queue verification model
Fast crowd verification means congestion and bottlenecks can be avoided. Consider verification at the assembly point as a use case: the assembly point is the place where pilgrims gather for verification before prayers, Pilgrimage, or Umrah. Verification involves several steps, such as temperature checking, opening the Tawakalna and Eatamarna apps for vaccine and permit status, permit scanning, paying for a bus ticket, taking the ticket, etc. Checks occur before entering the bus to Masjid Al-Haram. Several issues could delay the verification process; for example, the Tawakalna and Eatamarna apps may not work, the pilgrim’s mobile phone may not work, Internet connection problems, scanner problems, etc. Human delay is an important factor because it is difficult to verify numerous pilgrims in a limited time.
3.2 Proposed Crowd Verification Model
In related work, we discuss the technologies including smart cards, mobile phone IoT, and WSN devices to manage the crowd with queue verification. A high percentage of pilgrims are uneducated and are not technologically literate. Cost is also a limiting factor as a smartphone may not be affordable for every pilgrim. Based on the nature of the crowd, we consider pre-stored data, reusable devices, cluster approaches, and SD. As data are collected long before the arrival of pilgrims, authorities have sufficient time to burn or write data on sensor devices. Pilgrims are invited as a group and managed by a well-trained person acting as a CH with a CH device. These simple reusable devices are low cost and easy to use. The device’s simplicity means no expertise is required to use it, and as it is reusable, the pilgrims will return it at the end of the Pilgrimage or Umrah, and data can be burnt for new pilgrims.
Figs. 2 and 3 present the proposed CVM model with different steps. After the approval of the Pilgrimage or Umrah permit, the pilgrims are given sensor devices prewritten with their data. This personal sensor device displays their temperature status; if the status is valid, they are sent to the assembly point. Pilgrims are then arranged in linear position with group formation and SD. A WSN is used to validate their permit, and if the permit status is valid, the sensor device’s LED turns green, indicating that the pilgrim can enter the bus to the Masjid Al-Haram. If the WSN cannot validate their permit, they are directed to a counter for manual verification. Manual verification is performed as in the previous model. To prevent a pilgrim from being verified multiple times, we can set the LED status for a specific amount of time. In case of proposed model, the time interval to travel from assembly point to bus and Al-Haram is approximately 10-min. LED time to turn into green can be set to 15-min. People are controlled at the assembly point and send by busses according to the available capacity in Al-Haram. Proper scheduling is done, and management communicate the available capacity at Al-Haram to assembly point. In worst case, if time exceeds the 15-min time limit for some pilgrims then these pilgrims have to verify again at Al-Haram Gate.
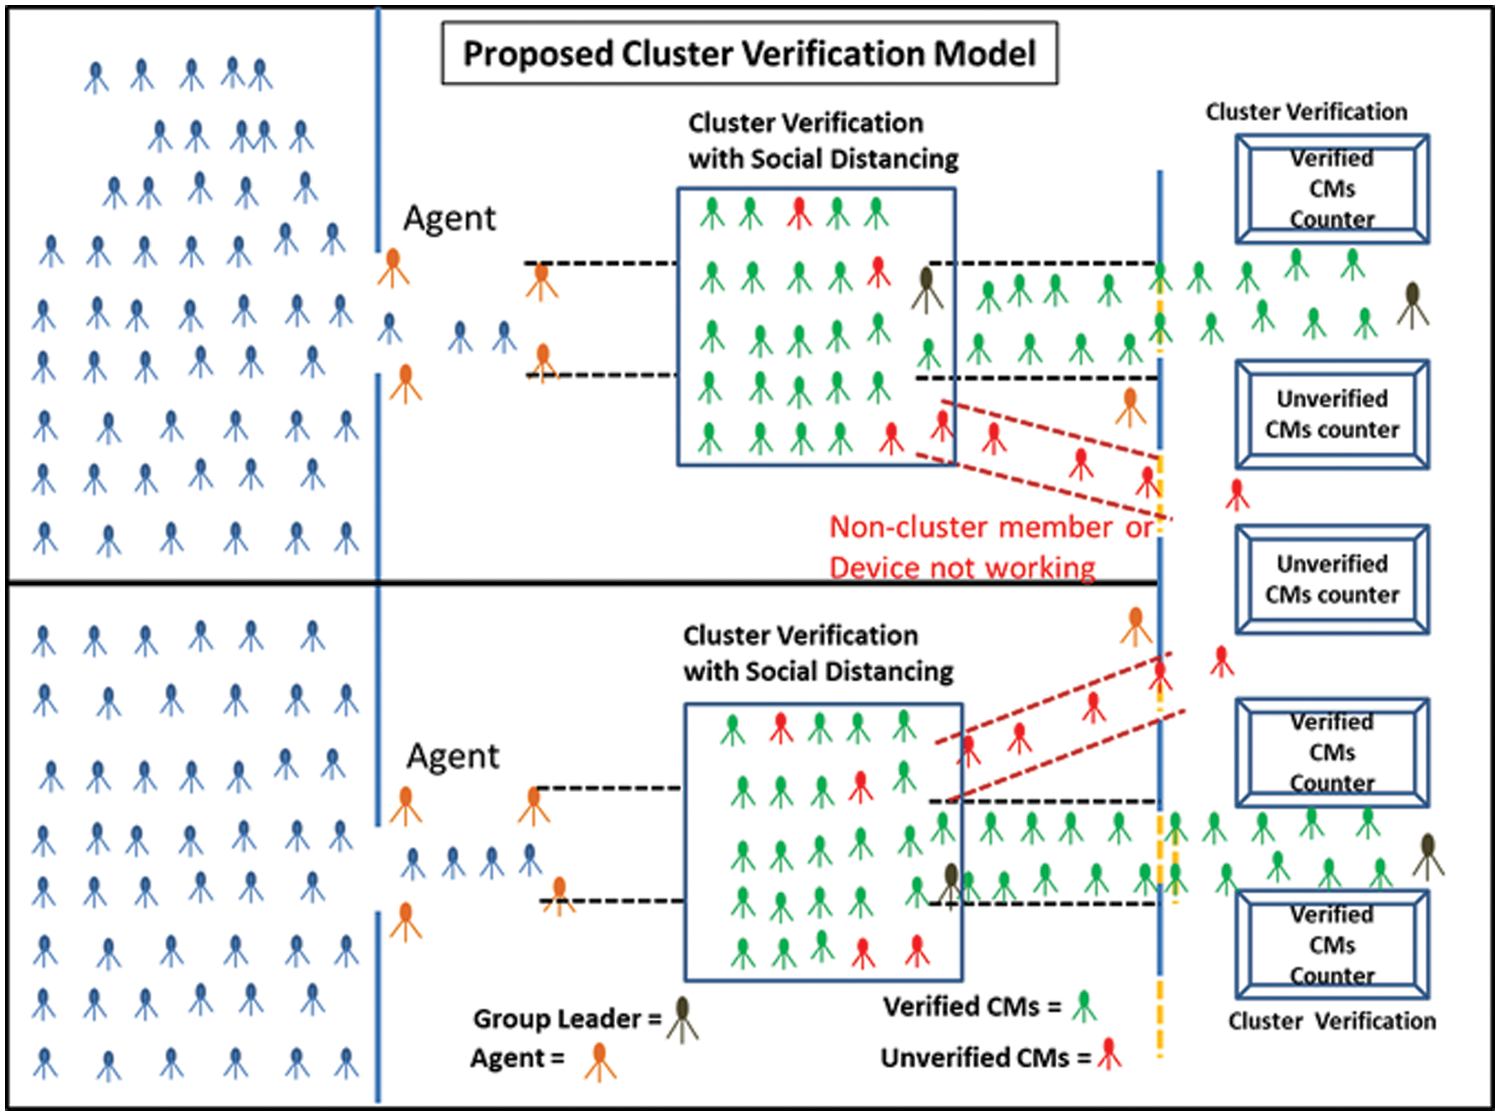
Figure 2: Proposed cluster verification model
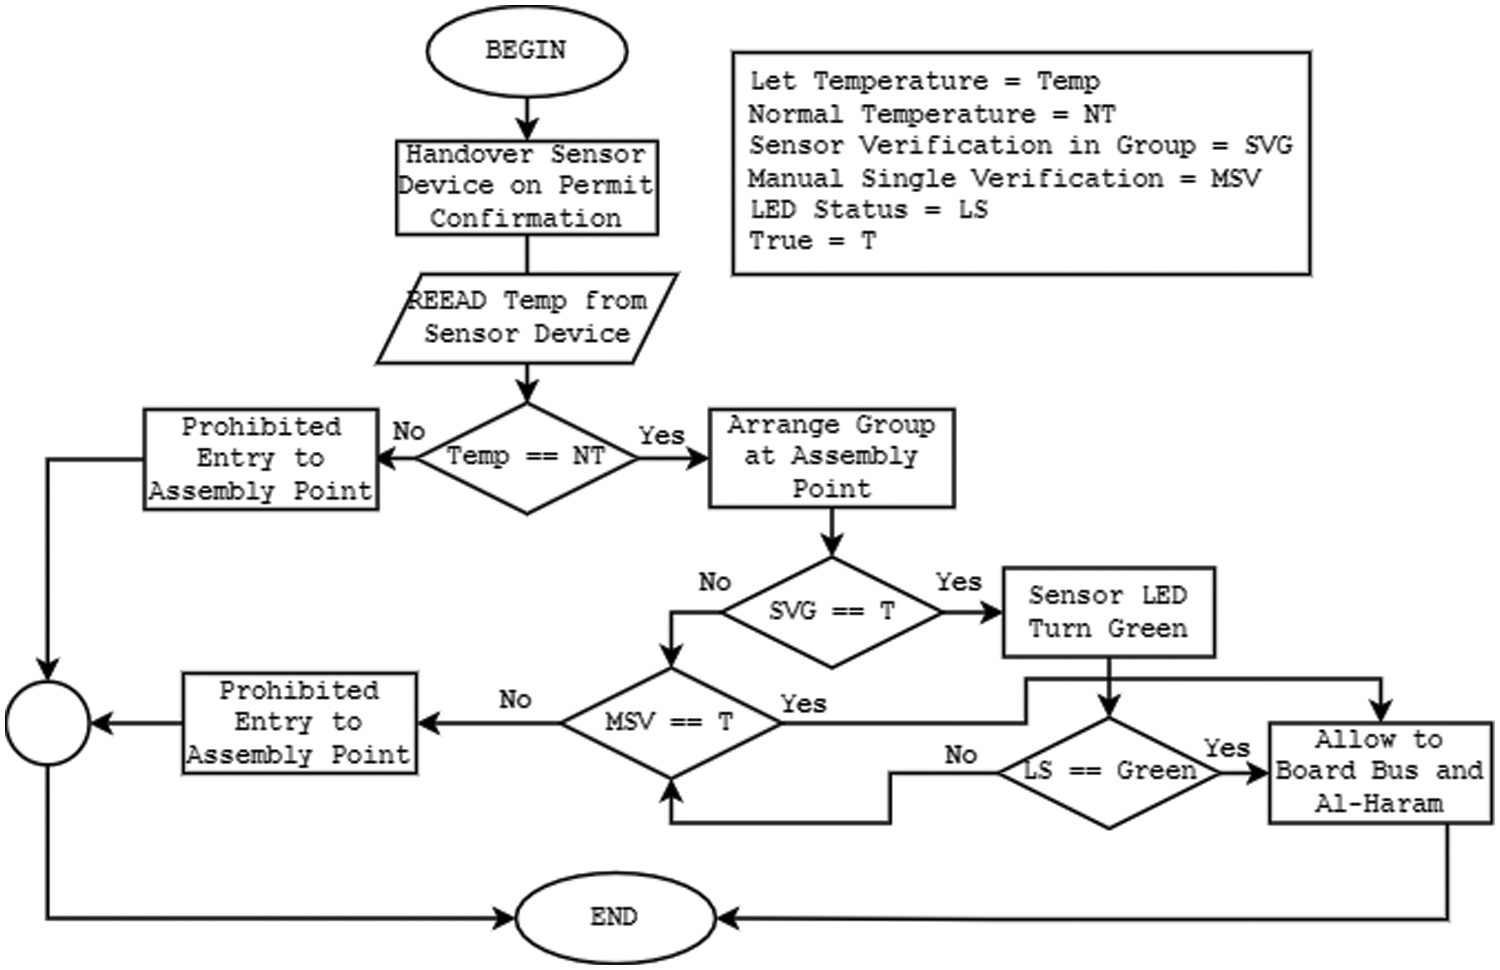
Figure 3: Flowchart for proposed model at assembly point verification
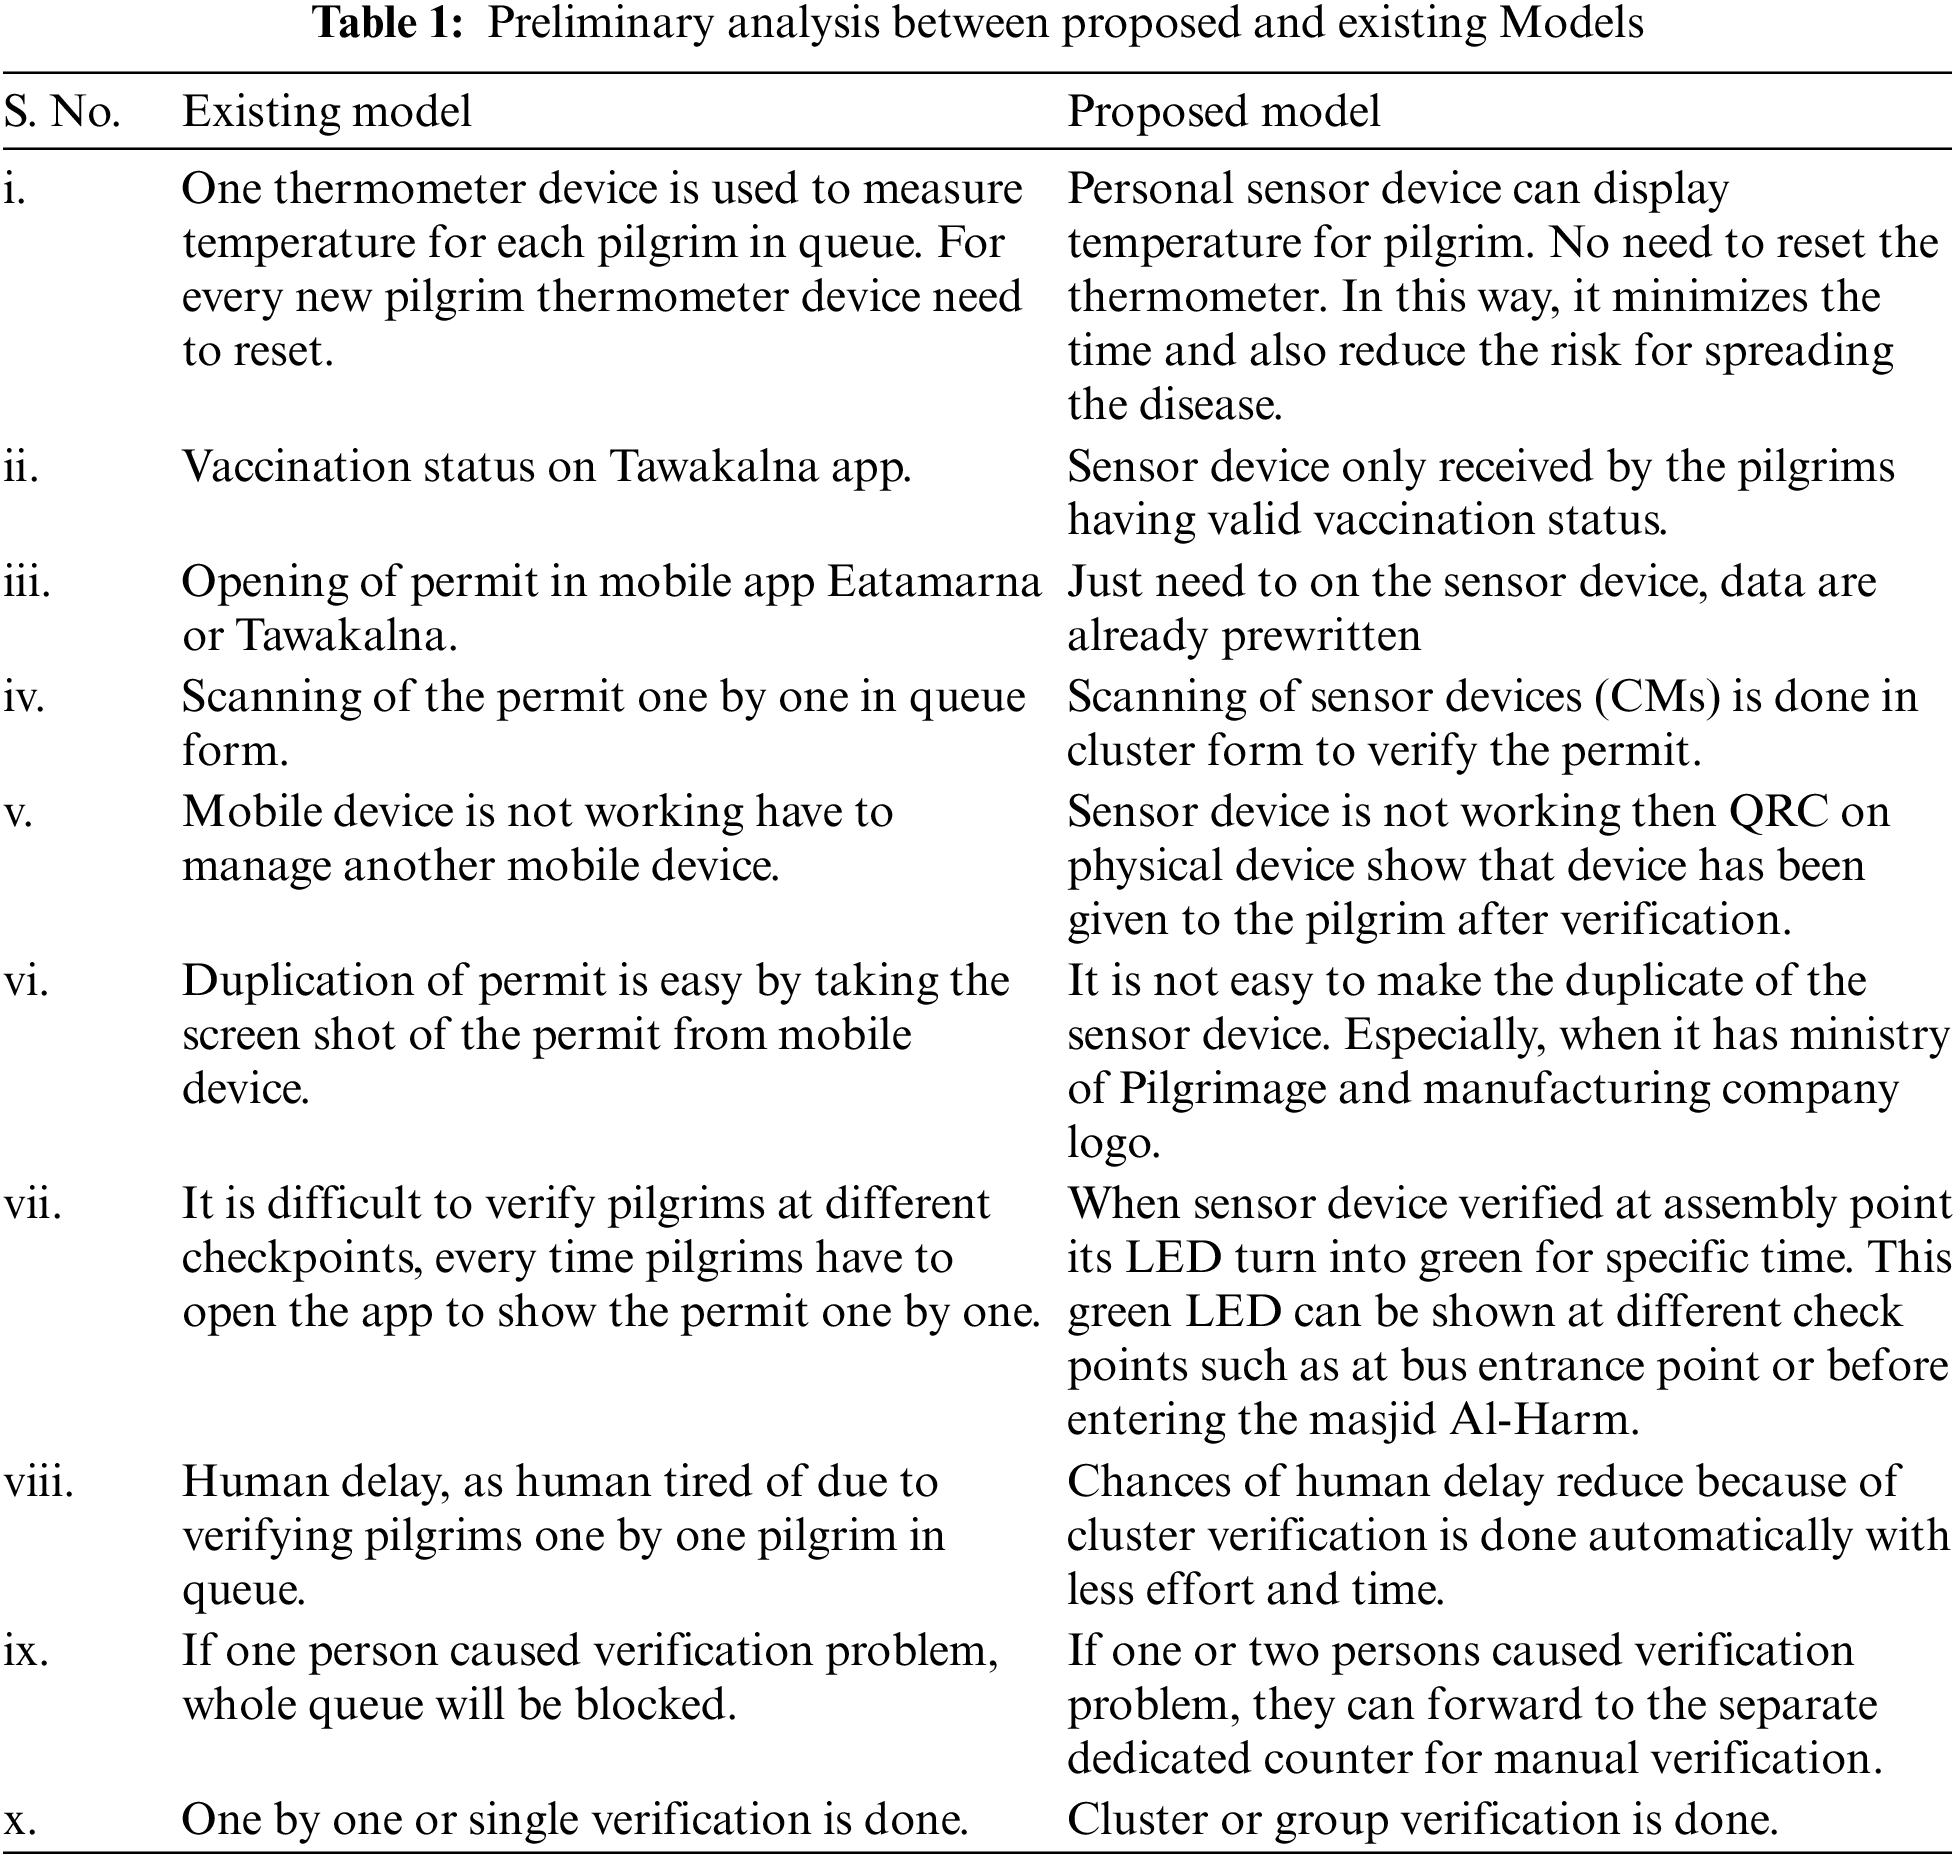
Table 1 presents a preliminary analysis of the different aspects of both the existing and proposed verification models.
In this section, we discuss the design of the SCA and SpCA approaches, as shown in Figs. 4a and 4b. In Fig. 5a, we discuss a simple scenario, and in Fig. 5b, we present the algorithm for the CVM model. Further, we discuss the measurement of SD, and some important parameters used in the simulation.
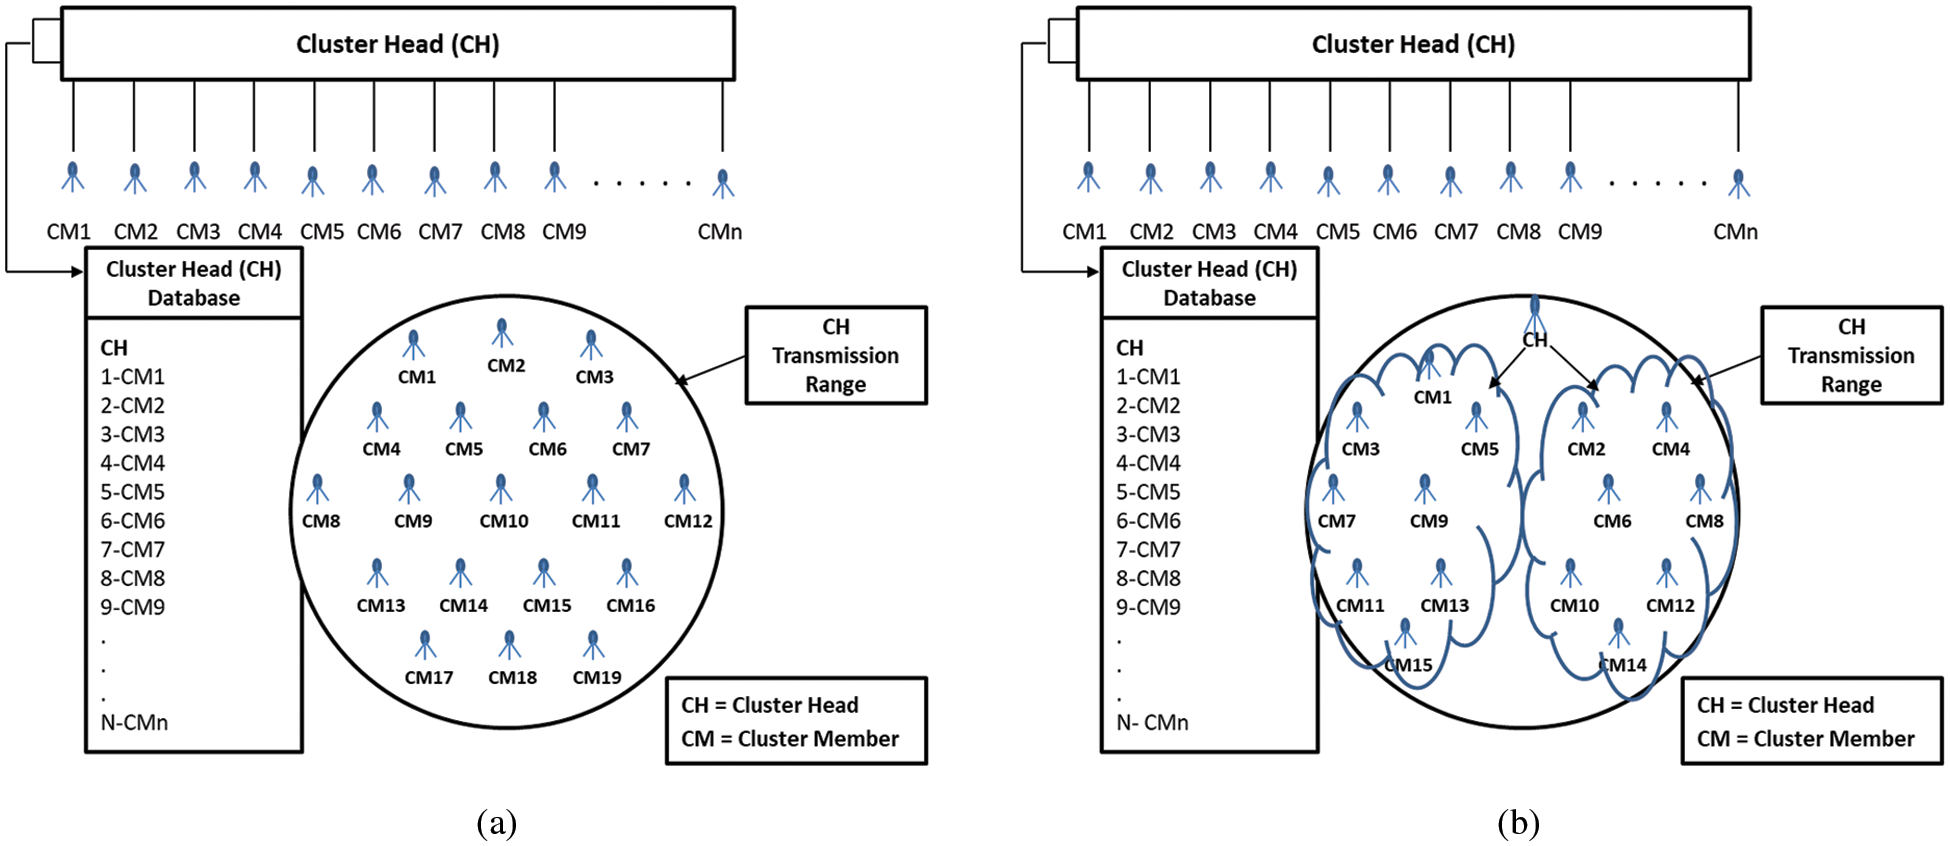
Figure 4: (a) Design for SCA approach with SD; (b) Design for SpCA approach with SD
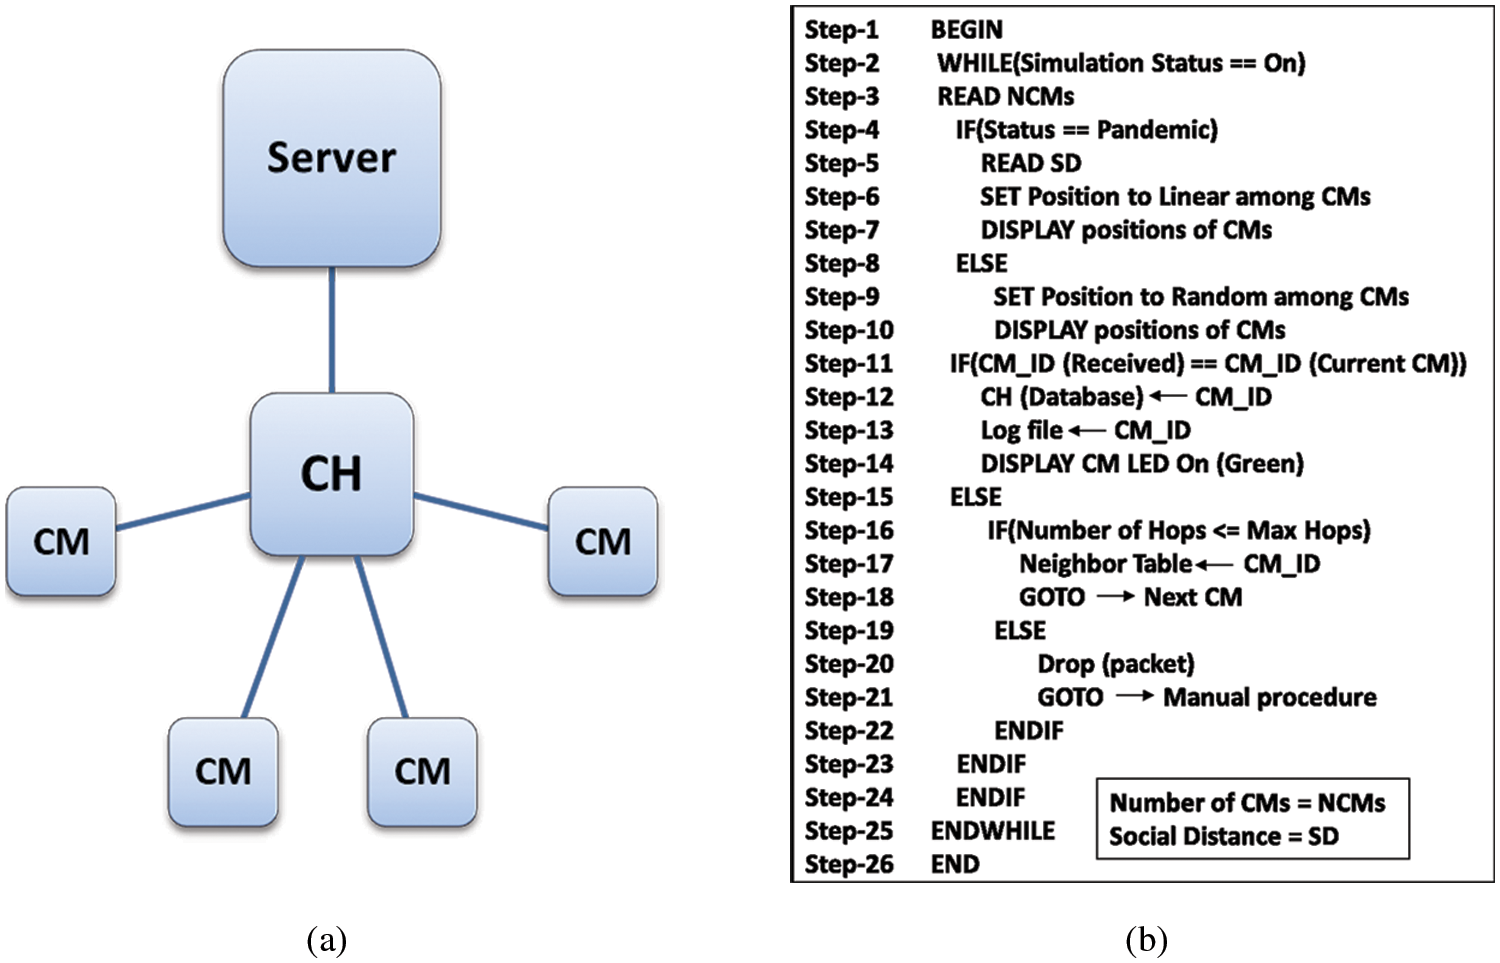
Figure 5: (a) Scenario for flow and functions of nodes; (b) algorithm for cluster verification at assembly point
4.1 Design for SCA and SpCA Approaches
Figs. 4a and 4b show the SCA and SpCA approaches with SD. It also shows the hierarchy of the functions and flow of information among servers, CHs, and CMs. The Antelope enables the operation of a database management system (DBMS) by providing a set of relational operations for the creation of a dynamic database and to run complex queries. The CH contains the information of the CMs, and the CMs hold the personal information of pilgrims. The Cooja/Contiki tool supports the Antelope database management system (DBMS). It is an index-independent, energy-efficient, and high-level data model DBMS by Liu et al. for resource-constrained sensor nodes [36].
4.2 Algorithm for Cluster Verification at Assembly Point Management
Fig. 5a shows the information flow and hierarchical structure of the cluster. Fig. 5b shows the algorithm for the proposed CVM at the assembly point. The data for CMs or group members are stored on the sensor device at the time of the visa process (internationally) and at the time of permits (locally). Data for CMs in the same group will be stored in a device called the CH. Pilgrimage and Umrah events are scheduled at a specific date and time, and data can be written onto the CH based on the schedule.
According to the algorithm, if there is a pandemic, the value for distance is obtained according to the standard operating procedure (SOP), and the pilgrims are arranged in a linear position with group formation; otherwise, the pilgrims are arranged randomly. The cluster or group head broadcasts a “hello” packet to its CMs for synchronization. CMs receive the “hello” packets, and reply to the CH to show their presence. The CH sends the CM_ID to its group for verification. The CM receives CM_ID and checks for a match with its CM_ID. If it matches, then the CM LED turns green (flag set to 1). If CM_ID does not match, it forwards the CM_ID to the next CM based on the neighbor table and multi-hop communication. For an unverified CM, the LED will remain off (flag remains 0), and they will be processed by the existing model on the separately dedicated counter. All verified CMs can board the bus to Masjid Al-Haram. The proposed cluster verification is shown in Figs. 2 and 3.
Social distancing is defined as physical distancing between individuals to prevent the spread of an infectious disease [37]. Nobajas et al. [38] proposed that the physical separation can be between 1 to 2 m according to the situation, to minimize the risk of spreading disease by coughing, sneezing, or speaking. Calculation of SD according to the SOP for triage of suspected COVID-19 patients is as follows:
Social distancing for 1.5 m
If r = 0.75 m, then according to Eq. (1)
Area of circle = 3.14 × (0.75)2 = 1.77 m²
We can calculate SD for radii 1.5 and 1 m similarly.
SD, including space for the human body to calculate the total space required per person, is given in Eq. (2).
where B = Space required for human body.
The calculations are listed in Table 2, according to Fig. 6 and Eq. (2).
1: Standard (Pre-COVID) Capacity: Standing and Seated
3–1.5 m SD Capacity: Standing and Seated
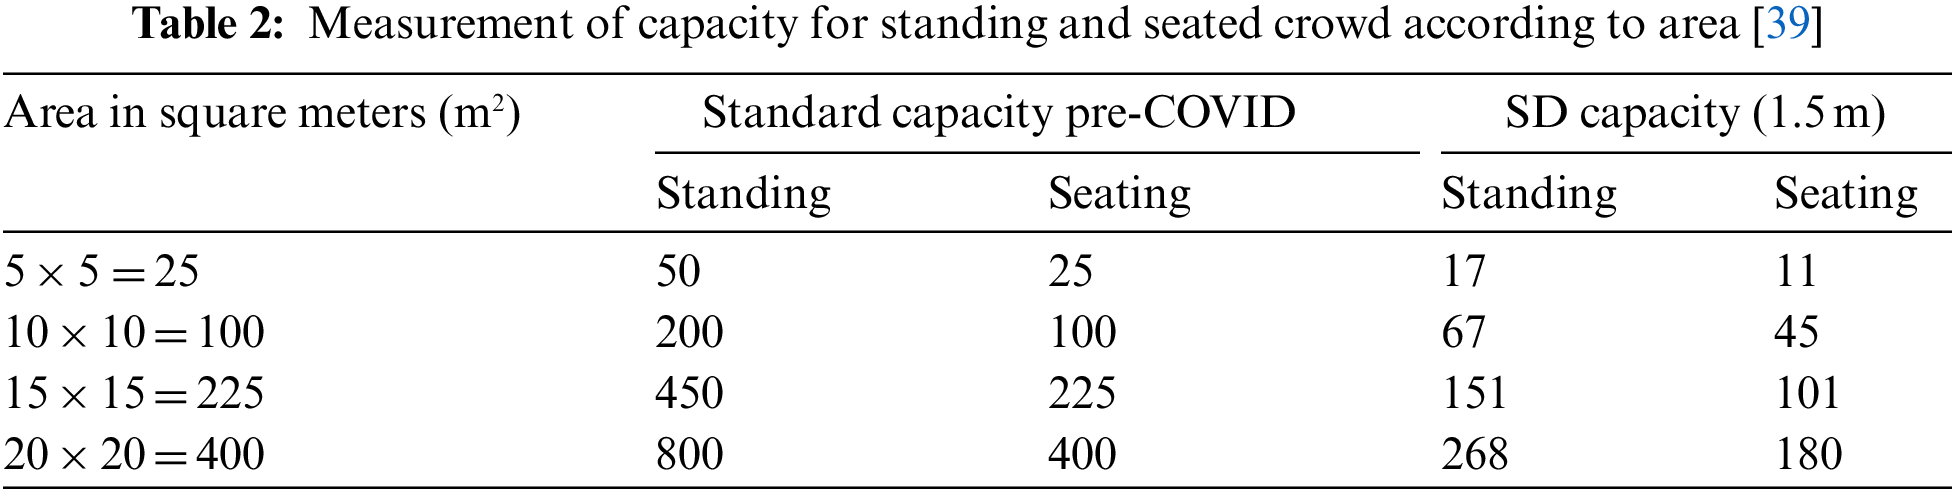
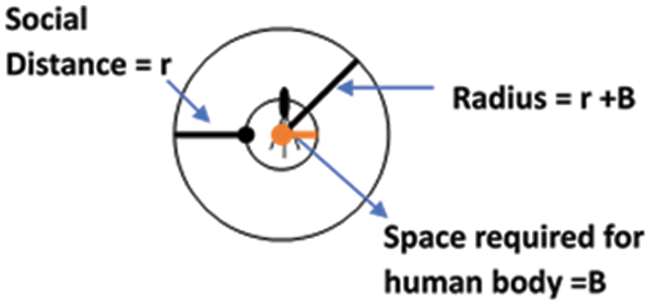
Figure 6: Social distance measurement
4.4 Parameters for CVM with SD
Here we briefly define some important simulation parameters and their values. We populate the single and split clusters with 5, 10, 15, 20, 25, 30, 35, 40, 45, and 50 CMs to reduce the number of simulations. We calculated the number of verified CMs, the success rate, and the verification time. The transmission range is 100 m × 100 m to ensure the coverage of CMs by CH with SD. The startup delay time is 1000 ms to synchronize the communication. The neighbor timeout is 60 s to avoid the overflow of the table by removing the old entry. The maximum number of neighbors a CM can support is 16. If the number of neighbors increases, the CM must manage more entries in its table. When number of entries increase in the neighbor table then more memory is required to store the entries or data in the table. As data increase in the table, it requires more time to read data from table. Consequently, it also increases the response time for verification. To set the positions of the CMs, we used a linear position to determine the effect of SD. Linear position facilitates us to maintain the social distance between the CMs such as 1, 2, 3 m in group format. In case of random position, social distance cannot be maintained or managed. The x and y coordinates represent the positions of the CMs. Communication for synchronization is broadcast, and for verification, it is multi-hop routing. The Contiki lightweight protocol is called the CSMA MAC protocol that supports low-power, low-memory, and low-processing wireless sensor devices. The simulation time is the time required to obtain the desired results or end the simulation process.
5 Simulation Scenarios for SCA and SpCA Approaches
There are different scenarios for SCA and SpCA approaches to evaluate verified CMs in a cluster to set the group or cluster size, success rate, and verification time with SD. Different scenarios for the SCA and SpCA considered in this study include the following:
5.1 Scenarios for SCA Approach with SD
In the SCA approach, CMs are located in linear positions and with SD. We kept the background white to identify the verified CMs using green LEDs. Later, the number of CMs was increased by the addition of five CMs in a single cluster. The results for mote are obtained by analyzing the log file provided by Contiki/Cooja, as discussed by Velinov et al. [40]. The maximum number of CMs is 50, because as the number of CMs increases past 30, both the number of unverified CMs and the verification time increase. Hence, significance of the SCA approach was reduced, and our system took a long time to run the simulations and sometimes hung up. Fig. 7a shows the scenario where all five CMs are verified.
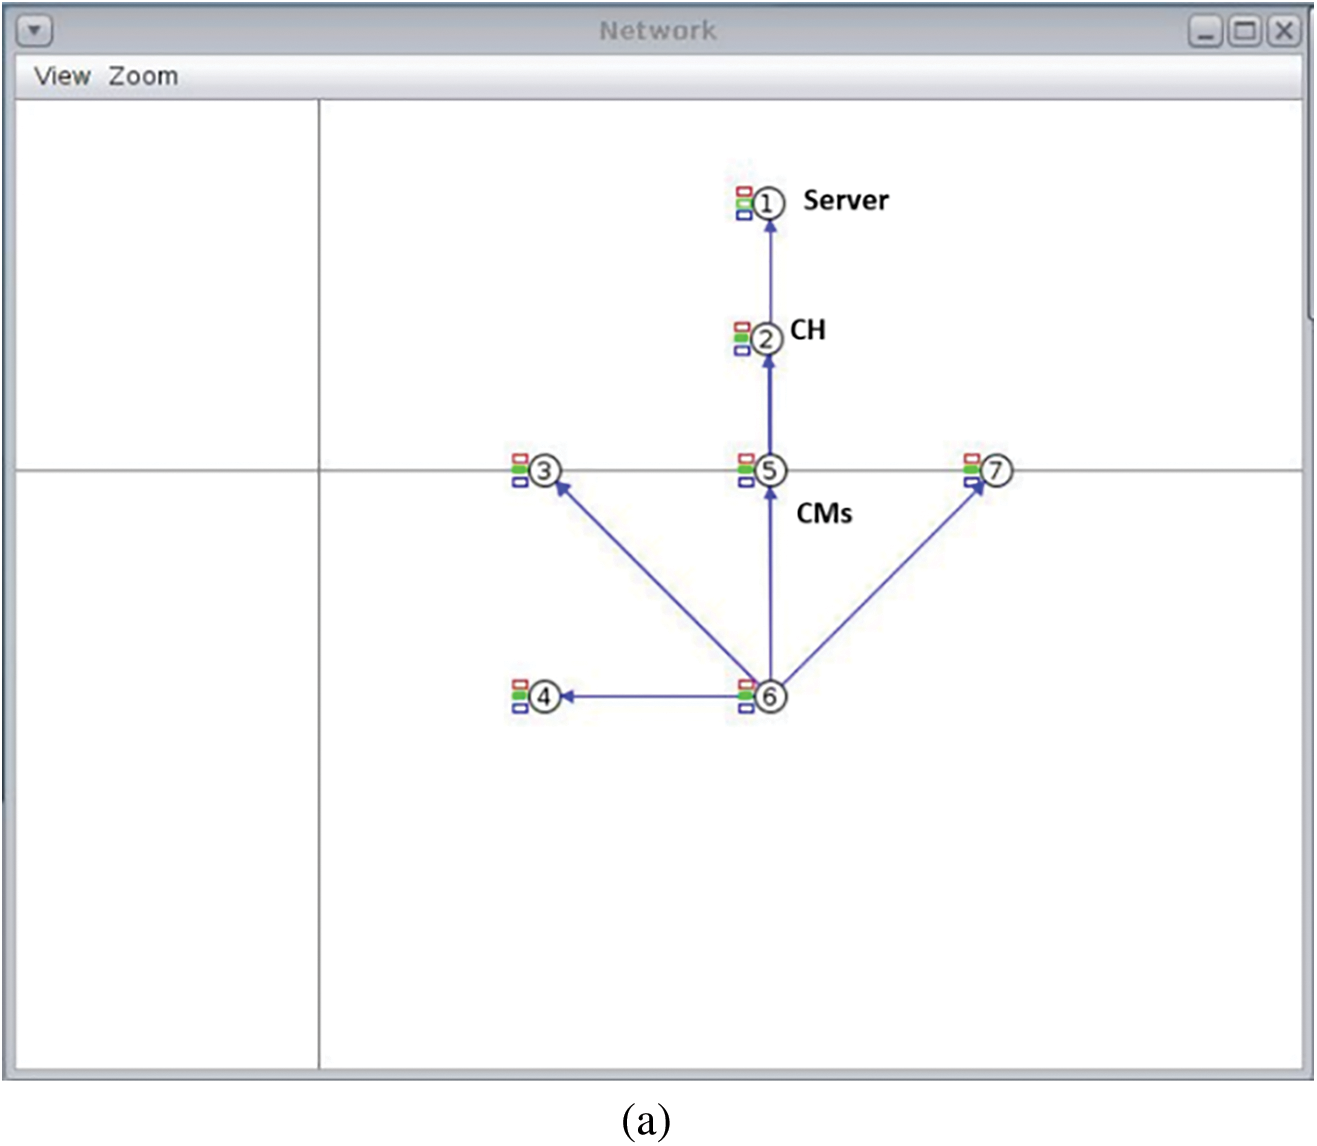
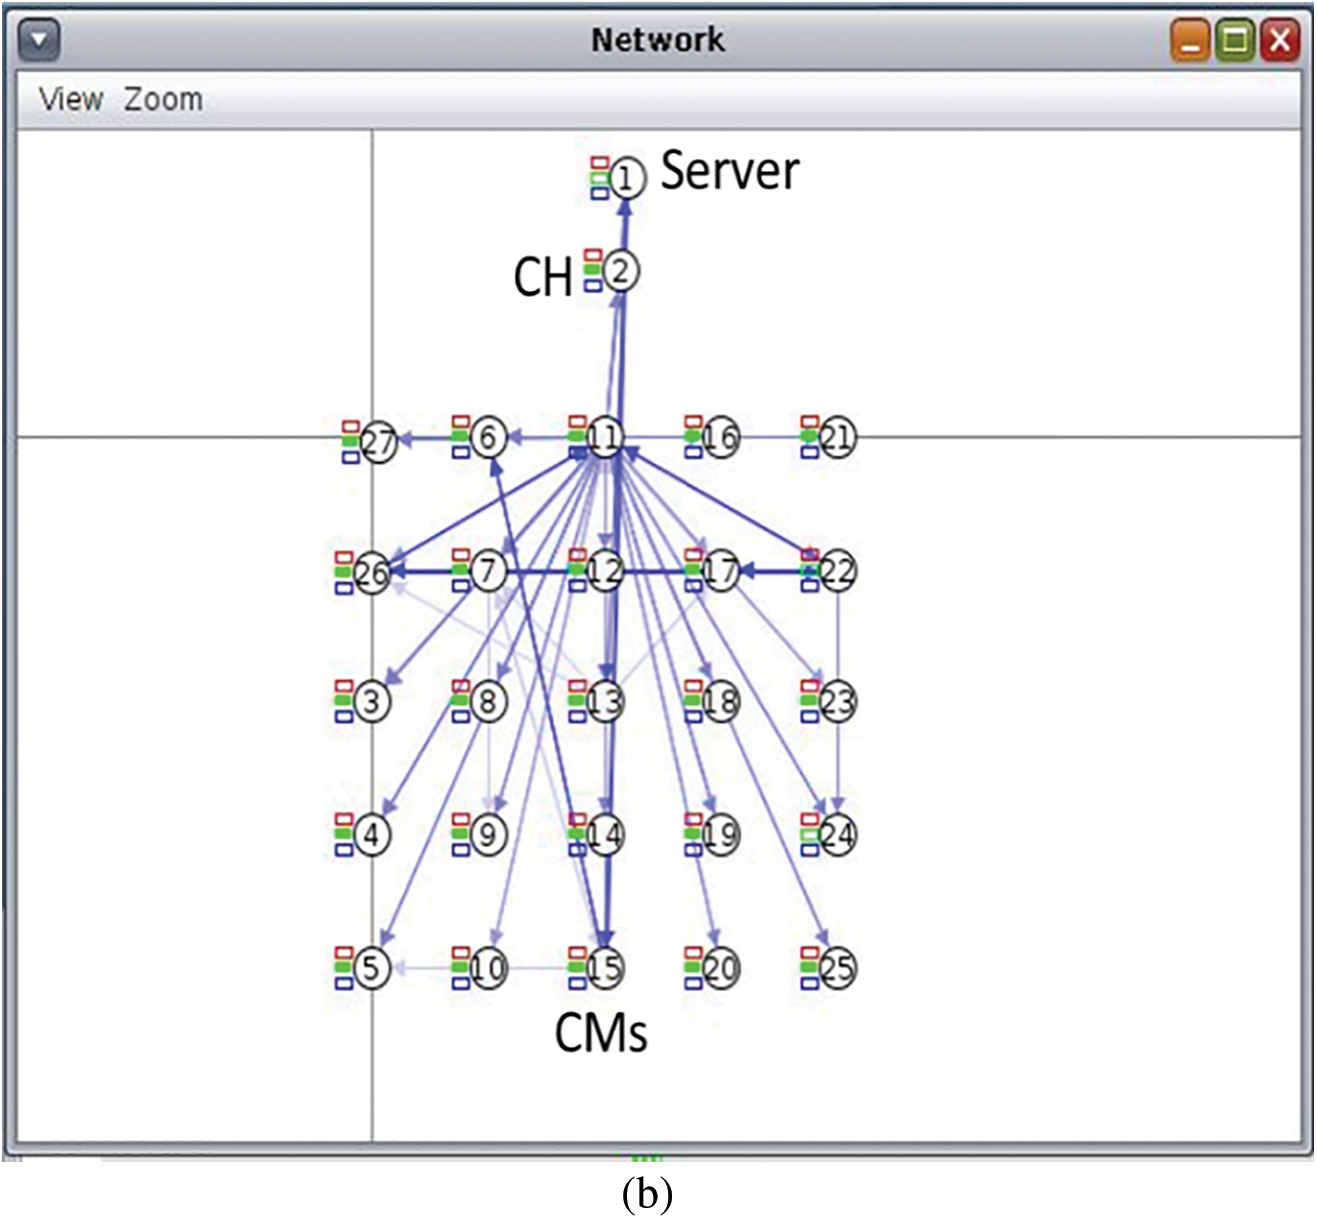
Figure 7: (a) Single cluster having 5 CMs with SD; (b) Single cluster having 25 CMs with SD
Fig. 7b shows 25 CMs in a cluster with linear position, and SD. CMs with CM_ID 22 and 24 remain unverified, indicating that 23 out of 25 CMs were verified. In the same way, when there are 40 CMs, only 14 CMs are verified, with 26 remaining unverified. The SCA approach with SD showed better performance than the existing model. Further results of the simulations with different scenarios are given in Tables 3 and 4. The different scenarios for the SCA approach are given in [41].
5.2 Scenarios for SpCA Approach with SDs
In the SpCA approach, we keep the CMs in each sub-cluster in a linear position to maintain SD under one CH. Fig. 8a shows one such scenario. The server and the CH were assigned IDs 1 and 2, respectively. Sub-cluster1 had CMs 3 to 7, whereas sub-cluster2 had CMs 8 to 12. All 10 CMs were successfully verified.
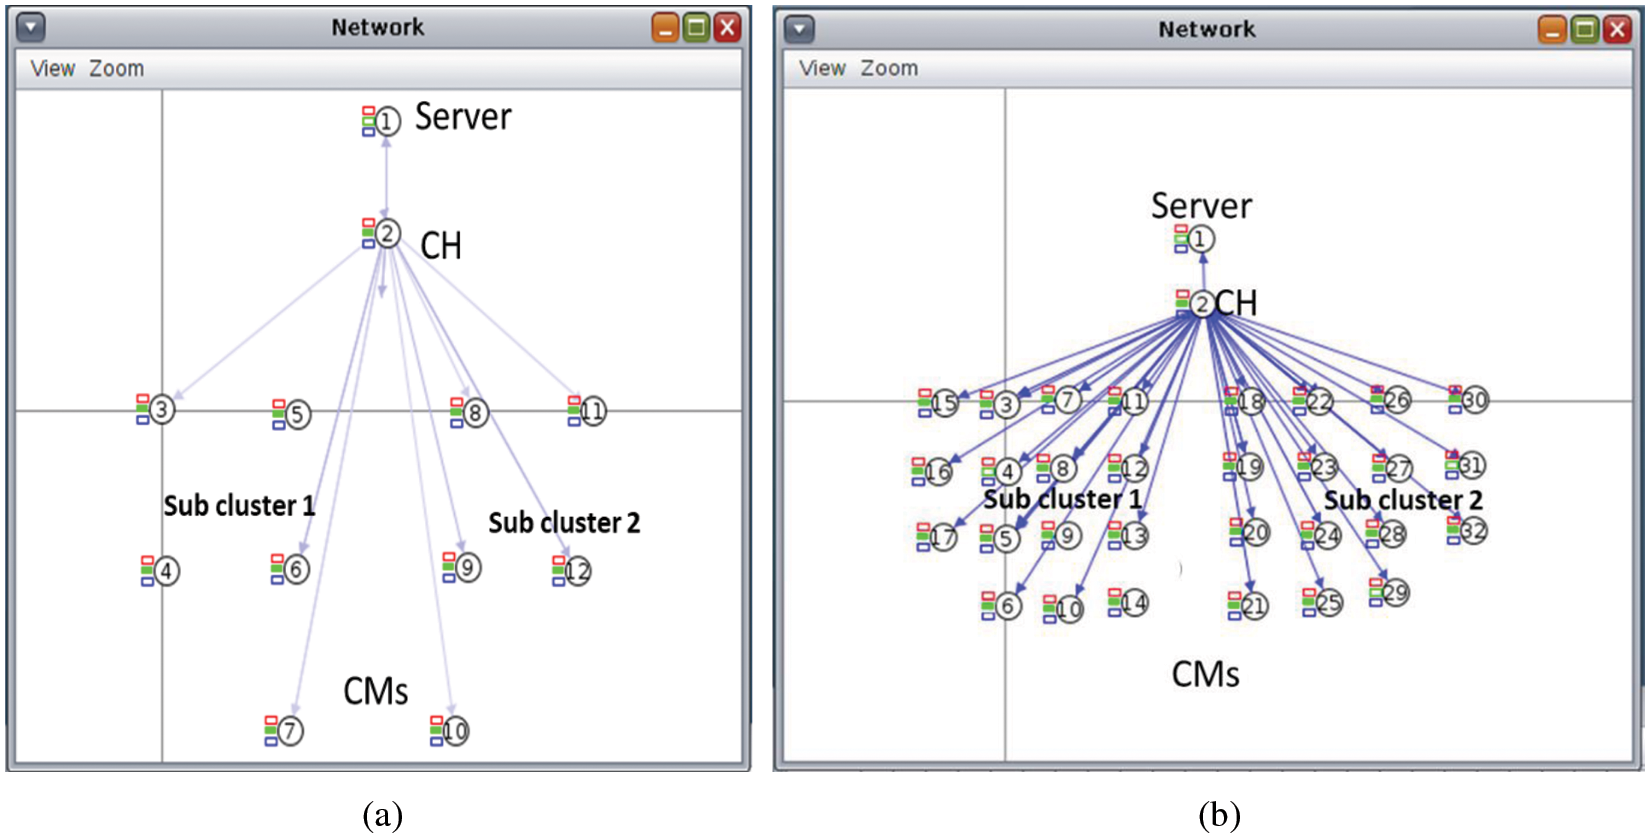
Figure 8: (a) Split cluster having sub-clusters of 5--5 CMs with SD; (b) split cluster having sub-clusters of 15–15 CMs with SD
In Fig. 8b, sub-cluster1 has CMs 3 to 17 whereas sub-cluster2 has CMs 18 to 32. 27 out of the 30 CMs were verified successfully. CMs 4, 29, and 31 remained unverified. Further resultsof the simulations with different scenarios are presented in Tables 5 and 6. The different scenarios for the SpCA approach are given in [41].
6 Results Analysis of SCA and SpCA Approaches
The results for different scenarios for the SCA and SpCA approaches are presented in this section. The results were obtained by changing the number of CMs in each cluster. We focused on the number of verified CMs, success rates, and cluster verification times with SD.
In the SCA approach, we varied the number of CMs in the cluster. We kept different parameters constant such as neighbor timeout, the maximum number of neighbors, transmission range, and interface range to evaluate the number of verified CMs, success rate, and cluster verification time.
6.1.1 Verified vs. Unverified CMs and Success Rate for SCA Approach with SD
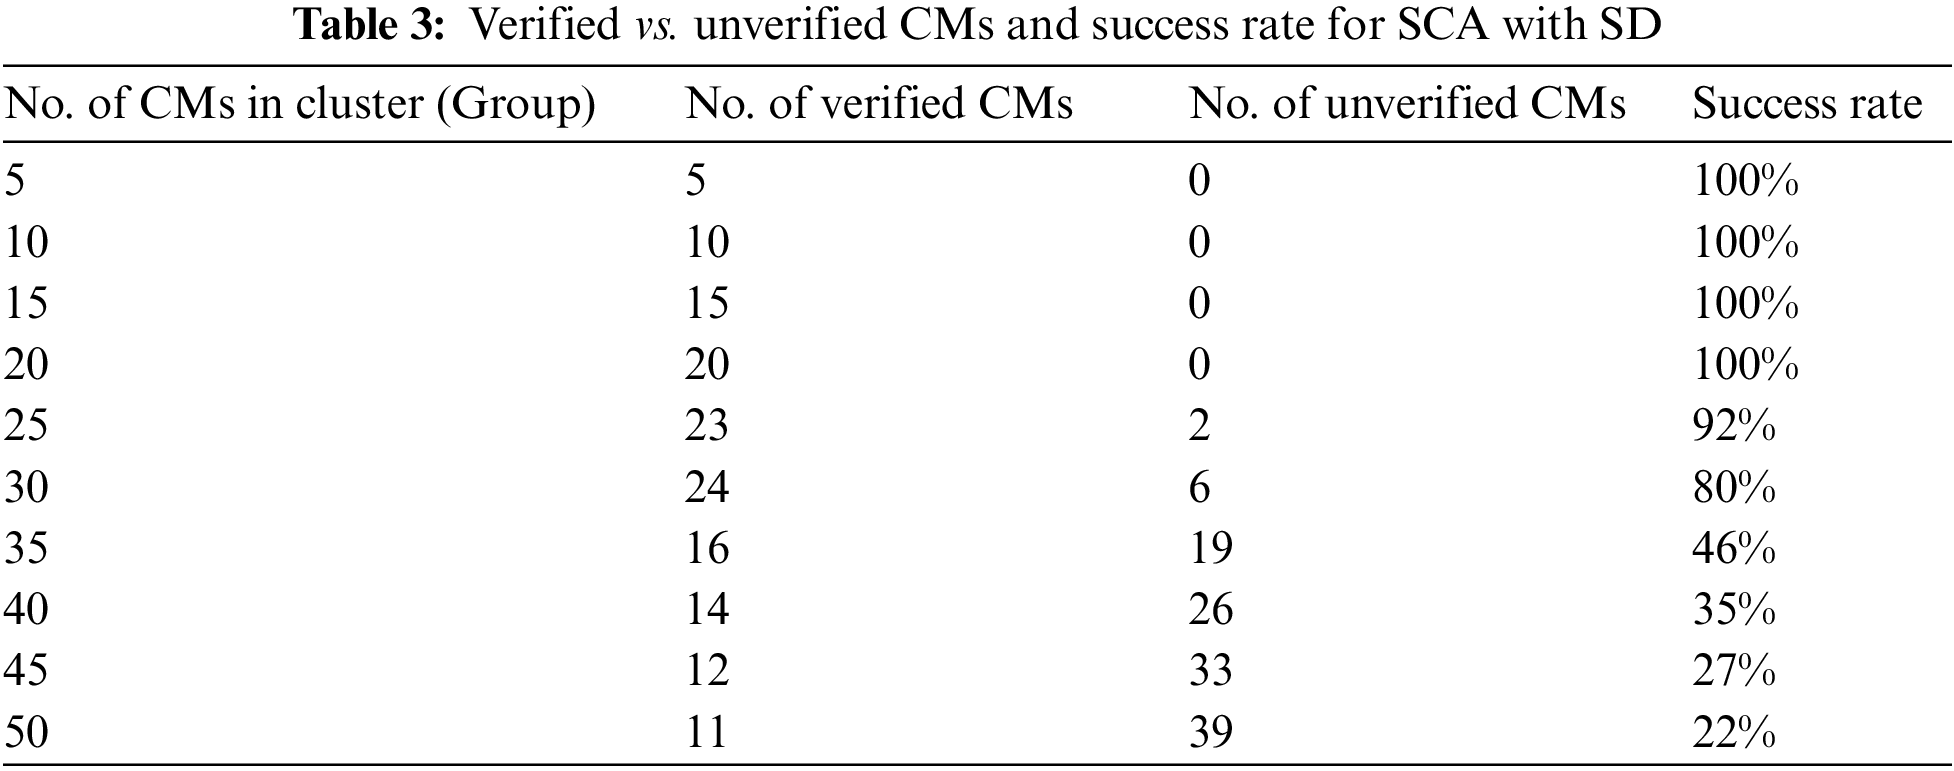
To evaluate the SCA approach for CVM, we linearly populated the CMs with SD to avoid the spread of diseases such as COVID-19. We increased the number of CMs by five each time until 50 CMs were running in a single cluster. Simulation scenarios for SCA with SD ran smoothly and provided simulation results, as shown in Table 3 and Fig. 9. The number of unverified CMs was zero when there were 5, 10, 15, or 20 CMs in the cluster. However, with 25 CMs, the number of unverified CMs was 2 (2 out of 25 CMs). The maximum number of verified CMs was 24, when there were 30 CMs in a cluster. The number of verified CMs decreased gradually to 11 when the cluster size was 50. The log files are given in [42].
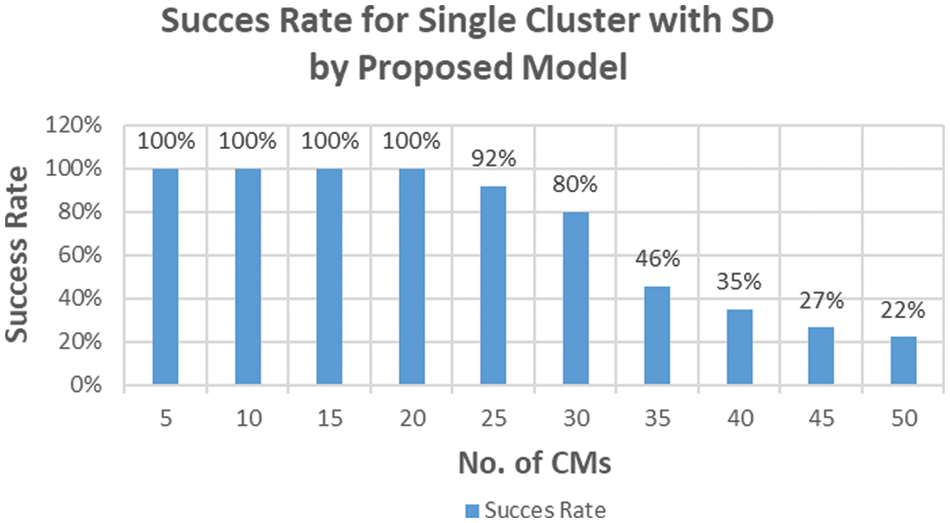
Figure 9: Success rate for SCA with SD by proposed model
In the column chart in Fig. 9, the success rate is 100% when there are between 5 and 20 CMs in the cluster. As we increased the number of CMs from 20 to 25, the success rate decreased to 92%. This further decreased to 22% as the number of CMs increased to 50. The optimal number of CMs in a single cluster with SD is 20 with a 100% success rate, and the maximum verified CMs are 23 with a success rate of 92%. The minimum success rate was 22% when there were 50 CMs in a single cluster with SD.
6.1.2 Verification Time for Proposed vs. Existing Model for SCA Approach with SD (Verified & Unverified CMs)
Simulations provide verification time for verified CMs in log files, as given in Eq. (3), where T(DelaySim) is the time delay in the simulation.
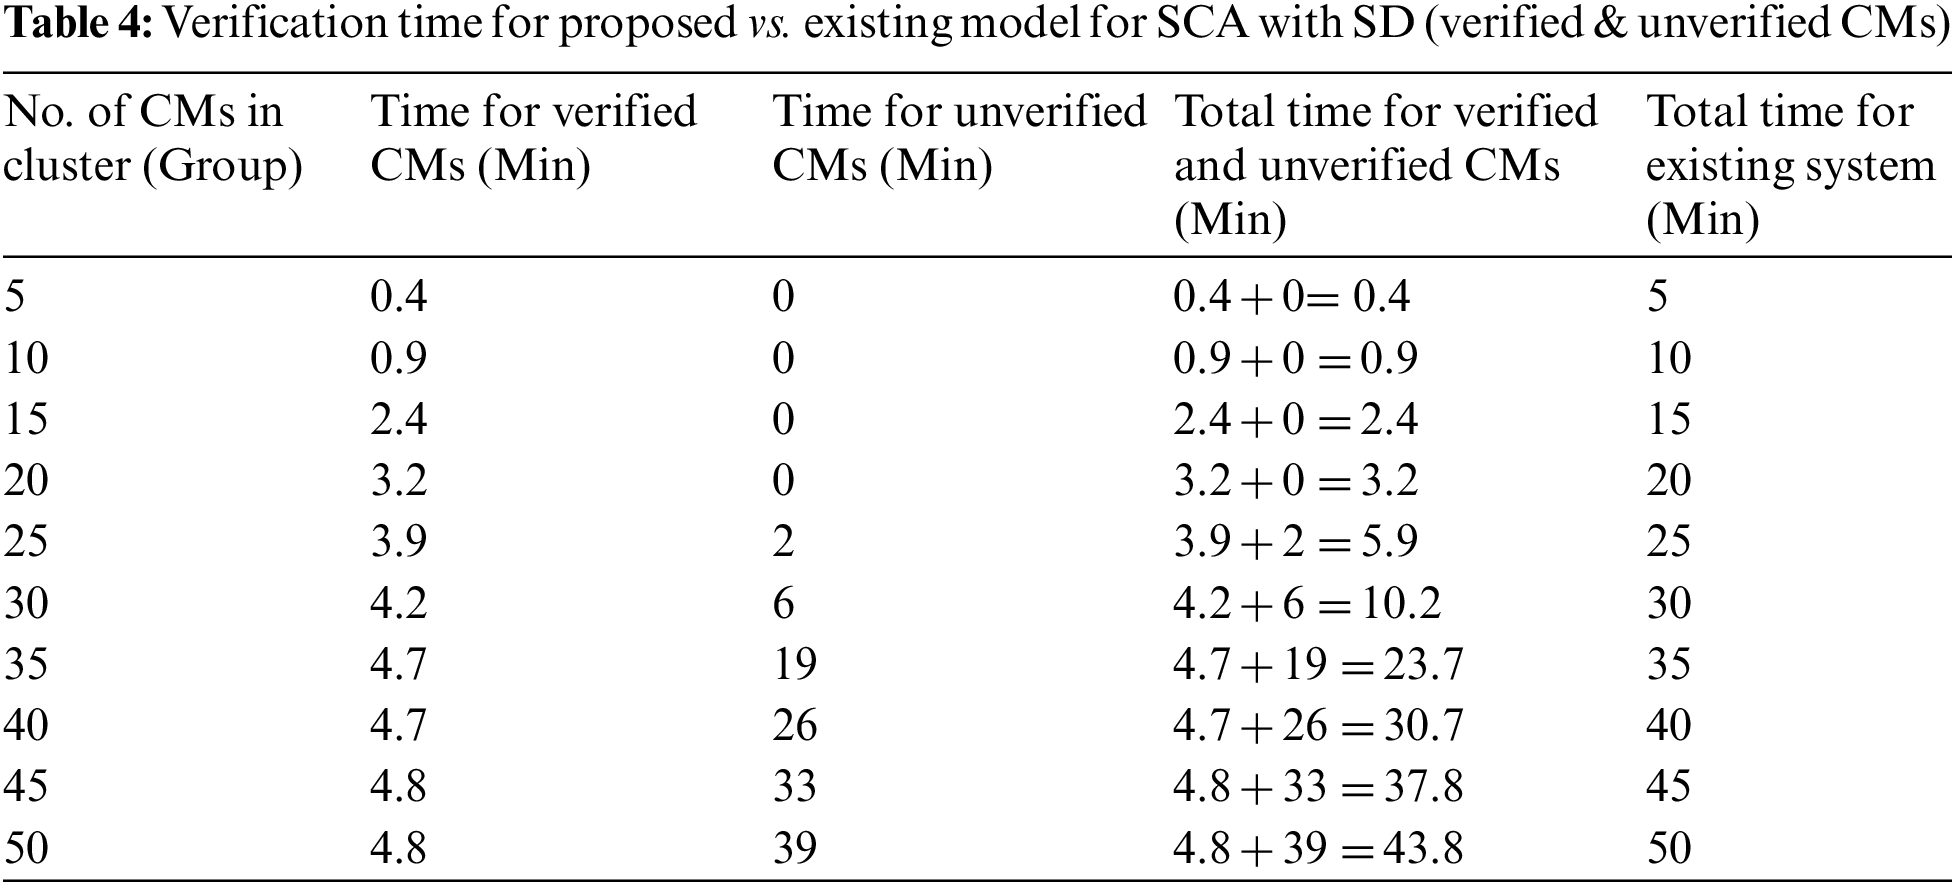
The verification time of the existing model per person is calculated by observations of the verification process at the assembly point. The average verification time taken by the existing model per person is approximately 60 s, as shown in Eq. (4). This is the same amount of time required for unverified CMs. We calculated the summation of verification time by assuming 60 s per person for the existing model and unverified CMs.
As shown in Table 4 and Fig. 10, we calculated the total verification time of the proposed model by summing the verification times for verified and unverified CMs, as given in Eqs. (5) and (6), respectively:
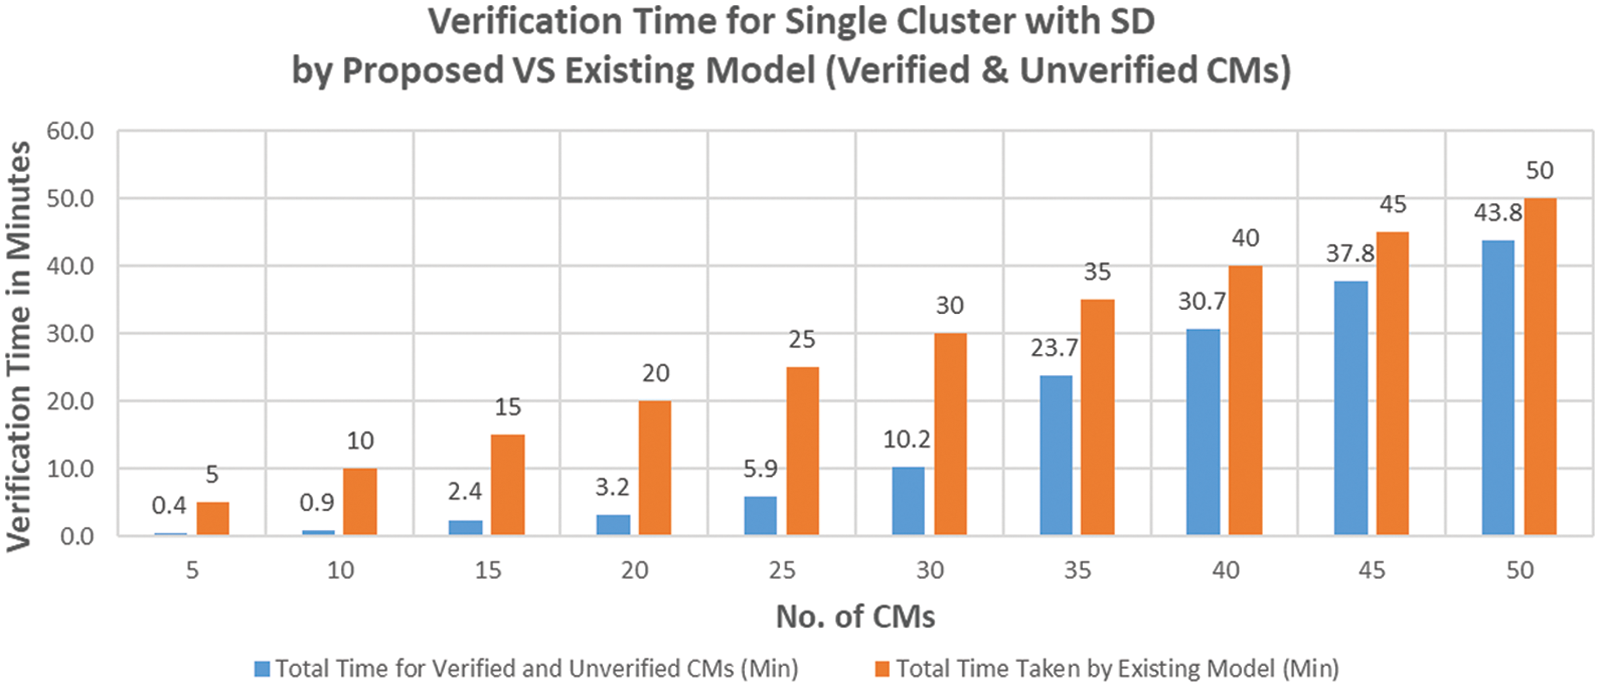
Figure 10: Verification time for proposed vs. existing model for SCA with SD (verified & unverified CMs)
As shown in Table 4 and Fig. 10, the minimum verification time for a single cluster with SD is approximately 0.4 min for the proposed model, and 5 min for the existing model. The maximum verification time was 43.8 min for the proposed model and 50 min for the existing model. The optimal verification time for the proposed model was 3.2 min to process 20 CMs in a single cluster; this would take the existing model 20 min. As the number of CMs in the cluster increased from 20 to 25, two CMs remained unverified. These unverified CMs were verified using the existing model; hence, the total verification time for 25 CMs was 5.9 min. The verification times were 10.2, 23.7, 30.7, 37.8, and 43.8 min for 30, 35, 40, 45, and 50 CMs in a single cluster, respectively. Thus, unverified CMs affect performance and verification time. The reasons for this increase in verification time are discussed in Section 7.4.
In the SpCA approach, we populated different numbers of CMs linearly with SD, but into two sub-clusters under one CH.
6.2.1 Verified vs. Unverified CMs and Success Rate for SpCA Approach with SD
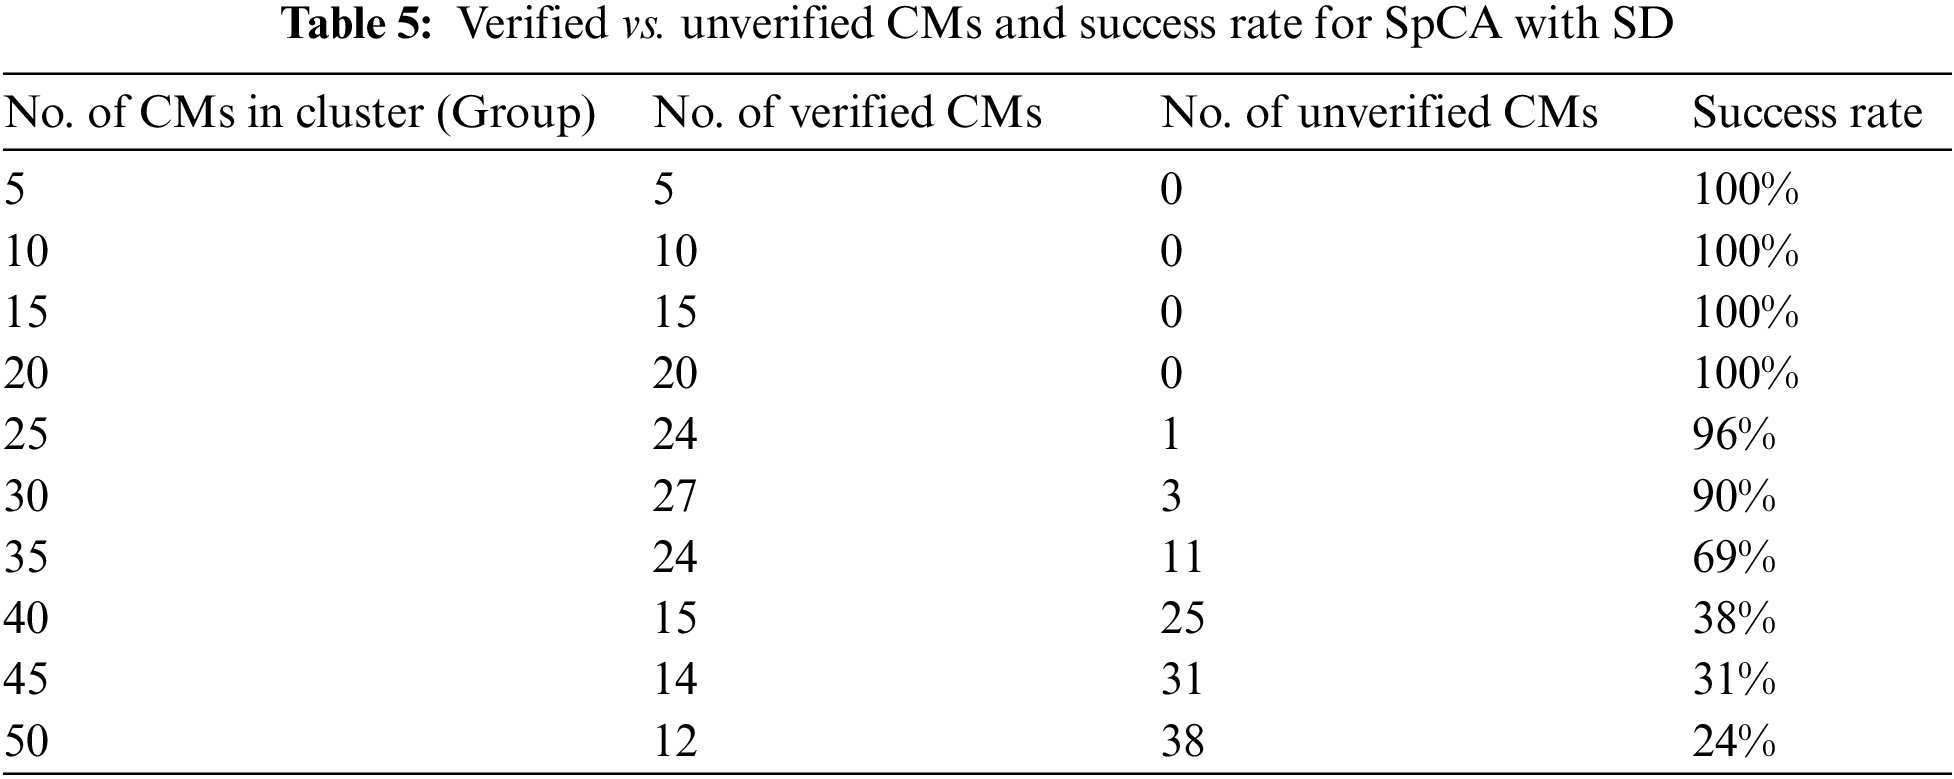
To evaluate the SpCA approach for CVM, we calculated the results for the number of CMs verified by the CH. We linearly populated the CMs with SD to avoid the spreading of diseases such as COVID-19. Simulations for the SpCA approach ran smoothly and provided simulation results, as shown in Table 5 and Fig. 11. The number of unverified CMs is zero when there are 5, 10, 15, and 20 CMs in the cluster. However, with 25 CMs, the number of unverified CMs was 1 (1 out of 25 CMs). The maximum number of verified CMs was 27 when there were 30 CMs in the subcluster. The number of verified CMs decreased gradually to 12 when the size of the subclusters was 50, as shown in Fig. 11. The log files are given in [42]. We discuss the reasons for these results in Section 7.4.
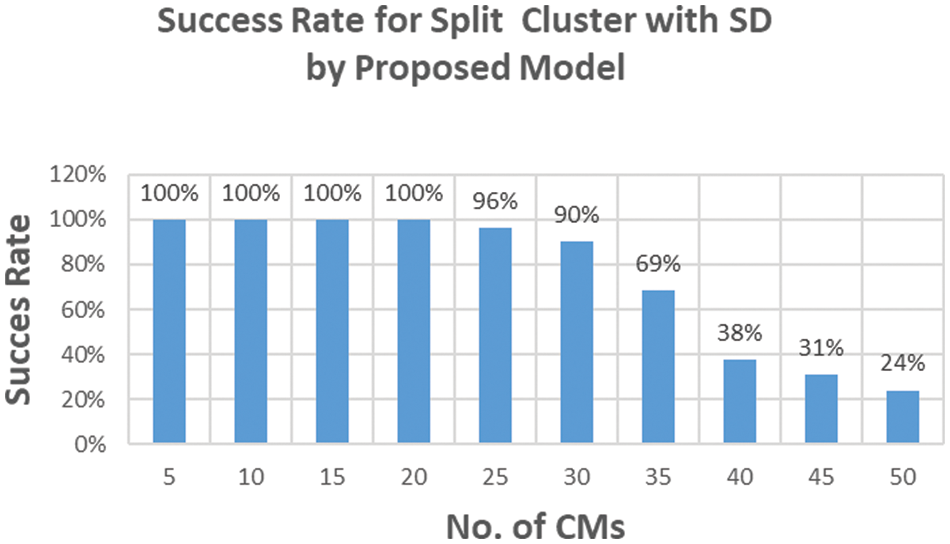
Figure 11: Success rate for SpCA with SD by proposed model
In the column chart in Fig. 11, the success rate is 100% when there are between 5 and 20 CMs in the clusters. As we increased the number of CMs from 20 to 25, the success rate decreased to 96%. This further decreased to 24% as the number of CMs increased to 50. The optimal number of CMs in a split cluster with SD is 20 with a 100% success rate, and the maximum verified CMs are 27 with a success rate of 90%. The minimum success rate is 24%, which is better than the SCA approach of 22% when the CMs in a single cluster is 50.
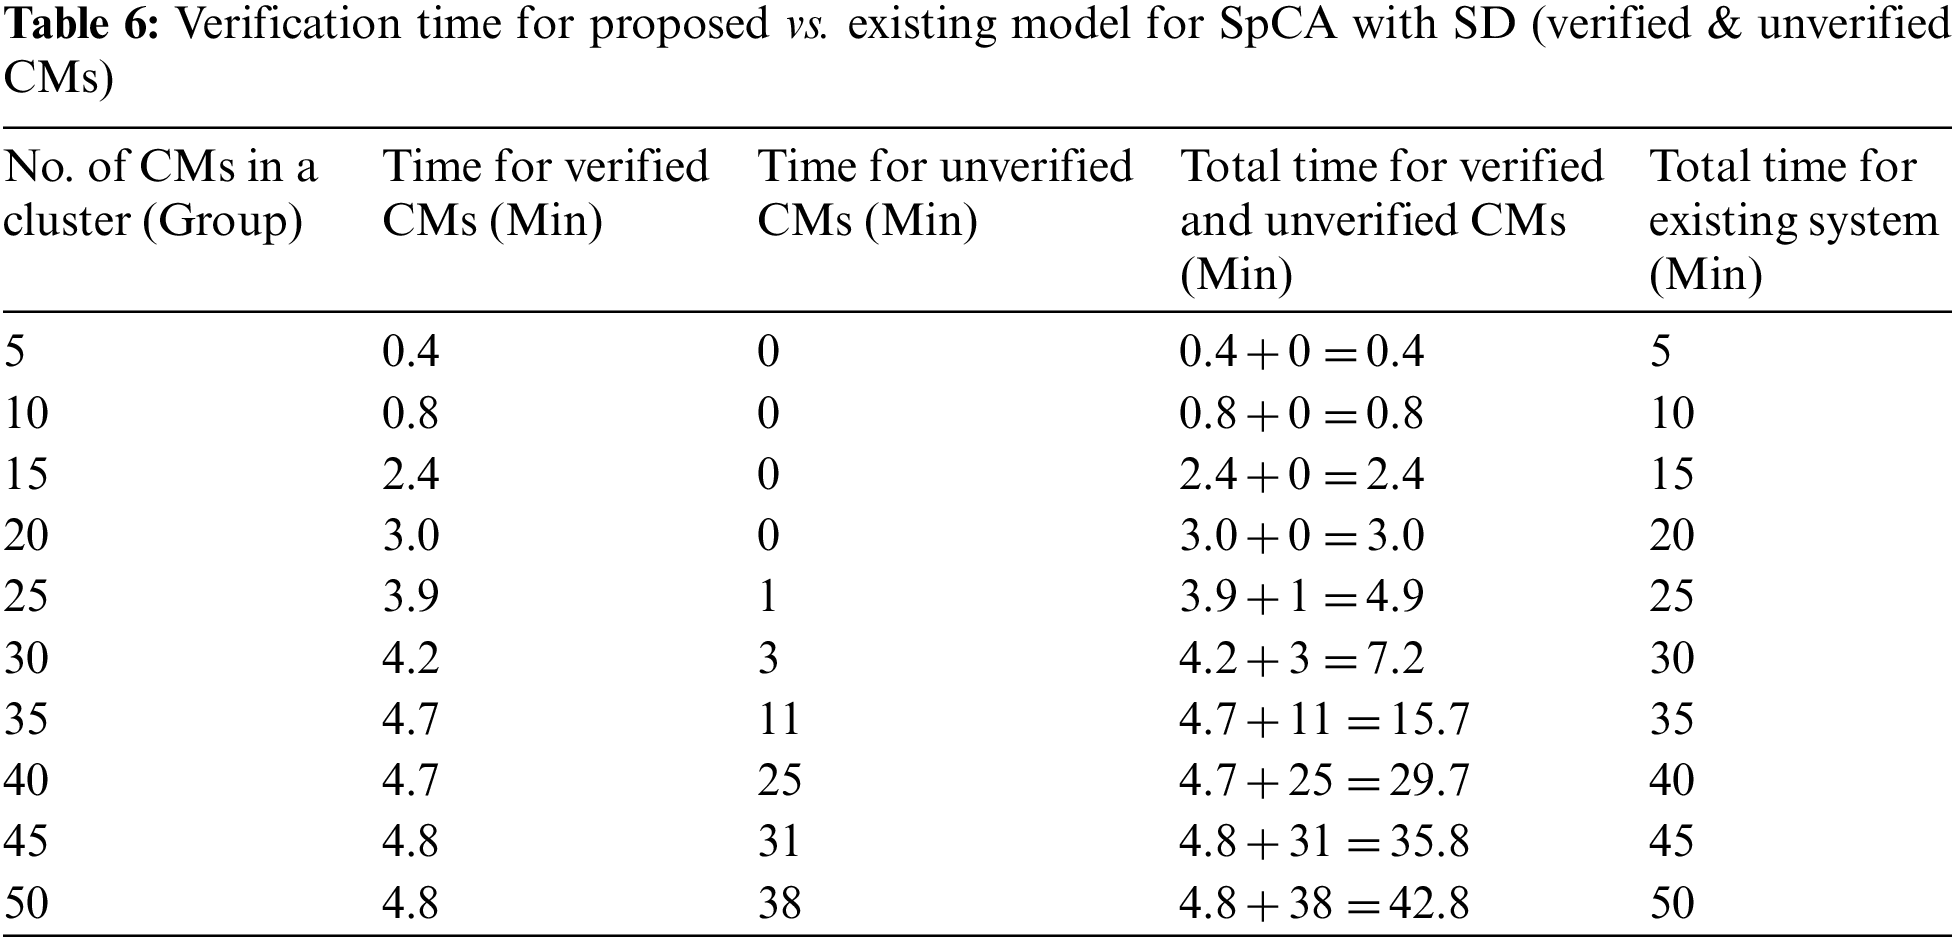
6.2.2 Verification Time for Proposed vs. Existing Model for SpCA with SD (Verified &Unverified CMs)
As shown in Table 6 and Fig. 12, the minimum verification time for a split cluster with SD is approximately 0.4 min for the proposed model, and 5 min for the existing model. The maximum verification time was 42.8 min for the proposed model and 50 min for the existing model. The optimal verification time for the proposed model was 3.0 min to process 20 CMs in a split cluster; this would take the existing model 20 min. As the number of CMs in the cluster increased from 20 to 25, one CM remained unverified. This unverified CM was verified using the existing model; hence, the total verification time for 25 CMs was 4.9 min. The verification times were 7.2, 15.7, 29.7, 35.8, and 42.8 min for 30, 35, 40, 45, and 50 CMs in a split cluster, respectively. Thus, unverified CMs affect performance and verification time. The reasons for this increase in verification time are discussed in Section 7.4.
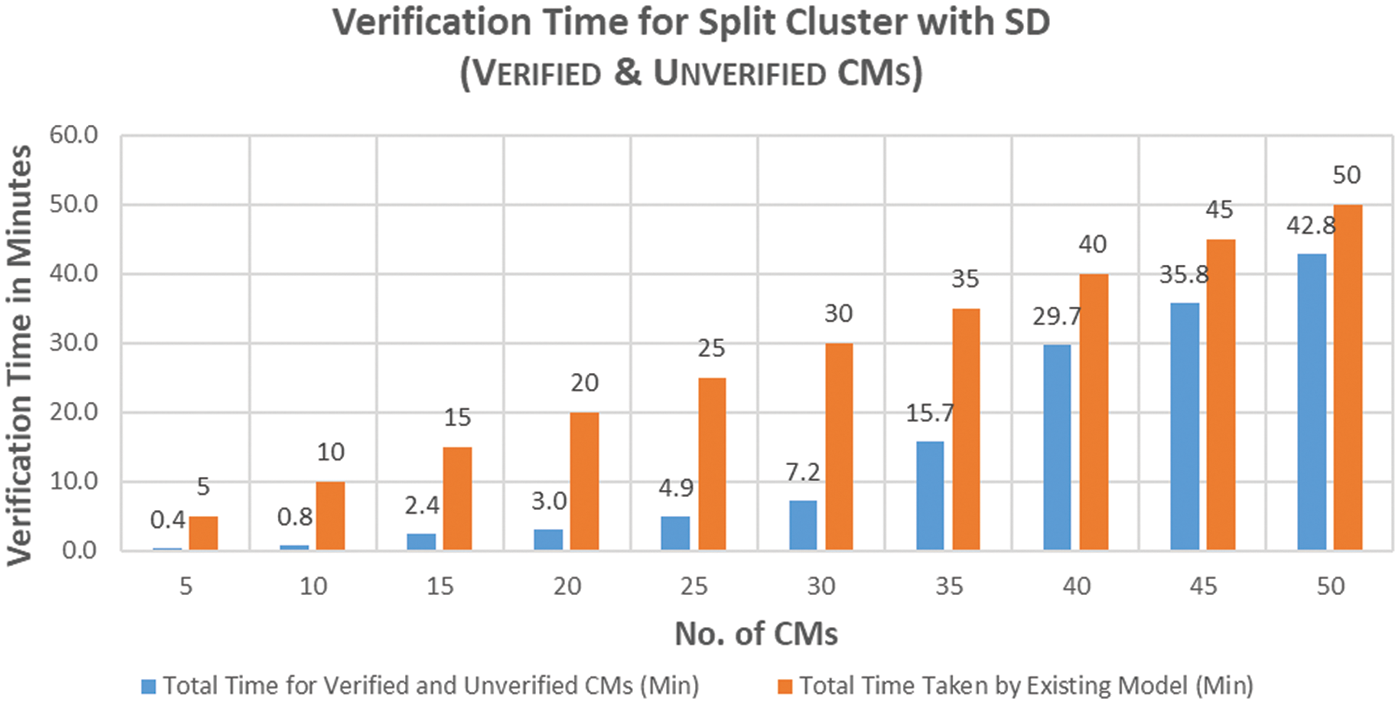
Figure 12: Verification time for proposed vs. existing model for SpCA with SD (verified & unverified CMs)
Comparisons of the two different cluster approaches, SCA and SpCA, are discussed in this section. The number of verified CMs, the success rate, and the verification time difference for each approach with SD are considered and reasons for the results analyzed.
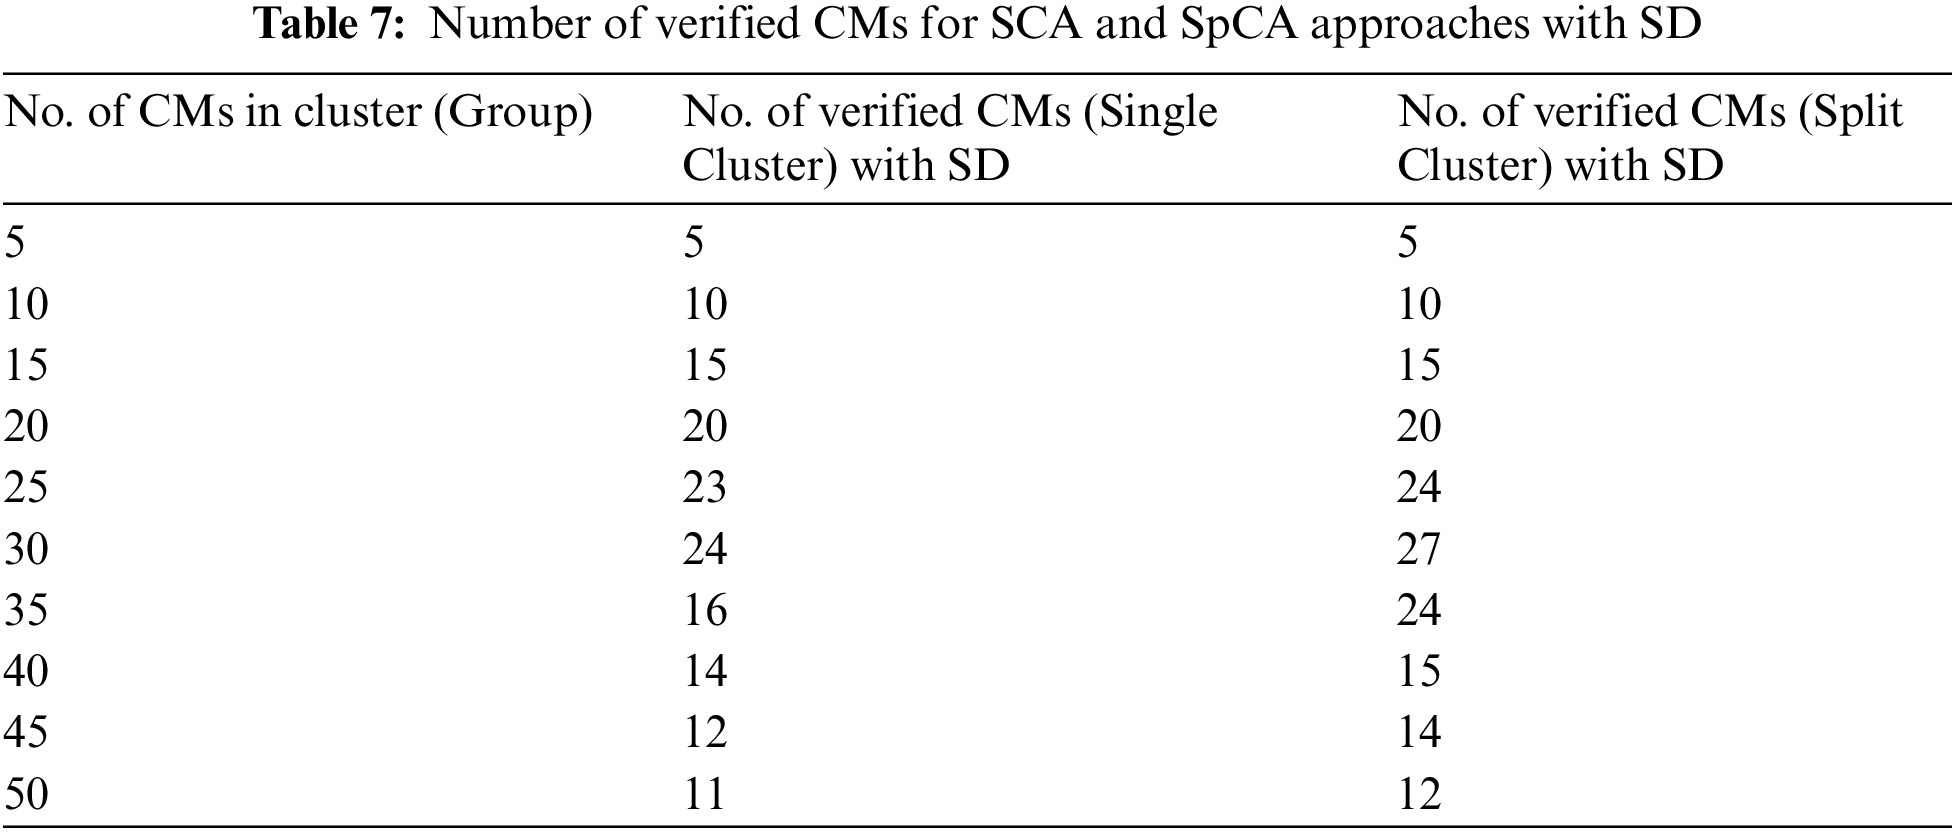
7.1 Number of Verified CMs for SCA and SpCA Approaches with SD
In Table 7, all CMs are verified when the number of CMs is 5, 10, 15, and 20 in both the SCA and SpCA approaches with SD. In the SCA approach, as the number of CMs increased to 25, the number of verified CMs increased to 23. However, in the SpCA approach, the verified CMs increased to 24 with SD. In the SCA approach, the maximum number of verified CMs is 24, but for the SpCA approach, the maximum number of verified CMs is 27 when the cluster size is 30. In the SCA approach, the performance is better when there are 30 CMs in the cluster. However, as the CM increased from 30, the performance worsened. Similarly, the performance of the SpCA approach is better when there are 30 CMs in the cluster. However, as the number of CMs increased from 30, the performance worsened. Overall, the SpCA approach provides the best performance, with a maximum of 27 verified CMs with 30 CMs in the cluster. The reason for this is discussed in Section 7.4.
7.2 Success Rate for SCA and SpCA Approaches with SD
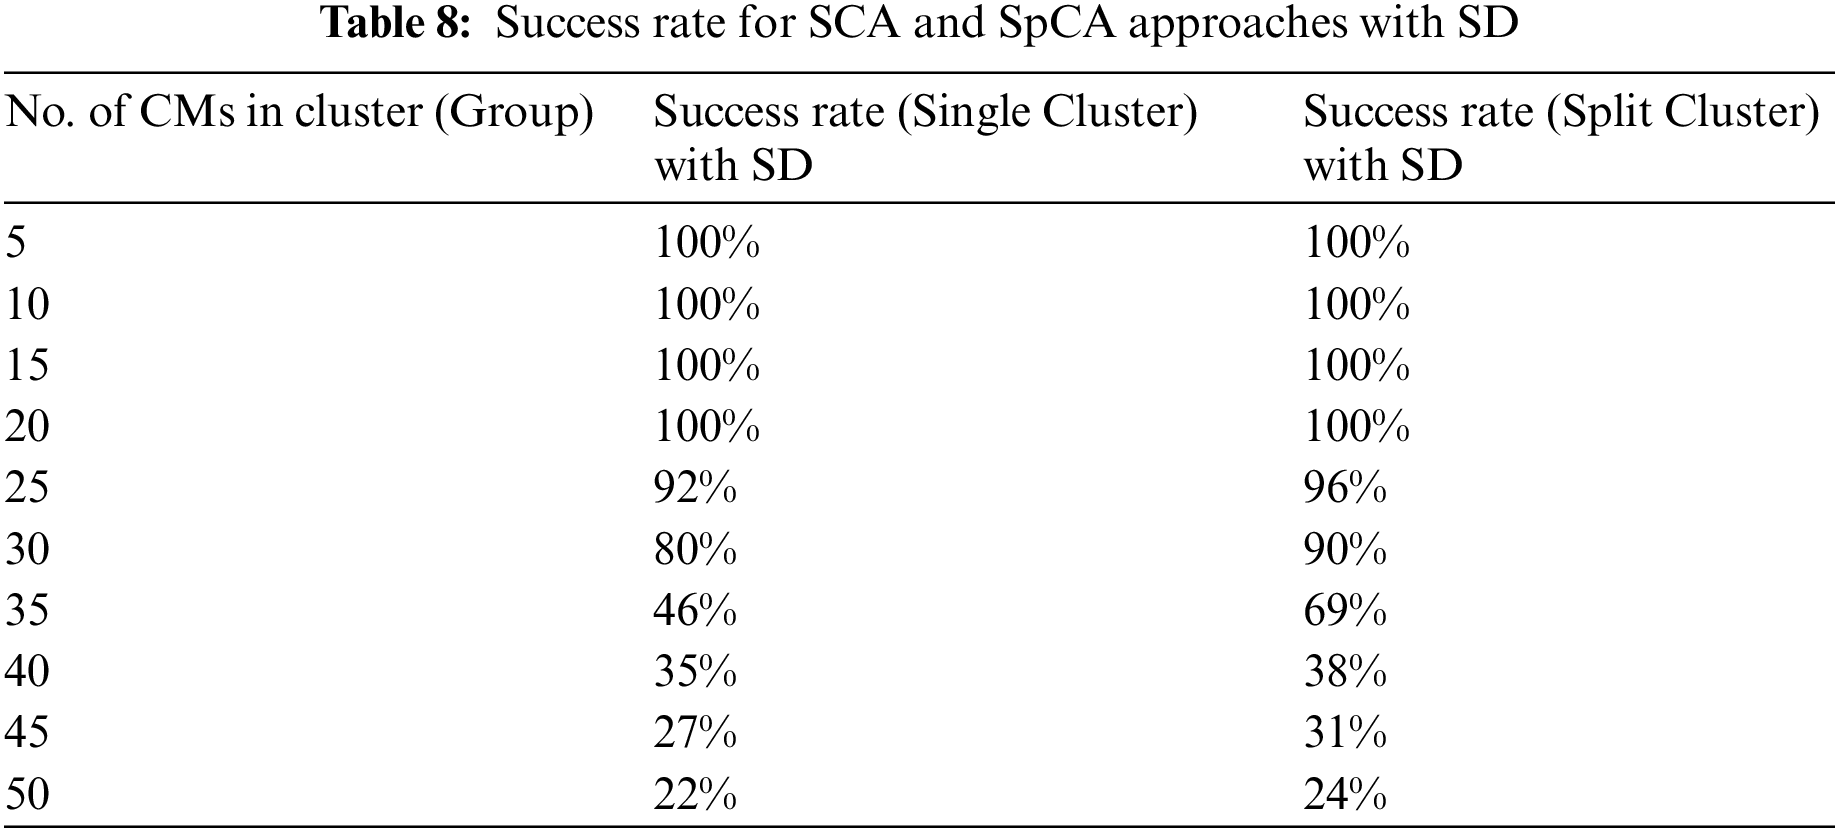
In Table 8, the success rate is 100% when the number of CMs is 5, 10, 15, and 20 in both the SCA and SpCA approaches with SD. In the case of SCA, the success rate decreased to 92% when there were 25 CMs. In the case of SpCA, the success rate decreased to 96% in the same scenario. When there were 30 CMs, the success rates decreased to 80% and 90% for SCA and SpCA, respectively. For both SCA and SpCA, the success rate is best with 30 CMs in the cluster. However, as the CMs increased past 30, their success rates worsened. Overall, the SpCA approach provides better performance than the other approaches when there are 30 CMs in the cluster. We discuss the reason for this in Section 7.4.
7.3 Time Difference for SCA and SpCA Approaches with SD
In this section, we discuss the time differences between the proposed and existing models for the SCA and SpCA approaches. To obtain verification time differences for SCA and SpCA, we subtracted the verification time of the proposed model from the verification time of the existing model, as given in Eqs. (7) and (8), respectively:
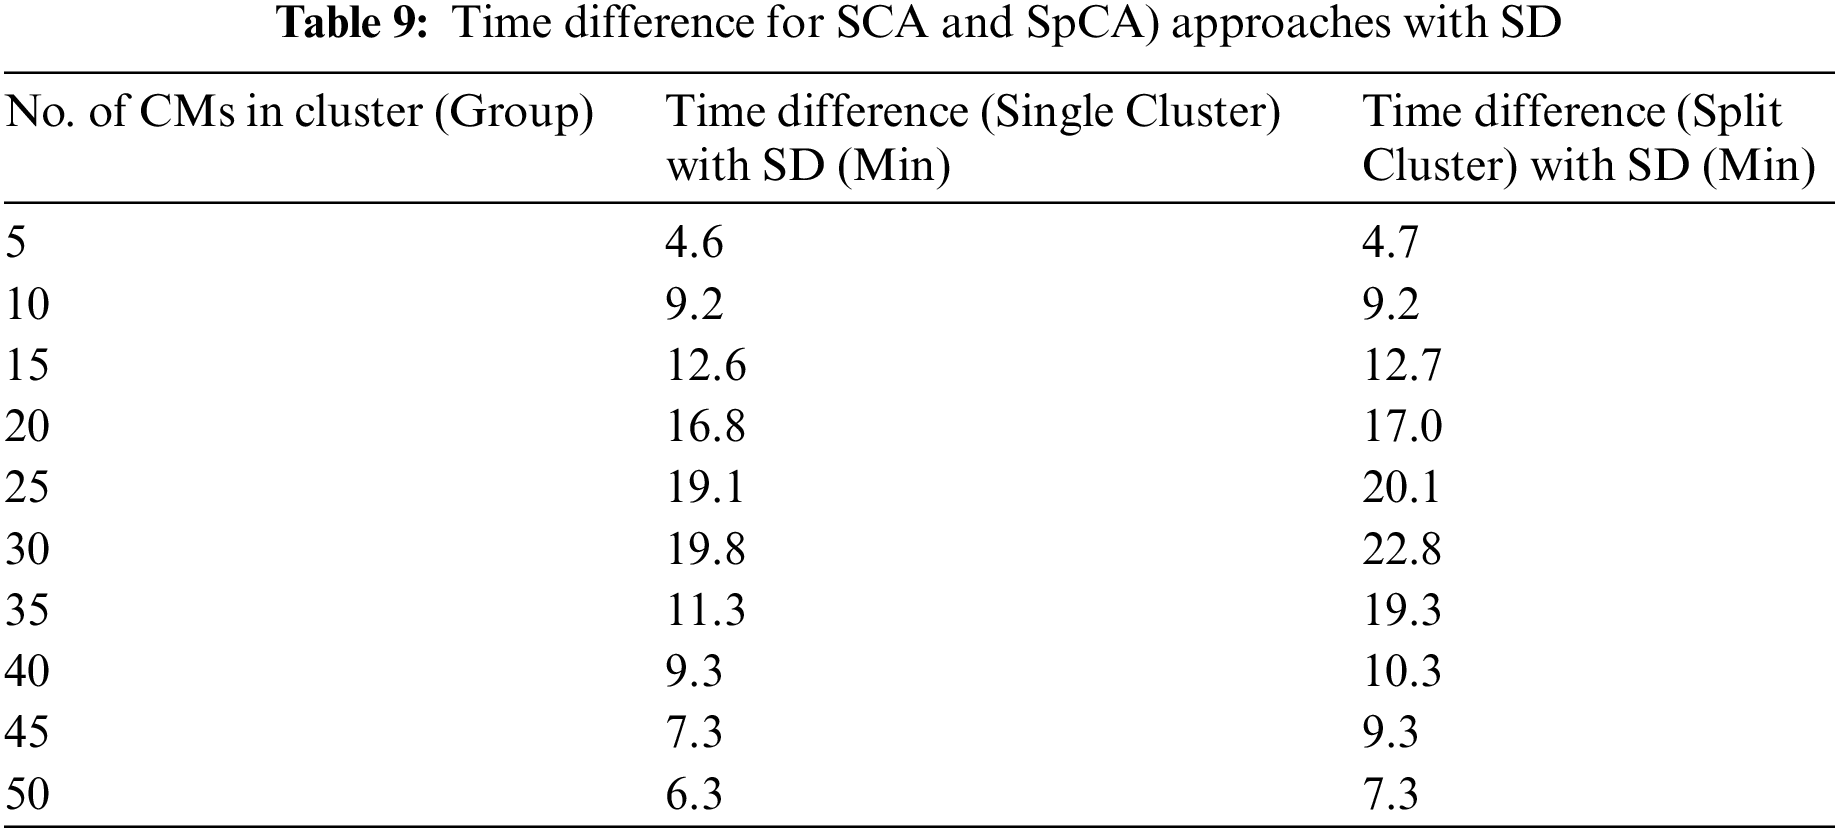
The simulation results are listed in Table 9. When there are 5 CMs in the cluster, the minimum verification time difference is 4.6 min for SCA and 4.7 min for SpCA. When there are 25 CMs, the verification time difference is 19.1 min and 20.1 min for SCA and SpCA, respectively. This rises to 19.8 min for SCA and 22.8 min for SpCA when there are 30 CMs. The optimal verification time difference is 22.8 for the split cluster with SD. Therefore, we can conclude that the SpCA with SD provides the best performance among the SCA and existing models when the number of CMs is 30. The reasons for this are given in Section 7.4.
7.4 Reasons of Performance for SCA and SpCA Approaches with SD
In this section, we discuss the reasons behind the performance characteristics of the SCA and SpCA approaches. We discuss two different scenarios: single cluster with SD and split cluster with SD. We used the multi-hop protocol, which handles factors such as maximum neighbors, neighbor timeout, and maximum entry capacity in a neighbor table according to the limited size of the sensor device. Cooja/Contiki uses the CSMA Contiki protocol at the MAC layer. CSMA retransmits packets when collisions are detected, but it does not detect collisions.
In an SCA approach, the CMs are located more closely and linearly than in an SpCA approach. This causes increased congestion among the CMs as the number of CMs increases. As the congestion increases due to increase in collision probabilities, the dropping of packets increases before reaching the destination. CSMA retransmits the packets after a collision is detected, but this retransmission occurs after a certain amount of time. Therefore, collisions incur a delay in packets reaching their destination and increase the verification time. As the number of CMs increases, so does the number of neighbors, causing the capacity of the neighbor table to exceed its maximum limit. When the number of entries exceeds the maximum limit in a neighbor table, incoming entries are dropped. Similarly, the old entries are removed from the neighbor table when their neighbor expiry is reached. This dropping of new entries and removing old entries from the neighbor table causes an incomplete route to the destination, meaning packets are dropped. The multi-hop protocol forwards the packet from neighbor to neighbor if the CM is out of range. The multi-hop protocol supports a limited number of hops, called the maximum number of neighbors. When the number of hops exceed its limit, the packet is dropped to save energy and collisions. If there is no limit to the maximum number of neighbors, the packet consumes energy to move around and causes a collision.
Among the reasons affecting the performance of both the approaches, the dominant reason is collisions, which is due to an increase in traffic or congestion. When traffic increases, the packet drop rate increases, and consequently, the packet retransmit rate also increases, causing an increase in time delay. This increase in time delay exceeds the limit of the neighbor timeout, and the neighbor entry is removed from the neighbor table. As a result, the packet delivery route remains incomplete, and the packet is dropped. Hence, the second dominant reason is neighbor timeout. The last reason is low memory, which is a limitation of the sensor device. Increased memory means we can store more data (neighbor table entries) but this requires a corresponding increase in processing power. Low processing power is also a limitation of the sensor device.
To avoid congestion and collision, we use SD between the CMs. SD provides an organized distance between the CMs and decreases the number of entries in the neighbor table. Further, we use the SpCA, which divides the cluster into two sub-clusters that reduce the number of CMs in each sub-cluster to minimize congestion and collision.
SpCA with SD provides better results than all alternative approaches when there are 30 CMs, with 27 verified CMs, a success rate of 90%, and a verification time difference of 22.8 min. However, the performance gradually decreased as CMs increased to 50 with 12 verified CMs, a success rate of 24%, and a verification time difference of 7.3 min. When the cluster is divided into two sub-clusters, it reduces the number of CMs in each sub-cluster, and SD reduces the congestion among the CMs. Conversely, the distance between two sub-clusters and between the individual CMs increases. This increase in distance between sub-clusters and among CMs causes an increase in the number of out-of-range CMs. Therefore, we can conclude that SpCA and SD factors are dominant when there are 30 CMs. However, as we increase the number of CMs from 30, neighbor timeout becomes more dominant than SpCA and SD factors. As a result, the performance decreased as the number of CMs increased from 30.
This study provides a time verification model using WSN and its application to cluster verification. We discussed the model from the perspective of the SCA and SpCA approaches with SD. We calculated the number of verified CMs, the success rate, and the verification time for differing amounts of CMs. Furthermore, we determined the optimal number of CMs in different cluster approaches using SD. We validated our model using a simulation environment and compared the results of each approach across multiple scenarios. Our results show that the SpCA with SD is the best approach with a 96% success rate and an optimized verification time as compared to SCA with SD and the existing model.
If a CVM model with different cluster approaches is implemented using WSN with SD, it can provide the following applications:
1. Optimizing the size of the group or cluster (CMs) for fast verification with SD.
2. Dividing the group according to gender for verification and maintenance of SD.
3. Available capacity can be measured to manage the crowd.
4. By utilizing IoT, users can find less crowded places to avoid congestion.
5. CVM model can support to develop the app with SD in a pandemic.
6. Scheduling of the crowd can be done according to the verification time.
This research shows simulation results for different scenarios; based on these scenarios further models can be developed to test in the laboratory and then in the real environment. One of the limitations of the study is that there is no complete, practically implemented time verification model. Communication among CMs causes packets to be dropped due to collision, neighbor timeout, low memory, the distance between CMs, and transmission range. Therefore, for smooth communication among CMs, the factors causing packet dropping need to be addressed. Furthermore, we need to define mechanisms to avoid misuse of the CM device. The app can be linked to the transportation system, allowing pilgrims to be dropped off at nearby and less crowded assembly points, reducing congestion and disease spread. Moreover, the multiple cluster approach can be used by considering multiple sink nodes in one group. The performance of the model was studied based on different simulation parameters.
Author Contributions: Conceptualization, N.A.N., N.S.A., and M.A.K.; methodology, N.A.N.; software, N.A.N.; validation, N.A.N., N.S.A.; formal analysis, N.A.N. and N.S.A.; investigation, N.A.N.; resources, N.A.N.; writing—original draft preparation, N.A.N.; writing—review and editing, N.A.N. and N.S.A, H.M.K.; visualization, N.A.N.; project administration, N.S.A.; funding acquisition, N.S.A. All authors have read and agreed to the published version of the manuscript.
Funding Statement: This research was funded by the Deanship of Scientific Research at Princess Nourah Bint Abdulrahman University, through the Research Funding Program (Grant No#. FRP-1442-20).
Conflicts of Interest: The authors declare that they have no conflicts of interest to report regarding the present study.
References
1. Nawaz, N., Al-Zghoul, M., Raza Malik, H., Al-Zabi, O., Al-Zabi, B. (2021). Wireless sensor networks simulation model to compute verification time in terms of groups for massive crowd. Advances in Science, Technology and Engineering Systems Journal, 6(1), 1229–1240. DOI 10.25046/aj0601140. [Google Scholar] [CrossRef]
2. Perera, C., Zaslavsky, A., Christen, P., Georgakopoulos, D. (2014). Sensing as a service model for smart cities supported by Internet of Things. Transactions on Emerging Telecommunications Technologies, 25(1), 81–93. DOI 10.1002/ett.2704. [Google Scholar] [CrossRef]
3. Cabral Pinto, F., Chainho, P., Pássaro, N., Santiago, F., Corujo, D., et al. (2013). The business of things architecture. Transactions on Emerging Telecommunications Technologies, 24(4), 441–452. DOI 10.1002/ett.2654. [Google Scholar] [CrossRef]
4. Bajaber, F., Awan, I. (2009). Centralized dynamic clustering for wireless sensor network. 2009 International Conference on Advanced Information Networking and Applications Workshops, pp. 193–198. Bradford, UK, DOI 10.1109/WAINA.2009.68. [Google Scholar] [CrossRef]
5. Banerjee, P., Friedrich, R., Bash, C., Goldsack, P., Huberman, B., et al. (2011). Everything as a service: Powering the new information economy. Computer, 44(3), 36–43. DOI 10.1109/MC.2011.67. [Google Scholar] [CrossRef]
6. Rimal, B. P., Jukan, A., Katsaros, D., Goeleven, Y. (2011). Architectural requirements for cloud computing systems: An enterprise cloud approach. Journal of Grid Computing, 9(1), 3–26. DOI 10.1007/s10723-010-9171-y. [Google Scholar] [CrossRef]
7. Nawaz, N. A., Waqas, A., Yusof, Z. M., Shah, A. (2016). WSN based sensing model for smart crowd movement with identification: A conceptual model. 13th International Conference on Web Based Communities and Social Media, pp. 121–128. Madeira, Portugal. [Google Scholar]
8. Naeem, A. N., Waqas, A., Yusof, Z. M., Mahesar, A. W., Asadullah, S. (2017). WSN based sensing model for smart crowd movement with identification: An extended study. Journal of Theoretical and Applied Information Technology, 95(5). [Google Scholar]
9. Nawaz, N. A., Malik, H. R., Alshaor, A. J. (2019). A framework for smart capacity estimation at crowded area using WSN. 2019 International Arab Conference on Information Technology (ACIT), pp. 159–164. Al Ain, United Arab Emirates. DOI 10.1109/ACIT47987.2019.8991037. [Google Scholar] [CrossRef]
10. Nawaz, N. A., Waqas, A., Yusof, Z. M., Shah, A. (2017). A framework for smart estimation of demand-supply for crowdsource management using WSN. Proceedings of the Second International Conference on Internet of Things, Data and Cloud Computing, pp. 1–5. Cambridge, UK. DOI 10.1145/3018896.3025140. [Google Scholar] [CrossRef]
11. Nam, S. M., Cho, T. H. (2016). Context-aware architecture for probabilistic voting-based filtering scheme in sensor networks. IEEE Transactions on Mobile Computing, 16(10), 2751–2763. DOI 10.1109/TMC.2016.2641219. [Google Scholar] [CrossRef]
12. Weppner, J., Bischke, B., Lukowicz, P. (2016). Monitoring crowd condition in public spaces by tracking mobile consumer devices with WiFi interface. Proceedings of the 2016 ACM International Joint Conference on Pervasive and Ubiquitous Computing: Adjunct, pp. 1363–1371. Heidelberg Germany. DOI 10.1145/2968219.2968414. [Google Scholar] [CrossRef]
13. Nawaz, N., Malik, H., Alshaor, A., Abid, K. (2020). A simulation based proactive approach for smart capacity estimation in the context of dynamic positions and events. Advances in Science, Technology and Engineering Systems Journal, 5(6), 423–438. DOI 10.25046/aj050651. [Google Scholar] [CrossRef]
14. Kulshrestha, T., Saxena, D., Niyogi, R., Cao, J. (2019). Real-time crowd monitoring using seamless indoor-outdoor localization. IEEE Transactions on Mobile Computing, 19(3), 664–679. DOI 10.1109/TMC.2019.2897561. [Google Scholar] [CrossRef]
15. Knob, P., de Andrade Araujo, V. F., Favaretto, R. M., Musse, S. R. (2018). Visualization of interactions in crowd simulation and video sequences. 2018 17th Brazilian Symposium on Computer Games and Digital Entertainment (SBGames), pp. 25000–25009. Foz do Iguacu, Brazil, DOI 10.1109/SBGAMES.2018.00037. [Google Scholar] [CrossRef]
16. Saeed, S. N., Abid, A., Waraich, E. U., Atta, S., Naseer, A. et al. (2016). ICrowd—A framework for monitoring of identifiable crowd. 2016 12th International Conference on Innovations in Information Technology (IIT), pp. 1–7. Al Ain, United Arab Emirates. DOI 10.1109/INNOVATIONS.2016.7880036. [Google Scholar] [CrossRef]
17. Kammoun, S., Jarraya, M. H., Alotibi, M. S. (2021). A Deep-CNN crowd counting model for enforcing social distancing during COVID19 pandemic: Application to Saudi Arabia’s public places. Computers, Materials & Continua, 66(2), 1315–1328. DOI 10.32604/cmc.2020.013522. [Google Scholar] [CrossRef]
18. Sharma, S. K., Modanval, R. K., Tayal, P., Gayathri, N. (2022). Social distancing and crowd density distribution system for public places and public transports using computer vision and NLP. Advanced Computing and Intelligent Technologies, pp. 461–479. Springer, Singapore. [Google Scholar]
19. Hidayat, A., Wardhany, V. A., Nugroho, A. S., Hakim, S., Jhoswanda, M. et al. (2020). Designing IoT-based independent pulse oximetry kit as an early detection tool for COVID-19 symptoms. 2020 3rd International Conference on Computer and Informatics Engineering (IC2IE), pp. 443–448. Yogyakarta, Indonesia, DOI 10.1109/IC2IE50715.2020.9274663. [Google Scholar] [CrossRef]
20. Hoeben, E. M., Bernasco, W., Suonperä Liebst, L., van Baak, C., Rosenkrantz Lindegaard, M. (2021). Social distancing compliance: A video observational analysis. PLoS One, 16(3), e0248221. DOI 10.1371/journal.pone.0248221. [Google Scholar] [CrossRef]
21. Shukla, R. I. T. I. K., Mahapatra, A. K., Peter, J. S. P. (2021). Social distancing tracker using YOLOv5. Turkish Journal of Physiotherapy and Rehabilitation, 32(2), 1785–1793. [Google Scholar]
22. Shearston, J. A., Martinez, M. E., Nunez, Y., Hilpert, M. (2021). Social-distancing fatigue: Evidence from real-time crowd-sourced traffic data. Science of the Total Environment, 148336. DOI 10.1016/j.scitotenv.2021.148336. [Google Scholar] [CrossRef]
23. Kanjo, E., Anderez, D. O., Anwar, A., Al Shami, A., Williams, J. (2021). CrowdTracing: Overcrowding clustering and detection system for social distancing. 2021 IEEE International Smart Cities Conference (ISC2), pp. 1–7. Manchester, UK. [Google Scholar]
24. Ansari, A. N., Shakeel, B., Alkhawaji, R. N., Alaboudi, A. A., Ansari, A. N. (2021). An IOT based social distancing monitoring system in public area for reducing the impact of COVID-19. Ilkogretim Online, 20(2), 844–852. [Google Scholar]
25. Ajith, A. E., Joseph, E., Martin, S., Cyril, S., Jose, S. (2021). Social distance monitoring using drone. International Journal, 10(3). DOI 10.30534/ijatcse/2021/971032021. [Google Scholar] [CrossRef]
26. Yang, D., Yurtsever, E., Renganathan, V., Redmill, K. A., Özgüner, Ü. (2021). A vision-based social distancing and critical density detection system for COVID-19. Sensors, 21(13), 4608. DOI 10.3390/s21134608. [Google Scholar] [CrossRef]
27. Rupapara, V., Narra, M., Gunda, N. K., Gandhi, S., Thipparthy, K. R. (2021). Maintaining social distancing in pandemic using smartphones with acoustic waves. IEEE Transactions on Computational Social Systems, DOI 10.1109/TCSS.2021.3092942. [Google Scholar] [CrossRef]
28. Nguyen, C. T., Saputra, Y. M., van Huynh, N., Nguyen, N. T., Khoa, T. V. et al. (2020). A comprehensive survey of enabling and emerging technologies for social distancing—Part I: Fundamentals and enabling technologies. IEEE Access, 8, 153479–153507. DOI 10.1109/ACCESS.2020.3018140. [Google Scholar] [CrossRef]
29. Fedele, R., Merenda, M. (2020). An IoT system for social distancing and emergency management in smart cities using multi-sensor data. Algorithms, 13(10), 254. DOI 10.3390/a13100254. [Google Scholar] [CrossRef]
30. Fernandez Vilas, A., Díaz Redondo, R. P., Ben Khalifa, M. (2019). Analysis of crowds’ movement using twitter. Computational Intelligence, 35(2), 448–472. DOI 10.1111/coin.12205. [Google Scholar] [CrossRef]
31. Okimoto, Y., Kawata, S., Saito, S., Nakano, T., Ogawa, T. (2021). Crowdsourced verification for operating calving surveillance systems at an early stage. 2020 25th International Conference on Pattern Recognition (ICPR), pp. 4356–4362. Milan, Italy. [Google Scholar]
32. Felemban, E., Sheikh, A. A., Naseer, A. (2021). Improving response time for crowd management in Hajj. Computers, 10(4), 46. DOI 10.3390/computers10040046. [Google Scholar] [CrossRef]
33. Liu, Z. J., Chernov, S., Mikhaylova, A. V. (2021). Trust management and benefits of vehicular social networking: An approach to verification and safety. Technological Forecasting and Social Change, 166, 120613. DOI 10.1016/j.techfore.2021.120613. [Google Scholar] [CrossRef]
34. Mahdi, O., Eshghi, F., Zamani, A. (2020). A hybrid encryption algorithm for security enhancement of wireless sensor networks: A supervisory approach to pipelines. Computer Modeling in Engineering & Sciences, 122(1), 323–349. DOI 10.32604/cmes.2020.08079. [Google Scholar] [CrossRef]
35. Yang, H., Shen, Y., Zhuang, W., Gao, C., Dai, D. et al. (2021). A smart wearable ring device for sensing hand tremor of Parkinson’s patients. Computer Modeling in Engineering & Sciences, 126(3), 1217–1238. DOI 10.32604/cmes.2021.014558. [Google Scholar] [CrossRef]
36. Tsiftes, N., Dunkels, A., Römer, K. U. (2011). A database in every sensor. Proceedings of the 9th ACM Conference on Embedded Networked Sensor Systems, pp. 316–332. Association of Computing Machinery, Seattle Washington, USA. DOI 10.1145/2070942.2070974. [Google Scholar] [CrossRef]
37. Axiomatic Technology (2021). https://peoplecounting.co.uk/blog/social-distancing-capacity-calculator-how-much-space-do-you-need/. [Google Scholar]
38. Nobajas, A., i Casas, J. G., i Agusti, D. P., Peacock, A. J. (2020). Lack of sufficient public space can limit the effectiveness of COVID-19’s social distancing measures. DOI 10.1101/2020.06.07.20124982. [Google Scholar] [CrossRef]
39. VenueSearch (2021). https://venuesearch.ie/capacity-calculator/. [Google Scholar]
40. Velinov, A., Mileva, A. (2016). Running and testing applications for Contiki OS using Cooja simulator. in: Information technology and education development, pp. 279–285. Zrenjanin, Serbia, Educ. [Google Scholar]
41. Single and split approaches scenarios (2021). https://drive.google.com/drive/folders/1FRBxgvO4E3lMRfcR7MqbaMDS3dlwxB33?usp=sharing. [Google Scholar]
42. Log files for single and split output (2021). https://drive.google.com/drive/folders/1D1XRK5AJ8gbTn4ZSwx6cxSShgLKhUYQw?usp=sharing. [Google Scholar]
 | This work is licensed under a Creative Commons Attribution 4.0 International License, which permits unrestricted use, distribution, and reproduction in any medium, provided the original work is properly cited. |