| Computer Modeling in Engineering & Sciences |
DOI: 10.32604/cmes.2022.020583
ARTICLE
Fault Detection and Identification Using Deep Learning Algorithms in Induction Motors
1Department of Electronic Engineering, Quaid-e-Awam University of Engineering Science and Technology, Nawabshah, 67480, Pakistan
2NCRA Condition Monitoring Systems Lab, Mehran University of Engineering and Technology, Jamshoro, 76062, Pakistan
3Department of Electronic Engineering, Mehran University of Engineering and Technology, Jamshoro, 76062, Pakistan
4Design and Creative Technology, Torrens University Australia, Melbourne, Australia
5Department of Electronics and Power Engineering, Pakistan Navy Engineering College NUST, Karachi, 75350, Pakistan
*Corresponding Author: Majid Hussain. Email: majidhussain@quest.edu.pk
Received: 01 December 2021; Accepted: 24 February 2022
Abstract: Owing to the 4.0 industrial revolution condition monitoring maintenance is widely accepted as a useful approach to avoiding plant disturbances and shutdown. Recently, Motor Current Signature Analysis (MCSA) is widely reported as a condition monitoring technique in the detection and identification of individual and multiple Induction Motor (IM) faults. However, checking the fault detection and classification with deep learning models and its comparison among themselves or conventional approaches is rarely reported in the literature. Therefore, in this work, we present the detection and identification of induction motor faults with MCSA and three Deep Learning (DL) models namely MLP, LSTM, and 1D-CNN. Initially, we have developed the model of Squirrel Cage induction motor in MATLAB and simulated it for single phasing and stator winding faults (SWF) using Fast Fourier Transform (FFT), Short Time Fourier Transform (STFT), and Continuous Wavelet Transform (CWT) to detect and identify the healthy and unhealthy conditions with phase to ground, single phasing and in multiple fault conditions using Motor Current Signature Analysis. The faults impact on stator current is presented in the time and frequency domain (i.e., power spectrum). The simulation results show that the scalogram has shown good results in time-frequency analysis for fault and showing its impact on the energy of current during individual fault and multiple fault conditions. This is further investigated with three deep learning models (i.e., MLP, LSTM, and 1D-CNN) for checking the fault detection and identification (i.e., classification) improvement in a three-phase induction motor. By simulating the three-phase induction motor in various healthy and unhealthy conditions in MATLAB, we have collected current signature data in the time domain, labeled them accordingly and created the 50 thousand samples dataset for DL models. All the DL models are trained and validated with a suitable number of architecture layers. By simulation, the multiclass confusion matrix, precision, recall, and F1-score are obtained in several conditions. The result shows that the stator current signature of the motor can be used to detect individual and multiple faults. Moreover, deep learning models can efficiently classify the induction motor faults based on time-domain data of the stator current signature. In deep learning (DL) models, the LSTM has shown better accuracy among all other three models. These results show that employing deep learning in fault detection and identification of induction motors can be very useful in predictive maintenance to avoid shutdown and production cycle stoppage in the industry.
Keywords: Condition monitoring; motor fault diagnosis; stator winding faults; deep learning; signal processing
The advent of the fourth industrial revolution has made machine-to-machine interaction possible with sophisticated sensors that allow real-time adaption, analysis, and optimum decision-making easy. In the industrial revolution, induction motors as the workhorse of industry are utilized in most industrial processes and domestic applications. They can be found in numerous applications such as blowers, exhaust fans, pumps, and overhead cranes. Due to a harsh operating environment, they are exposed to different conditions, which create faults in them. Continuous monitoring and interaction of motor operating parameters such as vibration, current, and temperature with sensors enable us to diagnose and identify the related issues within interconnected processes and even plan predictive maintenance [1–3]. Faults in Induction motors (IM) could be electrical or mechanical. Single phasing and Stator winding faults (SWF) are significant electrical faults. Single phasing is the worst-case scenario of supply unbalances causing overheating of the motor. Stator inter-turn winding faults could lead to severe stator winding faults such as phase winding to the ground [4–7]. Faults can be avoided and repaired if detected early.
In industrial, commercial, and domestic applications, the widely used motors are induction motors due to having less cost and ruggedness. However, a motor can fail suddenly due to non-observance and less maintenance in certain operating conditions. It is reported that 35 to 40 percent of induction motors fail due to electrical faults [8]. These faults include electrical supply faults (phase unbalance and single phasing), rotor faults (broken rotor bar) and, stator faults (turn to turn, coil to coil, phase to phase, phase to ground) [8,9]. Due to the unbalanced three-phase supply, the motor's current exceeds the rated value. In consequence, the winding temperature increases and efficiency reduces. As shown in Fig. 1, the worst-case scenario of the unbalance is the missing of any single phase in three-phase supply voltage that may occur due to various reasons such as faulty contact of the circuit breaker, looseness of wires, starter contacts open, blown a fuse. In this case, the current of a lightly loaded motor could increase up to

Figure 1: Single phasing
If single phasing occurs, the motor runs the load until it burns out or, the thermal overload relay turns OFF the motor due to an excessive current.
An unbalance supply voltage is observed when voltages of three-phase supply voltage are not equal and induce sideband frequencies [11,12] into stator current as given in Eq. (1).
where f is the induced frequency in stator current, fs is the line frequency, and k = 1, 2, 3…
Another type of electrical fault is the short circuit in the stator winding, which progresses from inter-turn to inter coil, phase winding, and phase to ground fault, which can develop quickly and result in motor breakdown [13]. Due to stator inter-turn, the fault frequencies developed in the stator current are given as in Eq. (2) [8,9].
where, p is the number of pole pairs, n = 1, 2, 3… and k = 1, 3, 5…, likewise.
1.1 Motor Current Signature Analysis (MCSA) in Fault Detection
Researchers are always keen to find and detect various faults using various measurements and signal processing techniques to avoid catastrophic failures of induction motors. Detection of different unhealthy conditions/faults quickly at the start could increase the motor's life [14]. Motor current signature analysis (MCSA) is the widely used technique for the condition monitoring of IM. In MCSA, different signal processing techniques are used to analyze the measured motor stator current in the time domain, frequency domain and, time-frequency domain. The Fast Fourier Transform (FFT), short-time Fourier transform (STFT), wavelet transform (WT), and Hilbert Transform (HT) are commonly used to detect the different fault frequencies in stator current in a steady-state or transient state [15]. In [16], the induction motor is modeled in a d-q coordinate system; further, the models and characteristics of the incipient broken-rotor-bar fault and turn-to-turn short fault are analyzed. The frequency spectrum becomes different from the healthy spectrum with a motor in fault condition [17]. In FFT, the signals from the time domain are converted to the frequency domain providing information about the signal such as frequency content averaged over the entire signal time interval. However, the STFT provides time localized information of a signal in which frequency components of the signal vary over time. STFT based spectrogram
In Continuous Wavelet Transform (CWT), signal energy is preserved by the scalogram, which is the square of the absolute value of the signals plotted as a function of time and frequency [18].
In [19], MCSA is used for the diagnosis of shorted turns and broken rotor bar in IM by obtaining spectrum using FFT, STFT, and Wavelet transform. In [4], short circuit of three-phase IM is simulated, and analysis of the current based on Wavelet Transform and Power Spectral Density was performed and found that current and PSD level increases with an increase in shorted turns. The authors have simulated the induction motor for multiple fault detection (BRB, Unbalanced voltage) through FFT and STFT based Spectrogram [11]. Hussain et al. [20] simulated the three-phase squirrel cage induction motor with stator winding faults (SWF) only and analyzed the stator current with FFT, STFT based spectrogram, and wavelet-based scalogram. Single phasing fault of the motor using Discrete Wavelet Transform (DWT) is used for fault diagnosis with energy and standard deviation of wavelet coefficients in [21]. Fewer research papers are found reporting multiple fault diagnoses in the literature review [22].
1.2 Deep Learning (DL) Models in Fault Detection and Identification
ANN and SVM are the widely used AI techniques by researchers in the last ten years for the fault diagnosis of IM. A Multilayer perceptron reduces processing time. MLP is trained using a supervised learning technique called Back Propagation (BP) algorithm [13].
The classification accuracy of the ANN and SVM is dependent on the selection of the effective feature input. The DL techniques automatically extract the features from the given input dataset and effectively diagnose the fault at the incipient stage [21]. 2D-CNNS and 3D-CNNs are generally used for image and video processing. In contrast, 1D-CNNs are mainly used for audio and text recognition (as time series data). 1D-CNNs are perfect tools for time-series recognition and prediction. The network has recently been used in state-of-the-art applications such as early diagnosis, structural health monitoring, anomaly detection, and identification [23]. Ince et al. [24] have used a one-dimensional Convolutional Neural Network (1D-CNN) to classify the bearing faults. The experimental results show the effectiveness of the 1DCNN model compared to the MLP, Support vector machine (SVM), and radial basis function (RBF). Recurrent neural network (RNN) performs better with sequential or time-series data, making them most suitable in condition monitoring of motors. RNN [25] is the deepest among all neural networks. They differ from MLP, which maps input data to target vectors, while RNNs map the entire history of past inputs to target vectors owing to their memory capacity. For supervised tasks, RNNs can be trained by employing back-propagation over time. RNNs perform better on time-series data but have gradient vanishing problems. This problem is dealt with long short-term memory (LSTM) [26,27]. LSTMs can memorize and forget data. Multilayer perceptron (MLP), long short-term memory (LSTM), and 1D-convolutional neural network (1D-CNN) deep learning models are successfully used in [20] for detection and identification of the fault in a three-phase.
In this work, single phasing and SWF, both are investigated through MCSA in the time domain and frequency domain as an individual fault as well as combined (multiple) faults, observing the energy rise in measured three-phase stator current signal in faulty phase and impact of a fault condition on the energy of other phases. CWT-based scalogram has been primarily used in vibration analysis, but here scalogram is used to detect the stator faults based on the motor stator current signature (frequency domain) in individual fault conditions and simultaneous faults for frequency analysis. It is identified in the literature, that there is much room to investigate the deep learning models in the fault's detection and identification of the three-phase induction motor. Considering the simulated three-phase motor current signature in time-series type without any preprocessing, we have trained and tested 1D-CNNs, LSTM, and MLP models to detect and identify the induction motor faults. The dataset is generated for the training and testing of these models.
The remainder of this paper proceeds as follows. Section 2 discusses the System Design of fault detection and presents the MATLAB Simulink model. Section 3 discusses the Healthy condition of IM using MCSA that is followed by the fault identification in Section 4. The results and discussions are presented in Section 5, followed by a conclusion and future work in Section 6.
In this work, we have investigated two approaches for three-phase induction motor fault detection and identification system a) signal processing techniques by employing the motor current signature analysis method and b) deep learning techniques.
In signal processing, frequency domain techniques such as FFT, STFT, and CWT-based scalogram are used to detect the single as well as multiple faults with the variation of frequencies in IM current spectrum. The acquired time-domain stator current for simulated motor in healthy and unhealthy conditions are analyzed in MCSA first.
In the second stage, the multiclass dataset is generated. The time-domain stator current of a simulated motor in healthy and faulty conditions is stored as multiclass data set in CSV format for further investigation by training and testing three deep learning models that include MLP, 1D-CNN, and LSTM. The simulation results show that these DL models can extract fault features without preprocessing the simulated stator current signature.
The proposed system design model is shown in Fig. 2. In this model, we have used a 4 KW three-phase squirrel cage induction motor. The proposed model was simulated in MATLAB/Simulink, and it is shown in Fig. 3. Initially, this model was simulated in healthy condition and then phase to ground, phase to phase and, single phasing stator faults were generated. Time-domain and frequency domain analysis is performed for every healthy and faulty condition.

Figure 2: Block diagram of the system

Figure 3: The MATLAB/Simulink model
2.1 Fault Generation/Simulation
A motor model developed in MATLAB/Simulink shown in Fig. 3 is simulated for 1 and 2 s for healthy and unhealthy (i.e., fault) conditions. The MATLAB foundry has several built-in motor models based on speed, pole pairs, line frequency, operating voltage, and power. 2 pole pair motors (1430 rpm) up to 5 KW power range are primarily used in industrial utilities such as transfer of oil, water, oil or other chemicals from one tank to other, blower fans, lubrication pumps, oil purifiers, and etc. Motor model parameters and other components are given in Table 1 are the built-in parameters for selected 4 KW, 2 poles 1430 rpm induction motor in the MATLAB foundry. A Three-phase circuit breaker is used with external switching mode selection with a logical signal to control the breaker operation and time, thus causing single phasing (fault) in any one phase (phases A, B, or C) of three-phases supply of motor. Block of three-phase fault implements a fault between any phase and ground as well as a phase to phase with an external signal to control the switching time of the fault.

3 Healthy Condition of IM through MCSA
The three-phase current of the simulated motor was measured in the time domain and converted to the frequency domain for (t, f) analysis to identify healthy and unhealthy conditions while phase to ground fault, single phasing, and in combined both fault conditions. Differences between the healthy and unhealthy FFT spectrum, spectrograms, and scalogram represent an event of a fault, and the time of the fault is extracted from the data based on the energy density of the fundamental and fault frequencies due to the short circuit, single phasing and in both combined conditions. A healthy representation of the three-phase steady-state motor current in the time domain is given in Figs. 4a and 4b. While in the frequency domain, the FFT based power spectrum is showing two spectral components [13] 50 and 250 Hz with (minimum and maximum spectral leakage) in Figs. 5a–5d with signal power level in dB, STFT based spectrogram is showing only 50 Hz component in Fig. 6 and Continuous Wavelet-based scalogram also showing only 50 Hz component in Fig. 7, respectively.

Figure 4: Three-phase stator current in the time domain


Figure 5: Motor current power spectrum in healthy condition

Figure 6: STFT spectrogram up to 500 Hz

Figure 7: CWT scalogram up to 256 Hz
Table 2 represents the dB power present in the fundamental components 50 Hz and 5th harmonic 250 Hz of three phases current based on the FFT-based spectrum in a healthy motor. It can be understood from the table that the maximum power of 14.4 dB is present in the 50 Hz component in healthy condition, and the 250 Hz component has less power in it, which equals nearly −35 dB.

Simulated stator current for 2 s in the healthy condition of motor is shown in the spectrogram in Fig. 6 ranging 0–500 Hz with a time resolution of 2 s with 45 Hz frequency resolution. The same healthy condition is also shown in scalogram Fig. 7, ranging from 0–256 Hz with scaling of 12 voices per octave for 0–15 dB power range. Stator currents of motor given in Figs. 6 and 7 respectively show 50 Hz line frequency component only, which is indicative of healthy motor.
3.1 Total Harmonic Distortion (THD) of Healthy Motor
Total harmonic distortion is the measure of closeness of a waveform compared to fundamental. Motor current FFT with magnitude percentage of fundamental 50 Hz and measured THD of the healthy three-phase current in the steady-state condition for two cycles in each phase are presented in Figs. 8a–8c. The corresponding THD of each phase is summarized in Table 3. It can be noted that in healthy conditions, the motor current waveform is represented by only 50 Hz component that depicts the smooth or undistorted condition, and the THD value is recorded less than 0.80 in all three-phase currents. We have presented the THD of unhealthy motor conditions in the results section.


Figure 8: FFT and THD of red, yellow, and blue phase

4 Fault Classification Using Deep Learning Techniques
The signal processing-based methods reported in Section 3 are used to detect the healthy and unhealthy conditions of the 3-phase induction motor. After detecting the unhealthy condition of the motor through MCSA, it is essential to identify the particular phase and fault type, which can assist in rectifying the fault.
In literature, DL models are reported to have an input of raw data of current signature and based on frequency features extracted from raw data as an input, fault classification can be done by the DL model [28]. Therefore, DL models are employed, which can effectively classify the motor health conditions (Healthy, Single phasing, SWF, and combined Single phasing with SWF) with the classification about which phase has been exposed to the fault. For checking the classification performance of DL models, a dataset is generated by collecting current signature data in the time domain from the simulated motor model operating under various healthy and unhealthy conditions in MATLAB/Simulink workspace and then stored in CSV format. After proper labeling, it is used as input for training and validation of the DL models. The details of the dataset are provided in Table 4. The obtained dataset comprises 50 thousand samples of stator current in each simulated healthy and unhealthy condition.

DL models employed for the classification task include MLP, LSTM, and 1D-CNN. Due to their advantages, these models are widely used for time-series or sequential data analysis, such as higher learning capabilities even with raw input data [29]. These models predict outcomes as multiclass labels with high accuracy owing to different layers employed in their structure. The selection of model structure (number of layers and number of units) depends on the type and complexity of the dataset on which model is to be trained. Sometimes model could be deep if the input data is complex and nonlinear [28]. The model structures used in this research are provided in Tables 5–7.


DL models are to be trained first under certain conditions. The 50000 values of simulated three-phase stator current as raw data in each fault condition listed in Table 4 were used as input for training models. Fig. 9 shows the three-phase stator current as raw data collected during healthy and unhealthy conditions. The selection of different values of hyperparameters during the training process effects on the convergence of the model.


Figure 9: Three-phase stator current data in time domain collected through simulations
During the training process, the hyperparameters of the DL models were varied, and their values which resulted in optimal performance, are given as under:
• Batch size = 128
• Number of epochs = 5000
• Learning rate = 1 × 10⁻⁴
• Dataset split ratio = 70:20:10 including training, validation, and testing set, respectively.
In this section, we subsequently present the results obtained from the MCSA, and DL models approaches. In the MCSA approach, we have recorded the observations obtained by applying MCSA using frequency domains techniques such as FFT, STFT, and CWT based scalogram on the current spectrum of motor for healthy and unhealthy condition detection. In the DL models, we present the performance results that are recorded by training and testing of the MLP, 1DCNN, and LSTM models with confusions matrix, precision, recall, and F1-score.
In Fig. 10, we present three-phase stator current induction motor waveforms with an induced fault in only one out of three, i.e., blue. We have simulated the 1 s time-domain representation of three-phase induction motor stator current. The fault is induced for 200 ms ranging from 600 to 800 ms. In Fig. 11b, the blue phase exposed to single phasing is showing 0 A, while red and yellow phases are shown with current measuring 12.6 A, which has increased due to fault as Eq. (1). However, in healthy conditions, all three-phase currents were 7.4 A, as shown in Fig. 4. However, Fig. 11a shows that the current waveforms of the phases which are not exposed to single phasing are 180 degrees out of phase with each other.

Figure 10: Three-phase stator current in time domain showing single phasing


Figure 11: Out of phase stator current in the time domain
The single phasing induced in only one phase is further analyzed in the frequency domain with the FFT power spectrum. Figs. 12a and 12b show the FFT of stator current with minimum and maximum spectral leakage. The frequency analysis of three-phase current with FFT-based power spectrum ranging up 20 dB power and 500 Hz frequency range in Figs. 12a and 12b represents the newly induced frequency component of 150 Hz as Eq. (2) [8,13] in stator current which is indicative of single phasing. However, 150 Hz frequency component is not present in the healthy spectrum given in Fig. 5a and Table 2. In comparison to the healthy levels summarized in Table 2, the dB power of the measured 150 Hz component in fault condition has risen in the remaining two phases, i.e., blue and yellow phase. The power of the 150 Hz component has risen from −52 to −9.5 dB in the blue and yellow phase, while the power of the red phase in which single phasing has occurred has increased from −52 to −38 dB.

Figure 12: FFT based spectrum up to 500 Hz
For further investigation on the impact of the single phasing, the STFT spectrogram is obtained with a 200 ms window size that is shown in Figs. 13a and 13b, respectively. It can be observed that the 50 Hz component of the blue phase stator current is missing during the fault time 0.6 to 0.8 s, and the 50 Hz signal energy is reduced to −74 dB. The impact of single phasing on the red and yellow stator motor current phases is shown in Figs. 13c and 13d. It can be observed that during the fault time between 0.6 to 0.8 s, 50 Hz component signal energy is increased to 15.9 dB, which is higher than the 50 Hz component energy in the healthy condition, i.e., 14.4 dB shown in Fig. 5a and Table 2. In Figs. 13a–13d, it can easily be observed that a single phasing has occurred in the blue phase.


Figure 13: Spectrograms showing 50 Hz during fault and its impact
Due to the fixed window size in STFT, we have further investigated the single-phasing fault detection and identification by using the wavelet transform that is more flexible than the STFT. In this work, we have chosen the Wavelet-based scalogram simulation with 12 voices per octave for 0–256 Hz frequency and 0–15 dB power range and the results are given in Figs. 14a and 14b. It can easily be observed that the 50 Hz component is missing during the fault period due to the single phasing fault induced. The impact of single phasing on the red and yellow stator current phases is given in Figs. 14c–14e, showing 1st and 3rd spectral components, i.e., 50 and 150 Hz [13]. Here, we can observe the 50 Hz component that is missing in the blue phase; therefore, it confirms that wavelet scalogram has detected the missing frequency component due to single phasing. However, the scalogram has also distinguished the phase in which single phasing has occurred as well as show the impact as frequency components in the other two phases. Apart from this, in the scalogram, we can observe the time of the fault.

Figure 14: Scalogram showing single phasing and dB power of 50 and 150 Hz component during fault and impact
Here, we present the stator winding fault detection and identification of the three-phase induction motor using FFT, STFT, and Wavelet Transform.
The time-domain representation of the simulated healthy and unhealthy three-phase induction motor with stator winding fault induced between only one phase to ground without load is shown in Fig. 15. The time-domain waveform shows an initial rise in the amplitude of current and then settles down in steady-state condition, which is normal but increases between 300 to 500 ms regions, which is not the normal behavior. For investigation of the fault, the frequency-domain representation of the stator winding fault using FFT-based power spectrum for the frequency range of 0–300 Hz and power spectrum maximum level up to 20 dB is given in Fig. 16. The approximately obtained results of the power spectrum in dB with the FFT-based spectrum of the fundamental and other frequency components are summarized in Table 8. When the results of the power spectrum in healthy condition Table 2 are compared with the results in Table 8 suggests that signal energy increases at line frequency in red and yellow phases.

Figure 15: Three-phase stator current showing SWF

Figure 16: Three-phase power spectrum of stator current during SWF

Further to this, we have also investigated the stator winding fault in the STFT spectrogram. The simulation was done with (15 ms window size, 63 Hz frequency resolution, max spectral leakage, 0 percent overlap, and 0–20 dB range) for the simulated motor current during 1 s in Figs. 17a–17c showing the blue, yellow, and red phase, respectively. It is evident that the energy at the line frequency (of the 50 Hz component) initially increased due to transient motor current at the start of the simulation, which settles down in the steady-state. This current increases while other frequency components are also induced during fault duration between 300 to 500 ms, which can be observed with the color contour in yellow showing greater intensity in all three stator currents.

Figure 17: Spectrograms during SWF for 15 ms window, 63 Hz frequency resolution
However, the 1 s simulation performed for the same SWF and investigated in STFT with greater window size, higher frequency resolution, and minimum spectral leakage (300 ms window size, 45 Hz frequency resolution with 0 percent overlap and, −10 to 15 dB power range) shown in Figs. 18a–18c for blue, red, and yellow phase stator current respectively. Fig. 18 reveals the same behavior as Fig. 17, but frequency components induced due to SWF are more distinguishable between 300 to 600 ms.

Figure 18: Spectrograms during SWF for 300 ms window with 45 Hz frequency resolution
From the same fault results presented in Figs. 17 and 18, the importance of the selection of the STFT window size can be observed in identifying the frequencies during the fault period. In both cases, the fault has been detected easily, but it is indistinguishable which phase has been exposed to a fault. Therefore, further investigation is done during the same fault in the frequency domain with wavelet transform.
The simulated stator winding fault in CWT-based scalogram is shown in Figs. 19a–19c. The rise in the current can be seen at the line frequency (50 Hz component) during the fault time and shows the rise of two other frequency components, 150, and 250 Hz. The CWT-based scalogram in Fig. 19 has shown frequency components due to fault without any adjustment of window size. Scalogram has also shown the time of fault observable in the yellow color of line frequency (50 Hz) between 400 to 600 ms in all three-phase currents. This indicates that that CWT-based scalogram can be used for better visualization of time of the fault, but also CWT-based scalogram is useful in frequency analysis as STFT. However, it cannot be understood which phase of the stator current has been exposed to fault by looking at the scalogram in Fig. 19.

Figure 19: Scalogram showing SWF fault (12 voices per octave, up to 0–256 Hz frequency range and 0–15 dB power range)
5.3 SWF Detection Based on Total Harmonic Distortion
THD of the current spectrum can also be used to identify that which phase of the induction motor has been exposed to SWF. THD of stator current waveform remains less than 1% in a healthy motor as given in Table 3 and Fig. 8. THD of the current waveform increases drastically when a motor is exposed to SWF [22]. The waveform of the phase which is exposed to a fault distorts more in comparison to the remaining phase, which is not exposed to a fault.
Six types of faults summarized in Table 9 and corresponding FFT of two cycles for every SWF fault type in Fig. 20 give information that the current waveform gets severely distorted in a fault condition. THD of the faulty phase increases compared to THD level in a healthy condition, which remains less than 1 given in Table 3. SWF summarized in Table 9 shows a higher level of THD ranging from 51.54% to 77.10%, which is indicative of SWF in a particular phase. Hence by knowing THD and its comparisons to the other two phases out of three, the faulty phase of stator current can be distinguished.


Figure 20: THD of the 6 different types of SWF faults in blue, red, and yellow phase
5.4 Multiple Faults (Single Phasing and SWF Combined)
Multiple successive faults initially Single phasing at 0.5 to 0.66 s and SWF at 1.2 to 1.4 s in blue phase out of three stator current in time domain given in Fig. 21a represents the impact of single phasing on three-phase stator current and indicating an increase in stator currents during fault times. Fig. 21b represents the individual stator current of the blue phase, which has been exposed to multiple faults successively within 2 s of motor operation. The individual current waveform in the time domain shows missing current at a single phasing fault and then increased current due to SWF (blue phase to ground). FFT based power spectrum in the frequency domain of three-phase stator current in multiple fault condition given in Fig. 22 and summarized in Table 10 shows an increase in the power of 50, 150, and 250 Hz, which are greater in comparison to the healthy spectrum given in Fig. 5a and Table 2.

Figure 21: Time-domain representation of multiple faults

Figure 22: FFT spectrum multiple faults (0–20 dB and 300 Hz) minimum spectral leakage

STFT spectrogram in Fig. 23 and CWT scalogram in Fig. 24 both are showing disruption in 50 Hz component initially due to single phasing, the rise of 50 Hz signal power showing more yellow color at the time of SWF with the rise of other frequency components. STFT spectrogram needed adjustment of 200 ms window size for observation of fault frequencies. At the same time, the scalogram does not require any adjustment of window size but was observed at 12 voices per octave. Both STFT and CWT are observed to be capable of detecting the successive multiple faults in motor current in the frequency domain. However, CWT scalogram detects the fault, and visualization of faults as an event becomes easier than spectrogram. Scalogram can resolve frequency components at fault if voices per octave are adjusted. However, spectrogram resolves frequency components better at the fault time if the time window size is appropriately adjusted.
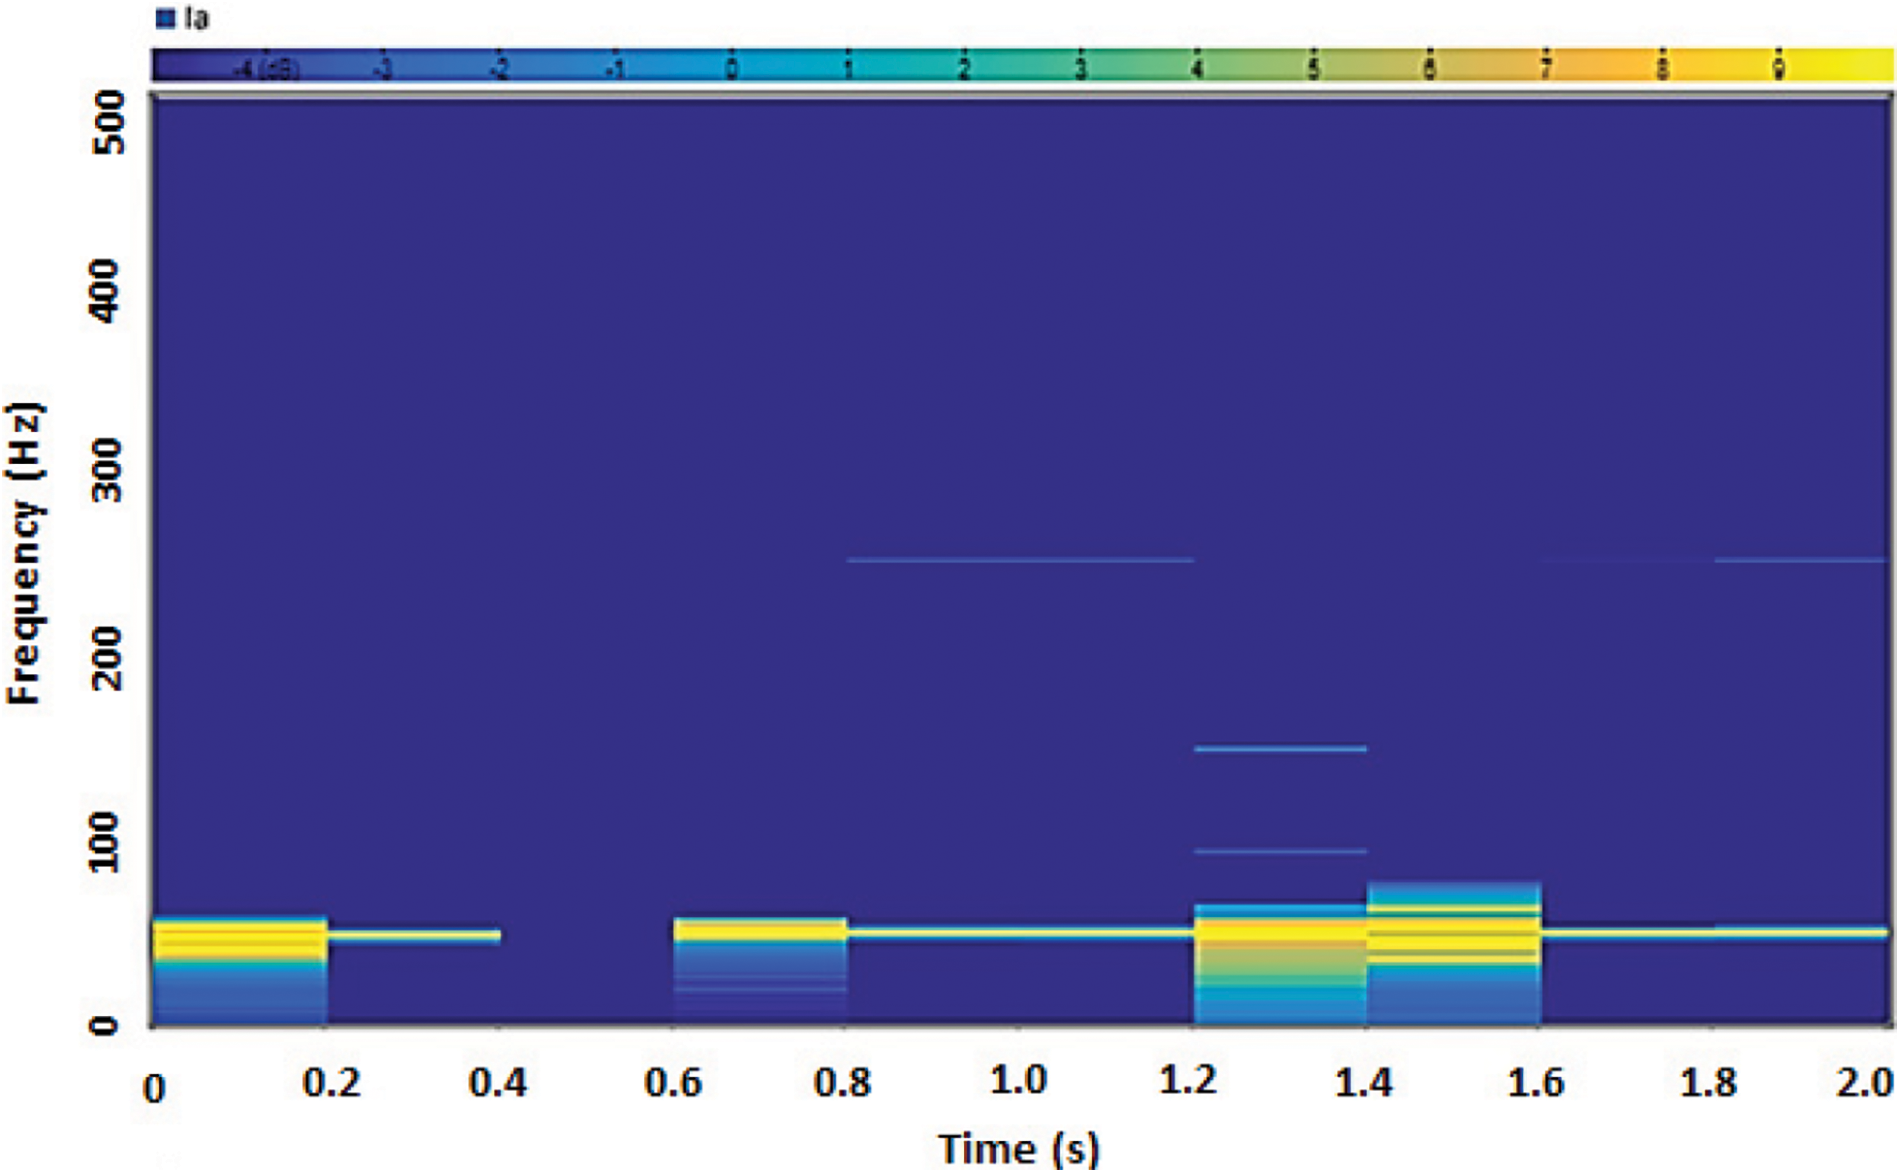
Figure 23: STFT (spectrogram) in multiple faults (0–500 Hz, −10 to 15 dB, 0 percent overlap, and 200 ms window size)

Figure 24: CWT (scalogram) in multiple faults (0–256 Hz, 12 voices per octave, and 0–10 dB power range)
5.5 Fault Classification Using Deep Learning
We have trained and tested the MLP [30], LSTM [31], and 1D-CNN [32] deep learning algorithms for induction motor fault detection and identification (i.e., classification) in Python using the dataset and its labels as mentioned in Table 4. The multiclass Confusion matrixes for the classification of 10 types of conditions using these DL models are shown in Figs. 25–27. The accuracy comparison of models is provided in Table 11, showing individual accuracy observed for each class. The classification result shows that DL has demonstrated effective performance in individual faults and also classified multiple faults. Comparison among the three models concludes LSTM has a better algorithm that achieved a maximum average accuracy of 96%.

Figure 25: Confusion matrix MLP

Figure 26: Confusion matrix LSTM

Figure 27: Confusion matrix 1D-CNN

Moreover, the comparative performance of the three DL models in terms of precision, recall, F1-score, and average accuracy is shown in Fig. 28. LSTM has also shown better performance in all four measures of performance.

Figure 28: Plot of performance parameters of DL models
In this paper, we have presented the three-phase induction motor fault detection and identification using advanced signal processing and deep learning approaches in healthy and unhealthy conditions. Through the motor current signature analysis method, three-phase induction motor faults, including stator as single phasing, stator winding, and multiple faults, were induced and detected with FFT, STFT, and CWT signal processing approaches. The simulation was carried out in MATLAB for single phasing condition and detection using MCSA (FFT, STFT, and CWT). In SWF detection through MCSA (FFT spectrum, spectrogram, and scalogram), it is difficult to distinguish which phase has been exposed to a fault, and classification of the faulty phase is necessary in condition monitoring systems. Whereas, while working with THD-based analysis of stator current in SWF conditions, reasonable information is obtained on which phase of motor has been exposed to SWF.
Therefore, three deep learning models MLP, 1DCNN, and LSTM were trained and tested with the dataset generated locally for the purpose of healthy and unhealthy conditions of the induction motor. All three DL models were simulated for classifications of different fault conditions with raw data of stator current. The simulation results show that the employed deep learning techniques provide better fault detection and classification in single phasing or SWF with phase information, and combined (single phasing and SWF). The performance of these DL models is measured by confusion matrix, precision, recall, F1-score and average score. These results are encouraging and show that the condition monitoring of the induction motor can be done by deep learning models. In addition, DL models can further be investigated in conjunction with MCSA for fault detection and classification. The motor conditions need to be studied as individual as well as multiple faults, using THD, FFT, STFT (time-frequency), and CWT Scalogram for time-frequency analysis and impact of fault on the stator current. The simulated fault conditions could be compared with the real-time acquired time-domain stator current signal. Moreover, the DL techniques could be used to classify the faults on the basis of time-domain data or frequency domain data acquired on motor current signals.
Funding Statement: Authors would like to acknowledge the support of the ‘Haptics, Human Robotics, and Condition Monitoring Lab’ Established in Mehran University of Engineering and Technology, Jamshoro, under the umbrella of the National Centre of Robotics and Automation.
Conflicts of Interest: The authors declare that they have no conflicts of interest to report regarding the present study.
References
1. Drakaki, M., Karnavas, Y. L., Tzionas, P., Chasiotis, I. D. (2021). Recent developments towards industry 4.0 oriented predictive maintenance in induction motors. Procedia Computer Science, 180, 943–949. DOI 10.1016/j.procs.2021.01.345. [Google Scholar] [CrossRef]
2. Chen, J., Feng, Y., Lu, C., Fei, C. (2021). Fusion fault diagnosis approach to rolling bearing with vibrational and acoustic emission signals. Computer Modeling in Engineering & Sciences, 129(2), 1013–1027. DOI 10.32604/cmes.2021.016980. [Google Scholar] [CrossRef]
3. Mal, K., Kalwar, I. H., Shaikh, K., Memon, T. D., Chowdhry, B. S. et al. (2021). A new estimation of nonlinear contact forces of railway vehicle. Intelligent Automation and Soft Computing, 28(3), 823–841. DOI 10.32604/iasc.2021.016990. [Google Scholar] [CrossRef]
4. Priyadi, A., Sari, Y. N., Jonar, V., Asfani, D. A., Andriawan, F. (2014). Short circuit simulation and analysis in stator winding of three phase induction motor using wavelet transform and power spectral density. ISITIA, Seminar on Intelligent Technology and Its Applications, pp. 1–6. Surabaya, Indonesia. [Google Scholar]
5. Soother, D. K., Ujjan, S. M., Dev, K., Khowaja, S. A., Bhatti, N. A. et al. (2022). Towards soft real-time fault diagnosis for edge devices in industrial IoT using deep domain adaptation training strategy. Journal of Parallel and Distributed Computing, 160, 90–99. DOI 10.1016/j.jpdc.2021.10.005. [Google Scholar] [CrossRef]
6. Soother, D. K., Kalwar, I. H., Hussain, T., Chowdhry, B. S., Ujjan, S. M. et al. (2021). A novel method based on UNET for bearing fault diagnosis. Computers, Materials & Continua, 69(1), 393–408. DOI 10.32604/cmc.2021.014941. [Google Scholar] [CrossRef]
7. Wee, L. X., Yan, Z., Park, Y. J., Leau, Y. B., Nisar, K. et al. (2018). Route optimization management of producer mobility in information-centric networking. First International Conference on Intelligent Transport Systems, pp. 81–91. Guimarães, Portugal, Springer. [Google Scholar]
8. Gangsar, P., Tiwari, R. (2017). Comparative investigation of vibration and current monitoring for prediction of mechanical and electrical faults in induction motor based on multiclass-support vector machine algorithms. Mechanical Systems and Signal Processing, 94, 464–481. DOI 10.1016/j.ymssp.2017.03.016. [Google Scholar] [CrossRef]
9. Prakasam, K., Ramesh, S. (2016). Testing and analysis of induction motor electrical faults using current signature analysis. Circuits and Systems, 7(9), 2651–2662. DOI 10.4236/cs.2016.79229. [Google Scholar] [CrossRef]
10. Bossio, G., Angelo, C., Donolo, P., Castellino, A., Garcia, G. (2009). Effects of voltage unbalance on IM power, torque and vibrations. IEEE International Symposium on Diagnostics for Electric Machines, Power Electronics and Drives, pp. 1–6. Cargese, France, IEEE. [Google Scholar]
11. Hussain, M., Ahmed, R. R., Kalwar, I. H., Memon, T. D. (2020). Multiple faults detection and identification of three phase induction motor using advanced signal processing techniques. 3C Technologia, pp. 87–111. Alcoy (AlicanteSpain. DOI 10.17993/3ctecno.2020.specialissue6.93-117. [Google Scholar] [CrossRef]
12. Messaoudi, M., Sbita, L. (2010). Multiple faults diagnosis in induction motor using the MCSA method. International Journal of Signal & Image Processing, 1(3), 190–195. [Google Scholar]
13. Alawady, A., Yousof, M., Azis, N., Talib, M. (2020). Phase to phase fault detection of 3-phase induction motor using FRA technique. International Journal of Power Electronics and Drive Systems, 11(3), 1241–1248. DOI 10.11591/ijpeds.v11.i3.pp1241-1248. [Google Scholar] [CrossRef]
14. Gayatridevi, G., Sekar, S. (2020). Induction motor stator inter turn short circuit fault detection in accordance with line current sequence components using artificial neural network. Journal of Electrical Engineering, 20(1), 1–11. DOI 10.1155/2019/4825787. [Google Scholar] [CrossRef]
15. Konar, P., Chattopadhyay, P. (2015). Multi-class fault diagnosis of induction motor using hilbert and wavelet transform. Applied Soft Computing, 30, 341–352. DOI 10.1016/j.asoc.2014.11.062. [Google Scholar] [CrossRef]
16. Wu, Y., Jiang, B., Wang, Y. (2020). Incipient winding fault detection and diagnosis for squirrel-cage induction motors equipped on CRH trains. ISA Transactions, 99, 488–495. DOI 10.1016/j.isatra.2019.09.020. [Google Scholar] [CrossRef]
17. Sahay, K., Siddiqui, K. M., Giri, V. (2015). Rotor broken bar fault detection in induction motor using transformative techniques. Journal of Electrical Engineering, 15(1), 1–6. DOI 10.1049/iet-pel.2019.1543. [Google Scholar] [CrossRef]
18. Yesilyurt, I. (2004). The application of the conditional moments analysis to gearbox fault detection—A comparative study using the spectrogram and scalogram. NDT & E International, 37(4), 309–320. DOI 10.1016/j.ndteint.2003.10.005. [Google Scholar] [CrossRef]
19. Mehala, N., Dahiya, R. (2008). A comparative study of FFT, STFT and wavelet techniques for induction machine fault diagnostic analysis. Proceedings of the 7th WSEAS International Conference on Computational Intelligence, Man-Machine Systems and Cybernetics, pp. 203–208. Cairo, Egypt. [Google Scholar]
20. Hussain, M., Soother, D. K., Kalwar, I. H., Memon, T. D., Memon, Z. A. et al. (2021). Stator winding fault detection and classification in three-phase induction motor. Intelligent Automation and Soft Computing, 29(3), 869–883. DOI 10.32604/iasc.2021.017790. [Google Scholar] [CrossRef]
21. Memala, W. A., Rajini, V. (2015). Single phasing fault identification using wavelet analysis. International Journal of Engineering and Technology, 6(6), 2712–2721. [Google Scholar]
22. Diwatelwar, K. P., Malode, S. K. (2018). Fault detection and analysis of three-phase induction motors using MATLAB simulink model. International Research Journal of Engineering and Technology, 5(5), 1643–1649. [Google Scholar]
23. Shaikh, K., Kalwer, I. H., Mal, K., Chowdhry, B. S. (2021). Signal based indirect wheel profile estimation technique for solid axle railway wheelset. Mehran University Research Journal of Engineering & Technology, 40(2), 443–449. DOI 10.22581/muet1982.2102.18. [Google Scholar] [CrossRef]
24. Ince, T., Kiranyaz, S., Eren, L., Askar, M., Gabbouj, M. (2016). Real-time motor fault detection by 1-D convolutional neural networks. IEEE Transactions on Industrial Electronics, 63(11), 7067–7075. DOI 10.1109/TIE.2016.2582729. [Google Scholar] [CrossRef]
25. Schmidhuber, J. (2015). Deep learning in neural networks: An overview. Neural Networks, 61, 85–117. DOI 10.1016/j.neunet.2014.09.003. [Google Scholar] [CrossRef]
26. Hochreiter, S., Schmidhuber, J. (1997). Long short-term memory. In: Neural computation, vol. 9. Cambridge, MA USA: MIT Press. [Google Scholar]
27. Zhao, R., Wang, J., Yan, R., Mao, K. (2016). Machine health monitoring with LSTM networks. 10th International Conference on Sensing Technology (ICST), pp. 1–6. Nanjing, China, IEEE. [Google Scholar]
28. Soother, D. K., Daudpoto, J., Harris, N. R., Hussain, M., Mehran, S. et al. (2021). The importance of feature processing in deep-learning-based condition monitoring of motors. Mathematical Problems in Engineering, 2021, 1–23. DOI 10.1155/2021/9927151. [Google Scholar] [CrossRef]
29. Jalayer, M., Orsenigo, C., Vercellis, C. (2021). Fault detection and diagnosis for rotating machinery: A model based on convolutional LSTM, fast fourier and continuous wavelet transforms. Computers in Industry, 125. 103378. DOI 10.1016/j.compind.2020.103378. [Google Scholar] [CrossRef]
30. Senguler, T., Karatoprak, E., Seker, S. (2010). A new MLP approach for the detection of the incipient bearing damage. Advances in Electrical and Computer Engineering, 10(3), 34–39. DOI 10.4316/aece.2010.03006. [Google Scholar] [CrossRef]
31. Fahim, M. A., Soother, D. K., Harijan, B. L., Kumari, J., Qureshi, A. (2021). A deep learninag based non-invasive and real-time fault detection system for 3-phase induction motors. Sukkur IBA Journal of Emerging Technologies, 4(1), 1–11. DOI 10.30537/sjet.v4i1.777. [Google Scholar] [CrossRef]
32. Pan, H., He, X., Tang, S., Meng, F. (2018). An improved bearing fault diagnosis method using one-dimensional CNN and LSTM. Strojniski Vestnik/Journal of Mechanical Engineering, 64, 443–452. DOI 10.5545/sv-jme.2018.5249. [Google Scholar] [CrossRef]
 | This work is licensed under a Creative Commons Attribution 4.0 International License, which permits unrestricted use, distribution, and reproduction in any medium, provided the original work is properly cited. |