| Computer Modeling in Engineering & Sciences |
DOI: 10.32604/cmes.2022.021324
ARTICLE
Continuous Symmetry Analysis of the Effects of City Infrastructures on Invariant Metrics for House Market Volatilities
1Department of Electrical Engineering, National Taiwan Ocean University, Keelung, 20224, Taiwan
2Department of Computer Science, National Taipei University of Education, Taipei, 10671, Taiwan
3Department of Electronic Engineering, Chang Gung University, Tao-Yuan City, 33302, Taiwan
4Department of Biomechatronics Engineering, National Taiwan University, Taipei, 10617, Taiwan
5Department of Medical Research, China Medical University Hospital, China Medical University, Taichung, 40447, Taiwan
6Department of Electronic Engineering, Ming Chi University of Technology, New Taipei City, 24301, Taiwan
7Artificial Intelligence Research Center, Chang Gung University, Tao-Yuan City, 33302, Taiwan
*Corresponding Author: Tzer-En Nee. Email: neete@mail.cgu.edu.tw
Received: 08 January 2022; Accepted: 30 May 2022
Abstract: The invariant metrics of the effects of park size and distance to public transportation on housing value volatilities in Boston, Milwaukee, Taipei and Tokyo are investigated. They reveal a Cobb-Douglas-like behavior. The scale-invariant exponents corresponding to the percentage of a green area (a) are 7.4, 8.41, 14.1 and 15.5 for Boston, Milwaukee, Taipei and Tokyo, respectively, while the corresponding direct distances to the nearest metro station (d) are −5, −5.88, −10 and −10, for Boston, Milwaukee, Taipei and Tokyo, respectively. The multiphysics-based analysis provides a powerful approach for the symmetry characterization of market engineering. The scaling exponent ratio between park area percentages and distances to metro stations is approximately 3/2. The scaling exponent ratio expressed in the perceptual stimuli will remain invariant under group transformation. According to Stevens' power law, the perception-dependent feature spaces for parks and public transportation can be described as two- and three-dimensional conceptual spaces. Based on the prolongation structure of the Schrödinger equation, the SL(2, R) models are used to analyze the house-price volatilities. Consistent with Shepard’s law, the rotational group leads to a Gaussian pattern, exhibiting an extension of the special linear group structure by embedding SO(3) ⊗ R(3) in SL(2, R). The influencing factors related to cognitive functioning exhibit substantially different scale-invariant characteristics corresponding to the complexity of the socio-economic features. Accordingly, the contour shapes of the price volatilities obtained from the group-theoretical analysis not only corroborate the impact of the housing pricing estimation in these cities but also reveal the invariant features of their housing markets are faced with the forthcoming sustainable development of big data technologies and computational urban science research.
Keywords: Invariant metrics; Schrödinger equation; group theory
Inspired by the principles of physics, many physicists have studied financial markets by assuming that the economic world behaves like a set of interacting particles [1]. Using the new tools of statistical physics and recent breakthroughs in understanding chaotic systems, physicists or statisticians, with the help of some serious mathematics borrowed from the study of disordered materials, are dismantling some of the puzzling economics and reducing them to some elegant general principles, e.g., symmetry and invariance [2]. One of the fundamental human needs is access to decent and affordable housing [3,4]. The development of the housing market to ensure that this basic human right is met deserves further research attention [5]. Increasingly, statisticians are employing the complex static and dynamic systems approach for the analysis and modeling of psychophysics, ecophysics, and financial engineering, as experimental scientists are accustomed to doing [1,6–9]. The economic invariance accounting for the symmetry of the housing market fluctuation corresponding to different types of feature variables is indeed worthy of exploration [10]. The property of objects or laws that do not change when the scales of length, energy, or other variables are multiplied by a common factor is called scale invariance [11]. Consumer choices and preferences regarding transportation and green feature are also relevant to the environmental parameters [12,13]. Apparently, close proximity to public parks and the transportation system are both considered to have significantly positive influences on housing prices, indicating a need for detailed investigation [14–16]. Statistical regression approaches have been applied to widely estimate the effects on residential housing pricing of park sizes and distances to the transportation system for individual cities based on data obtained from the United States Geological Survey (USGS) and online local government information [17–20]. However, the USGS employs a rather simple way to evaluate both the area and the distance. Furthermore, due to the variability in data entries, linguistic characteristics, legal definitions and culture in different countries around the world, the standardization of house transaction datasets and metrics remains a major problem. Thus, very few studies have been carried out to extend local level findings to the global level [21,22].
Although the house price volatility that underlies econometric models of economic activity remains to a large extent unexplored, a statistical hedonic price model (HPM) associated with both the positive and negative impacts of micro-neighborhoods can be constructed [23,24] by incorporating the regression coefficients for each independent variable concerned. It currently focuses on the effects of public parks and transportation systems on residential property values [25,26]. To understand the role of infrastructure amenities and disamenities in determining the value of real estate, we have the well-established General Cobb-Douglas (GCD) production function which has been used to explore socio-economic systems, including the urbanization process in cities [27–29]. In our previous report, we applied a group theoretical framework utilized in the present study. We evaluated the essential Cobb-Douglas-like behavior in property price volatilities [2]. Originating from parks and transportation, the scale invariance is empirically demonstrated by plotting transaction price, distance to metro and park area percentage for these four cities, including Boston, Milwaukee, Tokyo and Taipei, globally investigated in log-log coordinates. The R2 values, mean absolute error (MAE), mean squared error (MSE) and root mean squared error (RMSE) are employed for model evaluation.
Furthermore, careful study of the invariant regression slopes across cities is also of interest. It goes without saying that homebuyer behavior is a large and complex subject. To some extent, consumers are only willing to pay for a house if the selling price is perceived to be reasonable. The perceived stimuli, including structure, neighborhood and location characteristics [12,23,24] are thus indisputably considered to be embedded in real property price volatilities, resulting in real estate prices that are related to perceived intensity [30]. However, most housing price models are primarily based on the three aspects of measure specifications, namely type, impendence and opportunity, and under the assumption that house-buyers are rational [31]. In light of the limitations and inconvenience of data collection and the prevalence of individual subjective differences, few have focused on housing price data based on perception, and fewer still have quantifiably described the interplay between perception-dependent housing features and property price volatilities [32,33]. However, perception is a powerful psychological variable involved in the consumer decision-making process. Stevens and Fechner developed two major matching-response models of psychophysical judgment to account for the effects of stimulus strength on perceived intensity. Stevens proposed that power-law relationships would be expected between perceived intensity and stimulus strength, while Fechner considered that receptors had logarithmic response characteristics [34,35]. Generally, the Stevens power law does capture the relationship between the stimulus magnitude and the perceived intensity [8,9]. Psychology has produced considerable evidence that the geometrical forms within a psychological space or conceptual space established for sets of stimuli provide a more specific way of assessing many human perceptions than a qualitative semantic approach does [36–39]. The six perceptual dimensions defined in the MIT Place Pulse datasets, namely, Beautiful, Boring, Depressing, Lively, Safe and Wealthy, have been successfully used in socio-economic researches [40,41]. If an understanding of the perception of homebuyers could be clearly incorporated into existing housing price models, it would help to meet the challenges of new requirements for Industry 5.0 developments, characterizing the feature spaces of the explanatory variables associated with the different attributes of house price capitalization effects. In this work, the perceptual scaling exponent ratio between park area percentage and distance to metro stations is examined to indicate the connection between psychological perceptions and transaction prices.
Moreover, the scaling exponent ratio expressed in the perceptual stimuli will remain invariant under group transformation. These fundamental perceptual constancies and the corresponding Lie transformation groups in group-theoretic terms have both been proposed [8–9,42]. The classical development of the group-theoretic basis of symmetry in mathematics treats human perception as the semidirect product of the three-dimensional translation group
Applying the well-developed HPM, we modified the objective measurable attributes affecting property price to account for park size and distance to public transport, similar to that which has been reported for many other public amenities [17,30,50,51]. The framework for estimating park area percentage and distance to public transportation is schematically demonstrated in Fig. 1. We have taken the house of interest as the center of a square area and drawn a box with the sides oriented North-South and East-West on the map. To analyze the percentage of the green area we used the Image J [52] software, designated as A, and the direct distance to public transportation, designated as D, was found by using the USGS National Map Viewer. This study employed house price datasets based on real data, which are freely downloadable from local government institute websites [53–56]. The data of this study were used from four national data sources: The US Boston of property assessment, Milwaukee Open Data of property sales data, the Japan Tokyo of Interior real estate transaction Information, and the R.O.C Taiwan Taipei of real estate transaction price information, respectively. The number of preprocessing data of the house price and feature of sales transactions during 2019 are 5750, 1097, 7937 and 12,283, respectively. For reasons of visual brevity, only a few samples of the map legends, i.e., houses, which appeared in USGS National Map on the relative location, were schematically deposited. To homogenize data properly and make group-theoretical analysis more practical and feasible, all collected values in house prices were normalized to the maximum value of the transaction prices for Boston, Milwaukee, Taipei and Tokyo, respectively. To avoid the discrepancies caused by differences in currency exchange rates and distance metrics, all the currency values obtained were normalized in U.S. dollars, while all the metric distances were converted to imperial units.
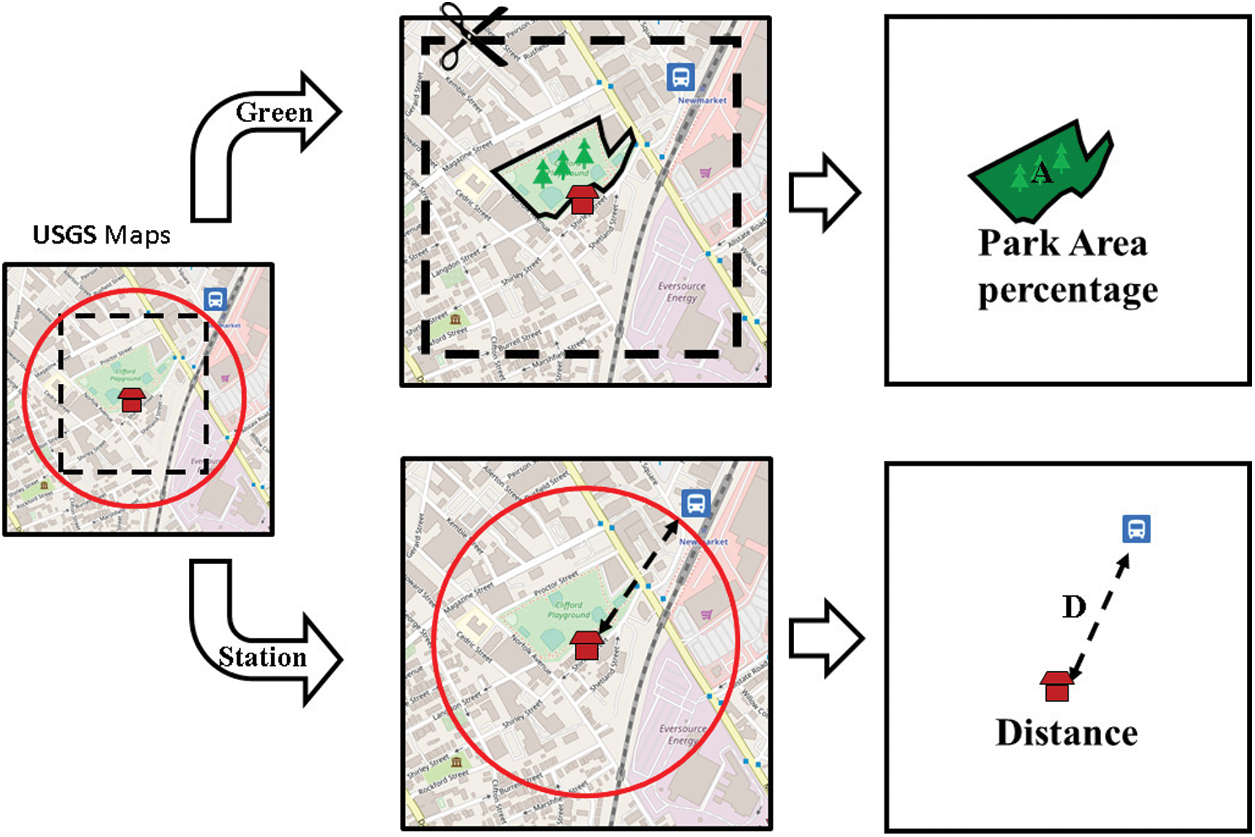
Figure 1: Schematic diagram of the implementation of the proposed method
In 1927, in their a paper entitled “A theory of Production” presented at meetings of the American Economic Association, Cobb and Douglas proposed what is now known as the Cobb-Douglas function, a mathematical representation of the relationship between capital, labor, and output, using statistical analysis to find stable relationship between empirical measures of inputs and outputs [57]. That paper used least squares regression of the log of the output-to-capital ratio in manufacturing on the log of the labor-to-capital ratio to cast light on important questions of economic theory and policy. As assumed in the defined problem, the dimensional production function model can be formulated once the following function is established as expressed in Eq. (1) as
where the elements of
Following the Cobb-Douglas function, researchers have started referring to a production function of a multiplicative form, namely Eq. (2) as
where the base
In psychophysical terms,
In this work, it is believed that the perceived stimuli, namely the area of urban green space and the distance to public transportation, will be indicated by fluctuations in real estate price. A larger area of urban green space and a nearer distance to public transportation present greater stimulation to the perceived intensity of the housing price. Thus, real estate prices are related to perceived intensity, as schematically illustrated in Fig. 2. The fractal exponents can be regarded mainly as statistical measures of complexity that show how housing prices vary in response to stimulus factors.
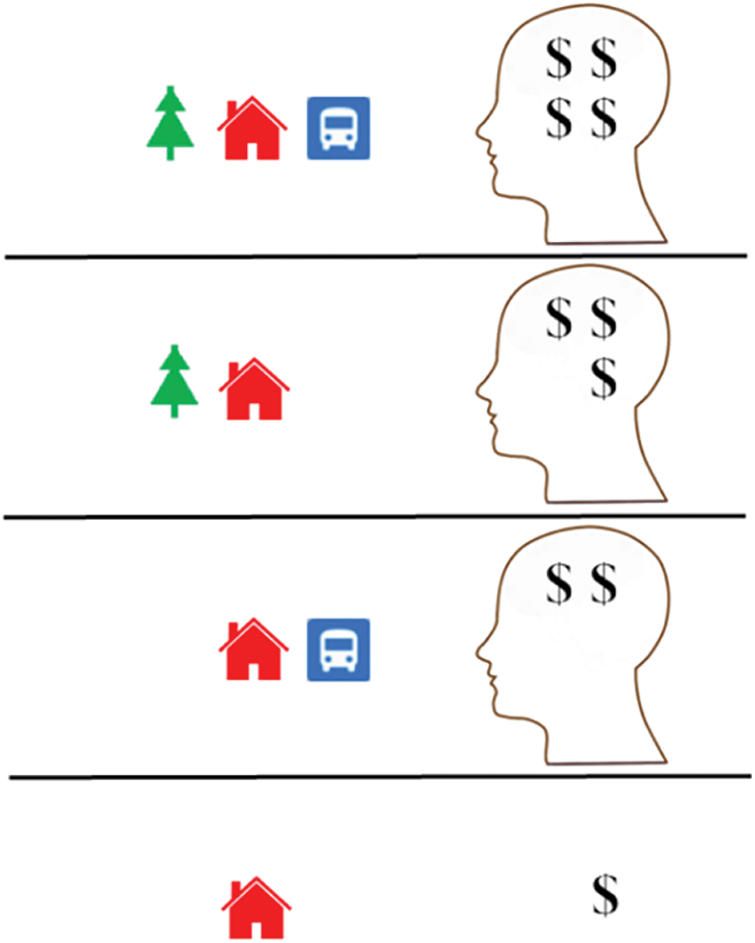
Figure 2: Schematic diagram of different perceived stimuli determining house prices
The proposed model assumes that expressed in Eq. (4) as
It becomes obvious that the form of the number-number function
The numerical parameters
Other arguments may also be selected as dimensionally independent. Estimations of the GCD model parameters for the transaction price were made based on statistical data pertaining to four cities: Boston, Milwaukee, Taipei and Tokyo. A choice must be made to ensure that the modeling results demonstrate minimum deviations from the relevant statistical data. The principle usually applied is to minimize the assumed identification criterion. Furthermore, based on the developed utility function and statistical significance testing, we can assess the application of the GCD model with the associated multi-factors, such as infrastructure amenities and housing attributes, using the data from the fused datasets mentioned above.
The proposed method can thus provide a simple way to deduce the scale invariance in both private and public property economic systems based on nationwide city-level analysis [57–61]. Under the general assumption of homogeneity of the housing product, e.g., perfect market operations, the volatility of house prices in relation to the direct distance to metro stations and the percentage of green area inside the designated area can be characterized as expressed in Eq. (7) as
where P is the transaction price; k is the total price factor; A is the percentage of the green area; and D is the direct distance to the nearest metro station, respectively. The scale-invariant exponents a and d can be specified as the perceptual scaling exponents or the elasticity exponents, corresponding to the percentage of green area and the direct distance to the nearest metro station, respectively, inherently implying the psychologically relevant complexity in housing characteristics [11,62,63]. Potential house buyers may make decisions about how to react to stimuli or situations in accordance with the consequences associated with previously experienced stimuli or situations [39]. This function can be geometrically interpreted as a straight line with a slope of –a/d and an intercept of 1/d expressed in log-log coordinates. Both the scale-invariant exponents and the perceptual exponent ratio provide many salient features regarding the volatility of residential real estate markets.
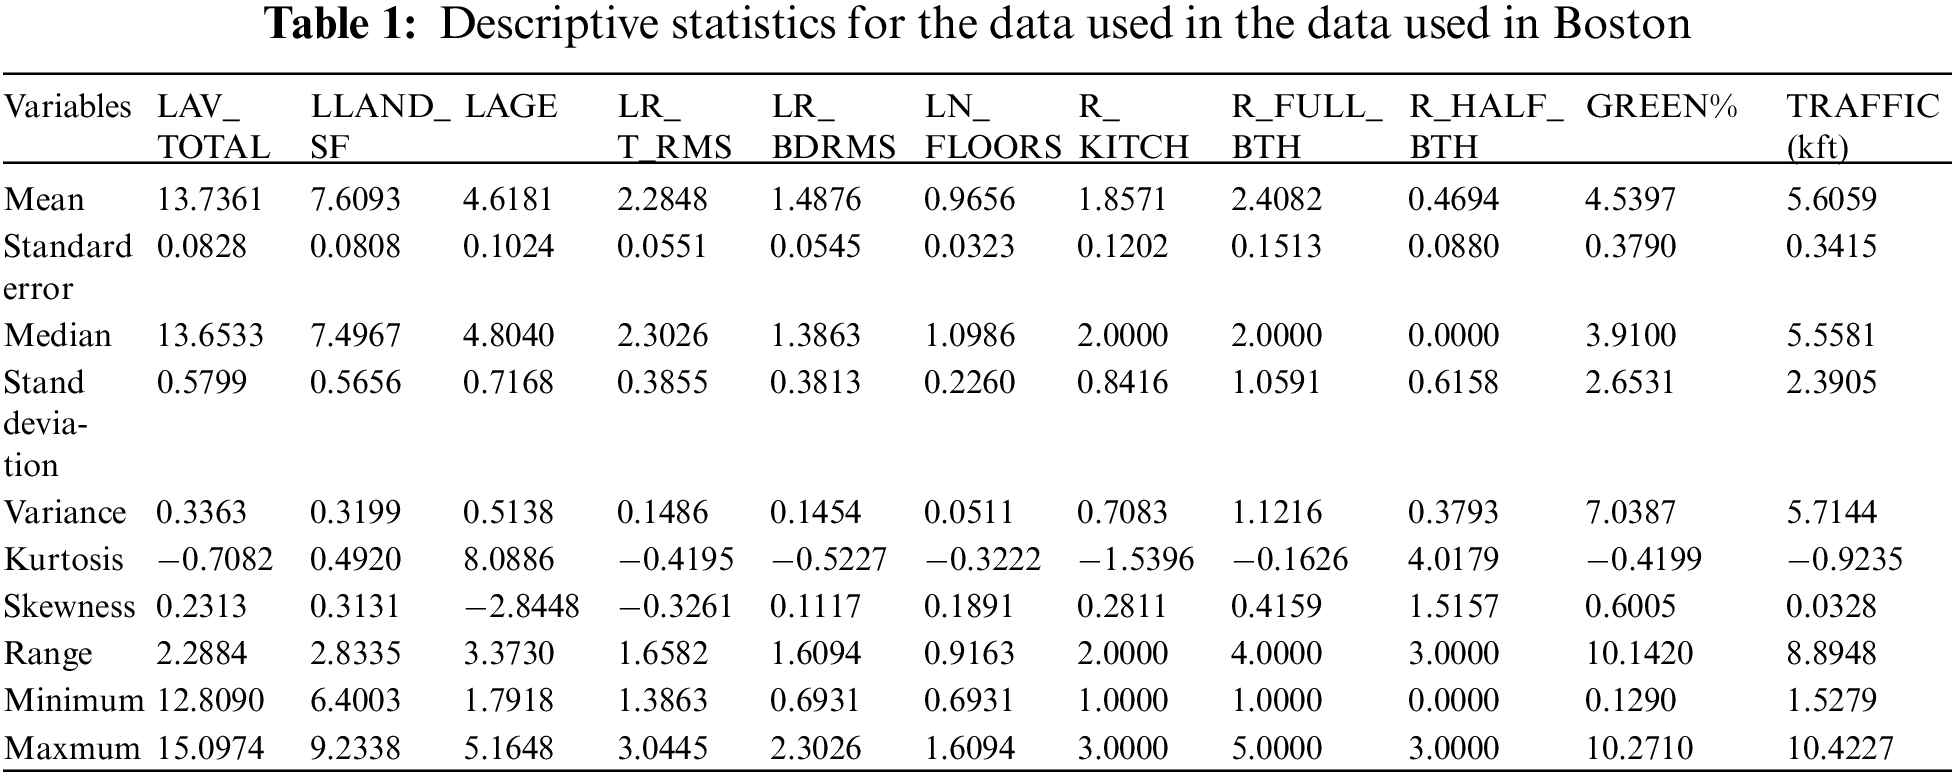
It has been known that the dependence of house features on the residential property value can be estimated by employing the well-established hedonic regression analysis method in teams of location characteristics, neighborhood characteristics and structure characteristics. The independent variables are the individual structures, the neighborhood, the environment and house age, etc., while the dependent variable is the house price, indicating that housing-market price is a function of tangible characteristics, building characteristics and influencing factors. The Boston housing dataset contains US census data concerning housing in various areas around that city. Each sample corresponds to a unique area and has about a dozen measures. The dataset was first published in 1978 and is quite small, containing only about 500 samples. However, there are many data analysis related research results for the Boston Housing Dataset [64]. To begin with, using the Boston Housing Dataset, we propose a well-developed hedonic regression approach which can be employed for the analysis of property prices in a residential district in Boston only. In this study, we subsequently extended the proposed approach to other cities, i.e., Milwaukee, Taipei and Tokyo for systematic examination. Basic descriptive statistics for the data used in Boston are presented in Table 1. We use the natural logarithm transformation of variables to deal with the non-linear relationship between independent variables and dependent variables and the more approximately normal the highly skewed variables. In particular, the normalization of data analysis and comparison in different nations [65]. The variables indicating the conventional housing attributes which influence property values in the adopted price analysis model are defined below. The variables, including the total transaction sales price (LAV_TOTAL), the area of the parcel of (LLAND_SF), the age of the residential property (LAGE), the total number of rooms (LR_T_RMS), the total number of bedrooms (LR_BDRMS) and the number of floors in the structure (LN_FLOORS). In addition, the total number of kitchens (R_KITCH), the total number of full bathrooms (R_FULL_BTH), the total number of half bathrooms (R_HALF_BTH), the unit rectangular green area percentage (GREEN), the direct distance to the nearest station (TRAFFIC). These six variables (LAV_TOTAL, LLAND_SF, LAGE, LR_T_RMS, LR_BDRMS and LN_FLOORS) are expressed as natural logarithms scaled in order of magnitude for comparison with other variables. The dependence of property prices for housing choices on the main influencing factors, i.e., proximity to a metro station, parks or both, are analyzed and explored.
In an attempt to assess the possibility of applying principal component analysis, Table 2 shows a correlation matrix that accounted for correlations among the features observed in Boston. Many descriptors, such as percentage of park area, the total number of full bathrooms and total number of floors, were found to be positively correlated with the property price, while the distance to the nearest transportation station and the house age were both found to be negatively correlated with the property price. A scatterplot of real changes in house value is depicted to illustrate the dependence of housing transaction prices on park area percentages and distances to the nearest metro stations in the four cities. Fig. 3 presents visualized data points for feature variables in Boston. The correlation coefficients between house value and the total number of full bathrooms and total number of floors were 0.7329 and 0.6615, respectively, while those between the house value and total number of half baths and house age were 0.1185 and −0.1336, respectively. The bivariate correlation analysis results thus revealed that the total number of full bathrooms and total number of floors are the major factors responsible for property value, while the total number of half baths and house age are minor ones. These findings are in accordance with similar studies [12,24,30,66]. The omitted variable bias is often of great concern when using the hedonic price method (HPM). There are, however, many previously unobserved spatial factors that impact property values [67–69]. This study thus focuses on the effects of the proximity to public parks and transportation systems on residential property values.
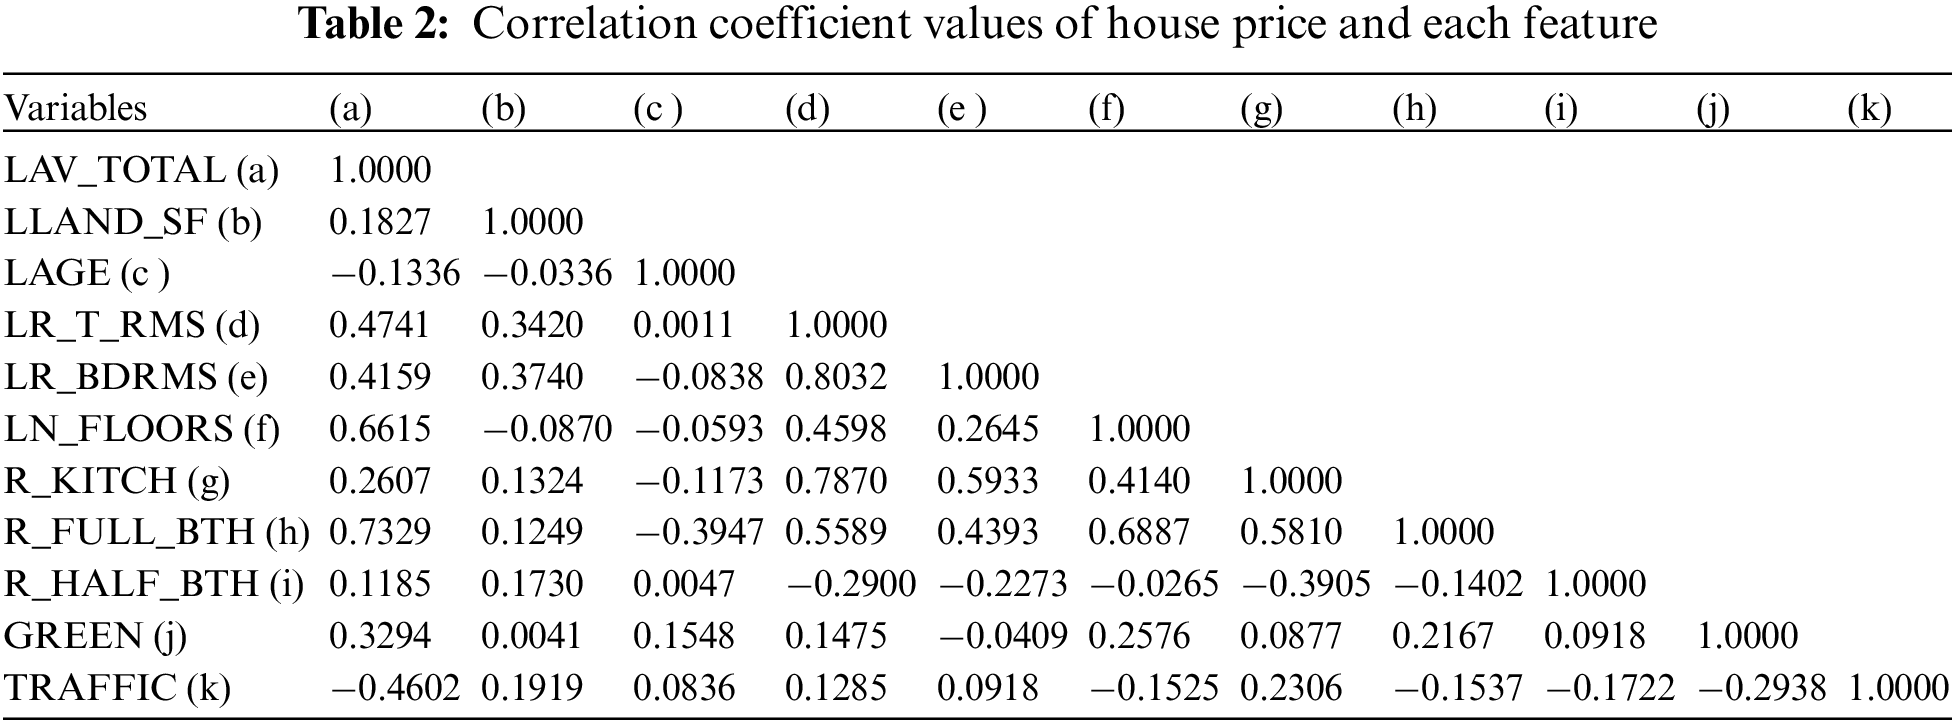
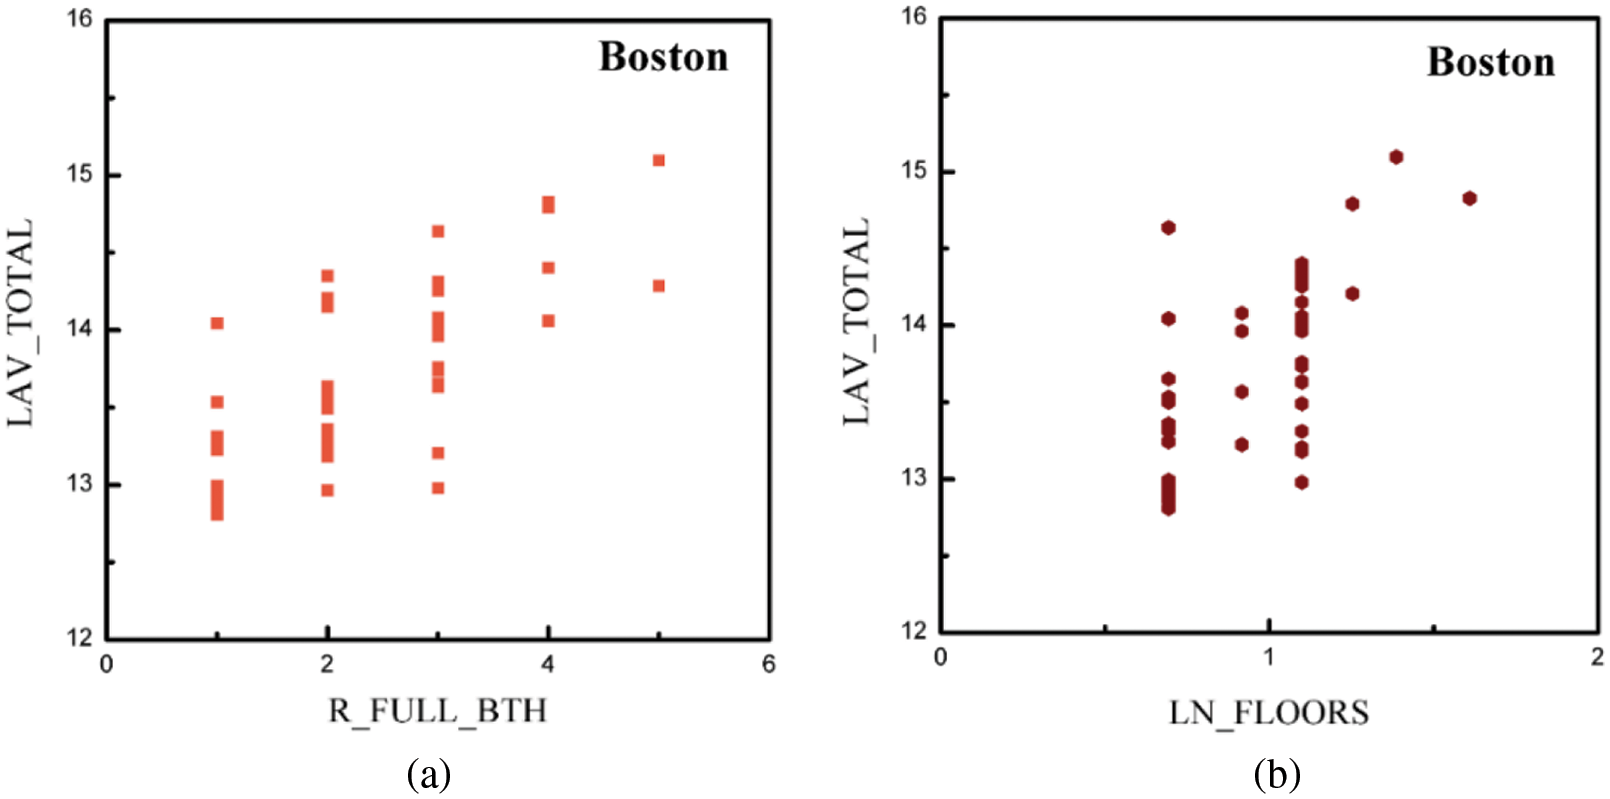
Figure 3: Data visualization to portray the relationship between property prices and selected features for (a) The total number of full baths in the structure, (b) The levels in the structure located on the parcel, in natural logarithm, (c) House age, in natural logarithm and (d) The total number of half baths the structure, respectively
Starting with the concept that a house price can be thought as a bundle comprised of the intrinsic and extrinsic attributes of a housing unit, the HPM for estimating the relationship between the housing prices and the features in the four cities investigated can be given by expressed in Eq. (8) as
where y is the housing price; a0 is the intercept term of the regression; x1, x2, x3,…, and xi are the attributes of a house; and a, b, c,…, and n are the correlation coefficients of the features studied. Performance assessment is done by comparing the R2 values, the mean absolute error (MAE), the mean squared error (MSE) and the root mean squared error (RMSE). The
where n represents the number of samples;
The MSE can indicate the forecast accuracy of a mode, measuring the square of the average distance between the real data and the predicted data. It can be calculated by expressed in Eq. (11) as
The RMSE is a common accuracy performance measure, frequently used as a measure of magnitude of the errors as shown in Eq. (12) as
The R2, MAE, MSE and RMSE were adopted to evaluate the model performance using the transaction datasets obtained from local government websites in Boston, Milwaukee, Taipei and Tokyo.
An examination of the results in Table 3 indicates that the HPM fits the data reasonably well and possesses sufficient explanatory power. The evaluation accuracy was high enough for all four cities [19,66,70,71]. Further investigation was conducted to better characterize how the percentage of green area and the distance to the nearest metro station influenced property price volatilities. The positive/negative relationships between residential property value and park size percentage as well as the distance to public transportation seem ambiguous in the data distributions of the four cities, as shown in Fig. 4. However, compared with previous studies, there was an insignificant correlation between these two features and the property values [51]. As a matter of fact, scattered observations do not negate the dependence of housing price on amenities and disamenities. A non-integer exponent can be treated primarily as a statistical measure of the response of housing prices to perceptual stimuli. Compared with the statistical results described by the HPM, the R2, MAE, MSE and RMSE criteria for these cities were also employed to assess the performance of the GCD model. Apparently, as shown in Table 3, all the correlated R2 values are greater than 0.80, indicating that the GCD model used in this study has considerable explanatory power in relation to property price volatilities.
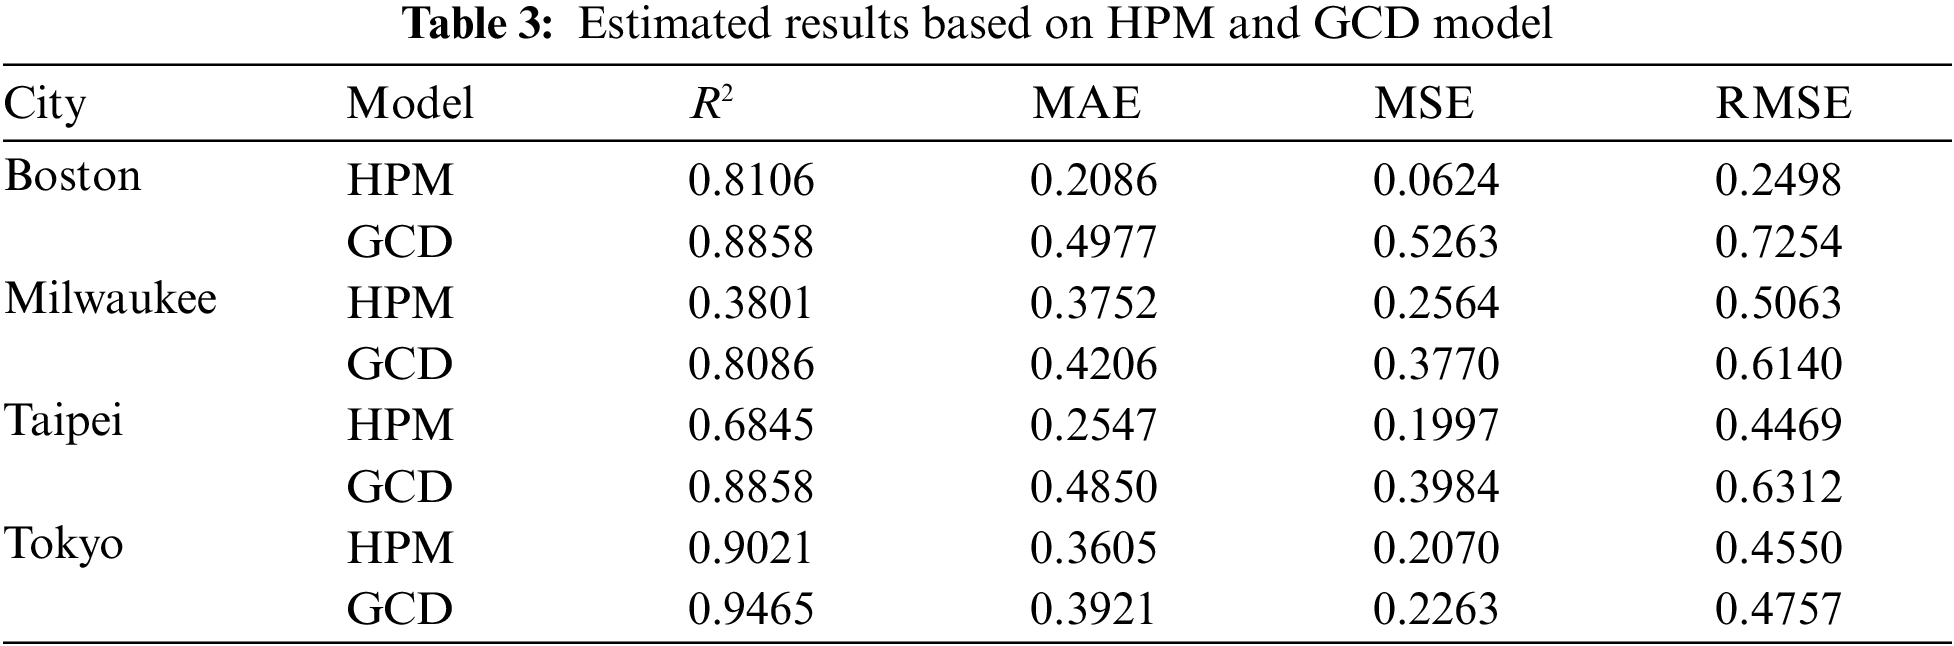
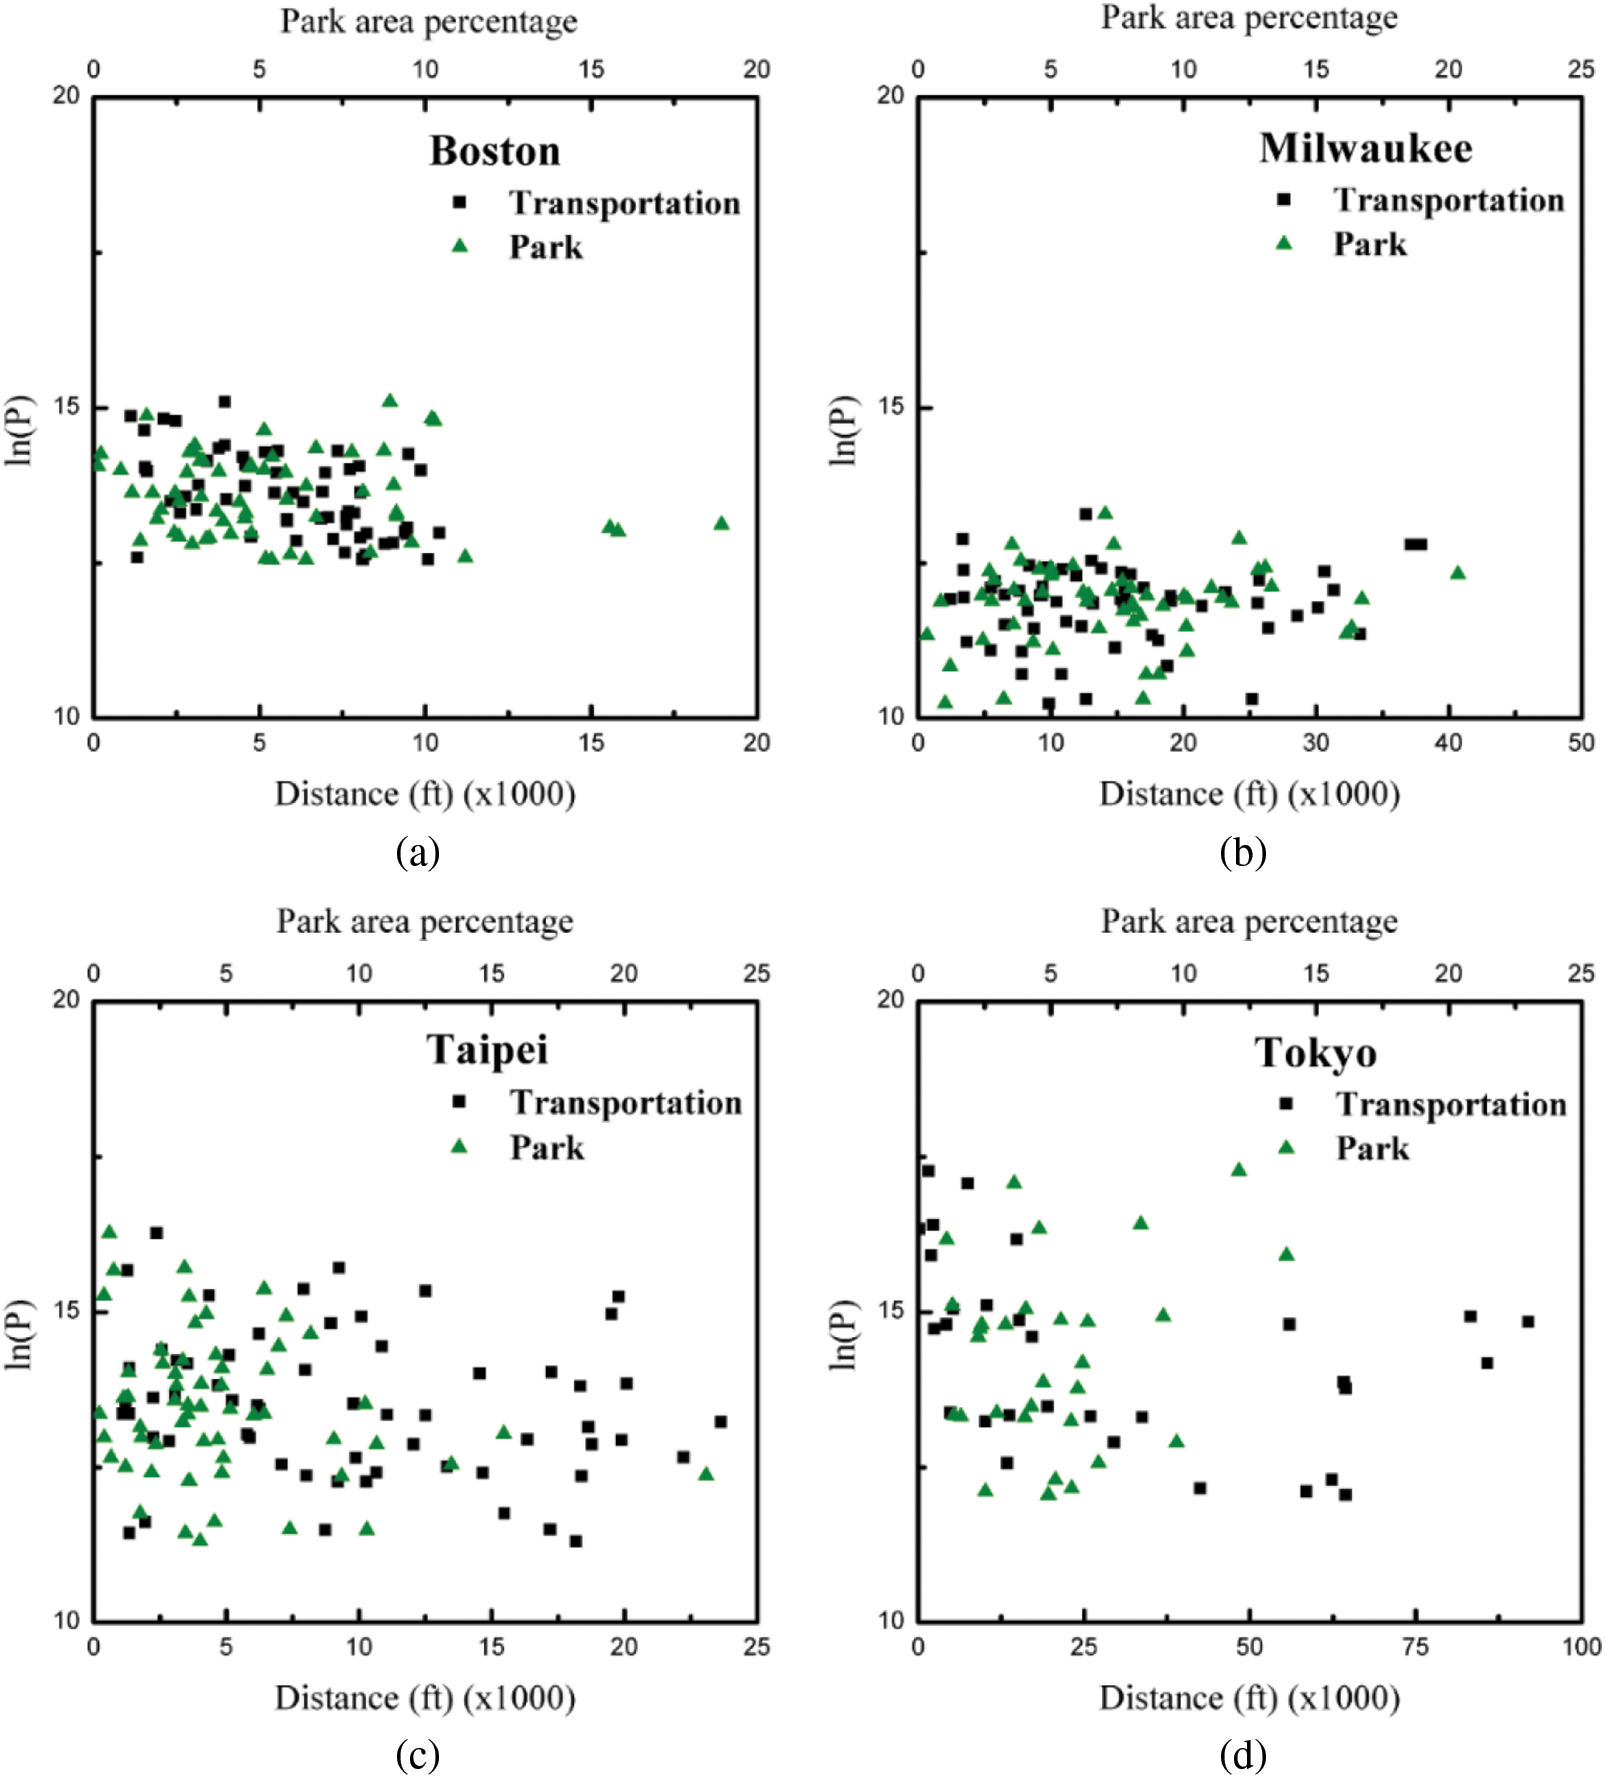
Figure 4: Residential property value with respect to distance to transportation system and the park size percentage for (a) Boston, (b) Milwaukee, (c) Taipei and (d) Tokyo, respectively
A unique approach using the GCD model described above was adopted in order to gain further insight into the volatility of the housing market and to reveal the role of the accessibility or inaccessibility of public infrastructure on real estate values. The model was used to assess the economic-related invariance of Cobb-Douglas-like behaviours. Fig. 5 illustrates the relationships between lnD/lnkP against lnA/lnkP for the four cities investigated. The straight lines indicate the linear regression results obtained using the least squares approach based on the scatter plots of the collected data points. The slope of the line showing the linear fit indicates the changes in the housing transaction price, which demonstrate a Cobb-Douglas-like behaviour. The park-area percentages and the distances to metro stations represent the exponent ratios. The scale-invariant exponents corresponding to the percentages of green area (a) are 7.4, 8.41, 14.1 and 15.5 for Boston, Milwaukee, Taipei and Tokyo, respectively, while those corresponding direct distances to the nearest metro station (d) are −5, −5.88, −10 and −10, for Boston, Milwaukee, Taipei and Tokyo, respectively. Although distributed in different areas around the world, the scaling of the exponent ratio was approximately 3/2 across cities, as indicated by the dashed line in Fig. 5, implying the internal psychological processes associated with house purchasing behaviors were held in common [72]. Moreover, the slope of GCD in the four cities corresponds to the y-axis labeled 9 and the x-axis labeled 6, i.e., the slope = Δy/Δx ≈ 9/6 = 3/2 [37,40]. This invariant metric based on the city infrastructure data and online government information implies that the house purchasing behaviors associated with the internal psychological processes are common across the different cities. Psychological variables are implicit in both GCD and HPM, but rarely explicitly articulated. Home buyers are only willing to pay as much for a house as the perceived value, as depicted in the schematic representation Fig. 2. Under the assumption that house buyers are rational, consumers are expected to comprehensively analyze the heterogeneous information inherent in the housing market prior to making a purchase.
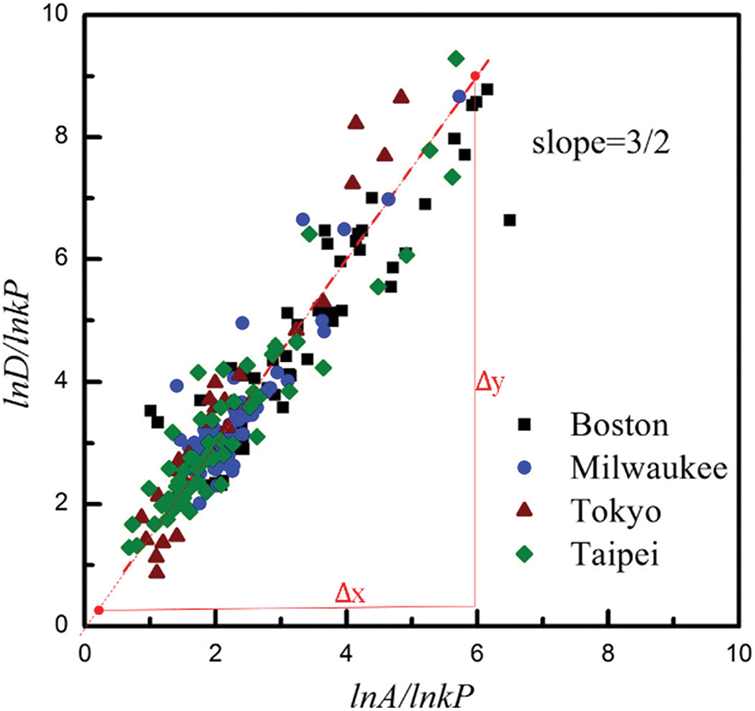
Figure 5: Scaling relationships between lnD/lnkP and lnA/lnkP for Boston, Milwaukee, Taipei and Tokyo (slope = Δy/Δx ≈ 9/6 = 3/2).
According to Stevens’ power law, real estate prices fluctuate due to the consumer’s perception of the stimuli [34,35]. The perceptual dimensions need to be incorporated with other related information to understand property price fluctuations, such as data about city infrastructure and openly available government data all of which can be geometrically represented by points, vectors and regions in conceptual space. Accordingly, the perceptual space for green areas can be conceived of as a three-dimensional conceptual space, while that for the distance to metro stations is two-dimensional. The scaling relationships obtained are shown in Fig. 5. Obviously, perceptual attributes are intrinsically subjective. The MIT Place Pulse dataset defines six perceptual criteria, Beautiful, Boring, Depressing, Lively, Safe and Wealthy, as mentioned above [40]. The accurate delineation of individual perceptual dimensions of housing characteristics in conceptual space was indeed a challenge. However, it seemed reasonable to assign
Beauty-Safety-Wealth, Beauty-Liveliness-Wealth, or Beauty-Liveliness-Safety to the green areas in three-dimensional conceptual space, and to assign Safety-Wealth, Liveliness-Wealth or Liveliness-Safety to the distance corresponding to the two-dimensional conceptual space [41,73,74].
Housing price contour maps for the cities of Boston, Milwaukee, Taipei and Tokyo prepared by combining USGS National Maps and property price information for the samples selected for the scale invariance analysis. They are shown in Figs. 6a, 6c, 6e and 6g, respectively. The difference between the four cities is mainly due to the relationship between geographical structure and urban construction, resulting in the differences on the housing price heat map. For simplicity, only a few items which appeared in the original USGS National Maps (e.g., houses) are indicated in the figure. Assuming that the mean and variance of the values remain constant across the regions studied, the ordinary Kriging method was applied to estimate by spatial interpolation the values at unknown locations based on those at known locations [75]. The peaks indicated by 1Boston, 3Boston, 1Milwaukee, 2Milwaukee, 4Milwaukee, and 1Taipei indicate areas where homebuyers are willing to pay a premium for proximity to parks, while those at 2Boston, 2Taipei and 2Tokyo are due to proximity to transportation. Furthermore, the observations corresponding to 4Boston, 3Milwaukee, 3Taipei and 1Tokyo reveal that proximity to parks and transportation might also drive up the value of nearby houses. As expected, the price distributions appear to be heavily influenced by the city’s infrastructure. The significant spectrum of spatial features clearly indicated that price fluctuations are regulated by proximity to parks, transportation or both types of infrastructure. The significant spatial spectrum features undoubtedly indicated that the entire price fluctuation was regulated by the Park, Transportation or both infrastructures marked on the maps.
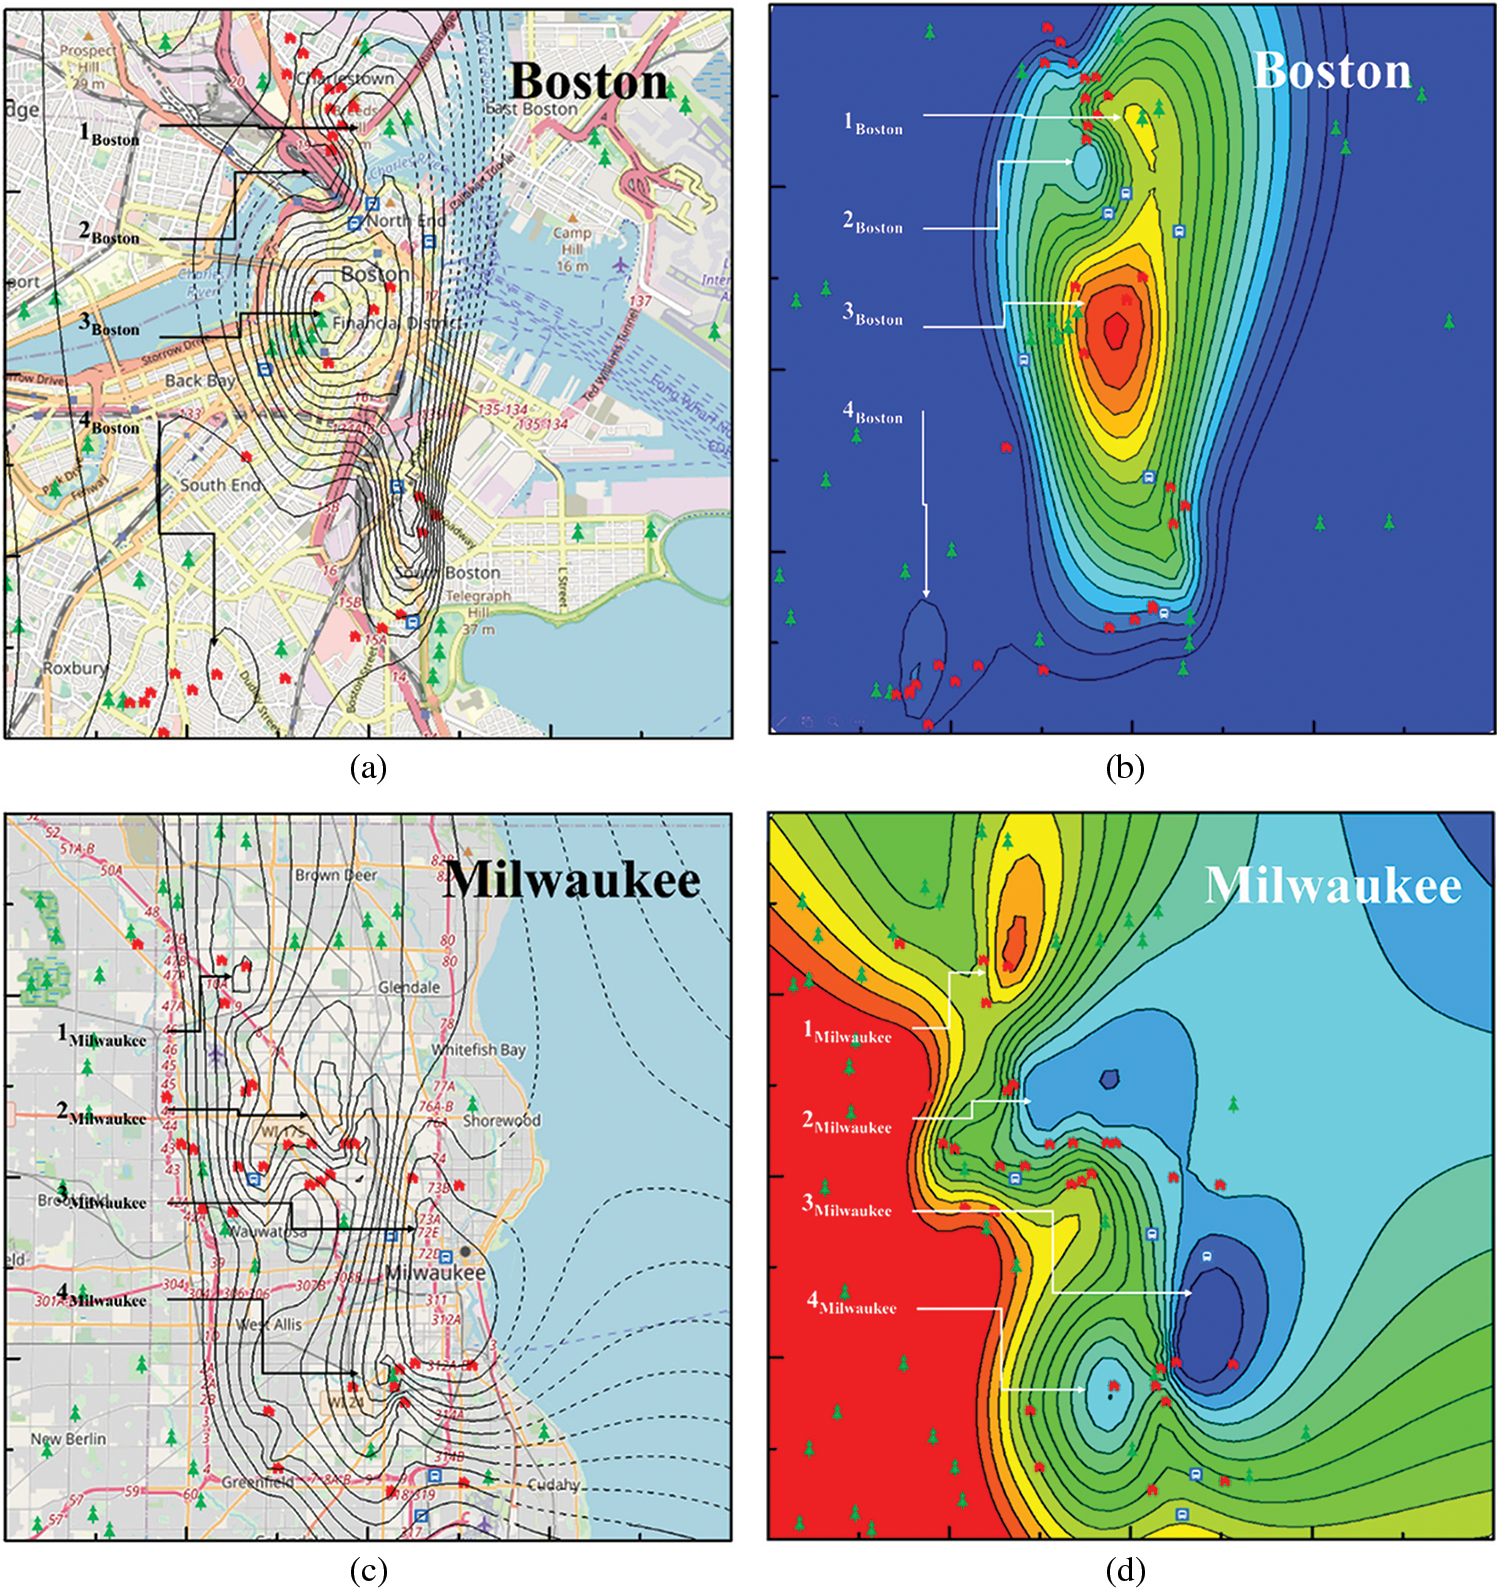
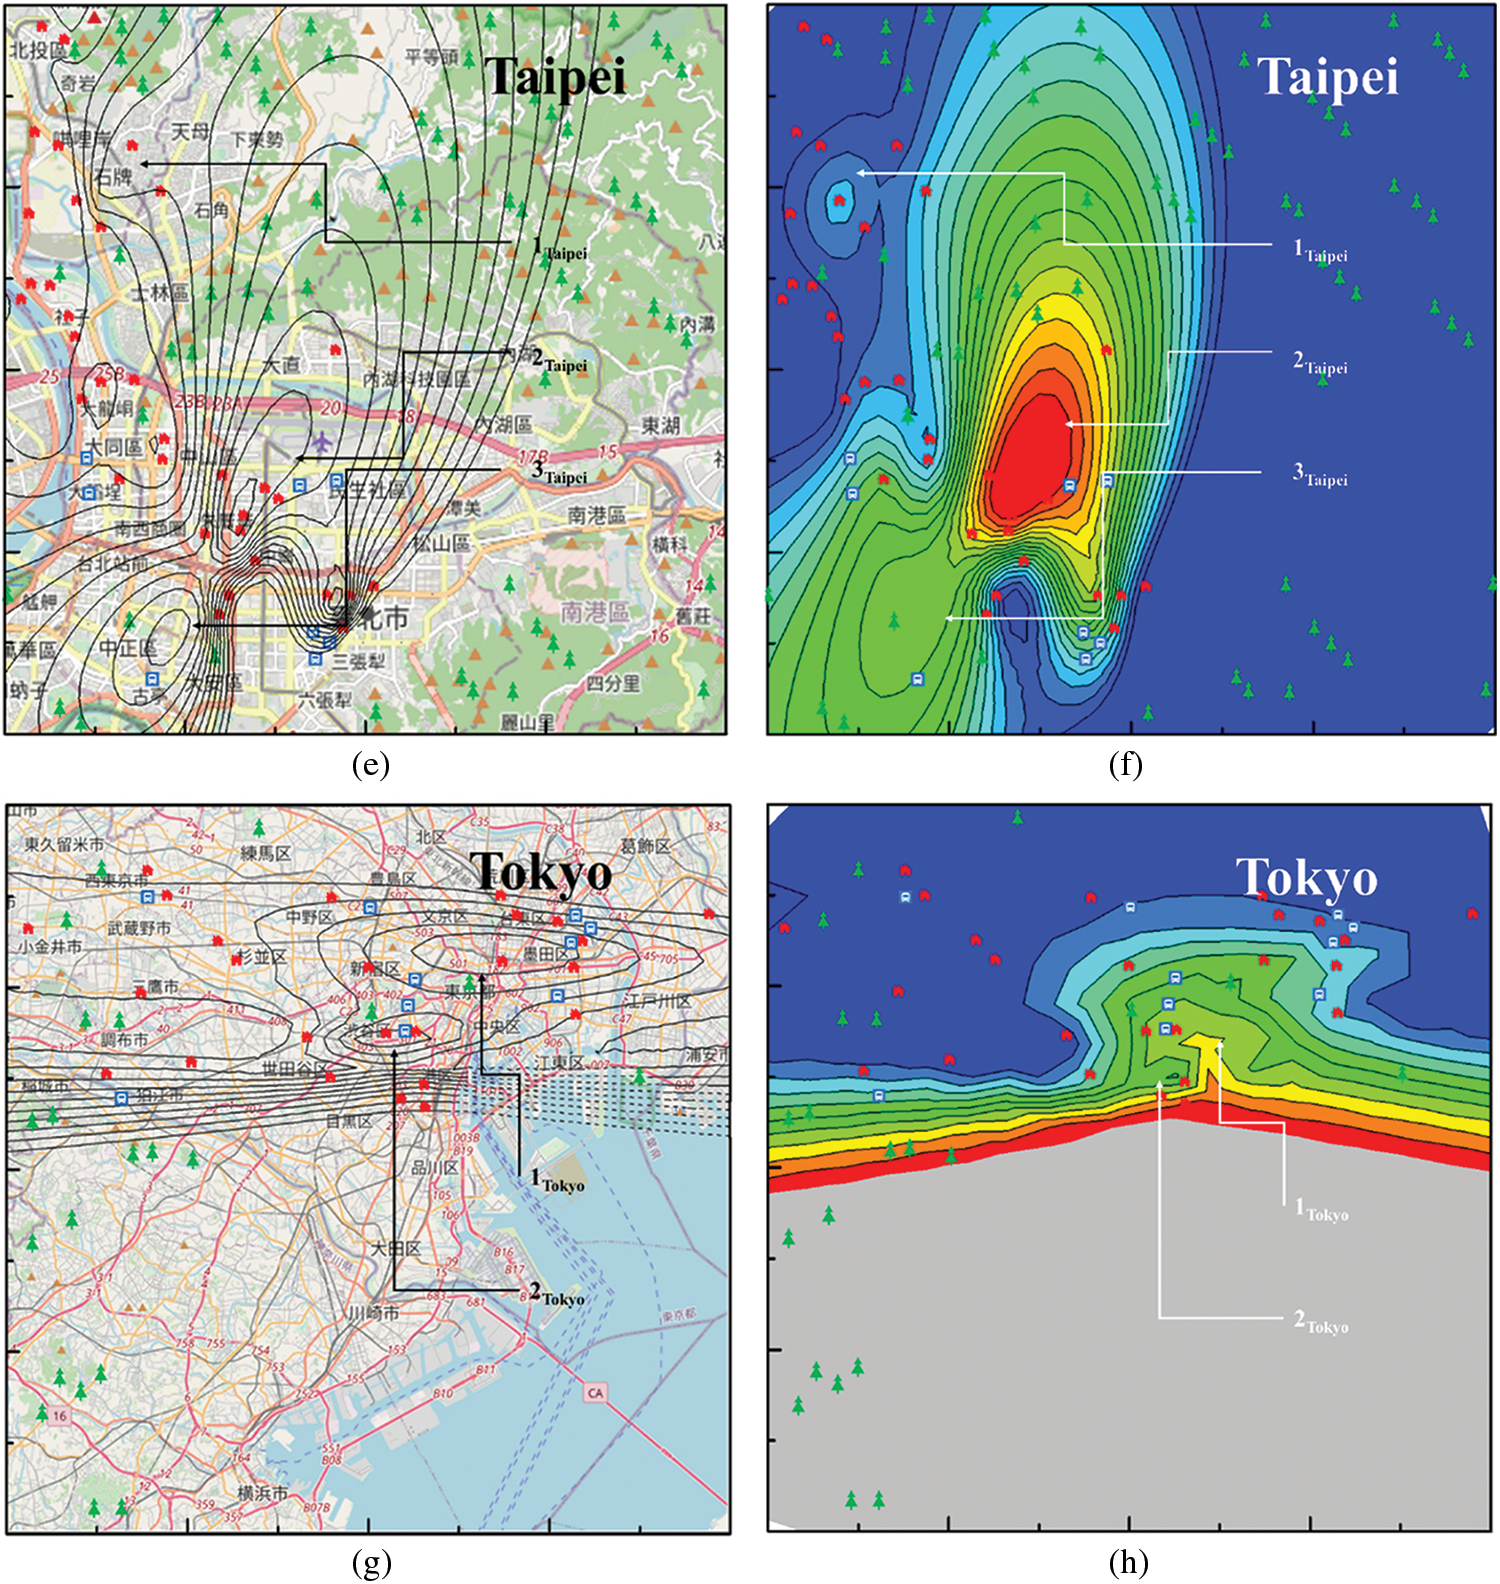
Figure 6: Housing price contour maps taken from USGS national map and online government information for (a) Boston and (c) Milwaukee, respectively. Heat maps of housing prices of the cities of (b) Boston and (d) Milwaukee, (e) Taipei and (g) Tokyo, respectively. Heat maps of housing prices of the cities of (f) Taipei and (h) Tokyo, respectively
Based on the prolongation structure of the Schrödinger equation, the special linear group
Using the Lie symmetry approach, the time-independent invariant solutions of Eq. (13) as
is associated with the so-called housing price wave (HPW) functions under the influence of proximity to public parks and transportation systems can be found [2,88]. Consistent with Shepard’s universal law, the Gaussian patterns of the property price volatilities derived from the rotational invariance group were used to generate maps indicating spatial variation in housing price values with respect to proximity to parks, stations or both. Figs. 6b, 6d, 6f and 6h show spatial variations in housing prices in the cities of Boston, Milwaukee, Tokyo and Taipei, respectively, where warmer colors represent higher value areas and cooler colors represent lower value areas. A comparison of the observed and modelled house prices in Fig. 6 corroborates the approaches employed in the study. The spatial Gaussian dependence of the housing price distributions might be because the perceptual exponential scaling observations based on the multidimensional scaling descriptions were a squared Euclidean distance over the underlying dimensions [39]. A more detailed discussion of the spatial spill over phenomena of house prices associated with the HPW has already been published [2]. The spatially heterogeneous response of housing prices to perceptual infrastructure-related stimuli exhibits a profound effect on the real estate market. Elucidation of the intrinsic invariant characteristics of housing prices in the field of economics is clearly an interesting topic and certainly warrants further study. Symmetry has been, without doubt, one of the most fundamental and fruitful concepts in our attempts to decipher the inner workings of economic related fluctuation and activities. Indeed, it is believed that there is a way to explore the equivalence between the symmetry operation and the scale invariance of positive and negative effects on housing prices. Furthermore, Industry 5.0-related economic models that fuse psychological perception, geometry and physics reveal new phenomena related to the combination of several functions in a single subject, making economic development processes more sustainable in the future.
In this study, we aimed to provide empirical evidence on the invariant metrics of property price volatilities originating from parks and transportation for the statistical data of Boston, Milwaukee, Tokyo and Taipei, respectively. Geographic features and transaction prices were pulled from USGS and publicly available government information, respectively. Statistical comparison is made of the values, MAE, MSE and RMSE obtained by HPM. The invariance analysis of the GCD approach developed herein was successfully used to provide insight into the symmetric characteristics of location-dependent housing price information from heterogeneous data sources. Transaction prices, park area percentages and direct distances to the nearest metro stations were plotted for these four cities, and the invariant characteristics were intrinsically visualized. The results reveal that the GCD model particularly plays a role in house price volatility on the global scale. The extracted scaling exponent ratio between park area percentages and distances to the nearest metro stations was found to be approximately 3/2. Due to the Stevens’s power law, the perceived stimuli were embedded in real estate price fluctuations. The perceptual dimensions defined in the MIT Place Pulse dataset were used to elucidate the hidden property-feature spaces associated with public parks and transportation systems which could be characterized as three-dimensional and two-dimensional conceptual spaces, respectively. Furthermore, reflecting that human perception is the semidirect product of the three-dimensional translation group
Acknowledgement: The authors would like to express their appreciation for the support of the staffs of Group of Abel and Lie Operations in Sciences (GALOIS) in Quantum Electro-Optical Science and Technology (QUEST) Laboratory, Graduate Institute of Electro-Optical Engineering and Department of Electronic Engineering, Chang Gung University, Taiwan.
Author Contributions: Conceived and designed the experiments, C.W.L., J.A.J. and T.E.N.; performed the experiments, C.W.L., J.C.W., B.Y.Z. and T.E.N.; data analysis, C.W.L., J.C.W., J.A.J. and T.E.N.; contributed reagents/materials/analysis tools, C.W.L., B.Y.Z., Y.F.W., S.W.L. and T.E.N.; wrote the paper, C.W.L. and T.E.N.
Funding Statement: The authors received no specific funding for this study.
Conflicts of Interest: The authors declare that they have no conflicts of interest to report regarding the present study.
References
1. Schwichtenberg, J. (2019). Physics from finance: A gentle introduction to gauge theories, fundamental interactions and fiber bundles, pp. 20–30. USA: No-Nonsense Books. [Google Scholar]
2. Lin, C. W., Wang, J. C., Zhong, B. Y., Jiang, J. A., Wu, Y. F. et al. (2021). Lie symmetry analysis of the effects of urban infrastructures on residential property values. PLoS One, 16(8), e0255233. DOI 10.1371/journal.pone.02552. [Google Scholar] [CrossRef]
3. Oni-Jimoh, T., Liyanage, C., Oyebanji, A., Gerges, M. (2018). Urbanization and meeting the need for affordable housing in Nigeria. In: Housing, vol. 7, no. 3, pp. 73--91. Amjad Almusaed and Asaad Almssad, London: IntechOpen. DOI 10.5772/intechopen.78576. [Google Scholar] [CrossRef]
4. Kenna, P. (2012). Human rights and housing. International Encyclopedia of Housing and Home, 3, 703–708. [Google Scholar]
5. Hochstenbach, C., Arundel, R. (2020). Spatial housing market polarisation: National and urban dynamics of diverging house values. Transactions of the Institute of British Geographers, 45(2), 464–482. DOI 10.1111/tran.12346. [Google Scholar] [CrossRef]
6. Fort, H. (2020). Ecological modelling and ecophysics. UK: IOP Publishing. [Google Scholar]
7. Nastasiuk, V. A. (2014). Emergent quantum mechanics of finances. Physica A: Statistical Mechanics and its Applications, 403, 148–154. DOI 10.1016/j.physa.2014.02.037. [Google Scholar] [CrossRef]
8. Stevens, S. S. (1946). On the theory of scales of measurement. Science, 103, 677–680. DOI 10.1126/science.103.2684.677. [Google Scholar] [CrossRef]
9. Stevens, S. S. (1957). On the psychophysical law. Psychological Review, 64(3), 153–181. DOI 10.1037/h0046162. [Google Scholar] [CrossRef]
10. Sato, R., Ramachandran, R. V. (2014). Symmetry and economic invariance. Tokyo: Springer. [Google Scholar]
11. Kalapala, V., Sanwalani, V., Clauset, A., Moore, C. (2006). Scale invariance in road networks. Physical Review E, 73(2). DOI 10.1103/PhysRevE.73.026130. [Google Scholar] [CrossRef]
12. Chau, K. W., Yiu, E. C. Y., Wong, S. K., Lai, L. W. C. (2002). Hedonic price modelling of environmental attributes: A review of the literature and a Hong Kong case study. Welfare Economics and Sustainable Development, 2, 223–247. [Google Scholar]
13. Lai, L. W. C., Lam, G., Chau, K. W., Hung, C., Wong, S. K. et al. (2009). Statutory zoning and the environment: A Hong Kong empirical analysis of the direct effect of zoning on the environment and the potential contribution of planning conditions to sustainable development. Property Management, 27(4), 242–266. DOI 10.1108/02637470910980004. [Google Scholar] [CrossRef]
14. Saphores, J. D., Li, W. (2012). Estimating the value of urban green areas: A hedonic pricing analysis of the single family housing market in Los Angeles, CA. Landscape and Urban Planning, 104(3–4), 373–387. DOI 10.1016/j.landurbplan.2011.11.012. [Google Scholar] [CrossRef]
15. So, H. M., Tse, R. Y., Ganesan, S. (1997). Estimating the influence of transport on house prices: Evidence from Hong Kong. Journal of Property Valuation and Investment, 15(1), 40–47. DOI 10.1108/14635789710163793. [Google Scholar] [CrossRef]
16. Mikelbank, B. A. (2005). Be careful what you wish for: The house price impact of investments in transportation infrastructure. Urban Affairs Review, 41(1), 20–46. DOI 10.1177/1078087405278444. [Google Scholar] [CrossRef]
17. Panduro, T. E., Veie, K. L. (2013). Classification and valuation of urban green spaces--A hedonic house price valuation. Landscape and Urban Planning, 120, 119–128. DOI 10.1016/j.landurbplan.2013.08.009. [Google Scholar] [CrossRef]
18. Seo, K., Golub, A., Kuby, M. (2014). Combined impacts of highways and light rail transit on residential property values: A spatial hedonic price model for phoenix, Arizona. Journal of Transport Geography, 41, 53–62. DOI 10.1016/j.jtrangeo.2014.08.003. [Google Scholar] [CrossRef]
19. Selim, H. (2009). Determinants of house prices in Turkey: Hedonic regression versus artificial neural network. Expert Systems with Applications, 36(2), 2843–2852. DOI 10.1016/j.eswa.2008.01.044. [Google Scholar] [CrossRef]
20. Zou, Y., Zhang, S., Min, Y. (2019). Exploring urban population forecasting and spatial distribution modeling with artificial intelligence technology. Computer Modeling in Engineering & Sciences, 119(2), 295–310. DOI 10.32604/cmes.2019.03873. [Google Scholar] [CrossRef]
21. Heyman, A. V., Sommervoll, D. E. (2019). House prices and relative location. Cities, 95, 1–14. DOI 10.1016/j.cities.2019.06.004. [Google Scholar] [CrossRef]
22. Faraway, J. J. (2014). Regression for non-Euclidean data using distance matrices. Journal of Applied Statistics, 41(11), 2342–2357. DOI 10.1080/02664763.2014.909794. [Google Scholar] [CrossRef]
23. Li, R. Y. M., Chau, K. W. (2016). Econometric analyses of international housing markets. USA: Routledge. [Google Scholar]
24. Chau, K. W., Chin, T. (2003). A critical review of literature on the hedonic price model. International Journal for Housing Science and Its Applications, 27(2), 145–165. [Google Scholar]
25. Li, M. M., Brown, H. J. (1980). Micro-neighborhood externalities and hedonic housing prices. Land Economics, 56(2), 125–141. DOI 10.2307/3145857. [Google Scholar] [CrossRef]
26. Embaye, W. T., Zereyesus, Y. A., Chen, B. (2021). Predicting the rental value of houses in household surveys in Tanzania, Uganda and Malawi: Evaluations of hedonic pricing and machine learning approaches. PLoS One, 16(2), e0244953. DOI 10.1371/journal.pone.0244953. [Google Scholar] [CrossRef]
27. Vîlcu, G. E. (2011). A geometric perspective on the generalized Cobb–Douglas production functions. Applied Mathematics Letters, 24(5), 777–783. DOI 10.1016/j.aml.2010.12.038. [Google Scholar] [CrossRef]
28. Lobo, J., Bettencourt, L. M., Strumsky, D., West, G. B. (2013). Urban scaling and the production function for cities. PLoS One, 8(3), e58407. DOI 10.1371/journal.pone.0058407. [Google Scholar] [CrossRef]
29. Combes, P. P., Duranton, G., Gobillon, L. (2021). The production function for housing: Evidence from France. Journal of Political Economy, 129(10), 1–34. DOI 10.1086/715076. [Google Scholar] [CrossRef]
30. Wen, H. Z., Jia, S. H., Guo, J., Y, H. (2005). Hedonic price analysis of urban housing: An empirical research on Hangzhou. Journal of Zhejiang University-Science A, 6(8), 907–914. DOI 10.1631/jzus.2005.A0907. [Google Scholar] [CrossRef]
31. Heyman, A. V., Law, S., Berghauser Pont, M. (2019). How is location measured in housing valuation? A systematic review of accessibility specifications in hedonic price models. Urban Science, 3(1), 1–14. DOI 10.3390/urbansci3010003. [Google Scholar] [CrossRef]
32. Baranzini, A., Schaerer, C., Thalmann, P. (2010). Using measured instead of perceived noise in hedonic models. Transportation Research Part D: Transport and Environment, 15(8), 473–482. DOI 10.1016/j.trd.2010.06.002. [Google Scholar] [CrossRef]
33. Li, S. P., Will, B. F. (2005). A fuzzy logic system for visual evaluation. Environment and Planning B: Urban Analytics and City Science, 32(2), 293–304. DOI 10.1068/b31155. [Google Scholar] [CrossRef]
34. MacKay, D. M. (1963). Psychophysics of perceived intensity: A theoretical basis for Fechner’s and Stevens’ laws. Science, 139(3560), 1213–1216. DOI 10.1126/science.139.3560.1213-a. [Google Scholar] [CrossRef]
35. Chen, L., Bo, K., Lee, F., Chen, Q. (2020). Advanced feature fusion algorithm based on multiple convolutional neural network for scene recognition. Computer Modeling in Engineering & Sciences, 122(2), 505–523. DOI 10.32604/cmes.2020.08425. [Google Scholar] [CrossRef]
36. Shepard, R. N. (1987). Toward a universal law of generalization for psychological science. Science, 237(4820), 1317–1323. DOI 10.1126/science.3629243. [Google Scholar] [CrossRef]
37. Gärdenfors, P. (2004). Conceptual spaces: The geometry of thought. London, England: MIT Press. [Google Scholar]
38. Balkenius, C., Gärdenfors, P. (2016). Spaces in the brain: From neurons to meanings. Frontiers in Psychology, 7, 1–12. DOI 10.3389/fpsyg.2016.01820. [Google Scholar] [CrossRef]
39. Ennis, D. M., Shepard, R. N. (1988). Toward a universal law of generalization. Science, 242(4880), 944–945. DOI 10.1126/science.3187534. [Google Scholar] [CrossRef]
40. Dubey, A., Naik, N., Parikh, D., Raskar, R., Hidalgo, C. A. (2016). Deep learning the city: Quantifying urban perception at a global scale. 14th European Conference on Computer Vision, pp. 196–212. Amsterdam. [Google Scholar]
41. Ji, H., Qing, L., Han, L., Wang, Z., Cheng, Y. et al. (2021). A new data-enabled intelligence framework for evaluating urban space perception. International Journal of Geo-Information, 10(6), 401–432. DOI 10.3390/ijgi10060400. [Google Scholar] [CrossRef]
42. Hoffman, W. (1966). The lie algebra of visual perception. Journal of Mathematical Psychology, 3(1), 65–68. DOI 10.1016/0022-2496(66)90005-8. [Google Scholar] [CrossRef]
43. Shepard, R. N. (2001). Perceptual-cognitive universals as reflections of the world. Behavioral and Brain Sciences, 24(4), 581–601. DOI 10.1017/S0140525X01000012. [Google Scholar] [CrossRef]
44. Javaid, S., Aziz, A., Aziz, T. (2022). Algebraic solutions for pricing American put options under the constant elasticity of variance (CEV) model: Application of the Lie group approach. Journal of Computational Science, 62, 1–7. DOI 10.1016/j.jocs.2022.101680. [Google Scholar] [CrossRef]
45. Lang, S. (2012). Algebra. USA: Springer Science & Business Media. [Google Scholar]
46. Wallach, N. R., Goodman, R. (2009). Wallach symmetry, representations, and invariants. USA: Springer. [Google Scholar]
47. Frank, S. A. (2018). Measurement invariance explains the universal law of generalization for psychological perception. Proceedings of the National Academy of Sciences, 115(39), 9803–9806. DOI 10.1073/pnas.1809787115. [Google Scholar] [CrossRef]
48. Frank, S. A. (2016). Common probability patterns arise from simple invariances. Entropy, 18(5), 1–22. DOI 10.3390/e18050192. [Google Scholar] [CrossRef]
49. Sims, C. R. (2018). Efficient coding explains the universal law of generalization in human perception. Science, 360(6389), 652–656. DOI 10.1126/science.aaq1118. [Google Scholar] [CrossRef]
50. Mayor, K., Lyons, S., Duffy, D., Tol, R. S. (2009). A hedonic analysis of the value of parks and green spaces in the Dublin area. ESRI Working Paper No. 331. Dublin: The Economic and Social Research Institute (ESRI). [Google Scholar]
51. Ercan, I., Demirtas, H. (2015). Diagnostics for hedonic models using an example for cars (Hedonic regression). Biometrics & Biostatistics International Journal, 2(1), 23–37. DOI 10.15406/bbij.2015.02.00022. [Google Scholar] [CrossRef]
52. Rueden, C., Eliceiri, K. (2019). ImageJ for the next generation of scientific image data. Microscopy and Microanalysis, 25(S2), 142–143. DOI 10.1017/S1431927619001442. [Google Scholar] [CrossRef]
53. Analyze Boston mayor Michelle Wu API documentation analytics Team Do IT (2019). Analyze Boston. https://data.boston.gov/dataset/property-assessment. [Google Scholar]
54. City of Milwaukee open data portal API documentation mayor Cavalier Johnson common council departments (2019). Milwaukee open data. https://data.milwaukee.gov/dataset/property-sales-data. [Google Scholar]
55. Department of Land Administration M. O. I. (2020). Real estate transaction information system for ministry of the interior R.O.C. (Taiwan). https://plvr.land.moi.gov.tw/DownloadOpenData. [Google Scholar]
56. Japan, M. L. I. T. (2019). Real estate transaction price information search system for MLIT Japan. https://www.land.mlit.go.jp/webland/download.html?fbclid=IwAR2CgBSIpJSup4SHcctIn0xP1UCtRoIz9https://XBLRnDlL_gE34QWxebrU_9BWxs. [Google Scholar]
57. Cobb, C. W., Douglas, P. H. (1928). A theory of production. The American Economic Review, 18(1), 139–165. [Google Scholar]
58. Epple, D., Gordon, B., Sieg, H. (2010). A new approach to estimating the production function for housing. American Economic Review, 100(3), 905–924. DOI 10.1257/aer.100.3.905. [Google Scholar] [CrossRef]
59. Niitamo, O. (1958). The development of productivity in Finnish industry 1925–1952’. Productivity Measurement Review, 15, 1–12. [Google Scholar]
60. Solow, R. M. (1957). Technical change and the aggregate production function. The Review of Economics and Statistics, 39(3), 312–320. DOI 10.2307/1926047. [Google Scholar] [CrossRef]
61. Tinbergen, J. (2004). Econometrics. London: Taylor & Francis, Ltd. DOI 10.4324/9780203486610. [Google Scholar] [CrossRef]
62. Baiocchi, G. (2012). On dimensions of ecological economics. Ecological Economics, 75, 1–9. DOI 10.1016/j.ecolecon.2012.01.016. [Google Scholar] [CrossRef]
63. Gabaix, X. (2009). Power laws in economics and finance. Annual Review of Economics, 1(1), 255–294. DOI 10.1146/annurev.economics.050708.142940. [Google Scholar] [CrossRef]
64. Harrison, D., Rubinfeld, D. L. (1978). Boston housing dataset. https://www.cs.toronto.edu/~delve/data/https://boston/bostonDetail.html. [Google Scholar]
65. Benoit, K. (2011). Linear regression models with logarithmic transformations. https://links.sharezomics.com/assets/uploads/files/1600247928973-from_slack_logmodels2.pdf. [Google Scholar]
66. Ho, W. K., Tang, B. S., Wong, S. W. (2021). Predicting property prices with machine learning algorithms. Journal of Property Research, 38(1), 48–70. DOI 10.1080/09599916.2020.1832558. [Google Scholar] [CrossRef]
67. Black, K. J. (2018). Wide open spaces: Estimating the willingness to pay for adjacent preserved open space. Regional Science and Urban Economics, 71, 110–121. DOI 10.1016/j.regsciurbeco.2018.06.001. [Google Scholar] [CrossRef]
68. Irwin, E. G. (2002). The effects of open space on residential property values. Land Economics, 78, 465–480. DOI 10.2307/3146847. [Google Scholar] [CrossRef]
69. Lang, C. (2018). Assessing the efficiency of local open space provision. Journal of Public Economics, 158, 12–24. DOI 10.1016/j.jpubeco.2017.12.007. [Google Scholar] [CrossRef]
70. Ye, Y., Xie, H., Fang, J., Jiang, H., Wang, D. (2019). Daily accessed street greenery and housing price: Measuring economic performance of human-scale streetscapes via new urban data. Sustainability, 11(6), 1741. DOI 10.3390/su11061741. [Google Scholar] [CrossRef]
71. Wu, C., Ye, X., Ren, F., Wan, Y., Ning, P. et al. (2016). Spatial and social media data analytics of housing prices in Shenzhen, China. PLoS One, 11(10), e0164553. DOI 10.1371/journal.pone.0164553. [Google Scholar] [CrossRef]
72. Hou, R. (2018). Research on the application of consumer psychology theory in real estate marketing. 2018 International Conference on Economics. Business, Management and Corporate Social Responsibility (EBMCSR 2018), pp. 135–140. Zhuhai, Guangdong, China. DOI 10.2991/ebmcsr-18.2018.26. [Google Scholar] [CrossRef]
73. Riccioli, F., Fratini, R., Boncinelli, F. (2021). The impacts in real estate of landscape values: Evidence from Tuscany (Italy). Sustainability, 13(4), 2236. DOI 10.3390/su13042236. [Google Scholar] [CrossRef]
74. Alqadhi, S., Mallick, J., Talukdar, S., Bindajam, A. A., Shohan, A. A. A. et al. (2021). Quantification of urban sprawl for past-to-future in Abha City, Saudi Arabia. Computer Modeling in Engineering & Sciences, 129(2), 755–786. DOI 10.32604/cmes.2021.016640. [Google Scholar] [CrossRef]
75. Crosby, H., Damoulas, T., Caton, A., Davis, P., de Albuquerque, J. P. et al. (2018). Road distance and travel time for an improved house price kriging predictor. Geo-Spatial Information Science, 21(3), 185–194. DOI 10.1080/10095020.2018.1503775. [Google Scholar] [CrossRef]
76. Carlton, E. H., Shepard, R. N. (1990). Psychologically simple motions as geodesic paths I. Asymmetric objects. Journal of Mathematical Psychology, 34(2), 127–188. DOI 10.1016/0022-2496(90)90001-P. [Google Scholar] [CrossRef]
77. Eagleson, R. (1990). Harmonic analysis for the affine group of visual motion. Proceedings of 5th IEEE International Symposium on Intelligent Control 1990, Philadelphia, PA, USA, IEEE. [Google Scholar]
78. Tian, S. F. (2020). Lie symmetry analysis, conservation laws and solitary wave solutions to a fourth-order nonlinear generalized boussinesq water wave equation. Applied Mathematics Letters, 100, 106056. DOI 10.1016/j.aml.2019.106056. [Google Scholar] [CrossRef]
79. Feng, L. L., Tian, S. F., Wang, X. B., Zhang, T. T. (2016). Lie symmetry analysis, conservation laws and exact power series solutions for time-fractional Fordy–Gibbons equation. Communications in Theoretical Physics, 66(3), 321–329. DOI 10.1088/0253-6102/66/3/321. [Google Scholar] [CrossRef]
80. Mao, J. J., Tian, S. F., Zhang, T. T., Yan, X. J. (2020). Lie symmetry analysis, conservation laws and analytical solutions for chiral nonlinear Schrödinger equation in (2 + 1)-dimensions. Nonlinear Analysis: Modelling and Control, 25(3), 358–377. DOI 10.15388/namc.2020.25.16653. [Google Scholar] [CrossRef]
81. Qin, C. Y., Tian, S. F., Wang, X. B., Zou, L., Zhang, T. T. (2018). Lie symmetry analysis, conservation laws and analytic solutions of the time fractional Kolmogorov–Petrovskii–Piskunov equation. Chinese Journal of Physics, 56(4), 1734–1742. DOI 10.1016/j.cjph.2018.05.002. [Google Scholar] [CrossRef]
82. Wang, X. B., Tian, S. F. (2018). Lie symmetry analysis, conservation laws and analytical solutions of the time-fractional thin-film equation. Computational and Applied Mathematics, 37(5), 6270–6282. DOI 10.1007/s40314-018-0699-y. [Google Scholar] [CrossRef]
83. Liu, C. S., Chang, C. (2004). Lie group symmetry applied to the computation of convex plasticity constitutive equation. Computer Modeling in Engineering & Sciences, 6(3), 277–294. DOI 10.3970/cmes.2004.006.277. [Google Scholar] [CrossRef]
84. Loukopoulos, V., Bourantas, G. (2014). Solution of two-dimensional linear and nonlinear unsteady Schrödinger equation using “Quantum hydrodynamics” formulation with a MLPG collocation method. Computer Modeling in Engineering & Sciences, 103(1), 49–70. DOI 10.3970/cmes.2014.103.049. [Google Scholar] [CrossRef]
85. Ren, B., Cheng, X. P., Lin, J. (2016). The (2 + 1)-dimensional Konopelchenko–Dubrovsky equation: Nonlocal symmetries and interaction solutions. Nonlinear Dynamics, 86(3), 1855–1862. DOI 10.1007/s11071-016-2998-4. [Google Scholar] [CrossRef]
86. Ren, B. (2017). Symmetry reduction related with nonlocal symmetry for Gardner equation. Communications in Nonlinear Science and Numerical Simulation, 42, 456–463. DOI 10.1016/j.cnsns.2016.06.017. [Google Scholar] [CrossRef]
87. Ren, B., Lin, J. (2020). Soliton molecules, nonlocal symmetry and CRE method of the KdV equation with higher-order corrections. Physica Scripta, 95(7), 075202. DOI 10.1088/1402-4896/ab8d02. [Google Scholar] [CrossRef]
88. Ames, W. F. (1994). CRC handbook of lie group analysis of differential equations: Symmetries exact solutions and conservation laws. Boca Raton, FL, USA: CRC Press. [Google Scholar]
 | This work is licensed under a Creative Commons Attribution 4.0 International License, which permits unrestricted use, distribution, and reproduction in any medium, provided the original work is properly cited. |