| International Journal of Mental Health Promotion |
DOI: 10.32604/ijmhp.2022.020664
ARTICLE
Association between Self-Rated Health and Depressive Symptoms in Rural Chinese Adults: A Cohort Study Based on Propensity Score Matching
1Institute of Population Research, Peking University, Beijing, 100871, China
2Wolfson College, University of Oxford, Oxford, OX2 6UD, UK
3Institute of Biomedical and Environmental Science & Technology, School of Life Sciences, Faculty of Creative Arts, Technologies and Science, University of Bedfordshire, University Square, Luton, LU1 3JU, UK
4School of Life Science, Shanxi University, Taiyuan, 030006, China
5Department of Computer Science and Engineering, School of Sciences, European University Cyprus, Nicosia, Cyprus
*Corresponding Author: Jinlong Lin. Email: jllin@pku.edu.cn
Received: 06 December 2021; Accepted: 17 January 2022
Abstract: Health status is widely regarded as a correlate of depressive symptoms. However, health assessments based on clinical diagnosis in rural areas with poor medical conditions are very limited. Self-rated health (SRH) serves as a simple and convenient evaluation indicator, which may be used as an independent predictor of depressive symptoms. To confirm the relationship between SRH and depressive symptoms in rural adults, a longitudinal survey of rural households in China was conducted using the China Family Panel Studies (CFPS) from 2012 to 2016. Propensity score matching and logistic regression analysis were used to explore the association. After data cleansing, 3,127 pairs (6,254 participants) aged 16 and older followed for 4 years were enrolled, of which the average age was (50.02 ± 14.19) years old, and the proportions of male and female were 48.64% and 51.36%, respectively. The incidence rate of depressive symptoms within 4 years was 30.86% (95%CI: 29.24–32.48) in the group with fair or poor SRH, and 21.59% (95%CI: 20.14–23.03) in the group with good SRH. The difference between the two groups was statistically significant (χ2 = 69.51, P < 0.001). The results of univariate unconditional logistic regression analysis showed that there was a correlation between SRH and depressive symptoms in rural adults aged 30 and above (OR = 1.65, 95%CI: 1.46–1.85, P < 0.001). Thus, a simple and practical assessment tool based on SRH and other indicators should be established for early prevention and intervention in rural primary mental health care.
Keywords: rural adults; self-rated health; depressive symptoms; cohort study; propensity score matching
Depression is one of the key research themes in the fields of mental and public health. According to the report Depression and other common mental disorders released by the World Health Organization (WHO) in 2017, more than 300 million people worldwide are now suffering from depression. The average incidence rate is around 4.4%; 2/3 of patients have had thoughts of suicide, over half of the patients have attempted self-harm, less than 7% of them have received regular treatment or have been taking medicine and psychological counseling. It is estimated that by 2030, depression will become the world’s largest disease burden [1]. In developed and developing countries, depression places a heavy burden on families, communities and health services [2]. In China, the lifetime prevalence of depression is 6.9%, and the 12-month prevalence is 3.6% [3], among which rural residents are the high-risk group presenting with depressive symptoms [4]. Data show that the incidence of depression in rural areas is significantly higher than that in urban areas [5,6], as rural residents in China are more likely to be faced with social structural pressures [7,8].
Among many risk factors, studies have confirmed that health conditions, including cancer [9] and chronic diseases [10] including stroke [11], cardiovascular disease [12], and functional impairment [13], are important correlation factors of depressive symptoms. However, it is not easy to take clinically diagnosed health status as an indicator for screening and predicting depressive symptoms in the whole population. There are two reasons for this: firstly, health status has obvious age and gender heterogeneity. The health problems faced by different demographic groups may be different. For example, hypertension, diabetes, coronary heart disease, rheumatism or rheumatoid arthritis, hearing impairment and other health problems occur mainly in older adults [14], while youth groups are mainly threatened by high work pressure, staying up late, and poor living habits [15,16]. The main health problems faced by adult men are cardiovascular disease, stroke and cancer, while adult women face mostly chronic or non-fatal acute diseases [17]. The heterogeneity of these health problems limits investigation of the association between depressive symptoms and health status of the whole population using research. At present, researchers mainly focus on the relationship between health problems and depressive symptoms among older adults [18,19].
Secondly, there is significant urban-rural heterogeneity in health screening in developing countries. The effect of health screening of rural residents is not clear and the disease detection rate is still very low in developing countries, due to limited medical and health resources, low coverage of health services and inadequate health literacy of residents [20,21]. A survey of 7,072 older adults over 60 years in 6 provinces in China found that the non-detection rate of dementia in rural aged residents was 60.7%, significantly higher than the 39.3% in cities and towns [22]. This also illustrates why researchers focus on the association between health problems and depressive symptoms among community residents or inpatients, and less on the association between health problems and depressive symptoms among rural populations [23].
Self-rated health (SRH) is a very simple, effective, and comprehensive index. Many studies show that SRH can reliably predict the actual objective health results, including mortality [24], poor functional ability [25], and other medical outcomes [26]. It can also reflect the individuals’ subjective evaluation of health status and future health expectations, even with those who have not been diagnosed [27]. As a relatively multifaceted subjective perception of health status, SRH has been widely used in health surveys [28]. In order to improve health levels and avoid adverse health consequences it is of great significance to identify SRH status early. In recent times SRH as an indicator has been widely used in rural China surveys. An epidemiological study using SRH in rural Anyang, China, showed that of 2,814 adults aged 25 to 69 who were recruited from rural Anyang in 2014, 36.90% rated their health as poor or fair [29]. Another SRH study based on a sample of 1,002 rural Chinese aged 65 and above showed that 68.66% of participants reported good SRH, and those with poor SRH showed an 87% increase risk of dying within 4 years compared to those with moderate SRH (1.87, 95%CI 1.08–3.24) [30].
Many studies have been conducted to explore the association between SRH and depressive symptoms. One study found that SRH was the main influencing factor of depressive symptoms among older adult patients with chronic diseases in China [31]. Other studies also support the use of SRH as an independent predictor of increased risk of depressive symptoms [32,33], and poor SRH seems to be more closely related to depressive symptoms than chronic diseases [34]. However, considering that SRH is a subjective index and depressive symptoms are on a self-rated scale, their association may be interrelated [26,35]. Therefore, it is necessary to adopt a prospective cohort study design and longitudinal follow-up to observe whether early exposure to SRH has an impact on later mental health status. Regarding the obvious heterogeneity of health literacy of urban and rural residents in developing countries [36], it is necessary to test the association between SRH and depressive symptoms among rural residents in developing countries.
Early screening and intervention will no doubt promote the mental health of rural residents. Taking rural Chinese adults as the study population, this study tested the association between SRH and depressive symptoms.
2.1 Study Population and Data Collection
Our study population was the nationwide population of China Family Panel Studies (CFPS). The CFPS is a longitudinal social survey launched by Peking University, which recruited 25,812 rural Chinese adults using a multi-stage probability sampling method in 2012. Follow-up surveys in this study were conducted in 2016. Health, mental status, socioeconomic status and other demographic factors were obtained by person-to-person computer-assisted interviews using structured questionnaires [37]. No medical ethical issues were involved in the CFPS, and all subjects provided informed consent. After excluding cases with depressive symptoms in the baseline survey in 2012, incomplete information in exposure and outcome, and cases that were lost to the follow-up surveys in 2016, a total of 11,634 cases were selected, including 8,119 cases with good SRH depressive symptoms and 3,515 cases with fair or poor SRH.
Baseline SRH was measured by trained interviewers using a single item of global health rating: “How would you rate your health status?”. As the first question in the SF-36 questionnaire [38], the responses were categorized as five possible choices “excellent”, “very good”, “good”, “fair” and “poor”. The validity and reliability of the five-point Likert scale of SRH have been widely confirmed [39,40]. With reference to similar work [41], this variable was further divided into two categories: “good” (including “excellent”, “very good” or “good”) and “fair or poor” (including “fair” or “poor”) SRH.
The degrees of depressive symptoms were assessed by the Center for Epidemiologic Studies Depression Scale (CES-D). The CES-D is a useful tool developed to screen for depression using a 20-item instrument with each item rating the frequency of events or ideas from 0 (“Almost never, i.e., less than one day during the past week”) to 3 (“Most of the time, i.e., 5–7 d during the past week”). The total score ranges from 0 to 60 and a higher score indicates a greater risk of depression. A total score of 16 or higher indicates a possible depressive disorder [42]. Thus, we used the cutoff score of 16 to divide the study population into two categories: “cases with depressive symptoms” (0–15) and “cases without depressive symptoms” (16–60). Reliability, validity and the factor structure of the CES-D have been tested widely and it has demonstrated good applicability among rural Chinese populations [43].
The potential confounders were categorized as demographic factors, lifestyle risk factors and health-related factors. Demographic factors included the sex (male or female), age group (aged 16–29, 30–44, 45–59, 60 and above), educational level (illiterate/semi-literate, primary school, junior high school and above) and marital status (married, never married, divorced/widowed) of the subjects. Lifestyle risk factors included smoking (yes or no), alcohol use (often or rarely), sleep quality (good or fair/poor), lunch break habit (yes or no) and subjective life satisfaction (satisfied or dissatisfied). Health-related factors included having doctor-diagnosed chronic diseases (yes or no), having hospitalization experience during the past year (yes or no), the person providing care when the subject is sick (immediate family members or others), evaluation of commonly used medical institutions (good or fair/poor), and having medical insurance (yes or no).
Propensity score analysis was used to examine the association between SRH and depressive symptoms. The propensity scores were estimated with a logistic regression model including 14 confounding variables. The distance of propensity score (PS) was specified using the caliper width computation, with greedy nearest neighbor matching. Each treated unit is sequentially matched with the 1 nearest control units and the units must be no more than 0.20 [44]. Observations in each matched set were specified with the same values for gender and age group. Thus, adults with good SRH and adults with fair or poor SRH were matched at a ratio of 1:1 in this cohort study from 2012 to 2016.
The baseline characteristics of the total cohort and PS-matched cohort are presented as numbers and percentages for categorical variables, in which the Chi-square test was applied for comparisons. We calculated the incidence of depressive symptoms within four years for each cohort and the comparative p-value between the two cohorts. The incidence rate was calculated by dividing the cases who reported depressive symptoms during the follow-up by total cases, and negative binomial regression was used to predict for count outcomes. As the exact values of gender and age group was specified in the propensity score matching process, we also calculated the incidence of age-specific population and gender-specific population.
Multivariate logistic regressions were performed to investigate the association between SRH and depressive symptoms after adjusting for sex, age group, educational level, marital status, smoking, alcohol use, sleep quality, lunch break habit, life satisfaction, chronic diseases, hospitalization experience, the person providing care, medical institutions evaluation, and medical insurance at baseline in the total cohort. Univariate unconditional logistic regression analysis was conducted in the PS-matched cohort. All analyses were conducted with SAS software (version 9.4; SAS Institute Inc., Cary, NC USA) and p-value below 0.05 were considered statistically significant.
3.1 Baseline Characteristics of the Study Population
In this study, 11,634 participants were selected, including 8,119 participants with good SRH and 3,515 participants with fair or poor SRH. After propensity score matching, 3,127 participants with good SRH and 3,127 participants with fair or poor SRH were further assigned to subpopulations, with an average age of (50.02 ± 14.19) years. Fig. 1 shows a flow chart of the eligible study population.
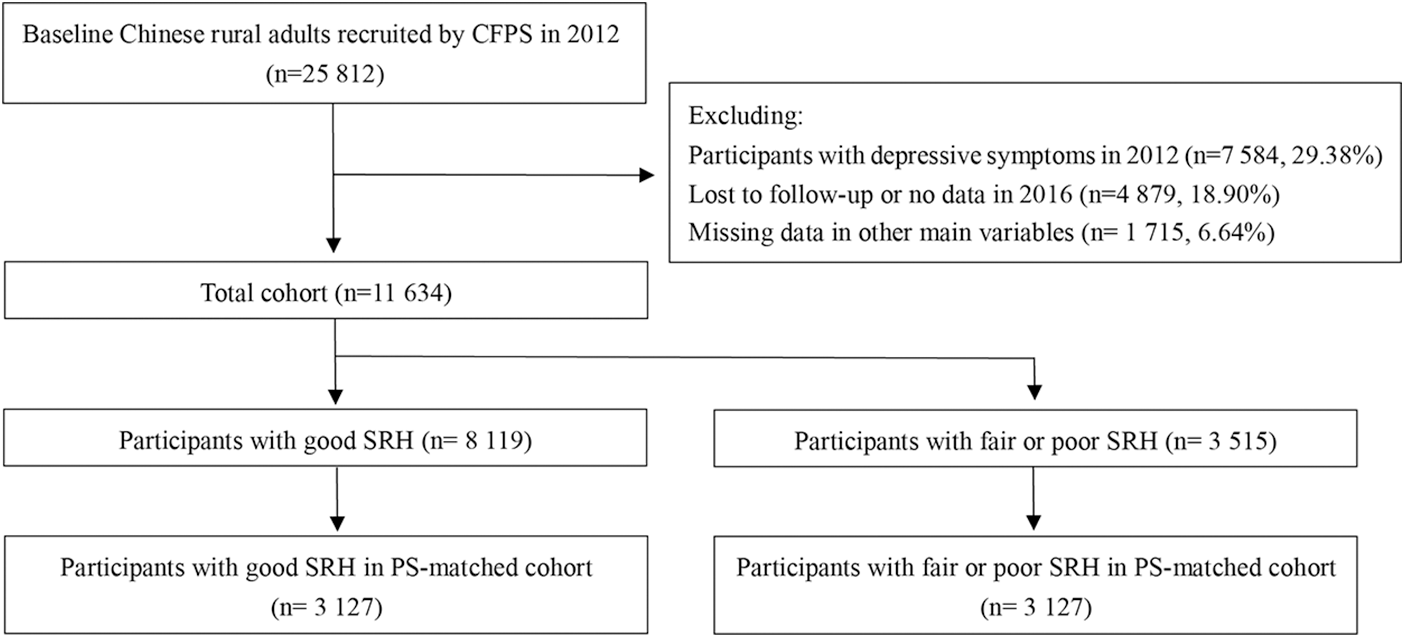
Figure 1: Data-selection process
The baseline characteristics of the total cohort and PS-matched cohort are summarized in Table 1. For the total cohort, 46.51% were male and 53.49% were female among the participants with fair or poor SRH, against 55.12% and 44.88% separately among the participants with good SRH. The proportion of the participants with fair or poor SRH aged below 45 was 31.47%, while that of participants with good SRH was 58.33%. Meanwhile, participants with good SRH were less likely to be illiterate or semi-literate, divorced or widowed. These difference in demographic characteristics were statistically significant, with all p-values less than 0.001.
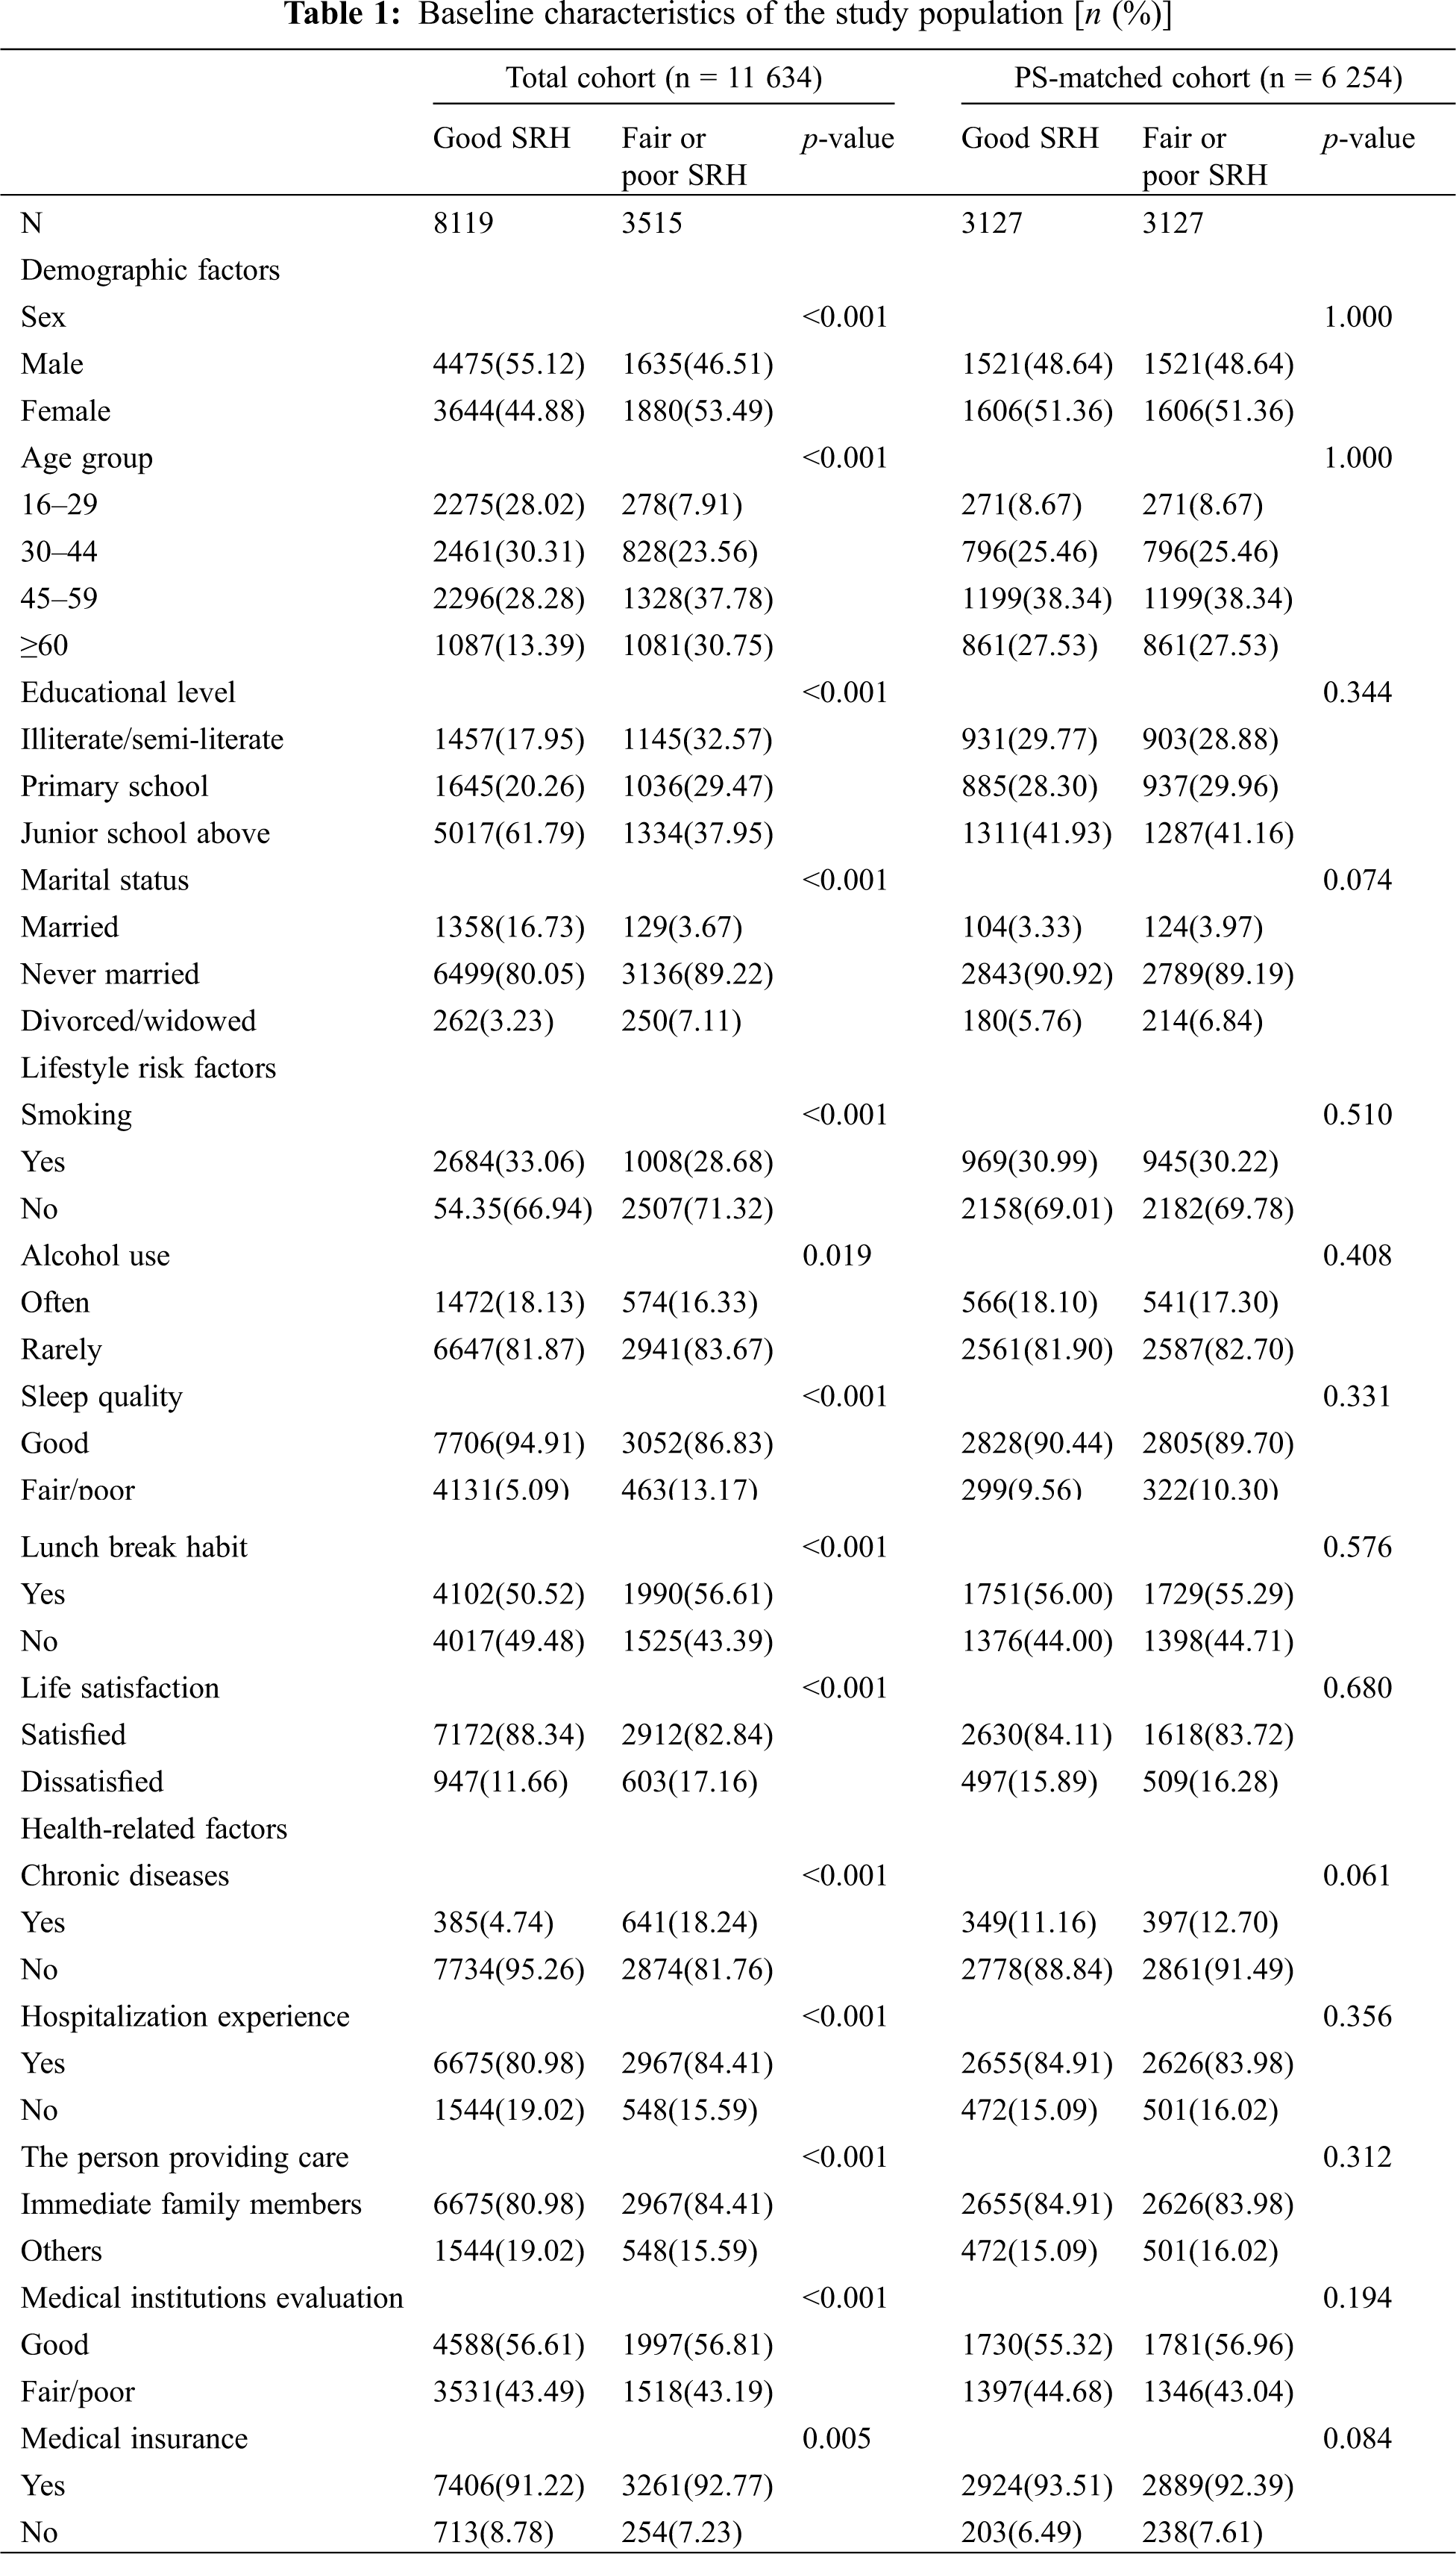
Regarding lifestyle risk factors, participants with good SRH were less likely to smoke, consume alcohol and more likely to have good sleep quality. Meanwhile, a lower proportion of the participants with fair or poor SRH were satisfied with life. Regarding health-related factors, 18.24% of the participants with fair or poor SRH were diagnosed with chronic diseases, against 4.14% among the participants with good SRH in the total cohort. In the population distribution characteristics of hospitalization experience, medical insurance and other variables, differences between the good SRH group and the fair or poor SRH group in the total cohort were also statistically significant.
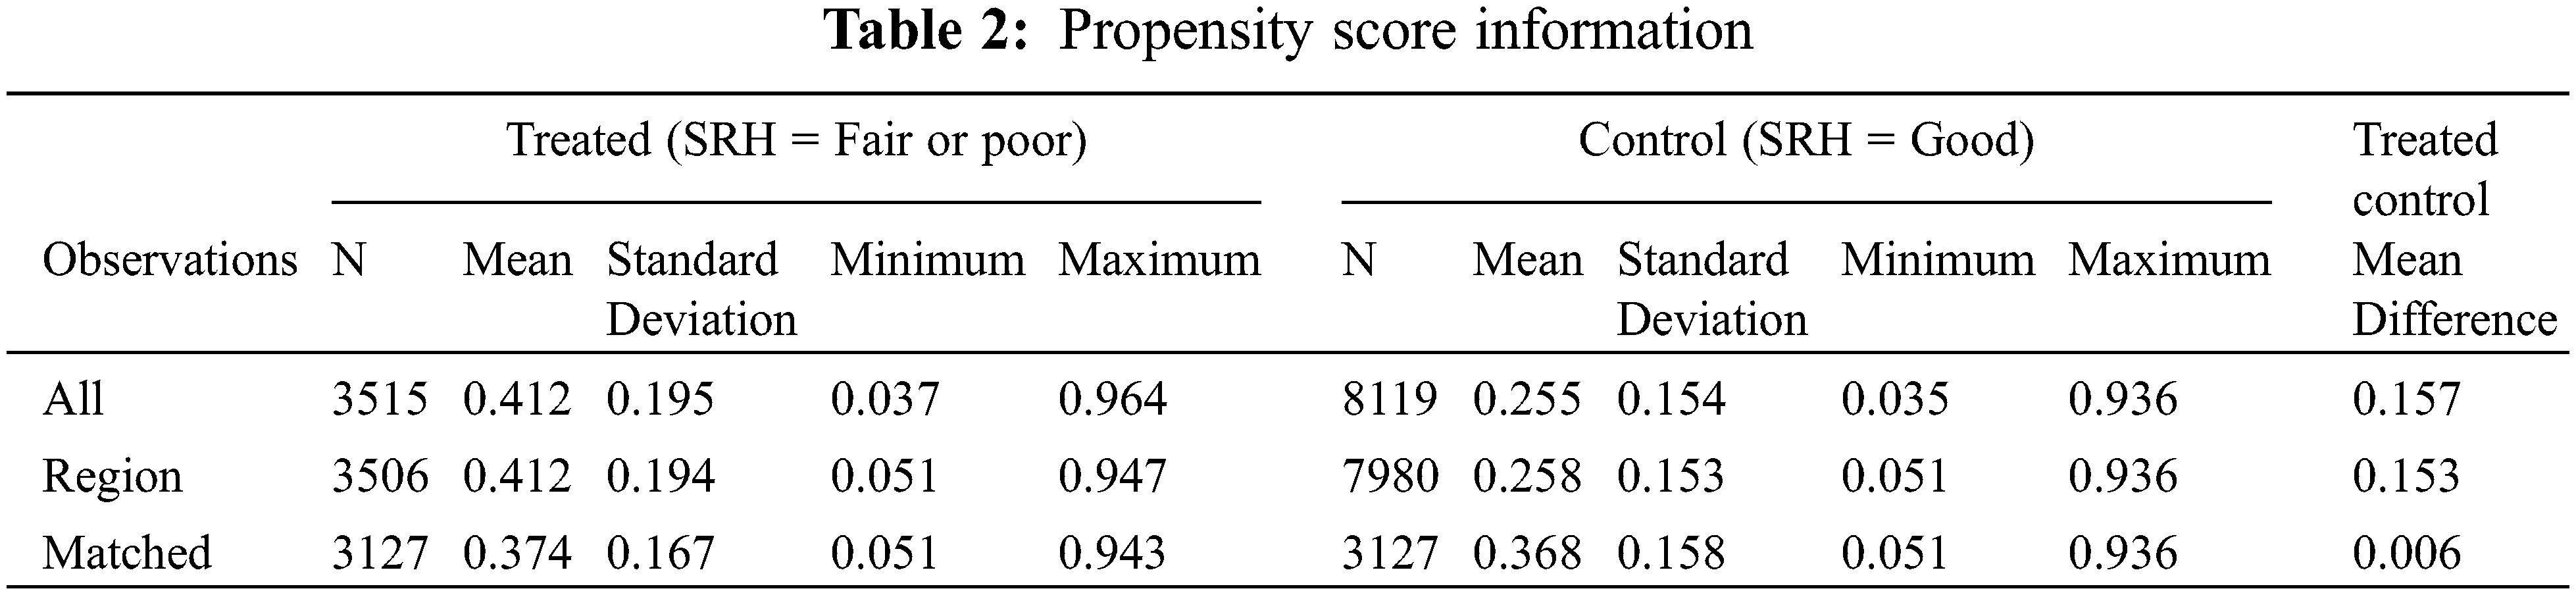
In the PS-matched cohort population, all these differences were harmonized with a good balance between the covariates after the propensity score matching process. As gender and age group were specified in the process, their distribution characteristics were consistent in the sub-cohort (p = 1.00). Table 2 displays summary statistics for PS by treatment group (SRH = Fair or poor) on the basis of all observations (N = 11 634). After the treated control, the mean difference in the matched observations (N = 6 254) dropped to 0.006.
3.2 Incidence Rate of Depressive Symptoms
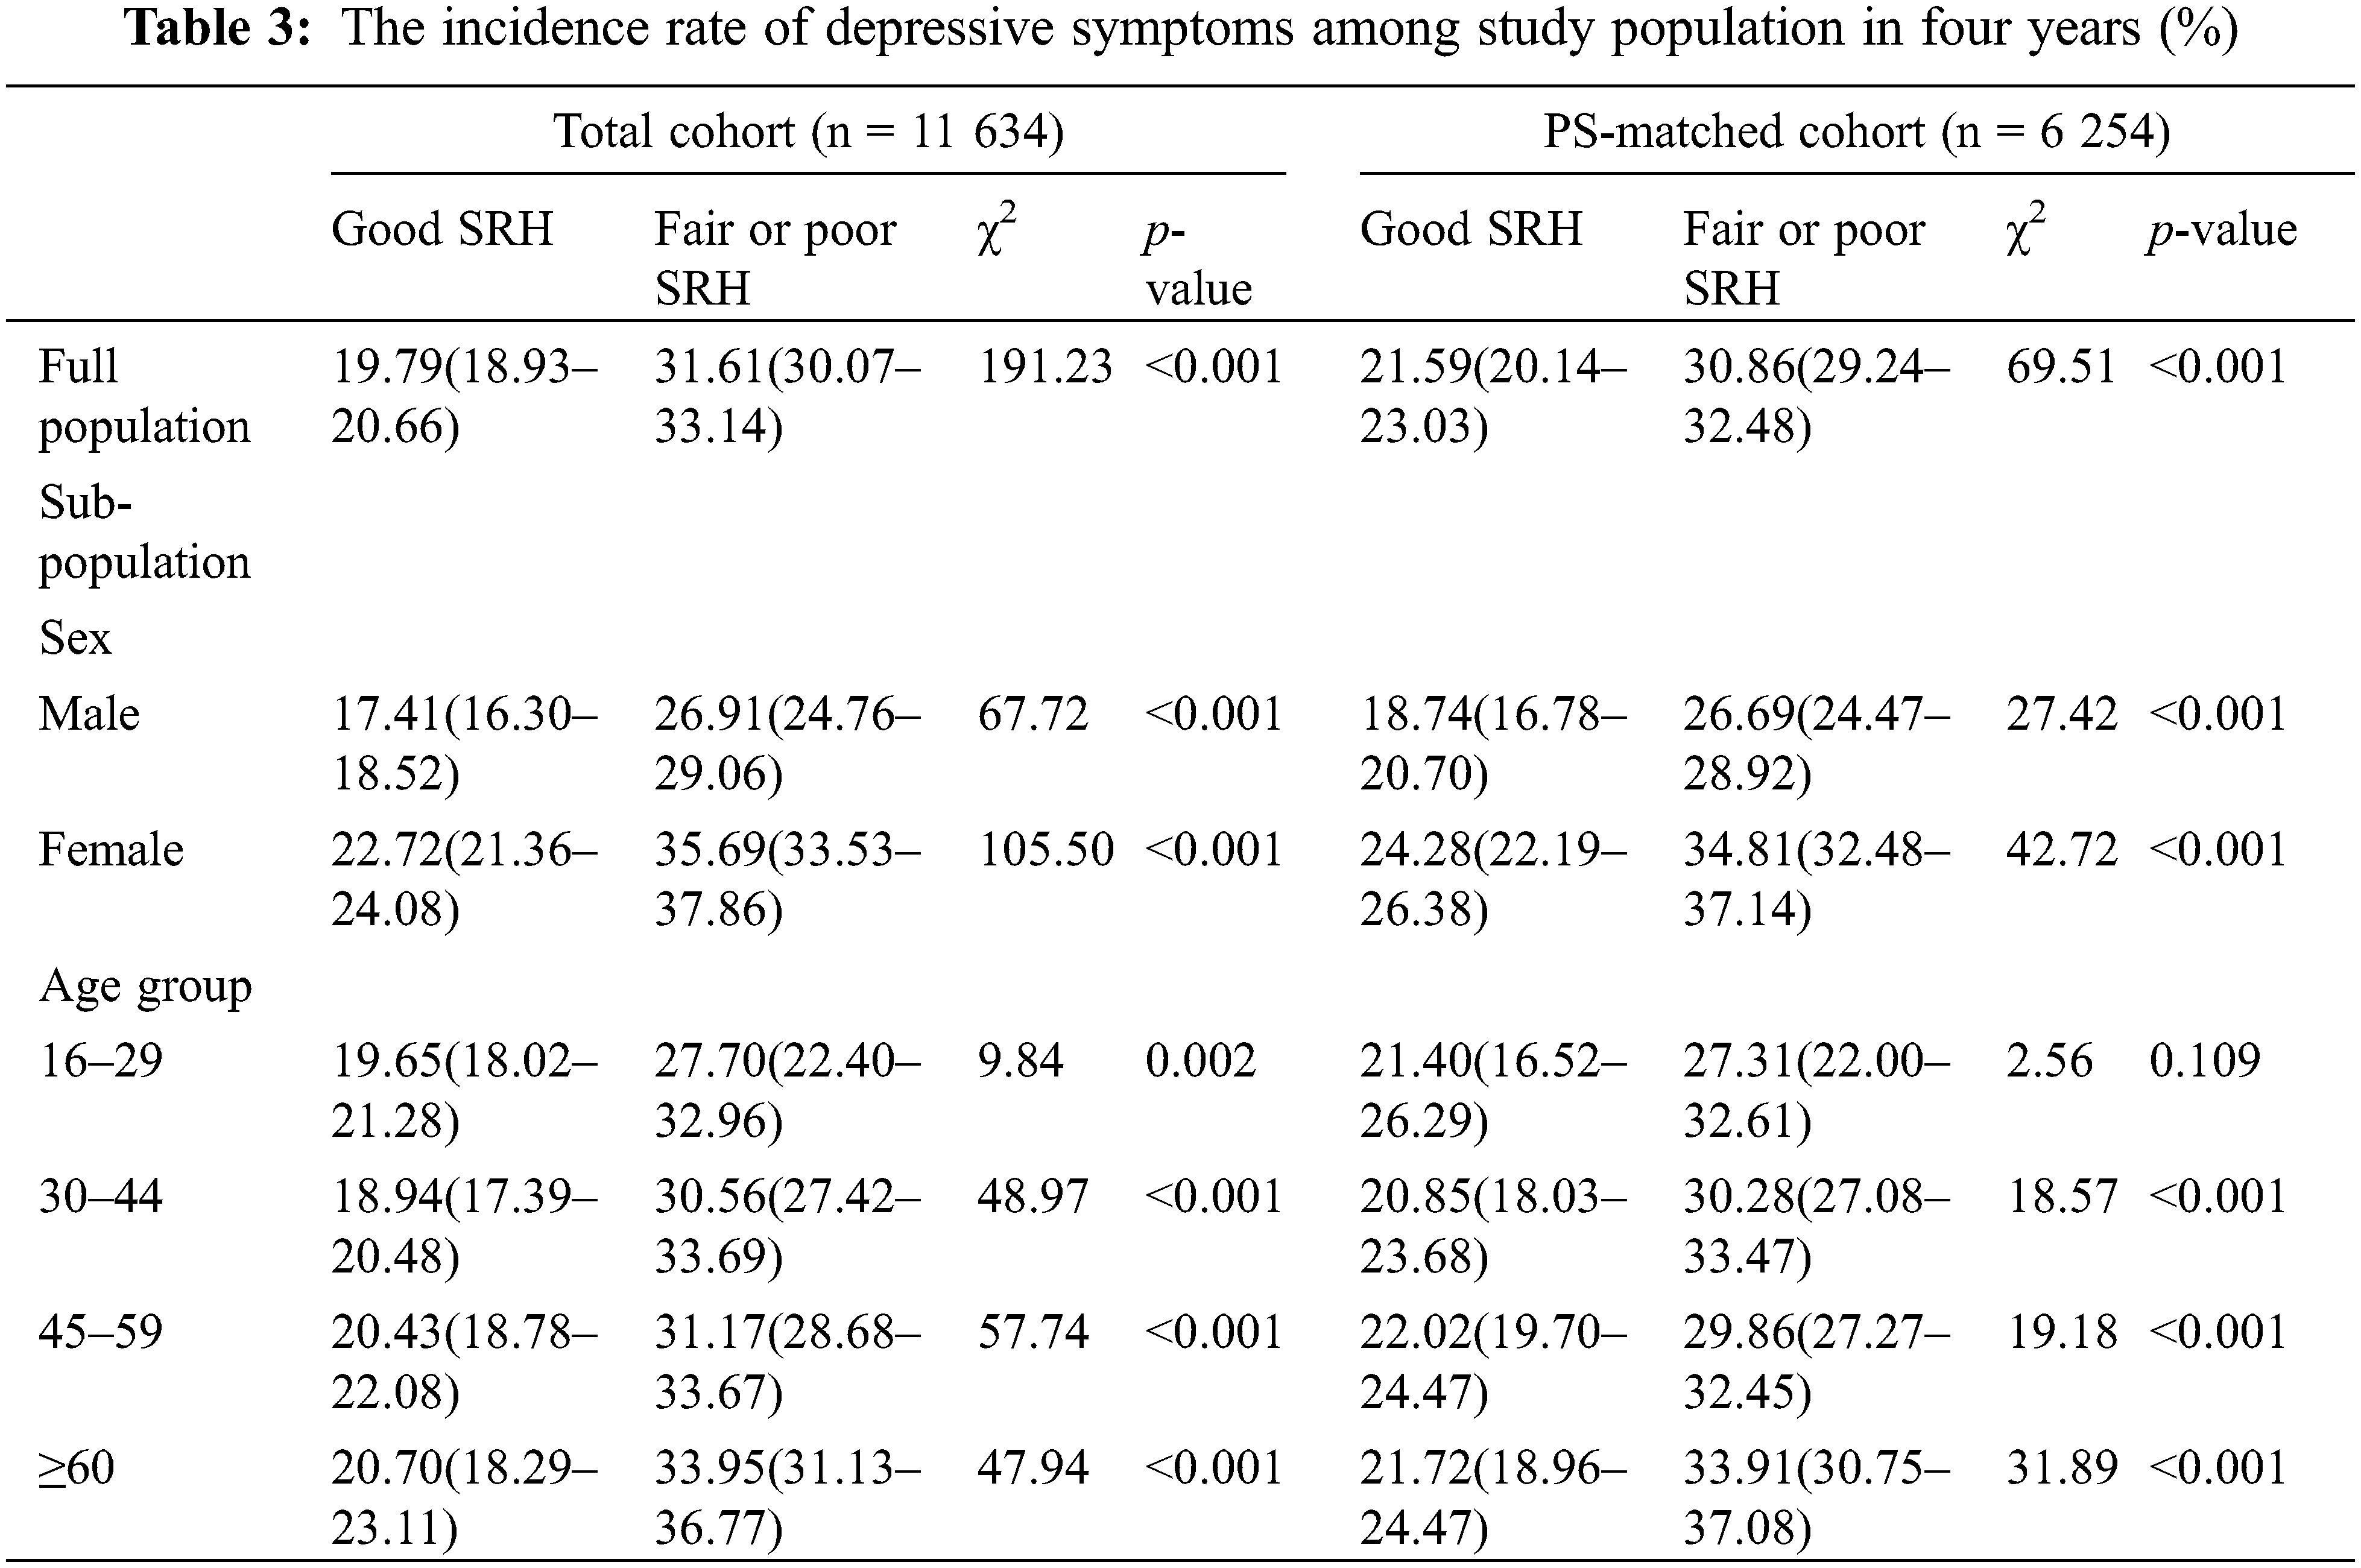
Table 3 displays the incidence rate of depressive symptoms during the 4-year follow-up period. Among participants with good SRH and fair or poor SRH at baseline, there were 675 and 965 incident cases of depressive symptoms separately in the PS-matched cohort, and the incidence rate of depressive symptoms during the study period were 21.59% (95%CI: 20.14–23.03) and 30.86% (95%CI: 29.24–32.48) correspondingly, with a significant difference (χ2 = 69.51, p < 0.001). After adjusting for gender in the PS-matched cohort, the difference in incidence rate of depressive symptoms between the two groups was still significant. After propensity score matching and adjusting for age group, the significant differences in the incidence rate remained except for the sub-population aged 16–29 (χ2 = 2.56, p = 0.109).
3.3 Association of SRH and Depressive Symptoms
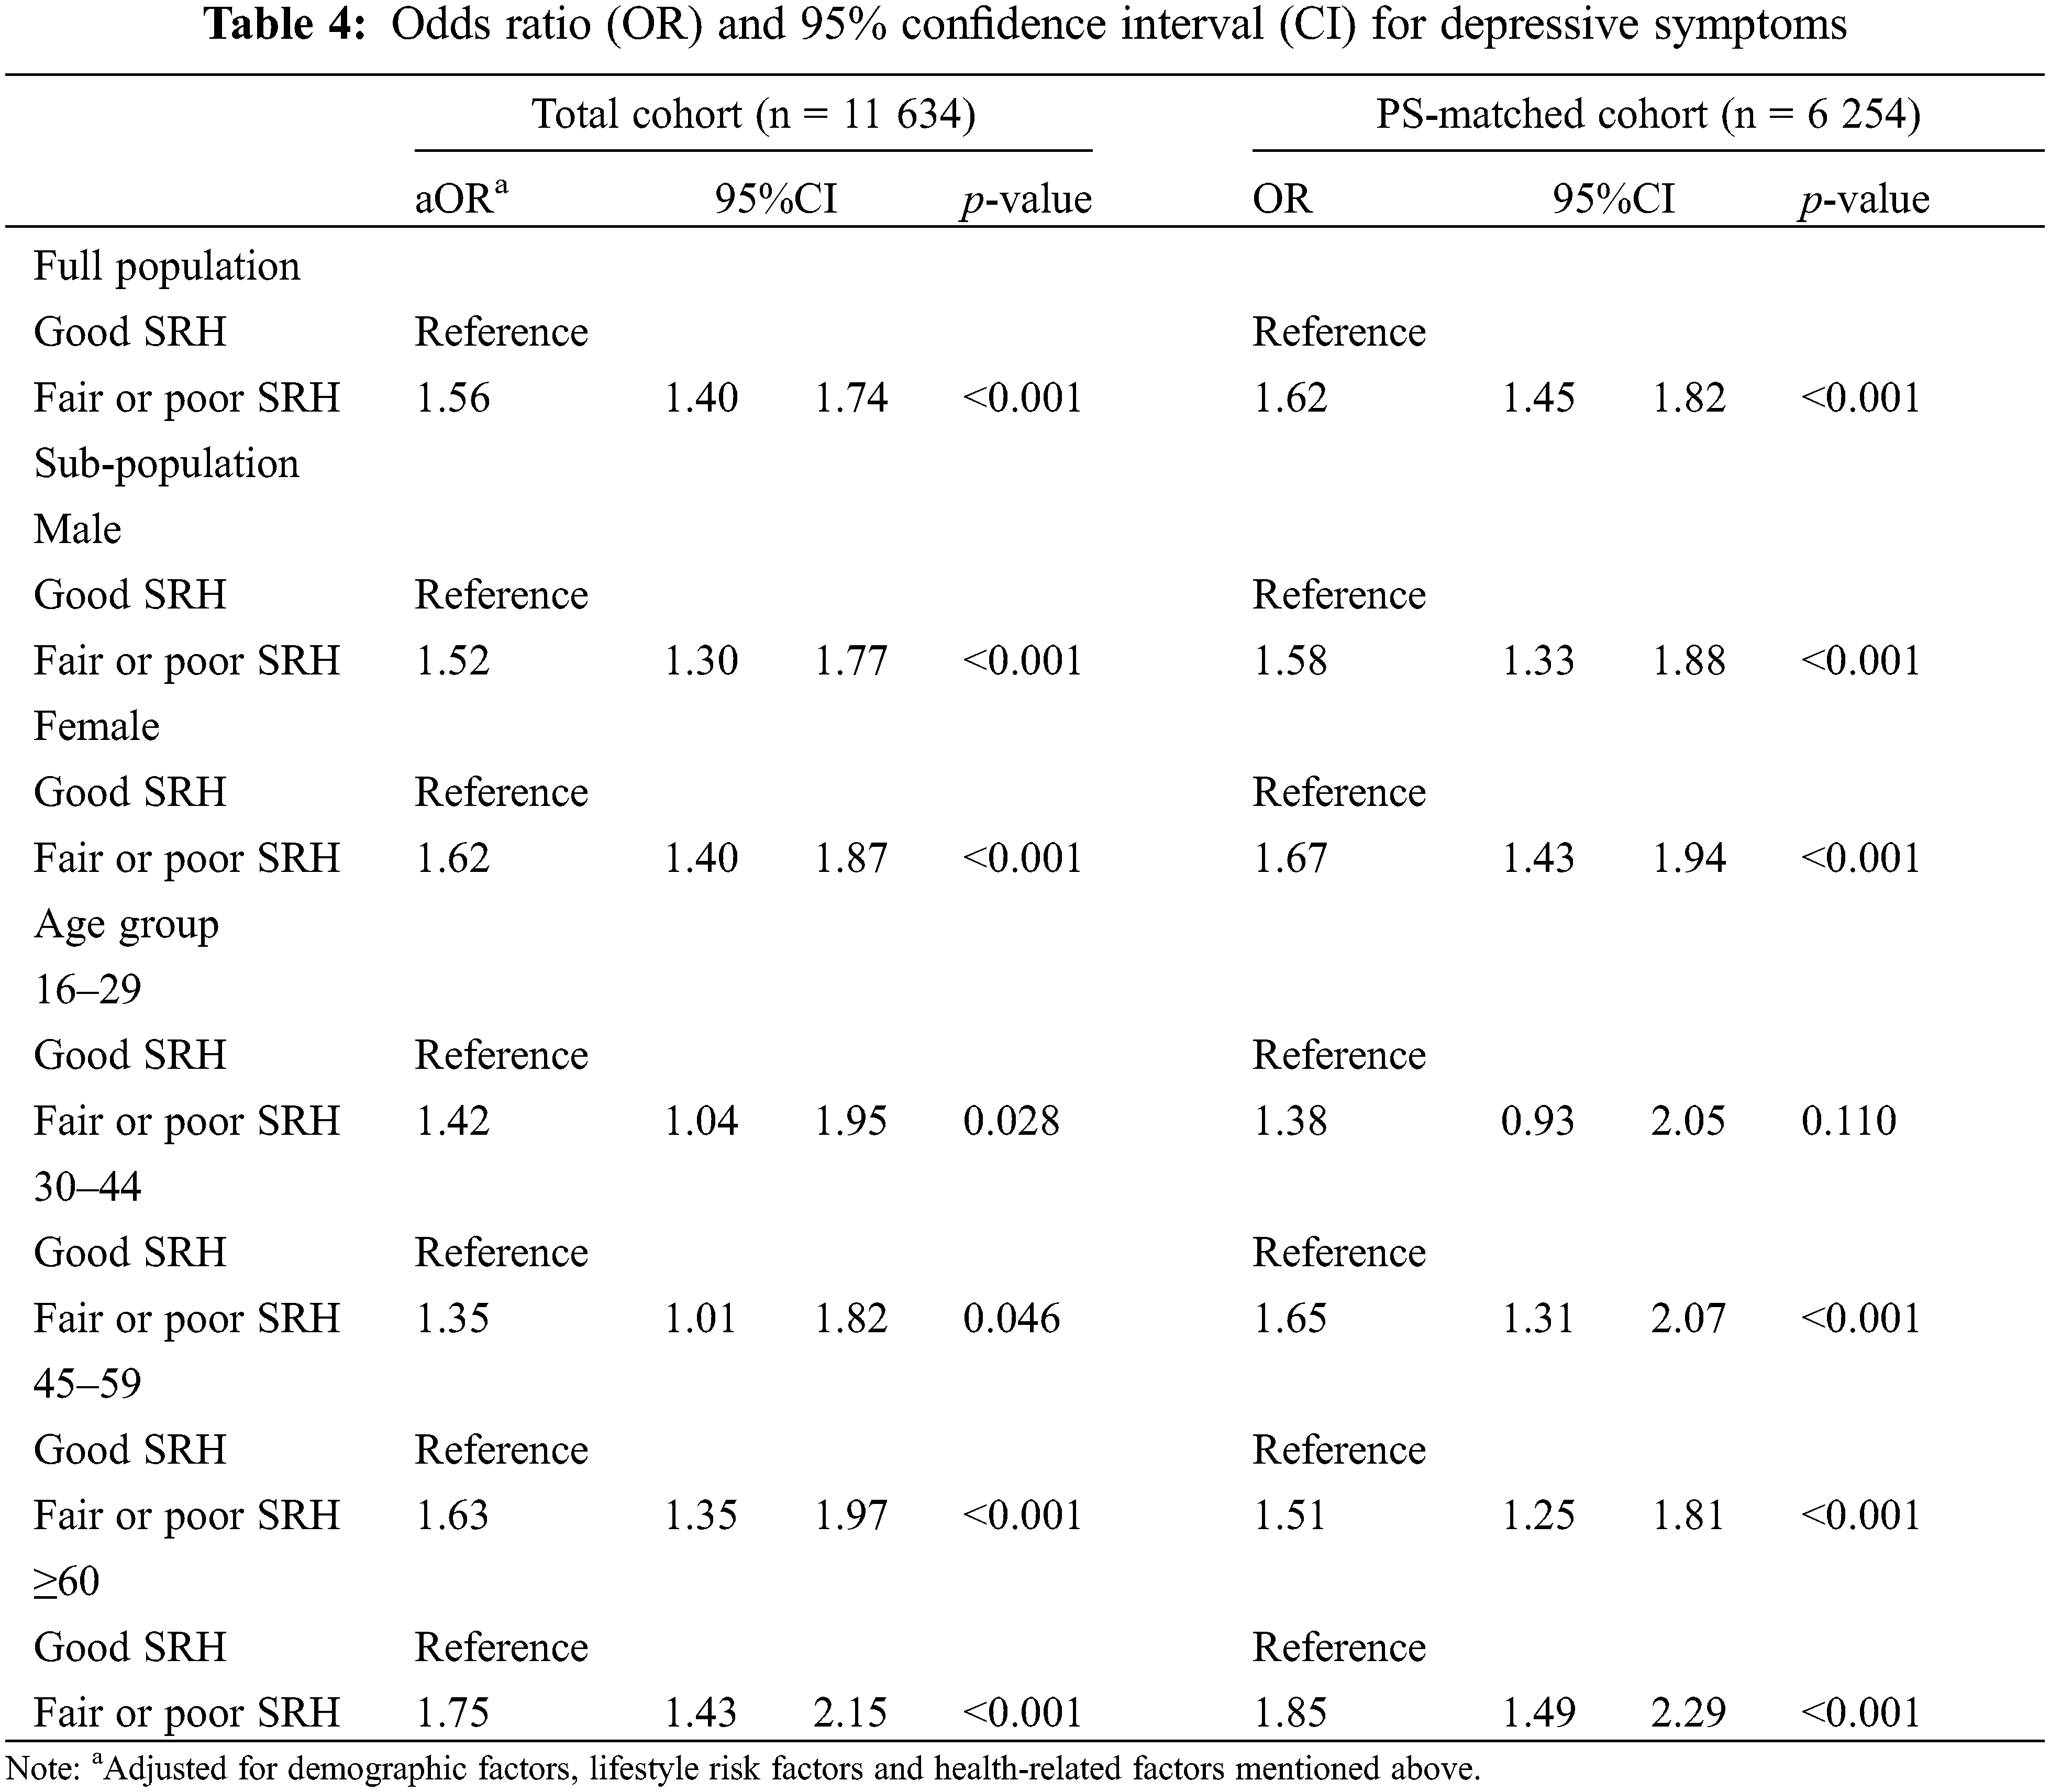
The results of multiple logistic regression analysis of the total cohort and the univariate unconditional logistic regression analysis to the PS-matched cohort are summarized in Table 4. In the total cohort, SRH was associated with depressive symptoms whether in the full population or in a sub-population, indicating a higher probability of depressive symptoms among the participants with fair or poor SRH. The risk of depressive symptoms in the group of fair or poor SRH was 56% higher than that in the group of good SRH (OR = 1.56, 95%CI: 1.40–1.74, p < 0.001). In the PS-matched cohort, the association between SRH and depressive symptoms was still found in the full population and the sub-population divided by sex. However, such associations were less pronounced in the sub-population aged 16–29 after propensity score matching (OR = 1. 38, 95%CI: 0.93–2.05, p = 0.110). The univariate unconditional logistic regression analysis showed that there was a correlation between SRH and depressive symptoms in rural adults aged 30 and above (OR = 1.65, 95%CI: 1.46–1.85, p < 0.001)., The risk of depressive symptoms in elderly participants aged 60 and above with fair or poor SRH was 85% higher than that in the elderly with good SRH (OR = 1.85, 95%CI: 1.49–2.29, p < 0.001). Thus, poor or fair SRH is considered as an independent risk factor of depressive symptoms in rural Chinese adults aged 30 and above in this study.
To our knowledge, this study is one of the largest to specifically focus on verifying the association between SRH and depressive symptoms among rural adults in developing countries using a cohort study. In this study, we utilized propensity score matching and logistic regression analysis to verify the association among rural Chinese adults. Significant differences in the prevalence of depressive symptoms between a good SRH group and a fair or poor SRH group have been observed in previous studies [45,46]. Our research showed that such difference in the incidence of depressive symptoms within 4 years is also statistically significant among rural Chinese adults.
Although the association between SRH and depressive symptoms has been verified in elderly populations, few studies pay attention to whether this association is still valid in a full adult population especially in rural areas in developing countries [47,48]. In this study, non-negligible increased risks of depressive symptoms at fair or poor SRH were consistently observed in the total cohort and PS-matched cohort aged 30 and above. Less strong evidence was found for depressive symptom outcomes after 4-year follow-up exposure to fair or poor SRH in the sub-population aged 16–29 for the PS-matched cohort. This may be because the heterogeneity of SRH in the rural population aged 16–29 is not as strong as that of the rural population aged 30 and over [49]. It may also be because the depressive symptoms of young people are mainly affected by factors other than health [50]. These results could be used as a reliable basis for further studies on the association between SRH and depressive symptoms among rural adults in developing countries and to identify determinants for the observed cross-age variation.
The significant effect of SRH on depressive symptoms can be explained by the integrity of SRH. SRH reflects the subjective evaluation of diagnosed or undiagnosed symptoms, individual health behavior, expectation and coping ability for future health [21–23]. All these factors may have an impact on depressive symptoms, and as a complex combination of these factors, which may even have a greater impact. Firstly, from a pathophysiological perspective, SRH has been reported as a reflection of biological diseases, physical functioning and symptoms, and even of subclinical disease or an ‘unmeasured biological process’ yet to be discovered [51]. Studies show that objective health threats such as heart disease, cancer and physical limitations will aggravate depressive symptoms [7–11,52]. That means SRH may predict depressive symptoms by reflecting changes in objective health. Secondly, from the perspective of psychological mechanism, SRH has been regarded as a subcomponent of an individual’s self-concept, usually engaging self-evaluative mechanisms via social comparisons with one’s peers or temporal comparisons with one’s own past or future selves [53] and is directly linked to personality traits [54]. Studies show that personality traits have been reported as an important risk factor for depressive symptoms [55,56]; maladaptive personality styles have been shown to contribute to distorted perceptions of health status [50], and thereby increase the risk of depressive symptoms [57]. Thirdly, from the perspective of socio-economic status impact, sufficient family economic resources can reduce the pressure related to expenditure, and health resources such as better housing conditions and medical care. Long-term cumulative exposure to poor socio-economic status will increase the risk of chronic diseases [58], which makes such people more likely to have negative views on their own health [59,60], and more likely to have depressive symptoms [61–63].
For rural residents in China, culture is an important factor influencing screening and intervention of depressive symptoms. For example, influenced by traditional Chinese medicine culture, rural Chinese residents believe that the word disease is more about the expression of “body health” than “mental health”. Besides, they tend to minimize positive self-expression, and disclosing their psychological problems makes them feel embarrassed because of the tradition of Confucian Culture. No wonder there is a widespread stigmatization of depressive symptoms in rural China and the inclination to resort to informal diagnosis and treatment, for example “folk remedies” [53,64] that have compounded the difficulty of disclosing mental health problems [65]. Of course, due to the impact of the COVID-19 and new technologies, there are other factors that cause various syndromes [66,67] and stress due to use of new technologies needs to be considered [68–70]. We plan to investigate these factors in future research.
Several limitations in this study deserves attention. Firstly, in this study, about 25% of the samples were excluded because of missing answers to the questionnaires or lost in follow-ups, which may have a potential impact on the results of the statistical analysis. Secondly, the 4-year interval may not be enough to explain the dynamic changes of depressive symptoms, it will be important to collect more information on depressive symptoms in a future follow-up study design. Thirdly, while many potential covariates have been adjusted for in this study, some other potential confounders cannot be controlled, which may prevent us from disclosing a stronger association between SRH and depressive symptoms. A future study may use a PSM-DID model to make a more detailed statistical analysis on their association on the basis of more abundant data resources.
Rural Chinese adults aged 30 and above in this study with fair or poor SRH showed an increase risk of depressive symptoms within 4 years compared to those with good SRH. Considering that gaining information from rural residents about their mental health is a challenge, it will be a good choice to collect SRH data to predict the depressive symptoms for them. Through simple measurement by a question of the Likert scale, “how do you evaluate your health as a whole?”, SRH provides a convenient, cost-effective, non-invasive and reliable method to assess the mental health status for the general population. It is clear that it is of great value for the early monitoring and intervention of depressive symptoms. This study shows that we should pay more attention to the mental health of rural residents and establish an index system based on SRH indicators, to carry out early intervention on depressive symptoms among rural residents.
Acknowledgement: We thank the China Family Panel Studies (CFPS) team for providing data.
Funding Statement: The authors received no specific funding for this study.
Conflicts of Interest: The authors declare that they have no conflicts of interest to report regarding the present study.
1. World Health Organization (2017). Depression and Other Common Mental Disorders. Global Health Estimates. https://www.who.int/publications/i/item/depression-global-health-estimates. [Google Scholar]
2. Walker, E. R., McGee, R. E., Druss, B. G. (2015). Mortality in mental disorders and global disease burden implications: A systematic review and meta-analysis. JAMA Psychiatry, 72(4), 334–341. DOI 10.1001/jamapsychiatry.2014.2502. [Google Scholar] [CrossRef]
3. Huang, Y., Wang, Y., Wang, H., Liu, Z., Yu, X. et al. (2019). Prevalence of mental disorders in China: A cross-sectional epidemiological study. Lancet. Psychiatry, 6(3), 211–224. DOI 10.1016/S2215-0366(18)30511-X. [Google Scholar] [CrossRef]
4. Gao, S., Jin, Y., Unverzagt, F. W., Liang, C., Hall, K. S. et al. (2009). Correlates of depressive symptoms in rural elderly Chinese. International Journal of Geriatric Psychiatry, 24(12), 1358–1366. DOI 10.1002/gps.2271. [Google Scholar] [CrossRef]
5. Li, L. W., Liu, J., Xu, H., Zhang, Z. (2016). Understanding rural-urban differences in depressive symptoms among older adults in China. Journal of Aging and Health, 28(2), 341–362. DOI 10.1177/0898264315591003. [Google Scholar] [CrossRef]
6. Zhang, L., Xu, Y., Nie, H., Zhang, Y., Wu, Y. (2012). The prevalence of depressive symptoms among the older in China: A meta-analysis. International Journal of Geriatric Psychiatry, 27(9), 900–906. DOI 10.1002/gps.2821. [Google Scholar] [CrossRef]
7. Zhong, B., Liu, T., Chan, S. S. M., Jin, D., Hu, C. et al. (2015). Prevalence and correlates of major depressive disorder among rural-to-urban migrant workers in Shenzhen, China. Journal of Affective Disorders, 183(4), 1–9. DOI 10.1016/j.jad.2015.04.031. [Google Scholar] [CrossRef]
8. Hsiao, I. H. (2016). An sociological analysis of the production of depression: An neoliberalist globalization perspective. Chinese Journal of Sociology, 36(2), 191–214. DOI 10.15992/j.cnki.31-1123/c.2016.02.009. [Google Scholar] [CrossRef]
9. Dalton, S. O., Laursen, T. M., Ross, L., Mortensen, P. B., Johansen, C. (2009). Risk for hospitalization with depression after a cancer diagnosis: A nationwide, population-based study of cancer patients in Denmark from 1973 to 2003. Journal of Clinical Oncology, 27(9), 1440–1445. DOI 10.1200/JCO.2008.20.5526. [Google Scholar] [CrossRef]
10. DeJean, D., Giacomini, M., Vanstone, M., Brundisini, F. (2013). Patient experiences of depression and anxiety with chronic disease: A systematic review and qualitative meta-synthesis. Ontario Health Technology Assessment Series, 13(16), 1–33. [Google Scholar]
11. Ayerbe, L., Ayis, S., Wolfe, C. D. A., Rudd, A. G. (2013). Natural history, predictors and outcomes of depression after stroke: Systematic review and meta-analysis. British Journal of Psychiatry, 202(1), 14–21. DOI 10.1192/bjp.bp.111.107664. [Google Scholar] [CrossRef]
12. Probst, J. C., Laditka, S. B., Moore, C. G., Harun, N., Powell, M. P. et al. (2006). Rural-urban differences in depression prevalence: Implications for family medicine. Family Medicine, 38(9), 653–660. [Google Scholar]
13. ÜSTÜN, B., Kennedy, C. (2009). What is functional impairment? disentangling disability from clinical significance. World Psychiatry, 8(2), 82–85. DOI 10.1002/j.2051-5545.2009.tb00219.x. [Google Scholar] [CrossRef]
14. Yuan, W. P., Xue, Y. Q., Cai, Y., Zheng, X., Chang, Y. Q. et al. (2021). Investigation on prevalence of multiple chronic diseases and self-care ability of the elderly. Modern Preventive Medicine, 48(14), 2590–2593 (in Chinese). DOI 10.3390/su11133525. [Google Scholar] [CrossRef]
15. Liu, Y., Jin, Y., Zhao, Y. (2012). The current status and influencing factors of health behaviors in young stroke patients. Chinese Journal of Health Statistics, 47(1), 58–61. DOI 10.3761/j.issn.0254-1769.2012.01.023. [Google Scholar] [CrossRef]
16. Zhang, R., Yang, L. C. (2020). Construction and reflection of health anxiety—young people’s daily health practices embedded in consumerism. CHINA YOUTH STUDY, 10, 87–93. DOI 10.3969/j.issn.1002-9931.2020.10.012. [Google Scholar] [CrossRef]
17. Case, A., Paxson, C. H. (2005). Sex differences in morbidity and mortality. Demography, 42(2), 189–214. DOI 10.1353/dem.2005.0011. [Google Scholar] [CrossRef]
18. Chen, L., Wu, C. K., Peng, C., Li, W. Y. (2021). Association between chronic diseases and depressive symptom in middle-aged and elderly people over 45 years old in China. Medicine and Society, 34(10), 90–94. DOI 10.13723/j.yxysh.2021.10.017. [Google Scholar] [CrossRef]
19. Huang, Z. T., Luo, Y., Su, H. X., Wang, K. P., Chen, Z. S. et al. (2021). Relationship between cardiovascular metabolic multimorbidity and depressive symptoms in Chinese older adults. Chinese Journal of Prevention and Control of Chronic Diseases, 29(9), 644–648. DOI 10.16386/j.cjpccd.issn.1004-6194.2021.09.002. [Google Scholar] [CrossRef]
20. Liu, F. Y., Zeng, W. J., Chen, Y. (2011). Spatial distribution of mental health services node in China: Situation, dilemma and breakthrough. Chinese Journal of Health Policy, 4(3), 28–32. DOI 10.3969/j.issn.1674-2982.2011.03.007. [Google Scholar] [CrossRef]
21. Lu, J., Hao, C. M., Li, R. T., Yin, G. Y., Gao, W. B. (2013). Investigation and analysis of breast diseases in urban and rural women in Tianjin. Chinese Journal of Prevention and Control of Chronic Diseases, 21(1), 62–63. DOI 10.16386/j.cjpccd.issn.1004-6194.2013.01.005. [Google Scholar] [CrossRef]
22. Chen, R., Hu, Z., Chen, R., Ma, Y., Zhang, D. et al. (2013). Determinants for undetected dementia and late-life depression. British Journal of Psychiatry, 203(3), 203–208. DOI 10.1192/bjp.bp.112.119354. [Google Scholar] [CrossRef]
23. Liu, Q., Cai, H., Yang, L. H., Xiang, Y., Yang, G. et al. (2018). Depressive symptoms and their association with social determinants and chronic diseases in middle-aged and elderly Chinese people. Scientific Reports, 8(1), 3841. DOI 10.1038/s41598-018-22175-2. [Google Scholar] [CrossRef]
24. Murata, C., Kondo, T., Tamakoshi, K., Yatsuya, H., Toyoshima, H. (2006). Determinants of self-rated health: Could health status explain the association between self-rated health and mortality? Archives of Gerontology and Geriatrics, 43(3), 369–380. DOI 10.1016/j.archger.2006.01.002. [Google Scholar] [CrossRef]
25. Lee, Y. (2000). The predictive value of self assessed general, physical, and mental health on functional decline and mortality in older adults. Journal of Epidemiology and Community Health, 54(2), 123–129. DOI 10.1136/jech.54.2.123. [Google Scholar] [CrossRef]
26. Shirom, A., Toker, S., Melamed, S., Shapira, I. (2011). The relationships between self-rated health and serum lipids across time. International Journal of Behavioral Medicine, 19(1), 73–81. DOI 10.1007/s12529-011-9144-y. [Google Scholar] [CrossRef]
27. Peleg, S., Nudelman, G. (2021). Associations between self-rated health and depressive symptoms among older adults: Does age matter? Social Science & Medicine, 280(2), 114024. DOI 10.1016/j.socscimed.2021.114024. [Google Scholar] [CrossRef]
28. Dong, W., Pan, X., Yu, C., Lv, J., Guo, Y. et al. (2018). Self-rated health status and risk of incident stroke in 0.5 million chinese adults: The china kadoorie biobank study. Journal of Stroke, 20(2), 247–257. DOI 10.5853/jos.2017.01732. [Google Scholar] [CrossRef]
29. Liu, F., Zhang, C., Liang, Y., Deng, Q., Hang, D. et al. (2017). Epidemiology of self-rated health in rural China: A population-based cross-sectional study. Scientific Reports, 7(1), 4459–4467. DOI 10.1038/s41598-017-04381-6. [Google Scholar] [CrossRef]
30. Falk, H., Skoog, I., Johansson, L., Guerchet, M., Mayston, R. et al. (2017). Self-rated health and its association with mortality in older adults in China, India and Latin America–A 10/66 dementia research group study. Age and Ageing, 46(6), 932–939. DOI 10.1093/ageing/afx126. [Google Scholar] [CrossRef]
31. Zhang, S., Du, L., Jin, G. H., Feng, S., Hou, W. Z. et al. (2011). Depression condition and awareness among elderly patients with chronic diseases in community. Chinese General Practice, 14(16), 1830–1833. DOI 10.3969/j.issn.1007-9572.2011.16.026. [Google Scholar] [CrossRef]
32. Pruchno, R., Wilson-Genderson, M., Cartwright, F. (2009). Self-rated health and depressive symptoms in patients with end-stage renal disease and their spouses: A longitudinal dyadic analysis of late-life marriages. Journals of Gerontology Series B, Psychological Sciences and Social Sciences, 64(2), 212–221. DOI 10.1093/geronb/gbp006. [Google Scholar] [CrossRef]
33. Ambresin, G., Chondros, P., Dowrick, C., Herrman, H., Gunn, J. M. (2014). Self-rated health and long-term prognosis of depression. Annals of Family Medicine, 12(1), 57–65. DOI 10.1370/afm.1562. [Google Scholar] [CrossRef]
34. Huang, C. Q., Zhang, X. M., Dong, B. R., Lu, Z. C. et al. (2010). Health status and risk for depression among the elderly: A meta-analysis of published literature. Age and Ageing, 39(1), 23–30. DOI 10.1093/ageing/afp187. [Google Scholar] [CrossRef]
35. Kosloski, K., Stull, D. E., Kercher, K., van Dussen, D. J. (2005). Longitudinal analysis of the reciprocal effects of self-assessed global health and depressive symptoms. Journals of Gerontology: Series B, 60(6), 296–303. DOI 10.1093/geronb/60.6.P296. [Google Scholar] [CrossRef]
36. Li, Y. H., Mao, Q. A., Shi, Q., Tao, M. X., Nie, X. Q. et al. (2015). The level of health literacy of Chinese residents in 2012: Surveillance results. Chinese Journal of Health Education, 31(2), 99–103. DOI 10.16168/j.cnki.issn.1002-9982.2015.02.001. [Google Scholar] [CrossRef]
37. Xie, Y., Hu, J. W. (2014). An introduction to the china family panel studies (CFPS). Chinese Sociological Review, 47(1), 3–29. DOI 10.2753/CSA2162-0555470101.2014.11082908. [Google Scholar] [CrossRef]
38. Ware, J. E., Gandek, B. (1998). Overview of the SF-36 health survey and the international quality of life assessment (IQOLA) project. Journal of Clinical Epidemiology, 51(11), 903–912. DOI 10.1016/S0895-4356(98)00081-X. [Google Scholar] [CrossRef]
39. Quesnel-Vallée, A. (2007). Self-rated health: Caught in the crossfire of the quest for ‘true’ health? International Journal of Epidemiology, 36(6), 1161–1164. DOI 10.1093/ije/dym236. [Google Scholar] [CrossRef]
40. Jylhä, M. (2009). What is self-rated health and why does it predict mortality? Towards a unified conceptual model. Social Science & Medicine, 69(3), 307–316. DOI 10.1016/j.socscimed.2009.05.013. [Google Scholar] [CrossRef]
41. Ishida, M., Montagni, I., Matsuzaki, K., Shimamoto, T., Cariou, T. et al. (2020). The association between depressive symptoms and self-rated health among university students: A cross-sectional study in France and Japan. BMC Psychiatry, 20(1), 549–559. DOI 10.1186/s12888-020-02948-8. [Google Scholar] [CrossRef]
42. Radloff, L. S. (1977). The CES-D scale: A self-report depression scale for research in the general population. Applied Psychological Measurement, 1(3), 385–401. DOI 10.1177/014662167700100306. [Google Scholar] [CrossRef]
43. Yang, L., Jia, C. X., Qin, P. (2015). Reliability and validity of the Center for Epidemiologic Studies Depression Scale (CES-D) among suicide attempters and comparison residents in rural China. BMC Psychiatry, 15(1), 76. DOI 10.1186/s12888-015-0458-1. [Google Scholar] [CrossRef]
44. Austin, P. C. (2010). An introduction to propensity score methods for reducing the effects of confounding in observational studies. Multivariate Behavioral Research, 46(3), 399–424. DOI 10.1080/00273171.2011.568786. [Google Scholar] [CrossRef]
45. Friedman, B., Conwell, Y., Delavan, R. L. (2007). Correlates of late-life major depression: A comparison of urban and rural primary care patients. American Journal of Geriatric Psychiatry, 15(1), 28–41. DOI 10.1097/01.JGP.0000224732.74767.ad. [Google Scholar] [CrossRef]
46. Gibbs, A., Dunkle, K., Jewkes, R. (2020). The prevalence, patterning and associations with depressive symptoms and self-rated health of emotional and economic intimate partner violence: A three-country population based study. Journal of Global Health, 10(1), 1–13. DOI 10.7189/jogh.10.010415. [Google Scholar] [CrossRef]
47. Han, B. (2020). Depressive symptoms and self-rated health in community-dwelling older adults: A longitudinal study. Journal of the American Geriatrics Society, 50(9), 1549–1556. DOI 10.1046/j.1532-5415.2002.50411.x. [Google Scholar] [CrossRef]
48. Jones, J. W., Ledermann, T., Fauth, E. B. (2018). Self-rated health and depressive symptoms in older adults: A growth mixture modeling approach. Archives of Gerontology and Geriatrics, 79(7), 137–144. DOI 10.1016/j.archger.2018.08.012. [Google Scholar] [CrossRef]
49. Jiang, J., Kang, R. (2019). Temporal heterogeneity of the association between social capital and health: An age-period-cohort analysis in China. Public Health, 172, 61–69. DOI 10.1016/j.puhe.2019.04.018. [Google Scholar] [CrossRef]
50. LeMoult, J., Humphreys, K. L., Tracy, A., Hoffmeister, J. A., Ip, E. et al. (2020). Meta-analysis: Exposure to early life stress and risk for depression in childhood and adolescence. Journal of the American Academy of Child and Adolescent Psychiatry, 59(7), 842–855. DOI 10.1016/j.jaac.2019.10.011. [Google Scholar] [CrossRef]
51. Winter, L., Lawton, M. P., Langston, C. A., Ruckdeschel, K., Sando, R. (2007). Symptoms, affects, and self-rated health evidence for a subjective trajectory of health. Journal of Aging and Health, 19(3), 453–469. DOI 10.1177/0898264307300167. [Google Scholar] [CrossRef]
52. Chiu, H. C., Chen, C. M., Huang, C. J., Mau, L. W. (2005). Depressive symptoms, chronic medical conditions, and functional status: A comparison of urban and rural elders in Taiwan. International Journal of Geriatric Psychiatry, 20(7), 634–644. DOI 10.1002/(ISSN)1099-1166. [Google Scholar] [CrossRef]
53. Löckenhoff, C. E., Sutin, A. R., Ferrucci, L., Costa, P. T. (2008). Personality traits and subjective health in the later years: The association between NEO-PI-R and SF-36 in advanced age is influenced by health status. Journal of Research in Personality, 42(5), 1334–1346. DOI 10.1016/j.jrp.2008.05.006. [Google Scholar] [CrossRef]
54. Lockenhoff, C. E., Terracciano, A., Ferrucci, L., Costa Jr, P. T. (2012). Five-factor personality traits and age trajectories of self-rated health: The role of question framing. Journal of Personality, 80(2), 375–401. DOI 10.1111/j.1467-6494.2011.00724.x. [Google Scholar] [CrossRef]
55. Steunenberg, B., Beekman, A. T., Deeg, D. J., Kerkhof, A. J. (2010). Personality predicts recurrence of late-life depression. Journal of Affective Disorders, 123(1), 164–172. DOI 10.1016/j.jad.2009.08.002. [Google Scholar] [CrossRef]
56. Steunenberg, B., Beekman, A. T., Deeg, D. J., Breemer, M. A., Kerkhof, A. J. (2007). Mastery and neuroticism predict recovery of depression in later life. American Journal of Geriatric Psychiatry, 15(3), 234–242. DOI 10.1097/01.JGP.0000236595.98623.62. [Google Scholar] [CrossRef]
57. Kaori, K., Richard, Z., Clyde, B. S., Nir, B., Atzmon, G. (2016). Positive attitude toward life, emotional expression, self-rated health, and depressive symptoms among centenarians and near-centenarians. Aging & Mental Health, 20(9), 930–939. DOI 10.1080/13607863.2015.1056770. [Google Scholar] [CrossRef]
58. Schultz, W. M., Kelli, H. M., Lisko, J. C., Varghese, T., Shen, J. et al. (2018). Socioeconomic status and cardiovascular outcomes: Challenges and interventions. Circulation, 137(20), 2166–2178. DOI 10.1161/CIRCULATIONAHA.117.029652. [Google Scholar] [CrossRef]
59. Dowd, J. B., Zajacova, A. (2007). Does the predictive power of self-rated health for subsequent mortality risk vary by socioeconomic status in the US? International Journal of Epidemiology, 36(6), 1214–1221. DOI 10.1093/ije/dym214. [Google Scholar] [CrossRef]
60. McEwen, B. S., Gianaros, P. J. (2010). Central role of the brain in stress and adaptation: Links to socioeconomic status, health, and disease: Central links between stress and SES. Annals of the New York Academy of Sciences, 1186(1), 190–222. DOI 10.1111/j.1749-6632.2009.05331.x. [Google Scholar] [CrossRef]
61. Lorant, V., Deliège, D., Eaton, D., Robert, A., Philippot, P. et al. (2003). Socioeconomic inequalities in depression: A meta-analysis. American Journal of Epidemiology, 157(2), 98–112. DOI 10.1093/aje/kwf182. [Google Scholar] [CrossRef]
62. Ma, X., Xiang, Y., Li, S. R., Xiang, Y., Guo, H. et al. (2008). Prevalence and sociodemographic correlates of depression in an elderly population living with family members in Beijing, China. Psychological Medicine, 38(12), 1723–1730. DOI 10.1017/S0033291708003164. [Google Scholar] [CrossRef]
63. Coleman, R. (2020). COVID-19 gender-based health worries, depressive symptoms, and extreme anxiety. Journal of Research in Gender Studies, 10(2), 106–116. DOI 10.22381/JRGS10220206. [Google Scholar] [CrossRef]
64. Wei, S. (2021). The social situation of depression in the process of rural social transformation: Case study in S village of R county in sichuan province. Journal of North Minzu University (Philosophy and Social Science), 158(2), 89–95. DOI 10.3969/j.issn.1674-6627.2021.02.011. [Google Scholar] [CrossRef]
65. Kasahara-Kiritani, M., Matoba, T., Kikuzawa, S., Sakano, J., Sugiyama, K. et al. (2018). Public perceptions toward mental illness in Japan. Asian Journal of Psychiatry, 35(3), 55–60. DOI 10.1016/j.ajp.2018.05.021. [Google Scholar] [CrossRef]
66. Duncan, C. (2020). Gender-related depression, anxiety, and psychological stress experienced during the COVID-19 pandemic. Journal of Research in Gender Studies, 10(2), 84–94. DOI 10.22381/JRGS10220204. [Google Scholar] [CrossRef]
67. Lewis, E., Zauskova, A. (2021). Prolonged stress, anxiety, and depression in medical staff during the COVID-19 crisis. Psychosociological Issues in Human Resource Management, 9(2), 21–34. DOI 10.22381/pihrm9220212. [Google Scholar] [CrossRef]
68. Fan, D., Li, Y., Liu, W., Yue, X. G., Boustras, G. (2021). Weaving public health and safety nets to respond the COVID-19 pandemic. Safety Science, 134(10226), 105058. DOI 10.1016/j.ssci.2020.105058. [Google Scholar] [CrossRef]
69. Zheng, S. Y., Jiang, S. P., Yue, X. G., Pu, R., Li, B. Q. (2019). Application research of an innovative online education model in big data environment. International Journal of Emerging Technologies in Learning, 14(8), 125–138. DOI 10.3991/ijet.v14i08.10404. [Google Scholar] [CrossRef]
70. He, H., Li, S., Hu, L., Duarte, N., Manta, O. et al. (2019). Risk factor identification of sustainable guarantee network based on logistic regression algorithm. Sustainability, 11(13), 3525. DOI 10.3390/su11133525. [Google Scholar] [CrossRef]
 | This work is licensed under a Creative Commons Attribution 4.0 International License, which permits unrestricted use, distribution, and reproduction in any medium, provided the original work is properly cited. |