DOI:10.32604/jnm.2022.027175
| Journal of New Media DOI:10.32604/jnm.2022.027175 | |
| Article |
Blood Sample Image Classification Algorithm Based on SVM and HOG
1Heilongjiang Province Cyberspace Research Center, Harbin, 150001, China
2Harbin University of Science and Technology, Harbin, 150040, China
3School of Cyberspace Science, Harbin Institute of Technology, Harbin, 150001, China
4The Ohio State University, Columbus, 43202, USA
*Corresponding Author: Chao Ma. Email: machao8396@163.com
Received: XX Month 202X; Accepted: XX Month 202X
Abstract: In the medical field, the classification and analysis of blood samples has always been arduous work. In the previous work of this task, manual classification maneuvers have been used, which are time consuming and laborious. The conventional blood image classification research is mainly focused on the microscopic cell image classification, while the macroscopic reagent processing blood coagulation image classification research is still blank. These blood samples processed with reagents often show some inherent shape characteristics, such as coagulation, attachment, discretization and so on. The shape characteristics of these blood samples also make it possible for us to recognize their classification through computer vision algorithms. Blood sample classification focuses on the texture and shape of the picture. HOG feature is a kind of feature descriptor used for object detection in computer vision and image processing. It can better extract the outline and texture features of the image by calculating and counting the histogram of oriented gradient of the local region of the image. Because the medical machines that need to identify and classify blood samples often lack strong calculation power, the current popular machine-learning classification algorithms cannot play a good role in these machines. In addition, the characteristics of blood samples produced by different types of reagents and processing methods are different, and it is difficult to obtain real samples, so the amount of data that can be used for training is small. Combining the above conditions and the experimental comparison of a variety of classification algorithms, we find that the lightweight SVM model has a better performance on this problem, and the combination of HOG and SVM has also been widely used in other research. The experiment demonstrated that the classification algorithm based on SVM and HOG can give a good result of both performance and accuracy in the classification of blood samples problem.
Keywords: Image classification; medical image; SVM; HOG
With the gradual rise of the medical industry, the classification and identification of blood samples applied to more and more scenes, which is heavy work for doctors and nurses. In recent years, there are a lot of applications of artificial intelligence in the medical field, and the classification and identification of blood samples is a more suitable scene for the application of image classification algorithm. The intelligent classification and identification of blood samples includes the basic noise reduction of the image to eliminate the images of poor quality or that do not meet the identification conditions, to ensure the accuracy of the identification results and the safety in practical application. And then we need image embedding. The graphic data is transformed into vector data that can be calculated by computer. These data are used for classification model training. You can get the category of the embedded graphics vector by inputting it into the model. It should be noted that in the medical scene, the accuracy of the output results must reach a high value, in order to fully ensure the security. In addition, because the standards of medical devices are often not unified, the forms of images obtained from them are not the same, and there are some differences in size and resolution, and different image sizes will lead to slightly different extracted features. Therefore, it is necessary to normalize the forms of data derived from various medical devices in order to approach the most appropriate form. Over the years, a variety of image classification methods have emerged, such as k-Nearest Neighbors (KNN) [1], Support Vector Machines (SVM) [2], Back Propagation Neural Networks (BPNN) [3], Convolutional Neural Networks (CNN) [4] and Transfer Learning [5]. Most of the methods have certain requirements in the amount of data and image accuracy, and the efficiency differences between methods are also very different. Because the characteristics of blood samples for different purposes are different, and it is difficult to obtain these real samples, the amount of data of blood samples that can be used for training is limited, so some algorithms that need a lot of data to fit are not applicable to this problem. In the process of consulting literature, we find that there is a certain extent similarity between the recognition of pedestrians and vehicles and the recognition of blood samples, and it is necessary to compare and calculate the local contours of the image. In pedestrian and vehicle recognition, HOG features are generally used to describe the gradient and edge directional density distribution of local targets. By dividing the target into small connected cell units, the gradient or edge direction of each pixel in the cell unit is collected, and these histograms are combined to form HOG feature descriptors. Because HOG operates on the local cell unit of the target, it can maintain a good invariance to the geometric or optical deformation of the image. The different categories of blood samples are often shown as the combination of coagulation, attachment, discretization and other states. These combined states have obvious and fixed geometric representation, which can be fully described by HOG features. We use HOG features to obtain image features, complete image embedding, and use SVM models to classify and identify images. The rest of this paper is organized as follows. The relevant work is reviewed in Section 2. Section 3 introduces the algorithm of blood sample recognition, and describes the experimental results and analysis. Finally, the summary is given in Section 4.
The process of blood sample classification is mainly divided into two parts: image feature extraction and image classification, this part will be divided into these two parts to describe.
This section will briefly introduce the progress of image feature extraction.
feature extraction is to convert text, picture, language, video and other data into fixed-size vector feature representation that the computer can recognize and use, and does not lose the meaning of the expression, so that the computer can process it. Image feature extraction is a type of feature extraction, which mainly studies the transformation of image data into computable vectors or other data that can be used by computers [6].
Generally speaking, according to the abstract level of the feature [7], it can be divided into pixel-level features, features calculated on each pixel, such as position and color; local features, in image segmentation or edge inspection, the features calculated according to the results of local subdivision of the image; global features, calculate the features of the whole image or only the regular partition of the image. In addition, all features can be roughly divided into low-level features and high-level features, low-level features can be extracted directly from the original image, while high-level features must be based on low-level features.
The three basic features of the low-level feature image are color, texture and shape. Color features are defined according to a specific color space or model, and they are most widely used in image retrieval. They have the advantages of insensitive to scaling and rotation [8], simple implementation, simple calculation and low storage requirements. At present, a variety of color features of traditional Chinese medicine have been proposed, including color histogram [9], color matrix [10], color coherence vector [11] and color correlation graph [12], among which the color correlation vector is one of the simple and effective color features. Texture feature is a very useful descriptor for most images, and it is widely used in image classification and recognition. At present, a large number of texture feature extraction techniques have been proposed, which can be divided into spatial texture feature extraction method and spectral texture feature extraction method according to the different fields of texture features. The former extracts texture features by calculating pixel statistics or finding local pixel structures in the original image domain, while the latter transforms the image to the frequency domain, and then calculates the features in the transformed image. The technology of shape feature extraction can be divided into region-based method and contour-based method [13]. The region-based method uses the entire region of the object to describe the shape, while the contour-based method uses only the information that exists in the boundaries of the object shape.
In reference [14], Tsai and Lin compare the combinations of various feature representation methods, including global features, local block features and regional features for image database classification. Finally, it is concluded that the feature representation based on the combination of block and global is the best. In reference [15], Dalal et al. proposed an image descriptor for human target detection, which uses gradient direction histogram features to extract the shape information of the target to form a rich feature set.
This section briefly introduces the latest developments in image classification and published works.
Image classification is a complex process affected by many factors. At present, the main methods of image classification are statistical classification, rule-based classification, neural network classification, linear classifier and so on. These classification methods have their own advantages and disadvantages.
Statistical classification methods include unsupervised k-means clustering and fuzzy clustering, as well as supervised nearest neighbor and Bayesian classifiers [16]. The rule-based classification [17] method uses a series of rules to analyze features, which are composed of conditional premises and actions formed according to expert experience. This series of rules can also be divided into three categories, namely, decision rules, focus rules and knowledge rules. Decision rules determine which rules are applied in the analysis process, and focus rules determine which feature information to use for analysis. Knowledge rules decide which actions to perform for output according to the results of the above two parts of rules [18].
The SVM model is the most widely used linear classifier. SVM is a powerful and supervised learning method [19], which has solid statistical basic mathematical support and is widely used in the fields of regression and classification. It converts the original training data to high-dimensional space, in which hyperplanes are constructed to perform classification tasks. This hyperplane, also known as the decision surface, distinguishes two types of planes, and the support vectors are the vector points searched by support vector machines. These vectors define the decision boundary and give a clear marginal separation.
After years of development, there have been many improvements and optimizations of support vector machines, such as twin support vector machines [20], Lagrangian support vector machines [21], least square support vector machines, decision tree support vector machines, DAG support vector machines, multi-kernel classification support vector machines.
In this section, we first briefly introduce the processing flow of blood sample recognition based on SVM and HOG, and then introduce the state of the data set, the process of the experiment and the detailed principle one by one.
The processing flow of the blood sample analysis algorithm based on SVM and HOG is shown as Fig. 1.
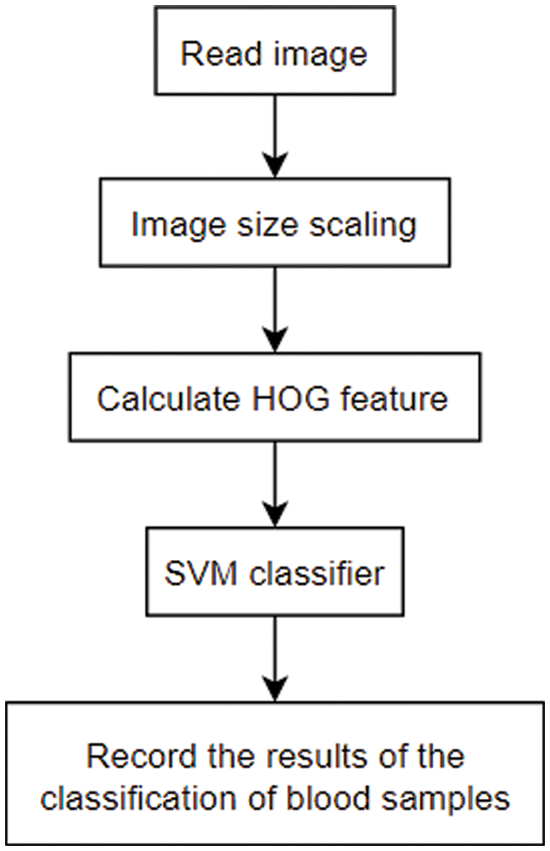
Figure 1: Image classification algorithm based on SVM and HOG
After reading the image, the size of the input picture needs to be scaled into different proportions to ensure that the character of the input picture is similar to that of the blood sample picture used during training and improve the accuracy. The preprocessed image is used to calculate the HOG feature, and the SVM classifier is used to determine the feature, and the classification result is recorded.
We collected approximately a thousand processed images of blood samples emerging a variety of characteristics, and standardized the size of these blood samples to 52×52 pixels, which were tagged by professionals according to the degree of condensation and dispersion. Finally, these samples are divided into five categories, and the sample size of each category is 326,79,55,65 and 420 respectively. The characteristics of the sample are shown in the following Fig. 2.
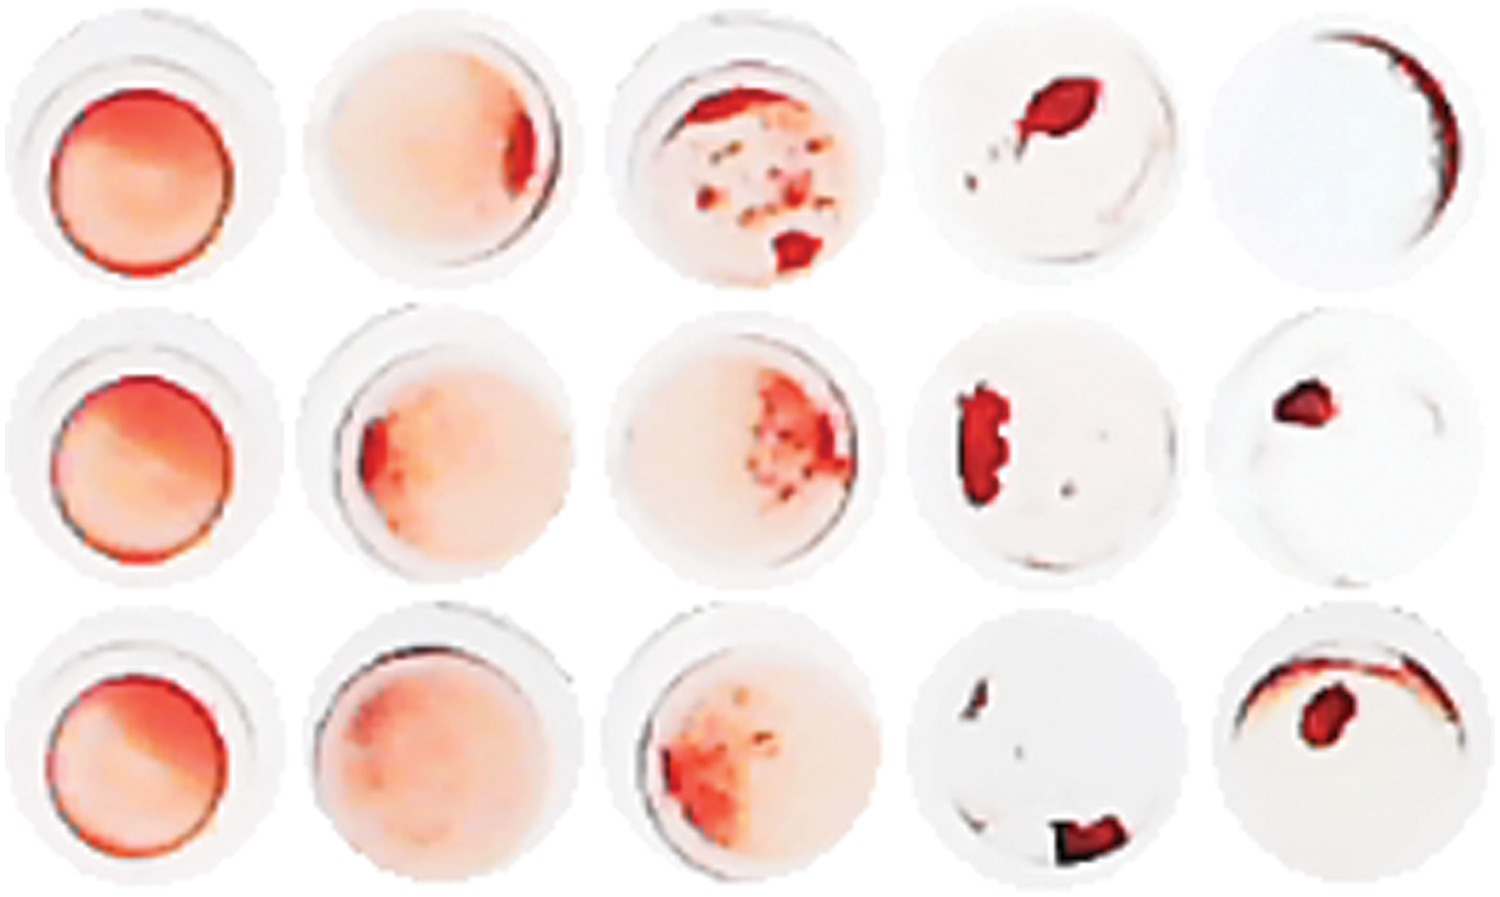
Figure 2: Blood sample dataset
In these five categories, we can clearly see the difference in the form of expression between the first category and the latter four categories. In the actual clinical research, it is necessary to strictly distinguish between the first category and the latter four categories, while the distinction between the latter four categories does not need to be too accurate. Therefore, although there are still some data sets unevenly distributed, but according to the experimental results, it is within the acceptable range.
The distinction of blood sample types mainly depends on blood coagulation, adhesion, dispersion and other states, so the identification of blood samples is mainly concerned with the local shape and texture of the picture. HOG is a kind of image descriptor which uses gradient direction histogram to express graphics and extract shape information of graphics. Commonly used HOG has three kinds of structures, namely, rectangular HOG, circular HOG and center encircling HOG. This paper uses the classical rectangular HOG.
The calculation of HOG is divided into four steps: normalization, gradient calculation, construction of histogram and cell synthesis, as shown in the Fig. 3.
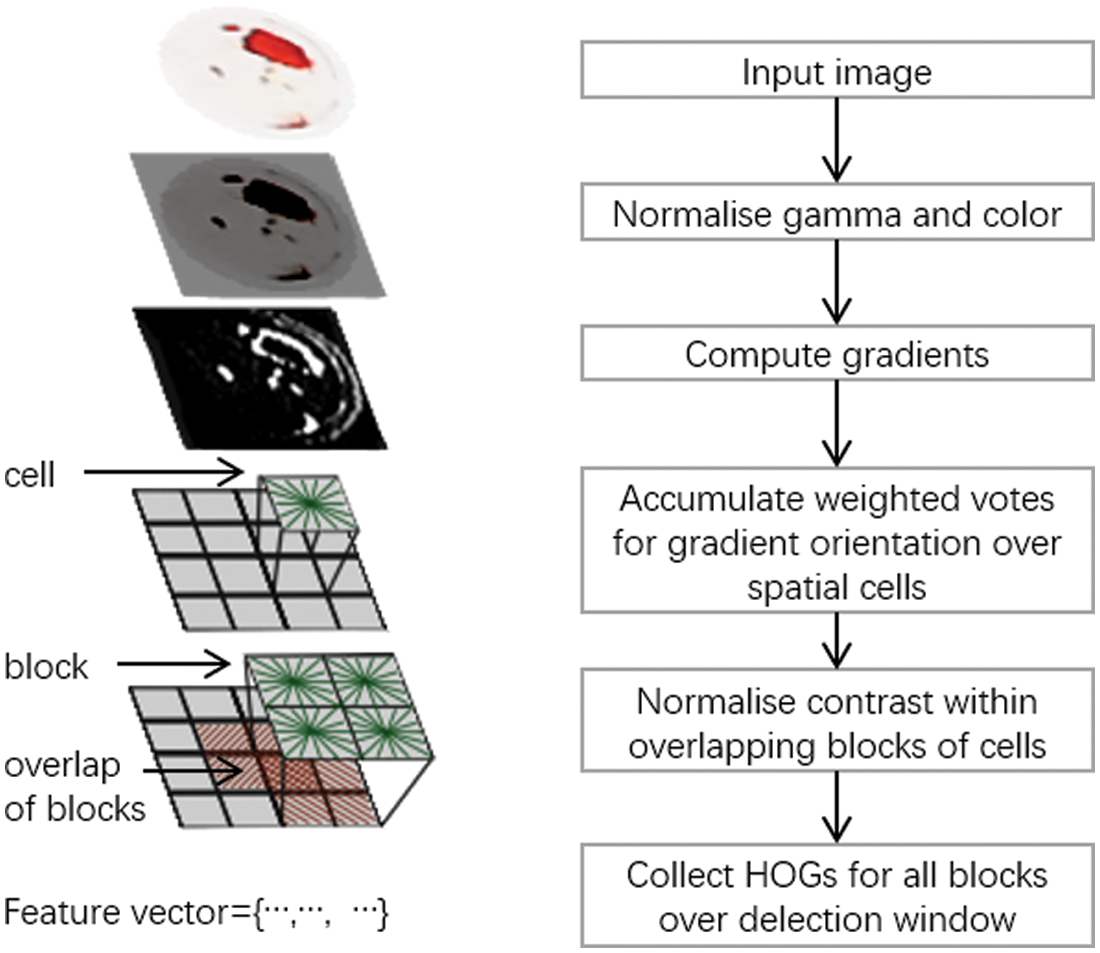
Figure 3: calculation process of HOG
The main purpose of this step of normalization is to reduce the influence of color on the results. Because the blood sample recognition mainly focuses on the shape and texture of the picture, and the blood sample images obtained by different types of equipment may be slightly different in various color parameters, if these images are quite different from the images in the training set, it will lead to some deviations, so it is necessary to normalize the input blood sample images with gamma and color.
The gradient calculation part needs to calculate the gradient of the image in the horizontal and vertical direction, thus calculating the gradient direction of each pixel, which can capture the outline of the blood sample and some texture information. The concrete calculation of the image gradient needs to utilize the first-order differential. define a pixel in the image as
According to the gradient of the P in the abscissa and ordinate directions, the gradient value of the pixel and the direction of the gradient can be obtained as follows.
Then the gradient direction histogram is constructed by using the calculated gradient results. In this part, assuming that the value range of the gradient direction is equally divided into N intervals, we need to segment the sample image into a series of cell, each cell containing several pixels. These pixels will be weighted by the gradient amplitude of the point. Finally, they are weighted and accumulated to the histogram channel in a certain direction, and the
Due to the contrast between the foreground and the background, the range of the gradient becomes very large, so it is necessary to normalize the intensity of the gradient to further compress the edge. This requires the synthesis of multiple cell into a large block to form a spatially continuous interval. Because these blocks overlap each other, each cell can act on the final descriptor many times. Finally, all the block vectors are integrated to form a one-dimensional vector to represent the original blood sample.
There are two reasons for choosing SVM as the classifier. First of all, the characteristics of blood samples obtained by different kinds of reagents and processing methods are different, and it is difficult to obtain real sample images, so the number of samples in the test set is often small, and the SVM model is a classifier that can also play a good role in small samples. Secondly, the combined application of SVM and HOG is a scheme verified by many other researches [22,23].
SVM is a linear classifier with minimum empirical error. The traditional SVM model is a two-classification method, which can use
Through the combination of multiple SVM models, we can also achieve the purpose of multi-classification. There are three main combination ideas of multi-classification SVM model. One-vs.-all, the objective function category is taken as positive samples and the other samples as negative samples at one time to train n svm. Because the training set is 1:N, there is a large bias, which is not practical. One-vs.-one, if a svm model is trained between any two types of samples during training, then two svm models will be obtained (n−1)*n/2 svms from n categories. When classifying a location sample, the voting method is used to determine which category it belongs to. This method needs to train a large number of SVM when there are many categories, and the computational cost is relatively high. Hierarchical support vector machine classifies all categories into two subclasses, and further divides subclasses into subclasses until separate subclasses appear.
In order to objectively evaluate the performance of blood sample recognition algorithms based on SVM and HOG, this paper also compares the performance of two other commonly used classification models.
The main parameters that have great influence on the results in HOG are block size
In comparison between the SVM model and other classification models. The first is a more lightweight KNN algorithm than SVM. The core of this algorithm is to use the categories of K most adjacent samples in the feature space to determine the category of target samples. When making category decisions, KNN is only related to a very small number of adjacent samples. The other is the neural network classification method. We choose the classical Deep Residual Network(ResNet) image classification network structure. This method realizes residual learning to solve the problem that depth CNN model is difficult to train.
We use 80% of the blood samples in the dataset to train the above three models, and then use the remaining 20% of the samples to test the fitted model. Under the comparison of different indicators, the performance of the three models is as Fig. 4.
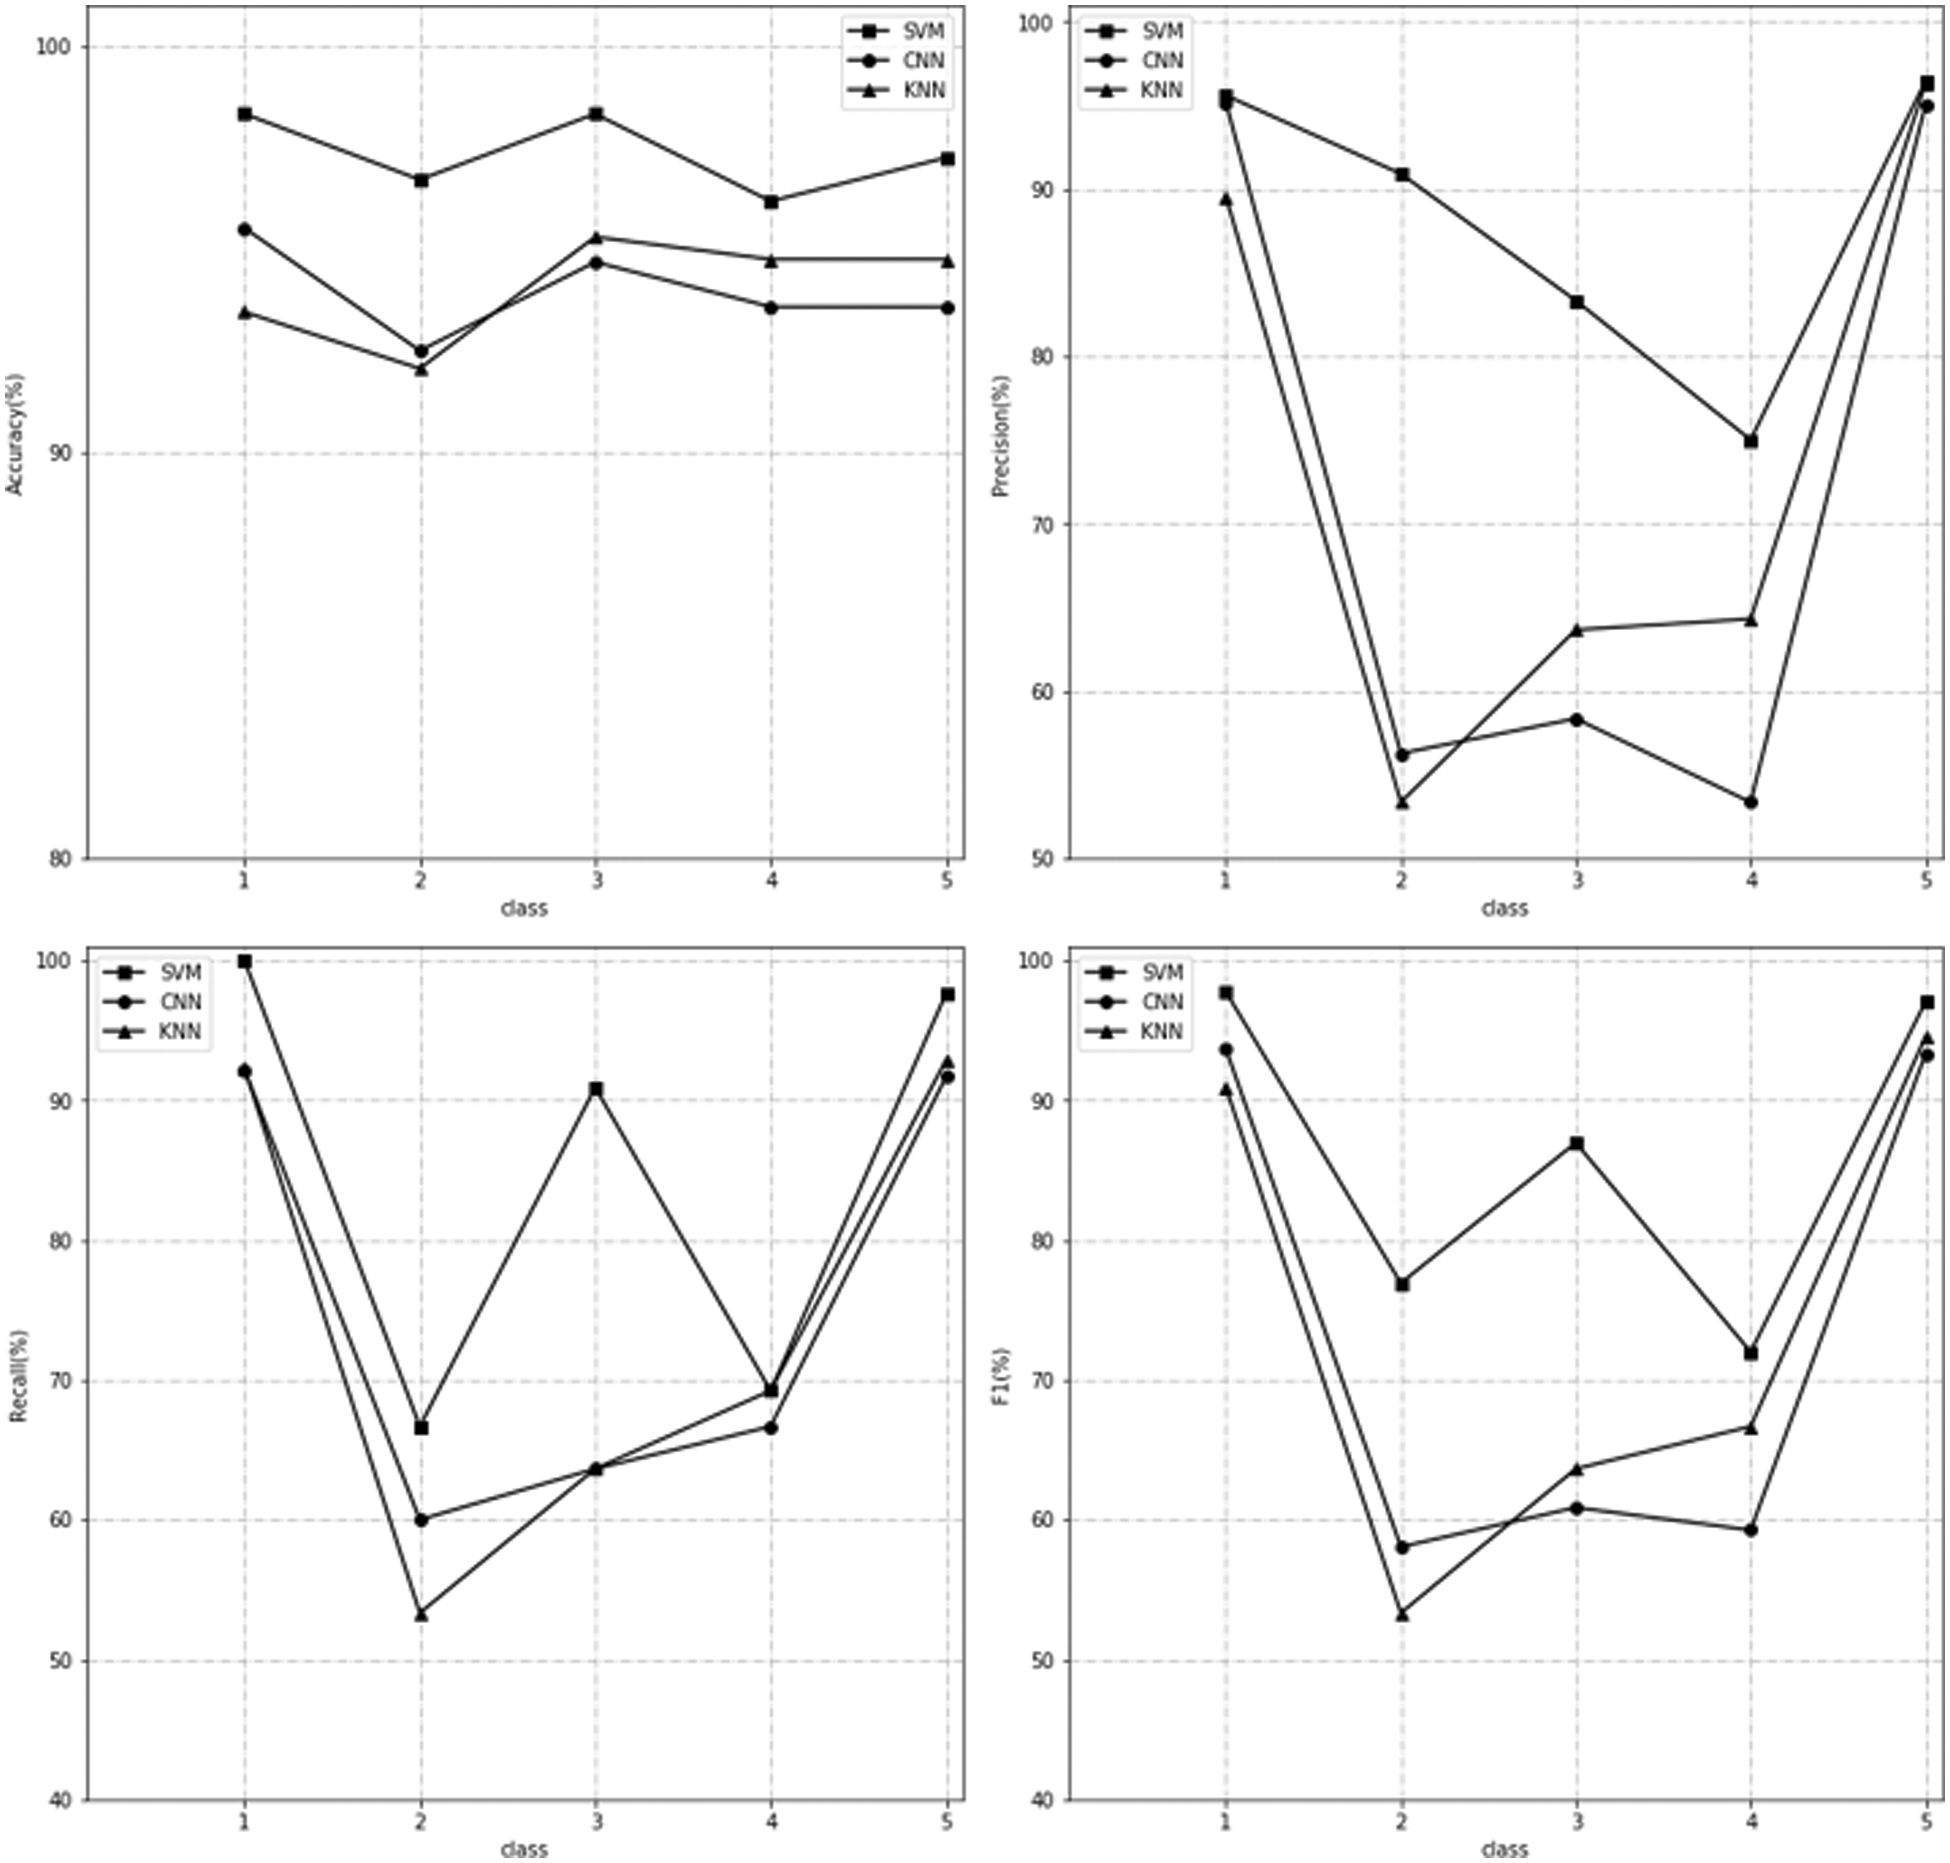
Figure 4: The performance of three models on separate classes
In the figure above, we show the performance of the KNN, SVM and CNN models in each class of the blood sample. The upper left picture shows the performance of the three models on the accuracy metric, the upper right picture shows the performance of the three models on the precision metric, the lower left picture shows the performance of the three models on the recall metric, and the lower right picture shows the performance of the three models on the F1-measure metric. It can be observed that the SVM method performs well in each category. Due to the limitation of the number of samples, 2, 3 and 4 have a certain gap compared with the 1 and 5 with a large number of samples, but they are still in the range of acceptance. Although CNN plays a good role in classification in many studies, because its network structure naturally requires a large amount of data to get a good fitting effect, the application effect in the scene of blood sample recognition is not good, and even the performance in some categories is not as good as the lighter KNN model. The identification of KNN is carried out by the categories of neighboring objects, while the characteristics of blood samples are combined by coagulation, attachment, discretization and other states, and there may be a large number of similar characters among some categories, which make the positions of these categories similar in the feature space. Therefore, although the amount of calculation of KNN model is less, it can adapt to the working environment of medical instruments, but the effect is not ideal.
In addition to the classification of each category, the overall performance of the model is also a concern, as shown in the Tab. 1.
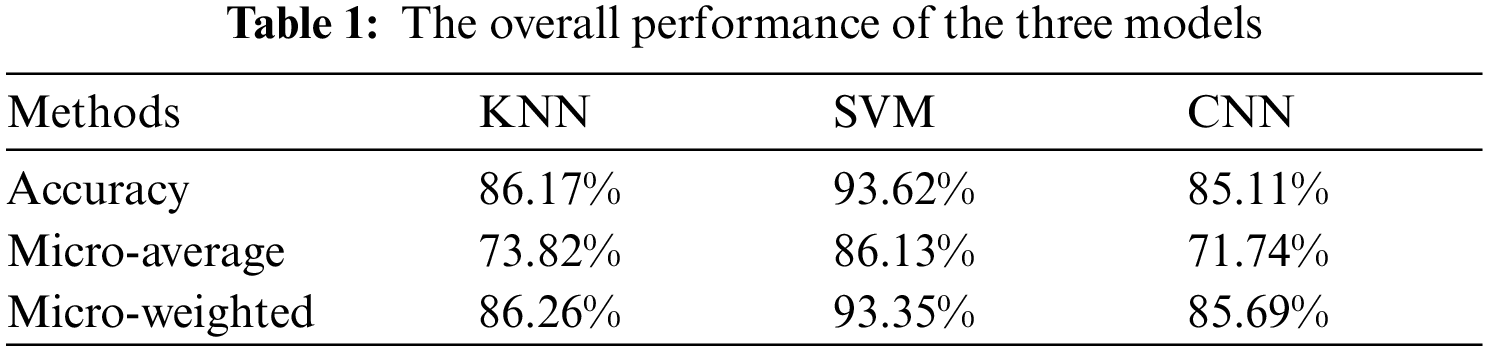
The above three indicators are the evaluation of the overall performance of the model. Accuracy does not pay attention to the classification of subcategories, but is obtained by comparing the number of all classified correct samples with the total samples. Micro-average is suitable for scenarios where the classification of each subclass is equally important, and it is the arithmetic average of the F1 index of the classification result of each subclass. Micro-weighted considers the unbalanced distribution of samples, which is the weighted average of F1 index of the classification results of each subclass, and its weight is the ratio of this kind of sample to the total samples. It can also be observed that the combination of SVM and HOG can play a better effect in the task of blood sample classification.
As mentioned in the 3.1 section, in the actual clinical research, the distinction between category 1 and other categories is the most concerned. At this time, the problem of blood sample classification will be simplified to a two-classification problem. The performance of the three models under this classification form are given in Tab. 2.
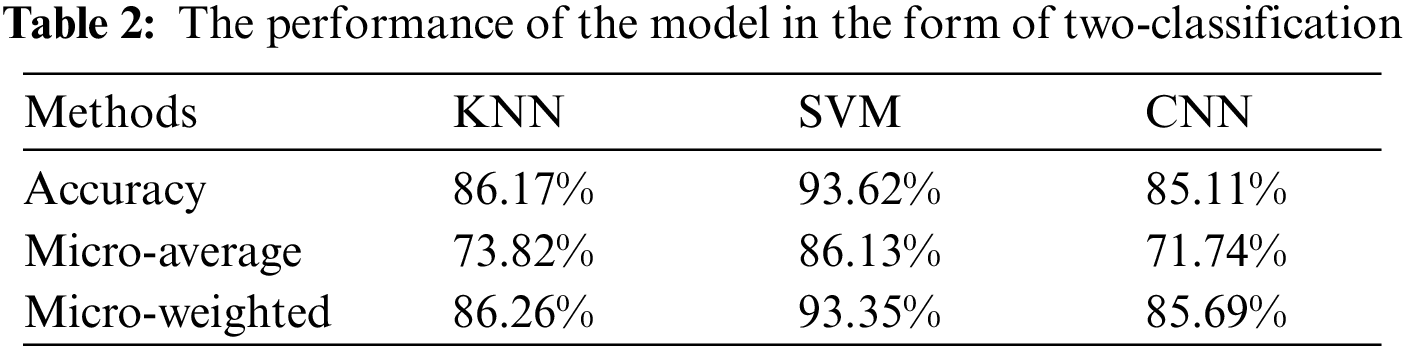
Through Tab. 2, it is obvious that the combination of SVM and HOG play a more prominent role in the classification of blood samples in the form of two-classification
It is very difficult to obtain real sample images in the medical field. The total number of samples is small, so that the number of samples of all categories is not very sufficient, downsampling, resampling and other methods will have a great impact on the whole data set. Can't be used. Consequently, the uneven distribution of samples is an urgent problem to be solved in optimizing the classification algorithm of blood samples.
The classification algorithm based on SVM and HOG in this paper has achieved good classification results, which indicates that this method has played a good effect in solving the problem of blood sample recognition and classification, but there are still aspects worthy of improvement. There is still room for improvement in the accuracy of classification, and only when a higher effect is achieved in the accuracy of classification, can it be effectively applied in the medical field. In addition, although SVM is a learning algorithm based on mathematical principles, it is still a black box model in essence, and its inherent classification logic is hard to explain. This method will be used in the medical field in the future, and highly interpretable technologies are frequently accepted in this field. In the future, further hints will be made on the interpretability of the classification method.
Funding Statement: Project supported by the National Natural Science Foundation, China (No. 62172123), the Fundamental Research Foundation for of Heilongjiang Province, China (No. 2019KYYWF0214), the Postdoctoral Science Foundation of Heilongjiang Province, China (No. LBH-Z19067), the special projects for the central government to guide the development of local science and technology, China (No. ZY20B11), the Heilongjiang Provincial Natural Science Foundation of China, China (No. YQ2019F010).
Conflicts of Interest: The authors declare that they have no conflicts of interest to report regarding the present study.
1. G. Amato and F. Falchi, “kNN based image classification relying on local feature similarity,” in Proc. of the Third Int. Conf. on Similarity Search and Applications, New York, NY, USA, pp. 101–108, 2010. [Google Scholar]
2. F. Giles M and A. Mathur, “The use of small training sets containing mixed pixels for accurate hard image classification: Training on mixed spectral responses for classification by a SVM,” Remote Sensing of Environment, vol. 103, no. 2, pp. 179–189, 2006. [Google Scholar]
3. Z. Xiong, K. Chen, C. Gu, Y. Liang and F. Yu, “An algorithm of image classification based on BP neural network,” in 2012 IEEE Int. Conf. on Computer Science and Automation Engineering (CSAE), Zhangjiajie, China, pp. 523–526, 2012. [Google Scholar]
4. J. Wang, Y. Yang, J. Mao, Z. Huang, C. Huang and W. Xu, “Cnn-rnn: A unified framework for multi-label image classification,” in Proc. of the IEEE Conf. on Computer Vision and Pattern Recognition (CVPR), New York, NY, USA, pp. 2285–2294, 2016. [Google Scholar]
5. S. Ling, F. Zhu and X. L. Li, “Transfer learning for visual categorization: A survey,” IEEE Transactions on Neural Networks and Learning Systems, vol. 26, no. 5, pp. 1019–1034, 2014. [Google Scholar]
6. R. S. Choras, “Image feature extraction techniques and their applications for CBIR and biometrics systems,” International Journal of Biology and Biomedical Engineering, vol. 1, no. 1, pp. 6–16, 2007. [Google Scholar]
7. E. S. Saber and A. Murat Tekalp, “Integration of color, edge, shape, and texture features for automatic region-based image annotation and retrieval,” Journal of Electronic Imaging, vol. 7, no. 3, pp. 684–700, 1998. [Google Scholar]
8. H. M. Kuei, “Visual pattern recognition by moment invariants,” IRE Transactions on Information Theory, vol. 8, no. 2, pp. 179–187, 1962. [Google Scholar]
9. A. K. Jain and A. Vailaya, “Image retrieval using color and shape,” Pattern Recognition, vol. 29, no. 8, pp. 1233–1244, 1996. [Google Scholar]
10. M. Flickner, H. Sawhney, W. Niblack, J. Ashley, Q. Huang, B. Dom, M. Gorkani, J. Hafner, D. Lee, D. Petkovic, D. Steele and P. Yanker, “Query by image and video content: The QBIC system,” Computer, vol. 28, no. 9, pp. 23–32, 1995. [Google Scholar]
11. G. Pass, and R. Zabih, “Histogram refinement for content-based image retrieval,” in Proc. Third IEEE Workshop on Applications of Computer Vision, Sarasota, FL, USA, pp. 96–102, 1996. [Google Scholar]
12. J. Huang, S. R. Kumar, M. Mitra, W. -J. Zhu and R. Zabih, “Image indexing using color correlograms,” in Proc. of IEEE Computer Society Conf. on Computer Vision and Pattern Recognition, San Juan, Puerto Rico, USA, pp. 762–768, 1997. [Google Scholar]
13. Z. D. Sheng and G. J. Lu, “Review of shape representation and description techniques,” Pattern Recognition, vol. 37, no. 1, pp. 1–19, 2004. [Google Scholar]
14. C. -F. Tsai and W. -C. Lin, “A comparative study of global and local feature representations in image database categorization,” in 2009 Fifth Int. Joint Conf. on INC, IMS and IDC, Seoul, Korea (Southpp. 1563–1566, 2009. [Google Scholar]
15. N. Dalal and B. Triggs, “Histograms of oriented gradients for human detection,” in 2005 IEEE Computer Society Conf. on Computer Vision and Pattern Recognition (CVPR'05), San Diego, CA, USA, pp. 886–893, 2005. [Google Scholar]
16. K. H. Chul and Z. Ghahramani, “Bayesian classifier combination,” in Artificial Intelligence and Statistics, PMLR, 2012. [Google Scholar]
17. B. Qin, Y. Xia, S. Prabhakar and Y. Tu, “A Rule-based classification algorithm for uncertain data,” in 2009 IEEE 25th International Conf. on Data Engineering, Shanghai, China, pp. 1633–1640, 2009. [Google Scholar]
18. C. Corinna and V. Vapnik, “Support-vector networks,” Machine Learning, vol. 20, no. 3, pp. 273–297, 1995. [Google Scholar]
19. B. Qin, Y. Xia, S. Prabhakar and Y. Tu, “A Rule-based classification algorithm for uncertain data,” in 2009 IEEE 25th International Conf. on Data Engineering, Shanghai, China, pp. 1633–1640, 2009. [Google Scholar]
20. T. Divya and S. Agarwal, “A comparison on multi-class classification methods based on least squares twin support vector machine,” Knowledge-Based Systems, vol. 81, pp. 131–147, 2015. [Google Scholar]
21. M. O. L. and D. R. Musicant, “Lagrangian support vector machines,” Journal of Machine Learning Research, vol. 1, pp. 161–177, 2001. [Google Scholar]
22. D. H. Santosh and G. M. Pillutla, “Improved face recognition rate using HOG features and SVM classifier,” IOSR Journal of Electronics and Communication Engineering, vol. 11, no. 4, pp. 34–44, 2016. [Google Scholar]
23. D. Fernández-Llorca, R. Arroyo and M. A. Sotelo, “Vehicle logo recognition in traffic images using HOG features and SVM,” in 16th Int. IEEE Conf. on Intelligent Transportation Systems (ITSC 2013), The Hague, Netherlands, pp. 2229–2234, 2013. [Google Scholar]
 | This work is licensed under a Creative Commons Attribution 4.0 International License, which permits unrestricted use, distribution, and reproduction in any medium, provided the original work is properly cited. |