2021 45(1): 189-198
DOI:10.32604/biocell.2021.011827
www.techscience.com/journal/biocell
| BIOCELL 2021 45(1): 189-198 DOI:10.32604/biocell.2021.011827 | www.techscience.com/journal/biocell |
| Article |
Acetyl-L-carnitine protects adipose-derived stem cells exposed to H2O2 through regulating AMBRA1-related autophagy
1The Second Affiliated Hospital and Yuying Children’s Hospital of Wenzhou Medical University, Wenzhou, 325000, China
2The First Affiliated Hospital of Wenzhou Medical University, Wenzhou, 325000, China
3Huzhou Hospital of Traditional Chinese Medicine, Huzhou, 313000, China
*Address correspondence to: Ming Lin, lmlmlm600@163.com
Received: 31 May 2020; Accepted: 24 August 2020
Abstract: The cell activity of adipose-derived stem cells (ADSCs) is affected by the intracellular reactive oxygen species (ROS) and the level of autophagy. Previous studies reveal that acetyl-L-carnitine (ALC) possesses capacities of resisting oxidative stress and regulating autophagy. Activating molecule in Beclin1-regulated autophagy protein 1 (AMBRA1) plays a key role in initiating Beclin1-regulated autophagy. In the present study, we discovered ALC pretreatment (1 mM, 24 h) significantly increased the activity of ADSCs exposed to H2O2 (100 μM, 2 h) in vitro with improved stemness, and reduced the production of intracellular ROS. In addition, we found for the first time that ALC treatment up-regulated autophagy of ADSCs through strengthening the expressions of Beclin1 and AMBRA1 synchronously, which might be involved in the protective effect of ALC.
Keywords: Oxidative stress; Cell activity; Autophagy-related proteins; Antioxidant enzymes
Mesenchymal stem cells (MSCs) possess self-renewal capacity and multilineage differentiated potential with low immunogenicity and anti-inflammation (Gholizadeh-Ghaleh Aziz et al., 2017).
In addition to the advantages mentioned above, adipose-derived stem cells (ADSCs) are easily available from fat and have better compatibility with tissue engineering scaffolds, which make them to be widely applied in regenerative medicine and cell therapy such as cell-assisted lipotransfer (CAL) (Dai et al., 2016; Mizuno et al., 2012). However, the cells are exposed to a lot of oxidative stresses during and after transplantation, which produces a negative impact on cell activity and graft survival. It is vital to explore how oxidative stress damages ADSCs and how to resist it.
Activating molecule in Beclin1-regulated autophagy protein 1 (AMBRA1) plays a key role in Beclin1-mediated autophagy. When exposed to stresses (such as nutrient starvation, DNA damage, or β-galactosidase over-expression), AMBRA1 located in mitochondria links to Beclin1 and enhances the connection of Beclin1 and PIK3C3 (Phosphoinositide-3-Kinase Class 3, VPS34) (Xia et al., 2013; Yang et al., 2019), and AMBRA1 anchored to actin filaments separates from dynein light chains 1 (DLC1) and helps Beclin1-PIK3C3 complex move to the endoplasmic reticulum (Di Bartolomeo et al., 2010; Nazio et al., 2013), which then lead to the formation and extension of the autophagosome. Meanwhile, the combination of AMBRA1 and Beclin1 also competitively influences Beclin1-Bcl-2 binding, reducing the inhibition of Bcl-2 on autophagy (Strappazzon et al., 2011). The genetic ablation or degradation of AMBRA1 inhibits autophagy (Li et al., 2016; Liu et al., 2019; Pagliarini et al., 2012; Russo et al., 2018), and over-expression of AMBRA1 promotes autophagy and prolongs the time before apoptosis (Yang et al., 2019). Therefore, upregulating the expression of AMBRA1 may have a protective effect on cells under stress.
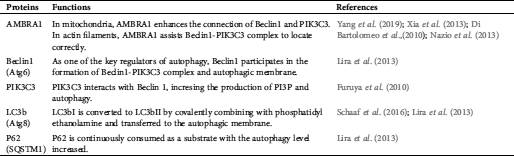
L-carnitine (LC) has been shown to retard the aging process of ADSCs through a variety of mechanisms (Farahzadi et al., 2018; Mobarak et al., 2017). It also alleviates the damage induced by H2O2 by regulating reactive oxygen species (ROS) (Shafiei et al., 2020; Ye et al., 2010). As the esterification form of LC, Acetyl-L-carnitine (ALC) possesses functionality similar to LC (Rebouche, 2004) and down-regulates ROS formation (Bodaghi-Namileh et al., 2018). However, there is little literature elaborating whether AMBRA1-related autophagy participates in the procedure. Therefore, we pretreated H2O2-exposed ADSCs with ALC, detected the intracellular ROS, and investigated the changes of autophagy level and the expressions of related proteins. The autophagy-related proteins assessed in the present study and their functions were listed as below (Tab. 1).
Table 1: Autophagy-related proteins involved in this study
The adipose tissue prepared for extracting ADSCs was provided from 5 randomly selected adult patients who experienced fat liposuction (one male and four females between ages 26 and 38). All patients signed the informed consent for scientific research and publication. This study was approved by the Research Ethics Committee of Wenzhou Medical University.
Human Adipose-derived Stem Cell Complete Medium, Mesenchymal Stem Cell Adipogenic Differentiation Medium, Mesenchymal Stem Cell Osteogenic Differentiation Medium and Mesenchymal Stem Cell Chondrogenic Differentiation Medium were purchased from Cyagen Biosciences (HUXMD-90011, GUXMX-90031, GUXMX-90021, GUXMX-90041, Guangzhou, CHN). Collagenase I and H2O2 were purchased from Sigma (C0130, 88597, San Francisco, USA). Cell Counting Kit-8 was purchased from Dojindo (CK04, Fukuoka, JPN). Cell-Light Edu Apollp567 In Vitro Imaging Kit was purchased from RiboBio (C10310, Guangzhou, CHN). Reactive Oxygen Species Assay Kit, 4% paraformaldehyde and RIPA lysis buffer were purchased from Solarbio Science (CA1410, P1110, R0010, Beijing, CHN). The antibodies used in this study were obtained from the following suppliers: Beclin1 (sc-48341, 1:1000 for WB, 1:200 for IF) were obtained from Santa Cruz Biotechnology (Santa Cruz, USA). AMBRA1 (ab69501, 1:1000 for WB, 1:200 for IF) were obtained from Abcam (Cambridge, UK). Caspase3 (AF6311, 1:1000 for WB) and catalase (CAT, DF7545, 1:1000 for WB) were purchased from Affinity Bioscience (Ohio, USA). PI3KC3 (504021, 1:500 for WB) was purchased from ZEN BIO (Shanghai, CHN). NANOG (K003637P), SOX2 (K101546P), OCT4 (K005554P), superoxide dismutase 1 (SOD1, K106503P), p62 (K106574P) (all the above were diluted for 1000 times for WB), MAP1LC3b (K008014P, 1:500 for WB), GAPDH (K200057M, 1:2000 for WB) were purchased from Solarbio Science (Beijing, CHN). All other reagents and chemicals were commercially available and of the highest quality.
Acquisition and identification of adipose-derived stem cells
The adipose tissue was cut into granules and washed with PBS thoroughly. After digested with 0.25% collagenase I at 37°C at a speed of 275 rpm for 40 min, the mixture was filtered with a 100-mesh strainer and a 200-mesh strainer and centrifuged at 1200 rpm for 5 min. Then the pellet was washed once to remove red blood cells and resuspended with complete medium at 5% CO2 and 37°C. The passage process was carried out when the full confluence was achieved, and the cells at passage 5 were used in this study.
There are two essential requirements for the identification of human mesenchymal stem cells that include the detection of membrane cluster differentiation antigens and multi-lineage differentiation (Fathi et al., 2019a, 2019b). Our research group detected the phenotypic characteristics of ADSCs obtained by the same extraction method using flow cytometry, which showed that the stem cell markers, including CD29, CD90, and CD73, except for CD34 and HLA-DR, were positive (He et al., 2019).
Cells (passage 5) prepared for multi-lineage differentiation experiments were first seeded onto a 6-well plate at a density of 4×10⁵ cells/well in complete medium for 2 days at which time the cell confluence reached 60%. For adipogenesis assay, ADSCs were washed thoroughly and incubated in a Human Mesenchymal Stem Adipogenic Kit consisting of insulin, dexamethasone, 3-isobutyl-1-methylxanthine, and rosiglitazone for 2 weeks according to the manufacturer’s instructions. Osteogenesis assay was similar to adipogenesis assays except that the medium was replaced with Human Mesenchymal Stem Osteogenesis Kit based on dexamethasone, β-glycerophosphate, and L-ascorbic acid-2-phosphate. For chondrogenesis assay, cells in per-well were detached to a 15 mL centrifuge tube and aggregated into a sphere by centrifuging for 4 min at 250×g. Then the cell sphere was incubated in Human Mesenchymal Stem Chondrogenesis Kit consisting of dexamethasone, ascorbate, ITS supplement, sodium pyruvate, proline, TGF-β3, and basal medium for 3 weeks according to the manufacturer’s instructions, followed with sectioning procedure. After the samples were fixed, Oil red O, Alizarin red, and Alcian blue staining were conducted. The samples were imaged under an Olympus CKX41 microscope (Japan).
Seeded onto a 96-well plate at 5000 cells/well in complete medium for 1 day, ADSCs were successfully treated with H2O2 (50, 100, 150, 200, or 250 µM) for 2 h, washed with PBS, and incubated in complete medium containing 10% Cell Counting Kit-8 (CCK-8) for 1 h at 37°C. The control group and the blank group were set up simultaneously. The optical density (OD) values were calculated using a SPECTRA max 384 microplate reader (USA) and analyzed to determine the most appropriate concentration of H2O2 (100 µM).
ADSCs pretreated with ALC (0.1, 0.5, 1, 5 or 10 mM) for 24 h were successfully washed with PBS once, exposed to 100 µM H2O2 for 2 h, washed again, and detected using the CCK-8 test as above to determine the most suitable concentration of ALC (1 mM). The control group and the H2O2 group were established simultaneously. Cell activity was expressed as ratios of all groups to the control group in OD values. In addition, 3-methyladenine (3-MA, 5 mM) was added into the cells for 3 h prior to ALC and H2O2 treatment to study the role of autophagy in the procedure. The CCK-8 test and an analysis of the results were performed as above. The experiment was performed in quadruplicate and repeated three times independently.
5-ethynyl-2’-deoxyuridine (EdU) staining
In order to assess the DNA replication of ADSCs, cells were seeded at 5 × 10⁵ cells/well in a 12-well plate and treated as above. After washed with PBS twice, cells were incubated for 2 h in complete medium containing 50 μM EdU and then fixed using 4% paraformaldehyde, followed with staining using Apollo and Hoechst33342 according to the manufacturer’s instructions. Finally, the cells were observed under an ECLIPSE TI fluorescence inverted microscope (Japan) with 550 nm excitation wavelength and 565 nm emission wavelength. This experiment was done in triplicate and repeated independently three times.
In order to detect intracellular ROS, cells were cultured and treated as above. After labeled using 10 μM 2’,7’-dichlorodihydrofluorescein diacetate (DCFH-DA) for 20 min at 37°C according to the manufacturer’s instructions, cells were washed twice in PBS and observed under a fluorescence inverted microscope with 484 nm excitation wavelength and 525 nm emission wavelength. The number of replicates and sample size were set in the same way as EdU staining.
After treated as above, cells were fixed with 4% paraformaldehyde, washed with PBS for three times, and sealed with 10% FBS at room temperature for 1 h, followed with incubation in rabbit anti-human primary antibody against AMBRA1 and mouse anti-human primary antibody against Beclin1 at 4°C overnight. Then the samples were washed thoroughly and incubated in goat anti-rabbit (Dylight 594) and goat anti-mouse (Dylight 488) second fluorescent-labeled antibodies for 1 h in dark condition. Afterward, cells were stained with DAPI and observed under a fluorescence microscope (493 nm excitation wavelength and 518 nm emission wavelength for Dylight 488, 591 nm excitation wavelength and 616 nm emission wavelength for Dylight 594, and 359 nm excitation wavelength and 461 nm emission wavelength for DAPI).
Cells were treated as above. RIPA lysis buffer (Solarbio, CHN) was used to obtain proteins whose concentrations were determined using a BCA kit. Then the samples were boiled and subjected to sodium salt-polyacrylamide gel electrophoresis (SDS-PAGE), followed with Western Blot analysis which was performed according to a previous study (Pagliarini et al., 2012). The primary antibodies against NANOG, SOX2, OCT4, SOD1, CAT, LC3b, p62, Beclin1, caspase3, AMBRA1, PIK3C3, GAPDH and sheep anti-rabbit second antibody were used in this experiment. Finally, the blots were imaged using a ChemiDoc MP imager (Bio-Rad, USA) and analyzed by Image Lab software (Bio-Rad). Co-IF and Western Blot were respectively repeated three times, and samples for each experiment were prepared independently.
The data obtained were expressed as mean ± standard error of the mean (SEM). Statistical analysis was conducted by SPSS 19.0 using one-way ANOVA with the LSD t-test (α = 0.05). A statistical difference with a p-value of < 0.05 was considered significant.
Acquirement and identification of ADSCs
Cells at passage 5 exhibited spindle-shaped morphologies and arranged in swirled (Fig. 1). The results of differentiation induction showed that there were plenty of lipid droplets, bone nodules, and cartilaginous acid mucopolysaccharide under the microscope (Fig. 1), manifesting the ability of multiple-directional differentiation of the extracted cells.
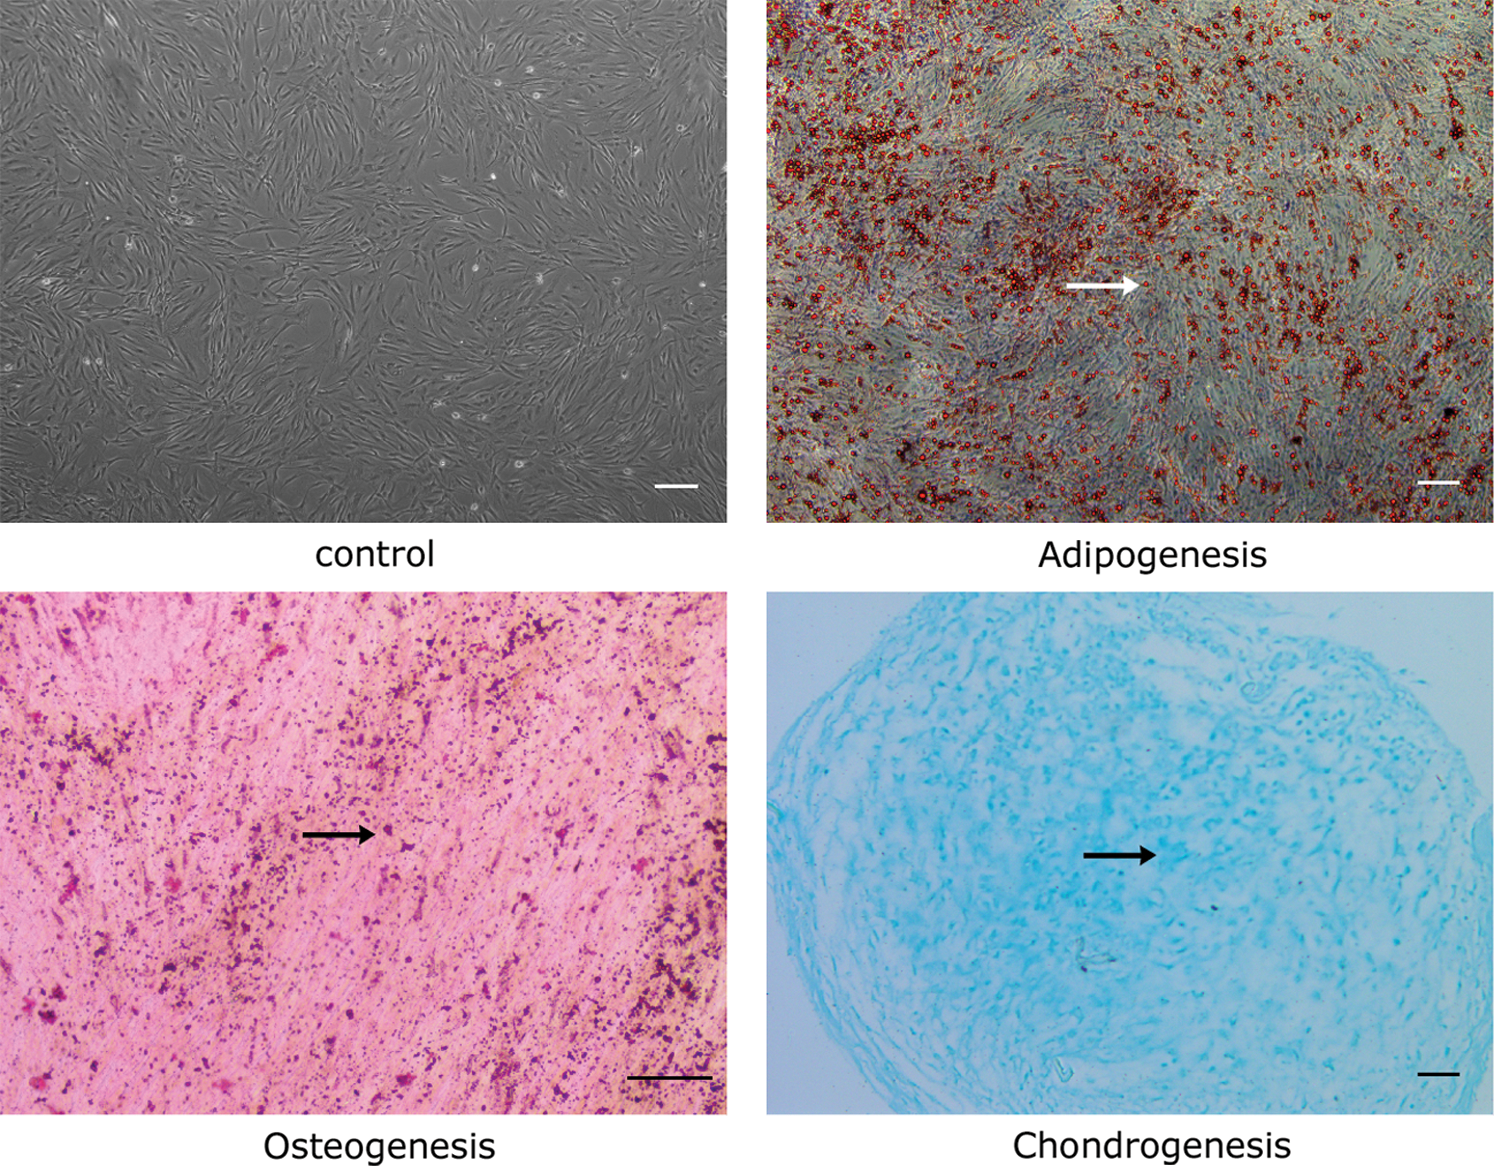
Figure 1: Differentiation of ADSCs. Adipogenic, osteogenic, and chondrogenic differentiation of ADSCs in vitro. Cells at passage 5 became fusiform and fused into a whirlpool-like arrangement. Differentiated cells stained by Oil red O and Alizarin red were imaged under an inverted phase-contrast microscope. Cells stained with Alcian blue were imaged under a light microscope. Arrows represent lipid droplets, bone nodules, and acidic mucopolysaccharides, respectively. Scale bar = 200 μm.
ALC improved the cell activity of ADSCs exposed to H2O2
As seen in the CCK-8 test, the cell activity of ADSCs exposed to H2O2 decreased significantly for 2 h (fell to 63.92 ± 1.75% with 100 μM H2O2) and seemed to reach a plateau when the H2O2 concentration is higher than or equal to 150 μM, indicating that the stem cells had been severely damaged (Fig. 2a). Therefore, we treated ADSCs with H2O2 at 100 μM for 2 h in subsequent experiments to stress stem cells. Cell activity recovered with ALC pretreatment for 24 h prior to H2O2 and rebounded significantly to 82.78 ± 2.81% when the concentration of ALC was at 1 mM (Fig. 2b). Preincubating cells with 5 mM 3-MA for 3 h neutralized the effect of 1 mM ALC as the cell activity was reduced to a level (73.33 ± 1.11%) closer to that of the H2O2 group, indicating that 1 mM ALC and 5 mM 3-MA were suitable for the subsequent experiments (Fig. 2c). In addition, we discovered that the protective effect of 5 mM ALC became weaker (75.08 ± 1.07%), and there was no significant difference between the 10 mM ALC group (61.92 ± 1.38%) and the H2O2 group (66.90 ± 1.82%) (Fig. 2b).
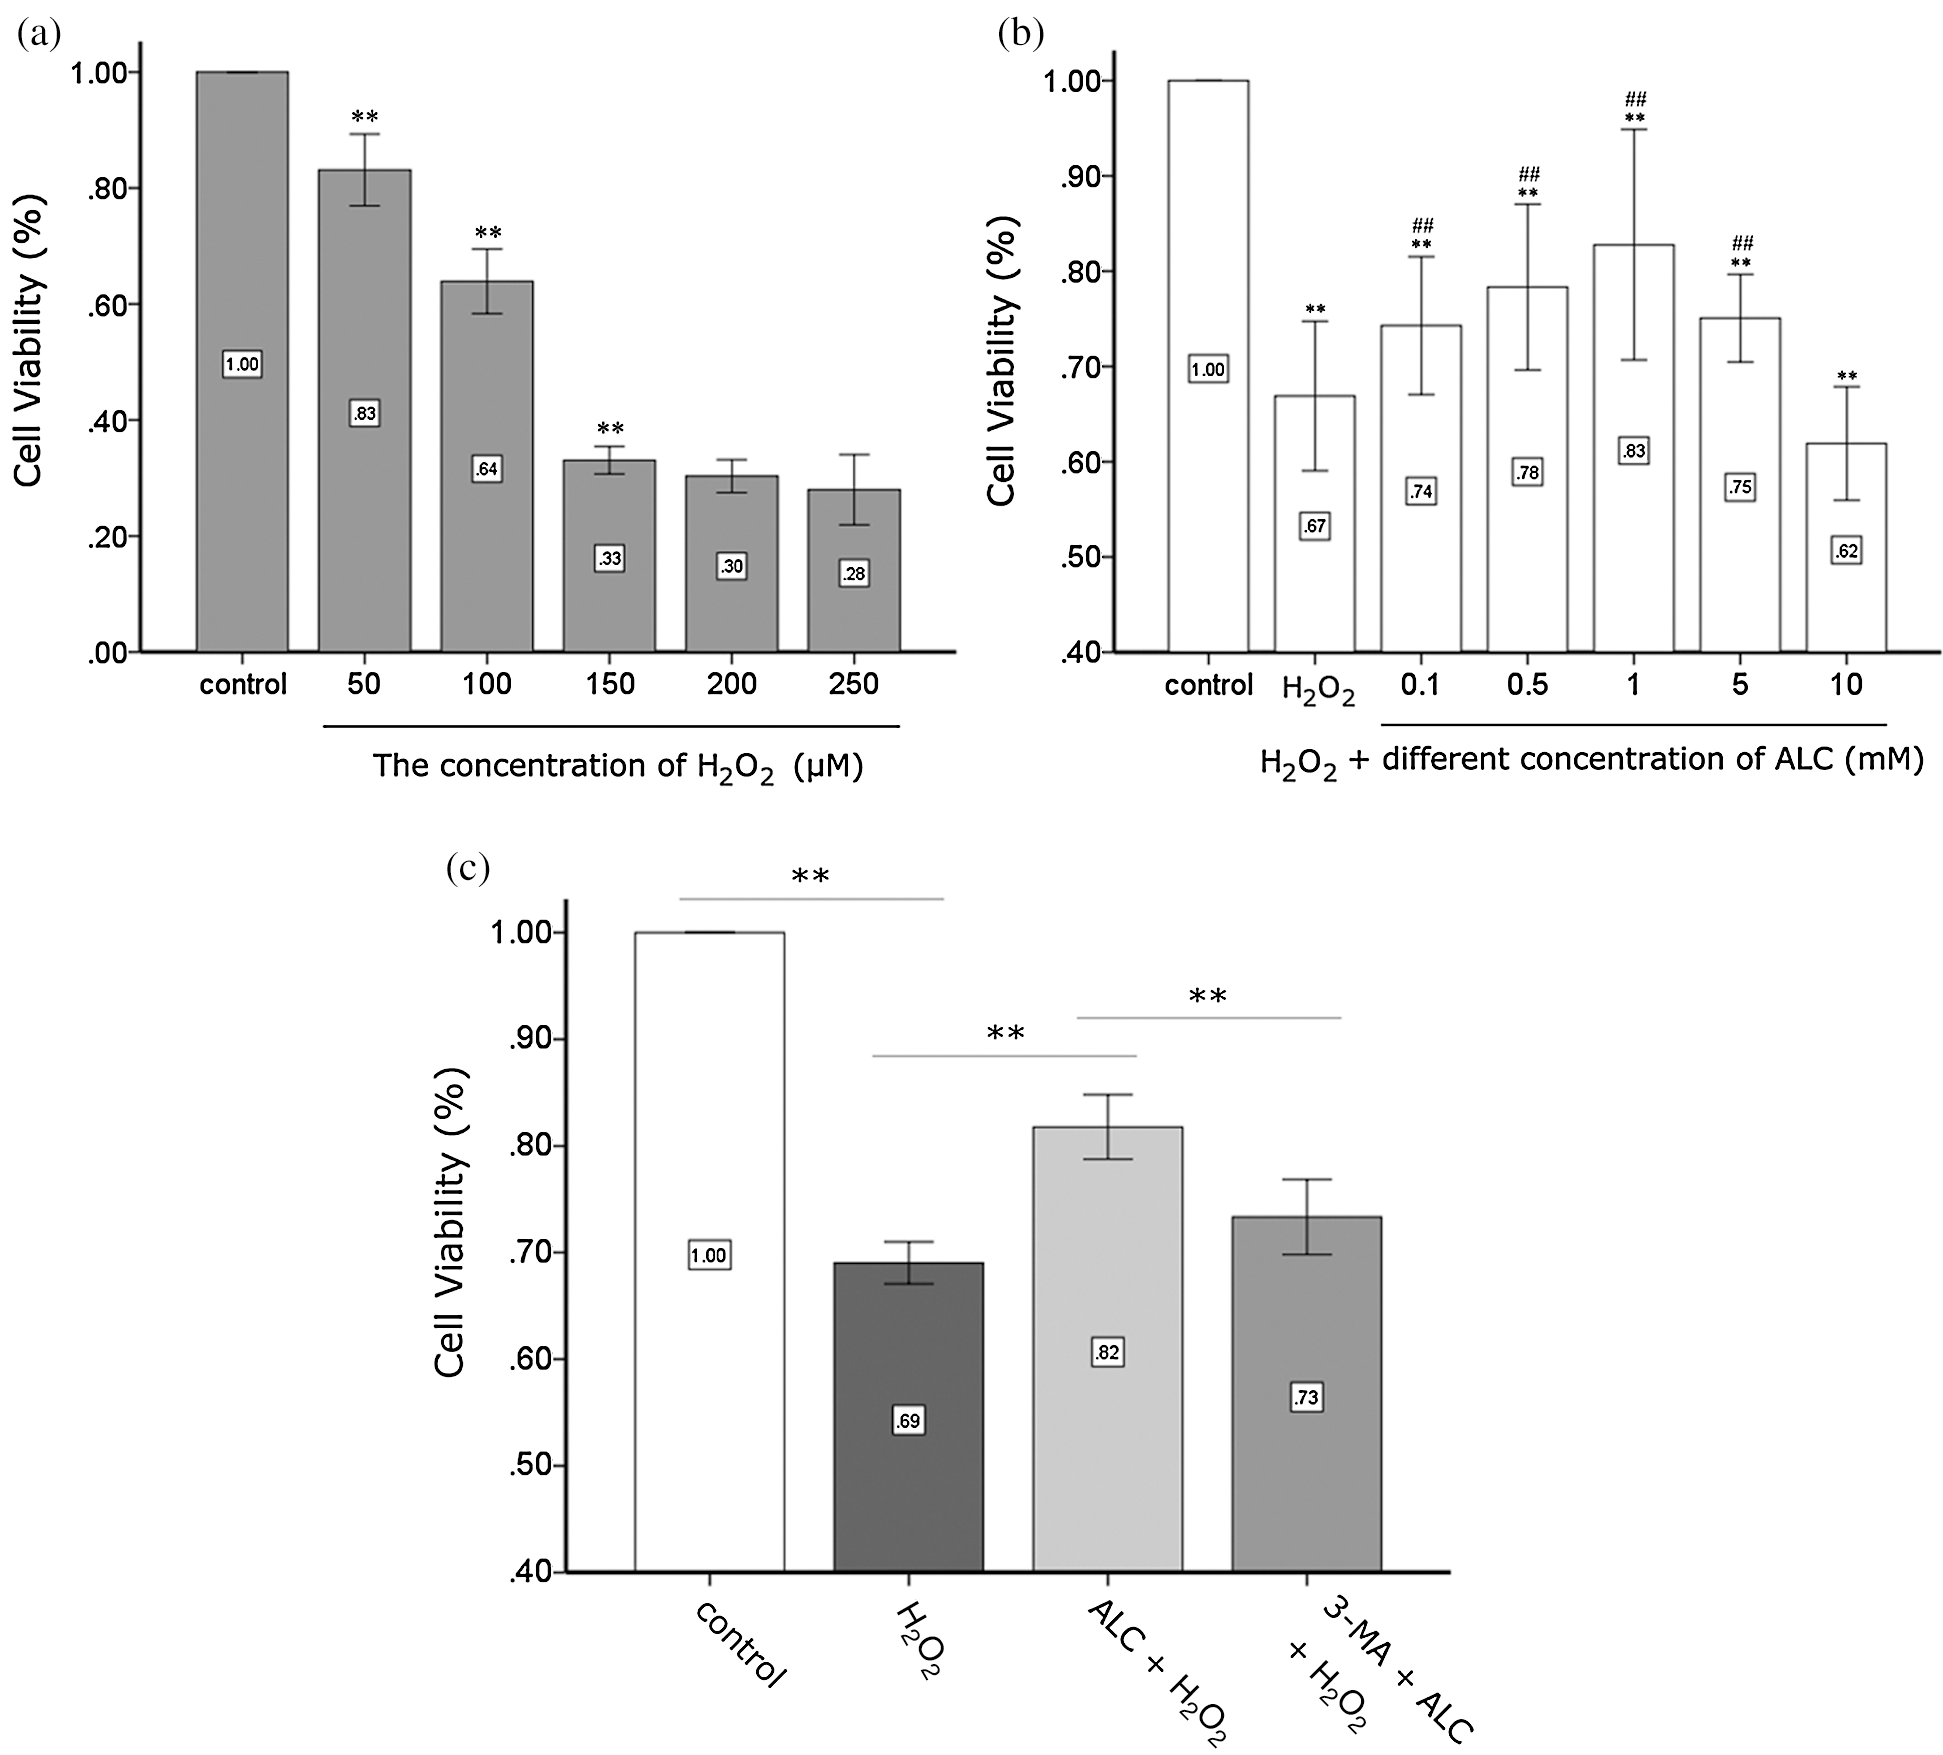
Figure 2: Detection of cell activity. (a) Determination of the concentration of H2O2. ADSCs were treated with H2O2 (50, 100, 150, 200, and 250 µM) for 2 h and detected using the CCK-8 test. **p < 0.01, when compared with the former group (n = 4). (b) Determination of the concentration of ALC. ADSCs were pretreated with or without ALC (0.1, 0.5, 1, 5, and 10 mM) for 24 h, treated with 100 µM H2O2 for 2 h, and detected by the CCK-8 test. **p < 0.01, when compared with the control group. #0.01 < p < 0.05, ##p < 0.01, when compared with the H2O2 group (n = 4). (c) Effect of autophagy on the viability of ADSCs exposed to H2O2. After pretreated with 5 mM 3-MA for 3 h and 1 mM ALC for 24 h successively, cells were exposed to 100 µM H2O2 for 2 h and detected by the CCK-8 test. **p < 0.01, *0.01 < p < 0.05; (n = 4). The results are expressed as the ratios of all groups to the control group in the OD values.
In addition, treatment with H2O2 or 3-MA decreased the percentage of EdU-stained ADSCs whose DNA replication rate was higher, while ALC significantly increased it (Figs. 3a and 3b). Moreover, the result of Western Blot showed that the expression of stemness-related proteins (NANOG, SOX2 and OCT4) significantly decreased with H2O2 treatment, increased with ALC pretreatment, and decreased again with ALC plus 3-MA pretreatment (Figs. 3c and 3d).
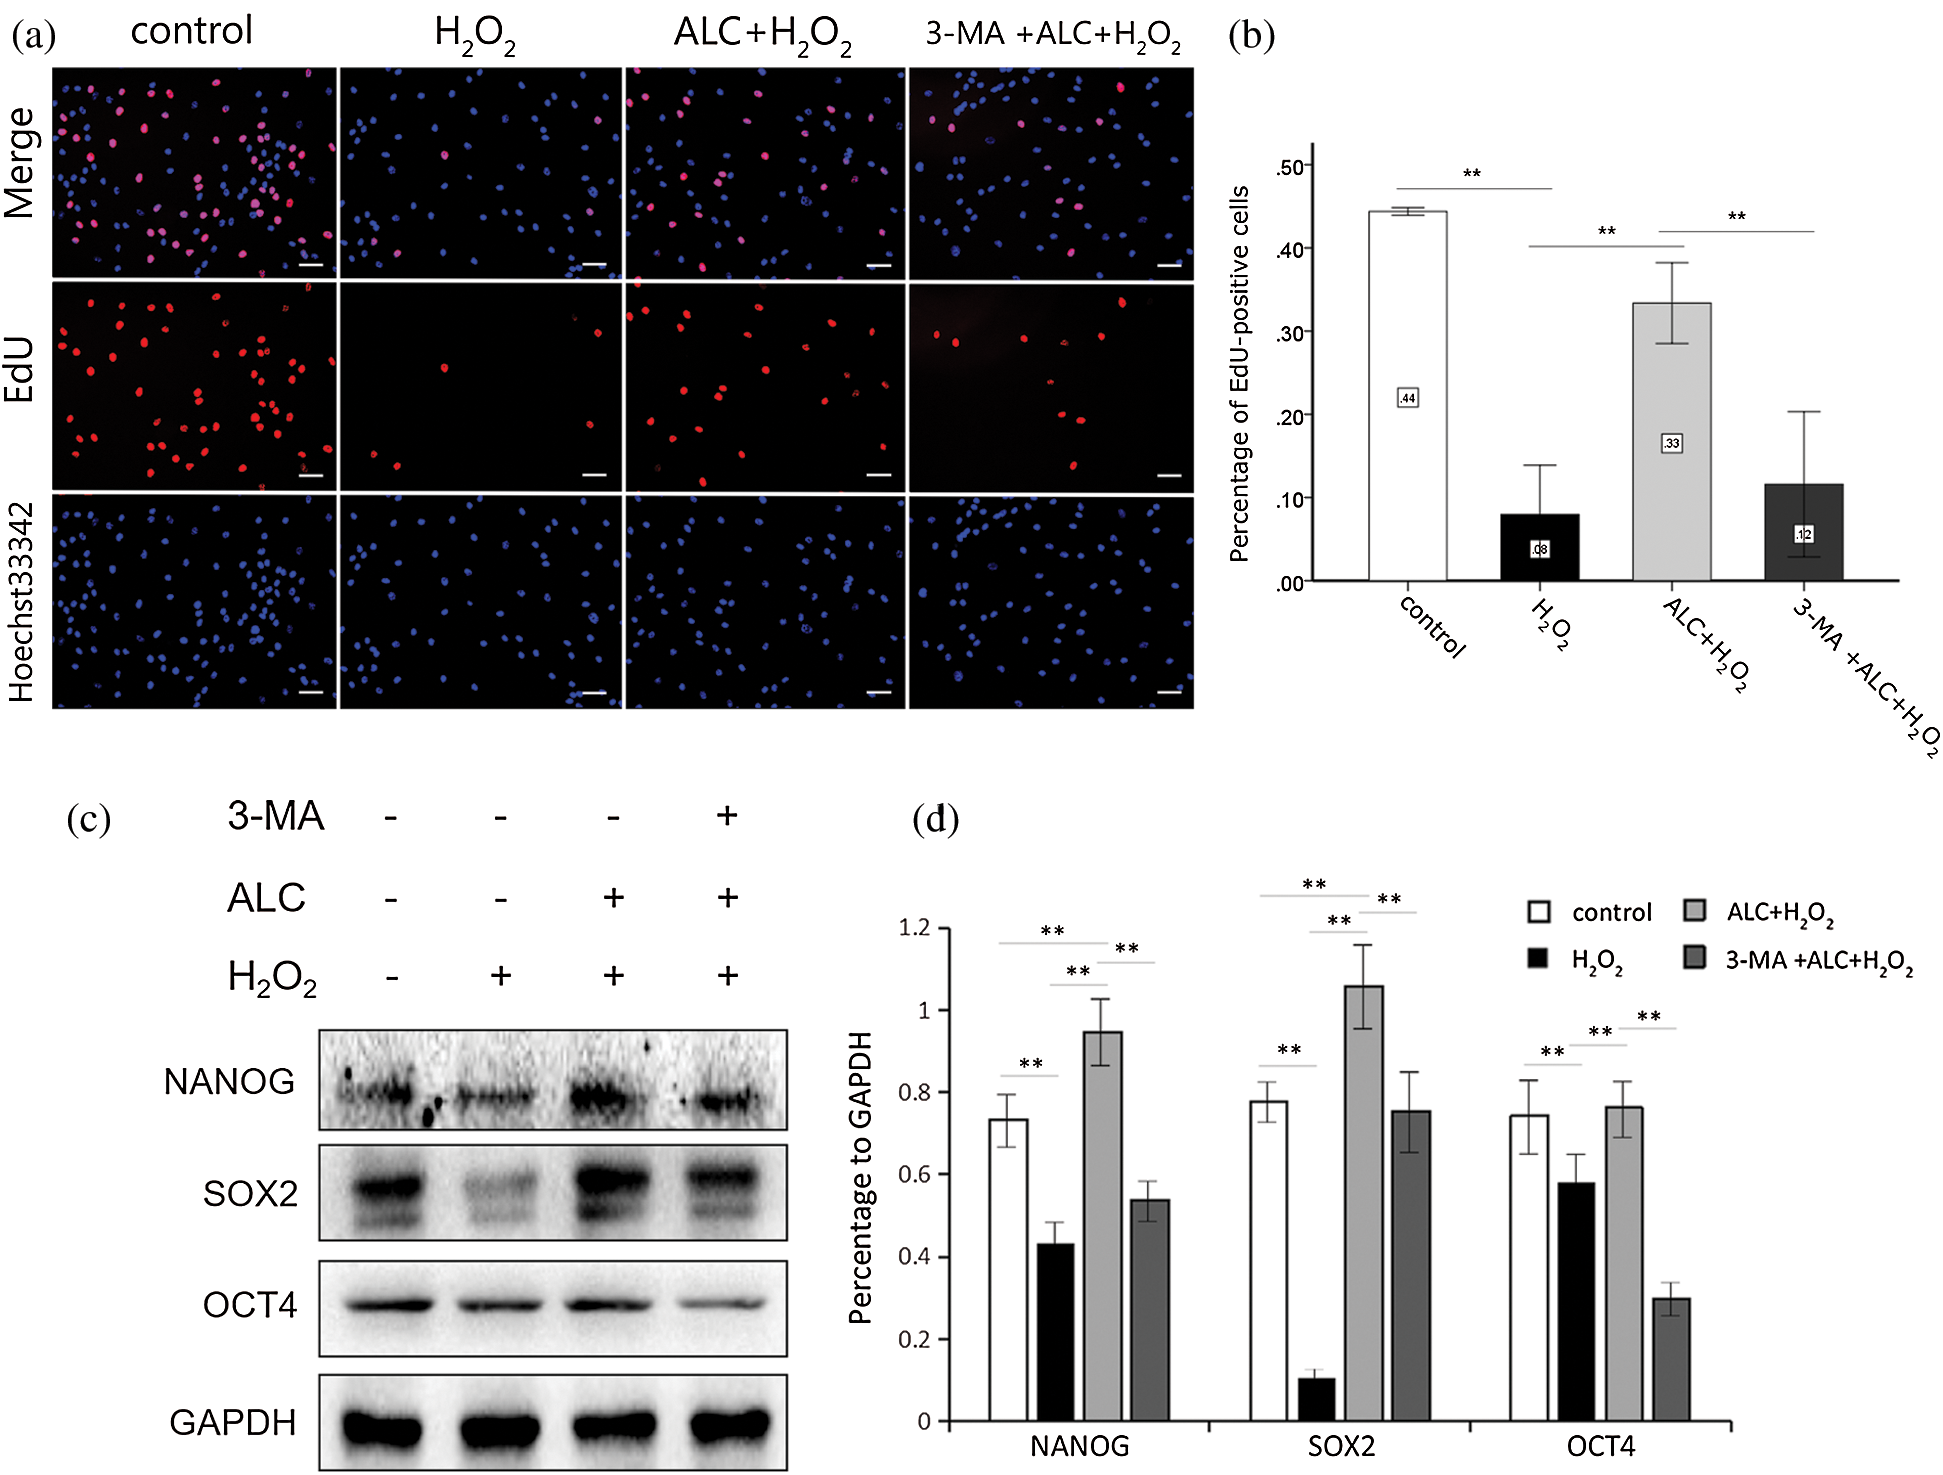
Figure 3: EdU staining. (a) Pretreated with or without 3-MA (5 mM, 3 h) and ALC (1 mM, 24 h) successively, the cells were exposed to H2O2 (100 µM, 2 h). EdU staining was conducted and images were obtained under an inverted fluorescence microscope. Scale bar =100 μm. (b) The results are expressed as the ratios of the numbers of EdU-Apollo-positive cells (red) to those of DAPI-positive cells (blue). **p < 0.01 (n = 3). (c) Western Blot was performed to determine the expressions of NANOG, SOX2 and OCT4. (d) The results are expressed as the ratios of the target proteins to GAPDH in density values of the blots, and equal loading of proteins is confirmed by GAPDH. **p < 0.01 (n = 3).
ALC regulated intracellular ROS induced by H2O2 and increased antioxidant enzymes
The results of ROS staining showed that H2O2 significantly increased the percentage of ROS-positive cells with fluorescent green, while pretreatment with ALC significantly reversed the tendency. However, the content of intracellular ROS increased again when 3-MA was added prior to ALC (Figs. 4a and 4b).
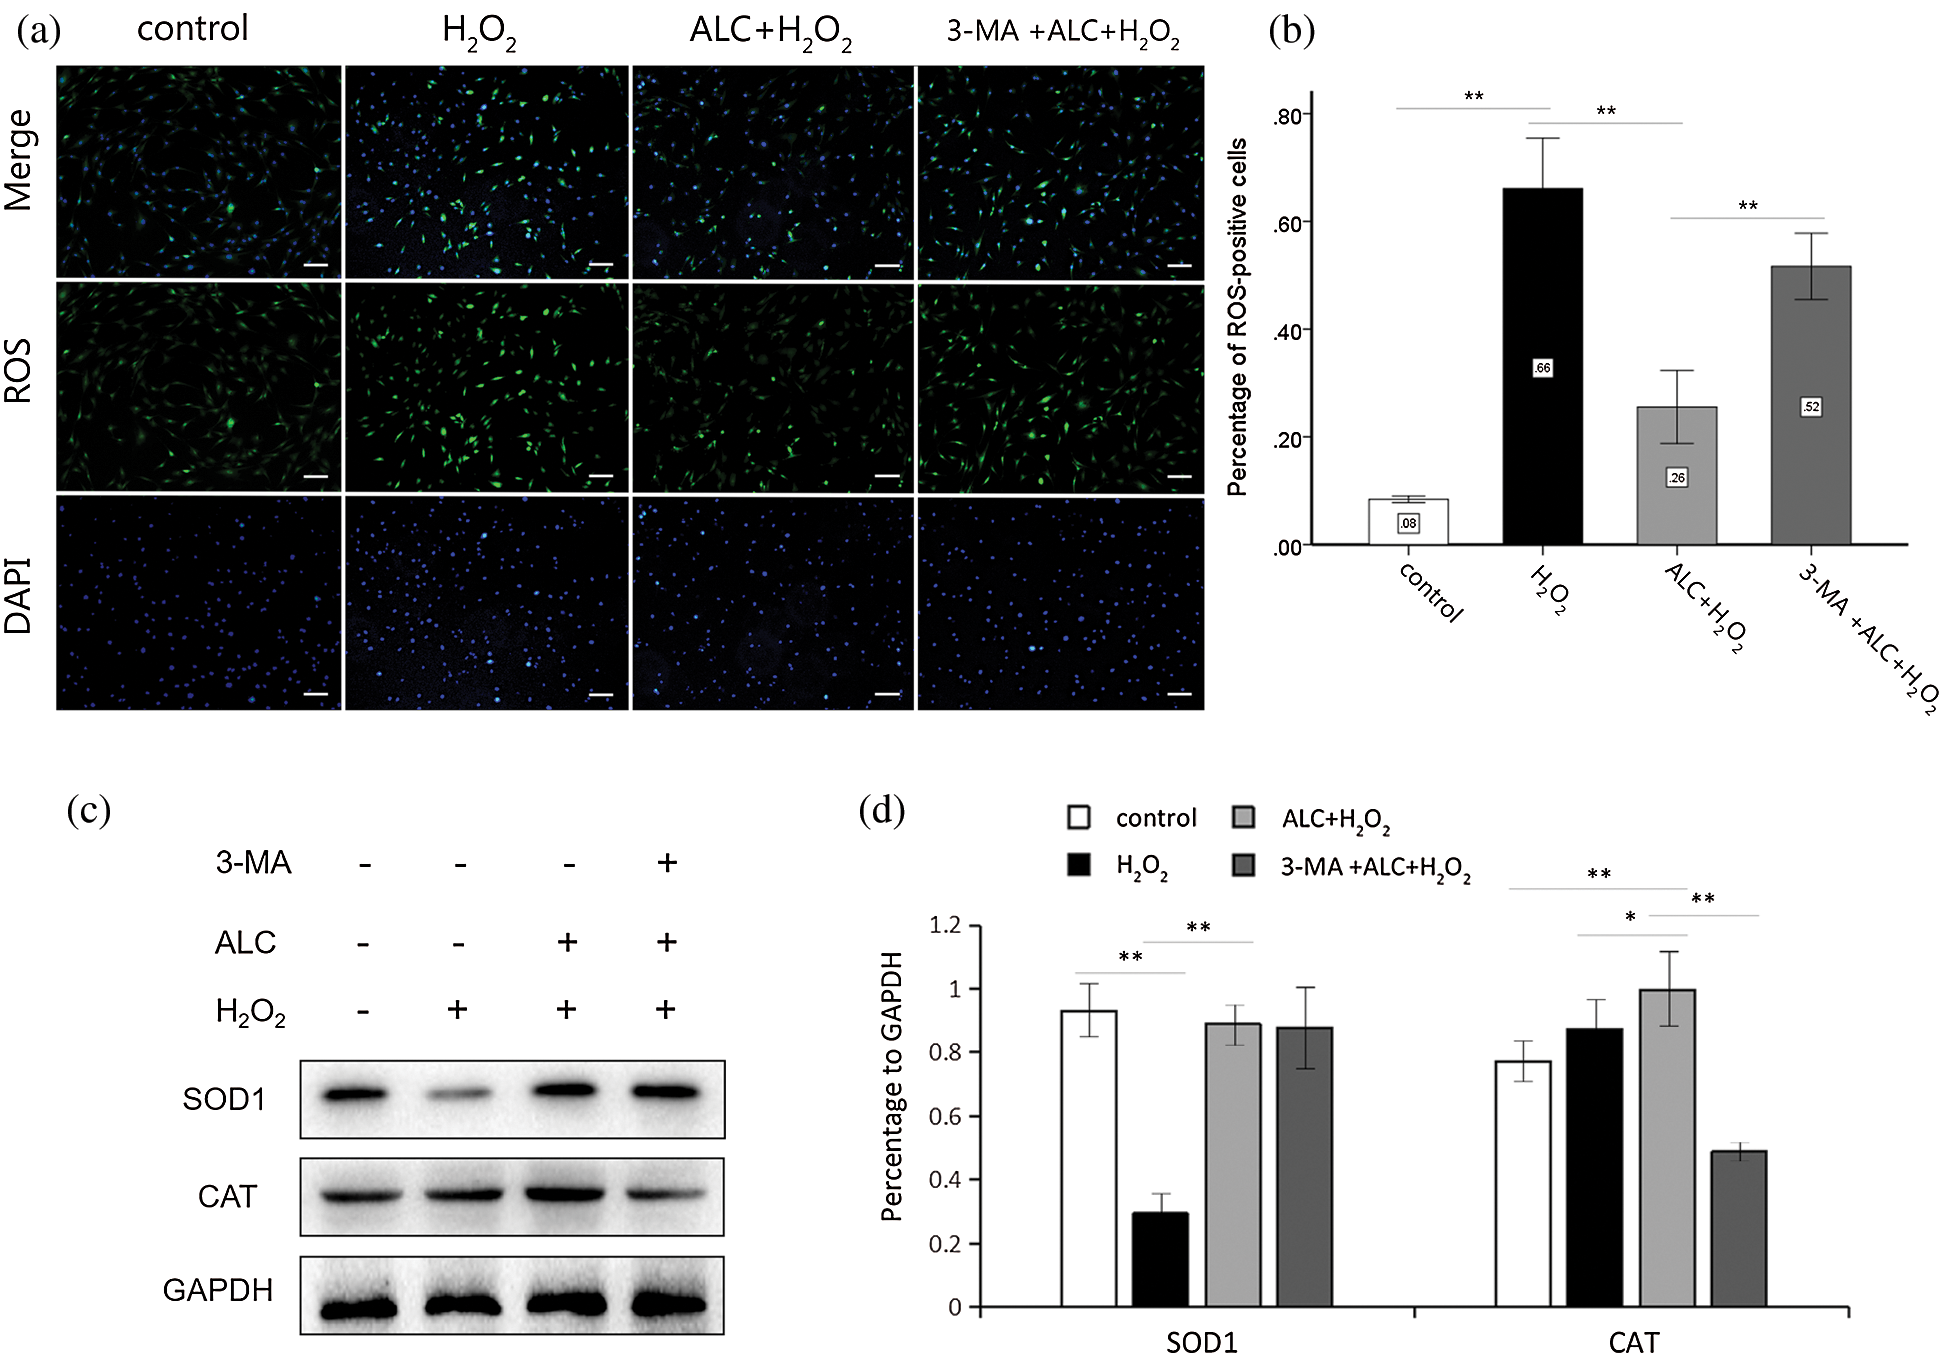
Figure 4: Detection of ROS and antioxidant enzymes. (a) Cells were treated as above. ROS detection was conducted using Reactive Oxygen Species Assay Kit. ROS-positive cells glowed green fluorescence under an inverted fluorescence microscope. Scale bar = 100 μm. (b) The percentages of the ROS-positive cells in all group were calculated for statistical analysis. **, p < 0.01. n = 3. (c) The expressions of SOD1 and CAT were detected by Western Blot. (d) The results are expressed as the ratios of the target proteins to GAPDH in density values of the blots. Equal loading of proteins is confirmed by GAPDH. **, p < 0.01, *, 0.01 < p < 0.05. n = 3.
According to the results of Western Blot, H2O2 significantly reduced the expression of SOD1 but not CAT, while both proteins were overexpressed with ALC pretreatment. CAT was expressed weakly with 3-MA pretreatment, whereas SOD1 was expressed with no significant change (Figs. 4c and 4d).
ALC regulated autophagy of ADSCs exposed to H2O2 with the change of AMBRA1 expression
As shown in Fig. 5, a higher transformation rate of LC3bI to LC3bII, more expression of PIK3C3, and less expression of p62 occurred when cells were treated with ALC. All of the above were counteracted by 3-MA treatment in advance. In addition, the expression of caspase-3 was significantly reduced with ALC treatment but rose again with 3-MA pretreatment (Fig. 5).
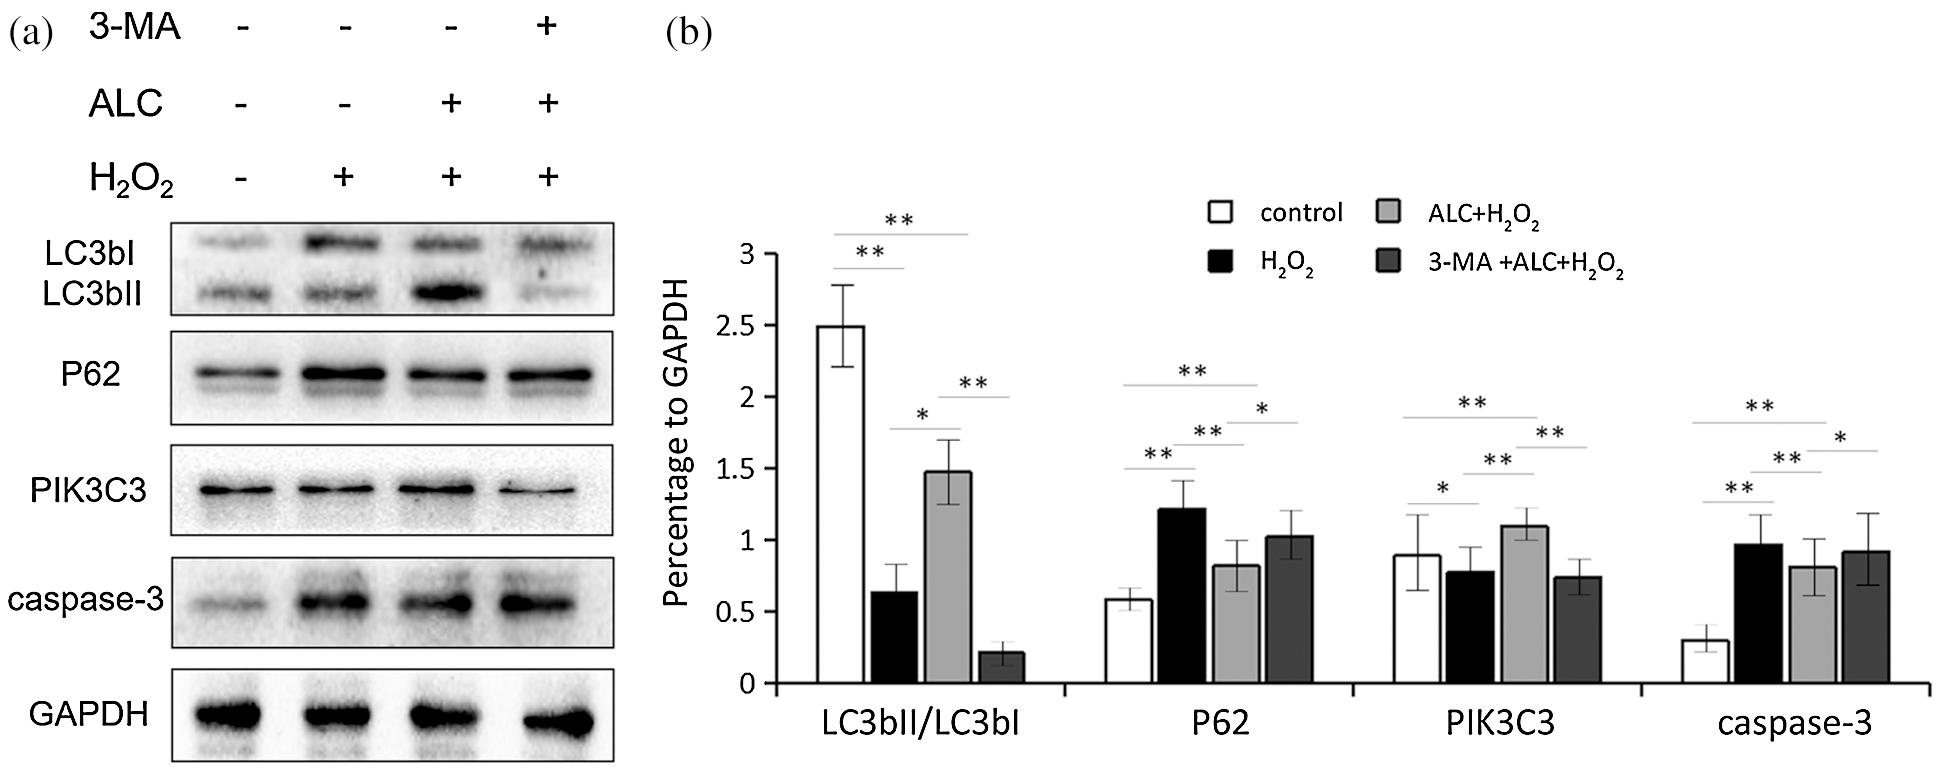
Figure 5: Expression of autophagy-related proteins. (a) Cells were treated as above. Western Blot was performed to detect the expression of LC3bII/LC3bI, PIK3C3, p62 and caspase-3. (b) The results are expressed as ratios of blot density values of the target proteins to that of GAPDH (Except LC3bII and LC3bI, the ratios between themselves are calculated). Equal loading of proteins is illustrated by GAPDH. **, p < 0.01, *, 0.01 < p < 0.05. n = 3.
According to the result of Western Blot and co-IF, the expressions of Beclin1 and AMBRA1 not only changed with a consistent trend (both decreased with H2O2 or 3-MA and increased with ALC) (Figs. 6 and 7) but also had highly overlapping distributions in the cells (Fig. 7).
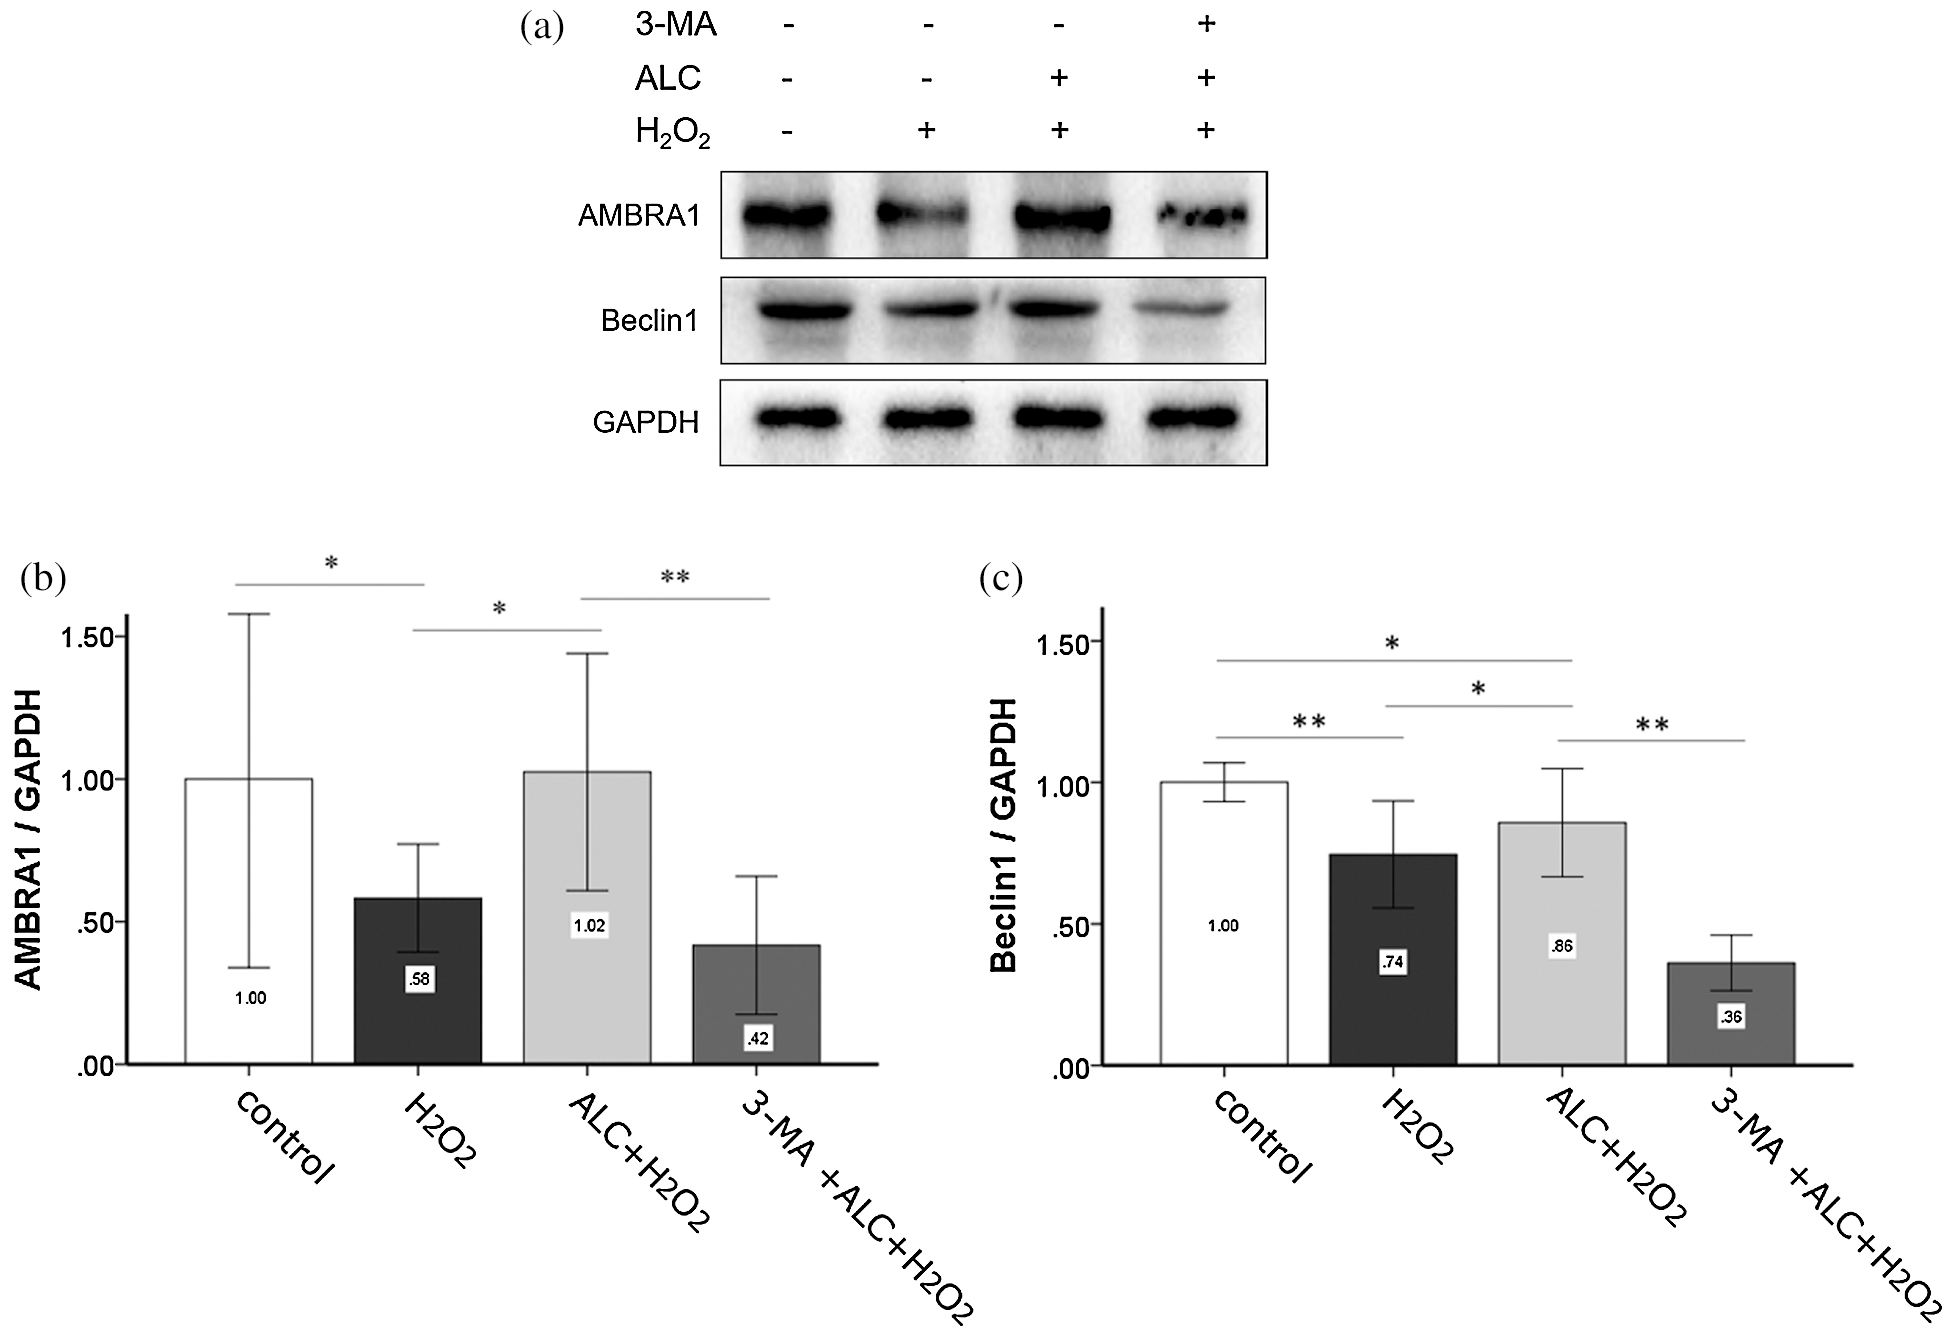
Figure 6: Expressions of AMBRA1 and Beclin1. (a) Cells were treated as above and Western Blot was performed. (b) Densitometry analyses of the blots of AMBRA1 and Beclin1 compared to GAPDH. Equal loading of proteins is confirmed by GAPDH. **p < 0.01, *0.01 < p < 0.05; (n = 3).
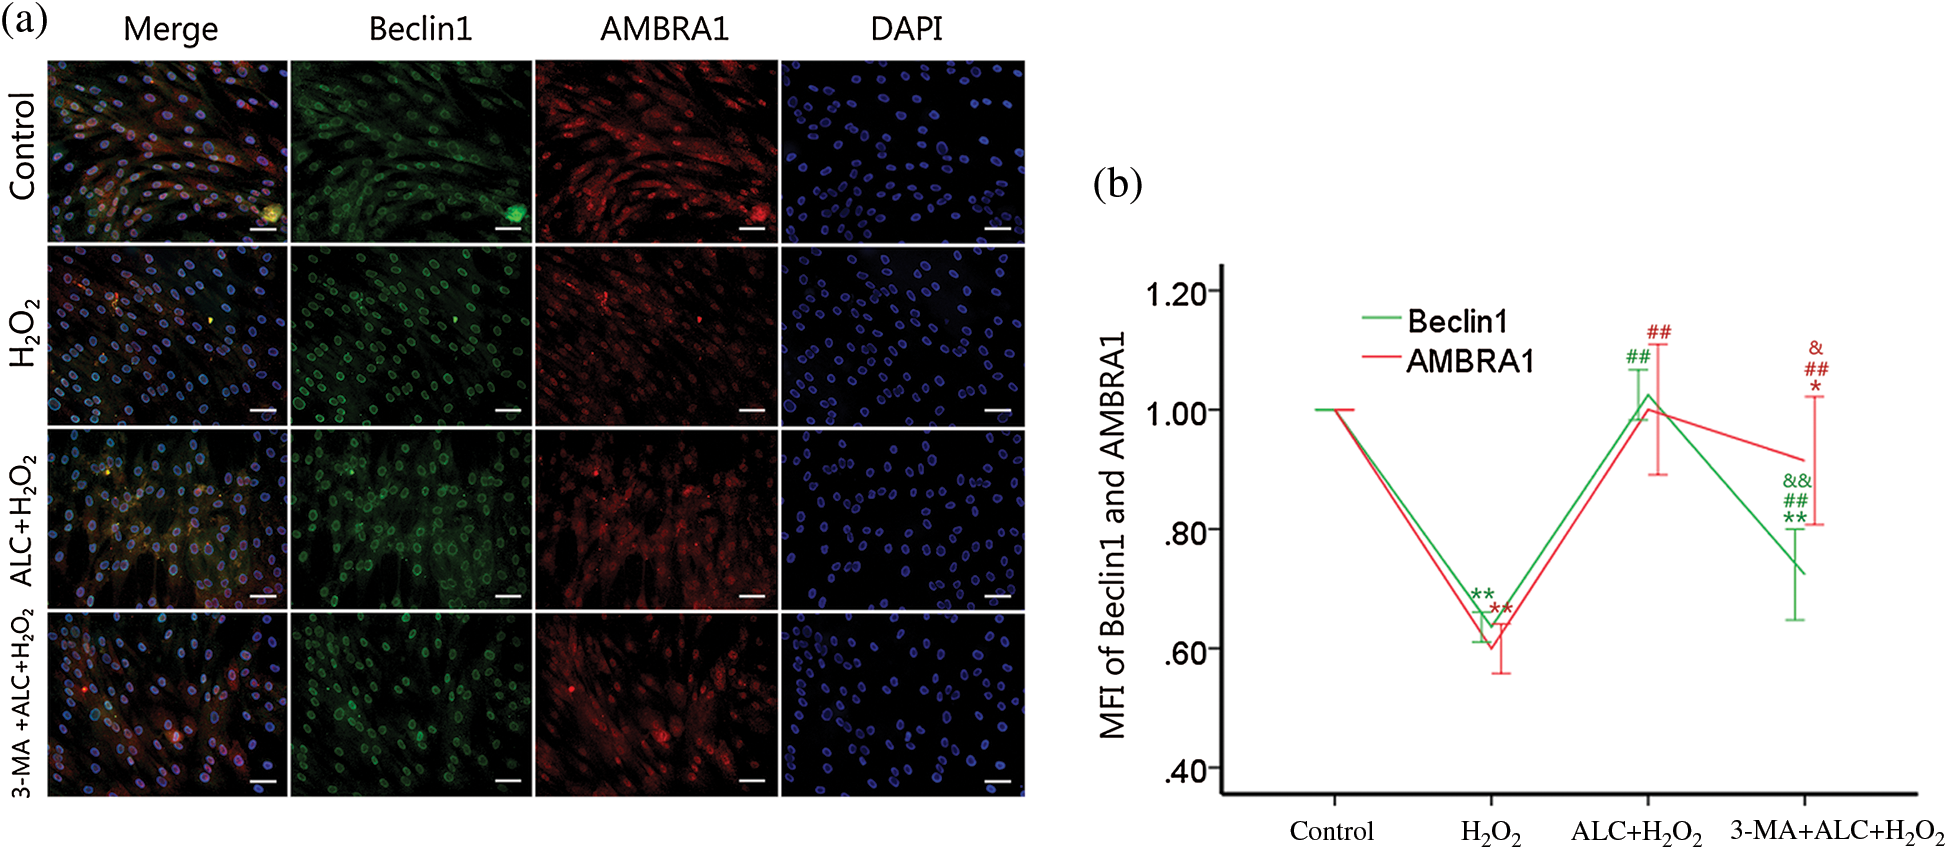
Figure 7: Distributions of AMBRA1 and Beclin1. (a) ADSCs were treated as above. Co-IF was performed to determine the distributions of AMBRA1 and Beclin1. Images were obtained under a fluorescence inverted microscope. Scale bar = 100 μm. (b) Ratios of the treating groups to the control group in the mean fluorescence intensity (MFI) of Beclin1 or AMBRA1 were calculated for statistical analyses. Similar cell densities were confirmed by DAPI. **p < 0.01, *0.01 < p < 0.05, compared to the control group; ##p < 0.01, compared to the H2O2 group; && p < 0.01, &0.01 < p < 0.05, compared to the H2O2 plus ALC group; (n = 3).
It has been found that ALC protects cells from oxidative stress and the resultant cell aging or death, promoting the recovery of diseases in nervous and cardiovascular systems (Cherix et al., 2020; Ferreira and McKenna, 2017; Hagen et al., 2002). In the present study, ALC was proved to reduce the H2O2-induced injury and increase the hyperproliferation phenotype of ADSCs in the CCK-8 test and EdU staining, which might be related to the regulated intracellular ROS and autophagy level.
Diverse stresses have different effects on antioxidant enzymes including SOD1 and CAT (Liang et al., 2020; Somasundaram et al., 2019), and the expressions of them are sometimes inconsistent (Djordjevic et al., 2004; Hao and Liu, 2019). We found H2O2 (100 μM, 2 h) significantly inhibited the expression of SOD1 but not CAT, while ALC pretreatment significantly increased the expressions of both enzymes. The optimized SOD/CAT combination can effectively clear up superoxide and hydrogen peroxide, the two of the most important ROS (Hu and Tirelli, 2012). Correspondingly, we discovered that ALC down-regulated intracellular ROS induced by H2O2, but such effect was offset by 3-MA pretreatment, accompanied by down-regulated PIK3C3 expression and inhibited autophagy. That means autophagy, which contributes to scavenging ROS (Scherz-Shouval and Elazar, 2011), may be one of the mechanisms by which ALC protects cells against oxidative damage.
There is inconsistency in the effect of H2O2 on autophagy (Duan et al., 2015; Lou et al., 2017), which may be explained by the difference in the experimental models and dosages of H2O2. Beclin1 was found to be a new substrate of caspase-3 and its cleavage might inactivate autophagy and augment apoptosis (Zhu et al., 2010). We also found that H2O2 treatment (100 µM, 2 h) increased caspase-3 expression and decreased Beclin1 expression, which might account for the inhibited autophagy. It is necessary to add animal experiments to confirm these changes.
When cells were starved, AMBRA1 links Beclin1 more tightly and plays an important role in Beclin1-dependent autophagy (Fimia et al., 2007; Gu et al., 2014; Shi et al., 2014). According to the results of Western Blot and co-immunofluorescence in the present study, ALC (1 mM, 24 h) treatment improved the AMBRA1 and Beclin1 expression of H2O2-exposed ADSCs with fairly consistent increment and distribution, accompanied with raised autophagy level, while treating with PIK3C3 inhibitor 3-MA in advance significantly inhibited autophagy and reversed the changes of AMBRA1 and Beclin1. Nevertheless, further researches are required on the mechanisms by which ALC regulates AMBRA1 and the subsequent Beclin1-dependent autophagy.
In order to avoid the interference caused by the oxidation of H2O2 and the direct ALC-H2O2 reaction, cells were washed thoroughly and gently with PBS before each addition of H2O2 or CCK-8 reagent. Moreover, the tendency that ALC alleviated the damage of H2O2 to ADSCs was stable, although there was a small difference in values of cell activity between the same treating groups in the different CCK-8 tests (Figs. 2a–2c), which might be accounted for by the variability of cell clones. In addition, it is found that the positive effect of ALC was little or even disappeared when its concentration was raised above 5 mM. Whether this is caused by autophagic cell death or by apoptosis needs to be further determined by using 3-MA (to see if the cell viability is improved again) (Zhang et al., 2013).
In summary, we found that in addition to the adjustment of the balance between ROS and antioxidant enzymes, ALC (1 mM, 24 h) might protect ADSCs against damage induced by H2O2 (100 µM, 2 h) through regulating Beclin1-dependent autophagy, which might be related to AMBRA1.
Acknowledgement: Sincere thanks to the teachers of the Central Laboratory of Wenzhou Medical University for their help and support.
Availability of Data and Materials: All data generated or analysed during the current study are included in this published article.
Funding Statement: Conceptualization, Ming Lin and Liqun Li; methodology, Yao Qian and Tianyun Pan; software, Jingping Wang and Yucang He; validation, Ziwan Ji, Yao Qian and Hao Chen; formal analysis, Xuling Lv; investigation, Yao Qian; resources, Zikai Zhang; data curation, Tian Li; writing-original draft preparation, Yao Qian; writing-review and editing, Liqun Li. This research was funded by the National Natural Science Foundation of China [grant no. 81971850] and a grant from the Municipal Science and Technology Bureau of Wenzhou [2018Y0383, 2019Y0538].
Conflicts of Interest: The authors declare that they have no conflicts of interest to report regarding the present study.
Bodaghi-Namileh V, Sepand MR, Omidi A, Aghsami M, Seyednejad SA, Kasirzadeh S, Sabzevari O. (2018). Acetyl-l-carnitine attenuates arsenic-induced liver injury by abrogation of mitochondrial dysfunction, inflammation, and apoptosis in rats. Environmental Toxicology and Pharmacology 58: 11–20. DOI 10.1016/j.etap.2017.12.005. [Google Scholar] [CrossRef]
Cherix A, Larrieu T, Grosse J, Rodrigues J, McEwen B, Nasca C, Gruetter R, Sandi C. (2020). Metabolic signature in nucleus accumbens for anti-depressant-like effects of acetyl-L-carnitine. eLife 9: e50631. DOI 10.7554/eLife.50631. [Google Scholar] [CrossRef]
Dai R, Wang Z, Samanipour R, Koo KI, Kim K. (2016). Adipose-derived stem cells for tissue engineering and regenerative medicine applications. Stem Cells International 2016: 6737345. DOI 10.1155/2016/6737345. [Google Scholar] [CrossRef]
Di Bartolomeo S, Corazzari M, Nazio F, Oliverio S, Lisi G, Antonioli M, Pagliarini V, Matteoni S, Fuoco C, Giunta L, D'Amelio M, Nardacci R, Romagnoli A, Piacentini M, Cecconi F, Fimia GM. (2010). The dynamic interaction of AMBRA1 with the dynein motor complex regulates mammalian autophagy. Journal of Cell Biology 191: 155–168. DOI 10.1083/jcb.201002100. [Google Scholar] [CrossRef]
Djordjevic A, Spasic S, Jovanovic-Galovic A, Djordjevic R, Grubor-Lajsic G. (2004). Oxidative stress in diabetic pregnancy: SOD, CAT and GSH-Px activity and lipid peroxidation products. Journal of Maternal-Fetal & Neonatal Medicine 16: 367–372. DOI 10.1080/jmf.16.6.367.372. [Google Scholar] [CrossRef]
Duan JL, Yin J, Ren WK, Wu MM, Chen S, Cui ZJ, Wu X, Huang RL, Li TJ, Yin YL. (2015). Pyrrolidine dithiocarbamate restores gastric damages and suppressive autophagy induced by hydrogen peroxide. Free Radical Research Communications 49: 210–218. DOI 10.3109/10715762.2014.993627. [Google Scholar] [CrossRef]
Farahzadi R, Fathi E, Mesbah-Namin SA, Zarghami N. (2018). Anti-aging protective effect of L-carnitine as clinical agent in regenerative medicine through increasing telomerase activity and change in the hTERT promoter CpG island methylation status of adipose tissue-derived mesenchymal stem cells. Tissue and Cell 54: 105–113. DOI 10.1016/j.tice.2018.08.012. [Google Scholar] [CrossRef]
Fathi E, Farahzadi R, Sheikhzadeh N (2019a). Immunophenotypic characterization, multi-lineage differentiation and aging of zebrafish heart and liver tissue-derived mesenchymal stem cells as a novel approach in stem cell-based therapy. Tissue and Cell 57: 15–21. DOI 10.1016/j.tice.2019.01.006. [Google Scholar] [CrossRef]
Fathi E, Farahzadi R, Valipour B, Sanaat Z (2019b). Cytokines secreted from bone marrow derived mesenchymal stem cells promote apoptosis and change cell cycle distribution of K562 cell line as clinical agent in cell transplantation. PLoS One 14: e0215678. DOI 10.1371/journal.pone.0215678. [Google Scholar] [CrossRef]
Ferreira GC, McKenna MC. (2017). L-Carnitine and acetyl-L-carnitine roles and neuroprotection in developing brain. Neurochemical Research 42: 1661–1675. DOI 10.1007/s11064-017-2288-7. [Google Scholar] [CrossRef]
Fimia GM, Stoykova A, Romagnoli A, Giunta L, Di Bartolomeo S, Nardacci R, Corazzari M, Fuoco C, Ucar A, Schwartz P, Gruss P, Piacentini M, Chowdhury K, Cecconi F. (2007). Ambra1 regulates autophagy and development of the nervous system. Nature 447: 1121–1125. DOI 10.1038/nature05925. [Google Scholar] [CrossRef]
Furuya T, Kim M, Lipinski M, Li J, Kim D, Lu T, Shen Y, Rameh L, Yankner B, Tsai LH, Yuan J. (2010). Negative regulation of Vps34 by Cdk mediated phosphorylation. Molecular Cell 4: 500–511. DOI 10.1016/j.molcel.2010.05.009. [Google Scholar] [CrossRef]
Gholizadeh-Ghaleh Aziz S, Fathi E, Rahmati-Yamchi M, Akbarzadeh A, Fardyazar Z, Pashaiasl M. (2017). An update clinical application of amniotic fluid-derived stem cells (AFSCs) in cancer cell therapy and tissue engineering. Artificial Cells, Nanomedicine, and Biotechnology 45: 765–774. DOI 10.1080/21691401.2016.1216857. [Google Scholar] [CrossRef]
Gu W, Wan D, Qian Q, Yi B, He Z, Gu Y, Wang L, He S. (2014). Ambra1 is an essential regulator of autophagy and apoptosis in SW620 cells: Pro-survival role of AMBRA1. PLoS One 9: e90151. DOI 10.1371/journal.pone.0090151. [Google Scholar] [CrossRef]
Hagen TM, Moreau R, Suh JH, Visioli F. (2002). Mitochondrial decay in the aging rat heart: Evidence for improvement by dietary supplementation with acetyl-L-carnitine and/or lipoic acid. Annals of the New York Academy of Sciences 959: 491–507. DOI 10.1111/j.1749-6632.2002.tb02119.x. [Google Scholar] [CrossRef]
Hao M, Liu R. (2019). Molecular mechanism of CAT and SOD activity change under MPA-CdTe quantum dots induced oxidative stress in the mouse primary hepatocytes. Spectrochimica Acta Part A: Molecular and Biomolecular Spectroscopy 220: 117104. DOI 10.1016/j.saa.2019.05.009. [Google Scholar] [CrossRef]
He Y, Yu X, Chen Z, Li L. (2019). Stromal vascular fraction cells plus sustained release VEGF/Ang-1-PLGA microspheres improve fat graft survival in mice. Journal of Cellular Physiology 234: 6136–6146. DOI 10.1002/jcp.27368. [Google Scholar] [CrossRef]
Hu P, Tirelli N. (2012). Scavenging ROS: Superoxide dismutase/catalase mimetics by the use of an oxidation-sensitive nanocarrier/enzyme conjugate. Bioconjugate Chemistry 23: 438–449. DOI 10.1021/bc200449k. [Google Scholar] [CrossRef]
Liu J, Chen Z, Guo J, Wang L, Liu X. (2019). Ambra1 induces autophagy and desensitizes human prostate cancer cells to cisplatin. Bioscience Reports 39: BSR20170770. DOI 10.1042/BSR20170770. [Google Scholar] [CrossRef]
Li X, Zhang L, Yu L, Wei W, Lin X, Hou X, Tian Y. (2016). shRNA-mediated AMBRA1 knockdown reduces the cisplatin-induced autophagy and sensitizes ovarian cancer cells to cisplatin. Journal of Toxicological Sciences 41: 45–53. DOI 10.2131/jts.41.45. [Google Scholar] [CrossRef]
Liang Y, Dong B, Pang N, Hu J. (2020). Abamectin induces cytotoxicity via the ROS, JNK, and ATM/ATR pathways. Environmental Science and Pollution Research International 27: 13726–13734. DOI 10.1007/s11356-019-06869-2. [Google Scholar] [CrossRef]
Lira VA, Okutsu M, Zhang M, Greene NP, Laker RC, Breen DS, Hoehn KL, Yan Z. (2013). Autophagy is required for exercise training‐induced skeletal muscle adaptation and improvement of physical performance. FASEB Journal 27: 4184–4193. DOI 10.1096/fj.13-228486. [Google Scholar] [CrossRef]
Lou Y, Yu W, Han L, Yang S, Wang Y, Ren T, Yu J, Zhao A. (2017). ROS activates autophagy in follicular granulosa cells via mTOR pathway to regulate broodiness in goose. Animal Reproduction Science 185: 97–103. DOI 10.1016/j.anireprosci.2017.08.008. [Google Scholar] [CrossRef]
Mizuno H, Tobita M, Uysal AC. (2012). Concise review: Adipose-derived stem cells as a novel tool for future regenerative medicine. Stem Cells 30: 804–810. DOI 10.1002/stem.1076. [Google Scholar] [CrossRef]
Mobarak H, Fathi E, Farahzadi R, Zarghami N, Javanmardi S. (2017). L-carnitine significantly decreased aging of rat adipose tissue-derived mesenchymal stem cells. Veterinary Research Communications 41: 41–47. DOI 10.1007/s11259-016-9670-9. [Google Scholar] [CrossRef]
Nazio F, Strappazzon F, Antonioli M, Bielli P, Cianfanelli V, Bordi M, Gretzmeier C, Dengjel J, Piacentini M, Fimia GM, Cecconi F. (2013). mTOR inhibits autophagy by controlling ULK1 ubiquitylation, self-association and function through AMBRA1 and TRAF6. Nature Cell Biology 15: 406–416. DOI 10.1038/ncb2708. [Google Scholar] [CrossRef]
Pagliarini V, Wirawan E, Romagnoli A, Ciccosanti F, Lisi G, Lippens S, Cecconi F, Fimia GM, Vandenabeele P, Corazzari M, Piacentini M. (2012). Proteolysis of AMBRA1 during apoptosis has a role in the inhibition of the autophagic pro-survival response. Cell Death & Differentiation 19: 1495–1504. DOI 10.1038/cdd.2012.27. [Google Scholar] [CrossRef]
Rebouche CJ. (2004). Kinetics, pharmacokinetics, and regulation of l-carnitine and acetyl-l-carnitine metabolism. Annals of the New York Academy of Sciences 1033: 30–41. DOI 10.1196/annals.1320.003. [Google Scholar] [CrossRef]
Russo R, Varano GP, Adornetto A, Nazio F, Tettamanti G, Girardello R, Cianfanelli V, Cavaliere F, Morrone LA, Corasaniti MT, Cecconi F, Bagetta G, Nucci C. (2018). Rapamycin and fasting sustain autophagy response activated by ischemia/reperfusion injury and promote retinal ganglion cell survival. Cell Death & Disease 9: 981. DOI 10.1038/s41419-018-1044-5. [Google Scholar] [CrossRef]
Strappazzon F, Vietri-Rudan M, Campello S, Nazio F, Florenzano F, Fimia GM, Piacentini M, Levine B, Cecconi F. (2011). Mitochondrial BCL-2 inhibits AMBRA1-induced autophagy. EMBO Journal 30: 1195–1208. DOI 10.1038/emboj.2011.49. [Google Scholar] [CrossRef]
Shafiei G, Almasi M, Nikzad H, Miyan J, Mahabadi JA, Moshkdanian G. (2020). L-carnitine reduces the adverse effects of ROS and up-regulates the expression of implantation related genes in invitro developed mouse embryos. Theriogenology 145: 59–66. DOI 10.1016/j.theriogenology.2020.01.008. [Google Scholar] [CrossRef]
Schaaf MB, Keulers TG, Vooijs MA, Rouschop KM. (2016). LC3/GABARAP family proteins: Autophagy-(un)related functions. FASEB Journal 30: 3961–3978. DOI 10.1096/fj.201600698R. [Google Scholar] [CrossRef]
Scherz-Shouval R, Elazar Z. (2011). Regulation of autophagy by ROS: Physiology and pathology. Trends in Biochemical Sciences 36: 30–38. DOI 10.1016/j.tibs.2010.07.007. [Google Scholar] [CrossRef]
Somasundaram S, Abraham JS, Maurya S, Toteja R, Gupta R, Makhija S. (2019). Expression and molecular characterization of stress-responsive genes (hsp70 and Mn-sod) and evaluation of antioxidant enzymes (CAT and GPx) in heavy metal exposed freshwater ciliate, Tetmemena sp. Molecular Biology Reports 46: 4921–4931. DOI 10.1007/s11033-019-04942-0. [Google Scholar] [CrossRef]
Shi C, Wu J, Fu M, Zhang B, Wang J, Yang X, Chi Y. (2014). Ambra1 modulates starvation-induced autophagy through AMPK signaling pathway in cardiomyocytes. Biochemical and Biophysical Research Communications 452: 308–314. DOI 10.1016/j.bbrc.2014.08.017. [Google Scholar] [CrossRef]
Xia P, Wang S, Du Y, Zhao Z, Shi L, Sun L, Huang G, Ye B, Li C, Dai Z, Hou N, Cheng X, Sun Q, Li L, Yang X, Fan Z. (2013). WASH inhibits autophagy through suppression of Beclin 1 ubiquitination. EMBO Journal 32: 2685–2696. DOI 10.1038/emboj.2013.189. [Google Scholar] [CrossRef]
Yang B, Liu Q, Bi Y. (2019). Autophagy and apoptosis are regulated by stress on Bcl2 by AMBRA1 in the endoplasmic reticulum and mitochondria. Theoretical Biology and Medical Modelling 16: 18. DOI 10.1186/s12976-019-0113-5. [Google Scholar] [CrossRef]
Ye J, Li J, Yu Y, Wei Q, Deng W, Yu L. (2010). L-carnitine attenuates oxidant injury in HK-2 cells via ROS-mitochondria pathway. Regulatory Peptides 161: 58–66. DOI 10.1016/j.regpep.2009.12.024. [Google Scholar] [CrossRef]
Zhang J, Chiu J, Zhang H, Qi T, Tang Q, Ma K, Lu H, Li G. (2013). Autophagic cell death induced by resveratrol depends on the Ca2+/AMPK/mTOR pathway in A549 cells. Biochemical Pharmacology 86: 317–328. DOI 10.1016/j.bcp.2013.05.003. [Google Scholar] [CrossRef]
Zhu Y, Zhao L, Liu L, Gao P, Tian W, Wang X, Jin H, Xu H, Chen Q. (2010). Beclin 1 cleavage by caspase-3 inactivates autophagy and promotes apoptosis. Protein & Cell 1: 468–477. DOI 10.1007/s13238-010-0048-4. [Google Scholar] [CrossRef]
 | This work is licensed under a Creative Commons Attribution 4.0 International License, which permits unrestricted use, distribution, and reproduction in any medium, provided the original work is properly cited. |