DOI:10.32604/biocell.2021.013706
www.techscience.com/journal/biocell
| Biocell DOI:10.32604/biocell.2021.013706 | www.techscience.com/journal/biocell |
| Article |
Development of new cowpea (Vigna unguiculata) mutant genotypes, analysis of their agromorphological variation, genetic diversity and population structure
1Laboratoire Campus de Biotechnologies Végétales, Département de Biologie Végétale, Faculté des Sciences et Techniques, Université Cheikh Anta Diop, Dakar-Fann, Dakar, 10700, Sénégal
2Faculté des Sciences et Technologies de l’Education et de la Formation, Université Cheikh Anta Diop, Dakar-Fann, Dakar, 10700, Sénégal
*Address Correspondence to: Diaga Diouf, diaga.diouf@ucad.edu.sn
Received: 18 August 2020; Accepted: 19 October 2020
Abstract: Cowpea is one of the most important legume grains in the sub-Saharan region of Africa used for human consumption and animal feed, but its production is hampered by biotic and abiotic constraints raising the need to broaden its genetic basis. For this purpose, seeds of two cowpea varieties Melakh and Yacine were irradiated with 300 and 340 Gy of gamma-ray, respectively. The developed mutant populations were agromorphologically characterized from M5 to M7, while the genetic diversity of the latter was evaluated using 13 ISSR markers. Based on the agromorphological characterization, variation of flower color, pod length, seed coat color, and seed weight with 78.01, 68.29, 94.48, and 57.58% heritability, respectively, were recorded in the mutant lines. PCA analyses allowed to identify the elite mutants based on their agromorphological traits, while Pearson’s correlation results revealed a positive correlation between yield and yield component traits. Three subpopulations were identified through STRUCTURE analyses, but the assignment of the individuals in each group was improved using DAPC (Discriminant Analysis of Principal Components) analysis. Analysis of Molecular Variance revealed that the majority (85%) of the variance rather existed within groups than among (15%) groups. Finally, our study allowed us to select new promising mutant genotypes that could be tested for multi-locational trials to evaluate their agronomic performance.
Keywords: Agromorphological characterization; Induced mutagenesis; ISSR; Plant breeding
Cowpea [Vigna unguiculata (L.) Walp., 2n = 2x = 22] is an important crop legume for tropical and subtropical zones, grown in Africa, Southern Europe, Latin America, Southeast Asia, and southwestern regions of North America on 12,496,305 hectares of land (http://www.fao.org/faostat/en/#data/QC/visualize). Its production is estimated at 7,233,408 tons. Nigeria, Niger, Burkina Faso, Ghana, United Republic of Tanzania, Myanmar, Mali, Cameroon, Sudan (including Sudan and South Sudan), and Kenya are the top producers in the world. In the Sahelian part of Africa, the crop plays a major role in human nutrition. For instance, the fresh seeds, grilled on a wood fire, are consumed in Senegal, while the dry seeds are used in a wide range of meal compositions. The young leaves are eaten in Eastern and Southern Africa while the hay, as well as the seed, are used as feed for livestock in several African countries (Diouf, 2011). Compared to others legumes such as chickpea (Cicer arietinum L.), its seed contains a higher amount of proteins ranging from 17.5 to 32.5 with a mean of 25% and a substantial amount of minerals and vitamins, raising cowpea as a valuable crop to fight malnutrition for the low-income farmers (Boukar et al., 2011; Jukanti et al., 2012).
Based on the estimation realized by Quin (1995), cowpea, which establishes a symbiosis with Bradyrhizobium, is a good nitrogen-fixing crop (70 to 350 kg nitrogen per hectare) contributing to soil fertility. Despite its importance, the production of the crop is hampered by a wide range of biotic (virus, bacteria, fungi, parasitic weeds, and nematodes) and abiotic (drought, heat) constraints (Diouf, 2011; Boukar et al., 2016). This susceptibility to a wide range of biotic and abiotic stresses is attributed to the narrow genetic basis of the crop due to a single domestication event and its self-pollinating pattern of reproduction (Badiane et al., 2014).
To overcome these constraints, the genetic diversity existing in the germplasms, which contains relevant agronomic traits, has been exploited during the past decades to increase the production of crops through the development of elite cultivars, based on methods such as pure line selection, mass selection, pedigree breeding, single seed descent and backcrossing (Li et al., 2001). Despite these efforts, the genetic basis of the realized lines is still narrow, raising the need to develop novel outstanding varieties, particularly in the era of climate change. For this purpose, techniques such as mutagenesis is a valuable tool to induce genetic variation for cultivar improvements. Mutagenesis has widely been used for the past seventy years to improve many economically important crops leading to the release of 3,320 varieties worldwide (https://mvd.iaea.org/#!Search). According to this database, only 16 cowpea varieties were bred using gamma-ray mutation techniques, and 5 out of the varieties were selected from Africa, precisely Kenya, Zambia, and Zimbabwe.
Gamma rays are ionizing radiation that penetrates deeply the cells of target tissues, where they interact with molecules to generate reactive oxygen species (ROS), causing base substitutions and genome rearrangements such as insertions, deletions, inversions, and translocations (Morita et al., 2009). The base substitution caused by ROS is due to the conversion of guanines into 8-oxo-Gs, which induces mispairing with adenine, while genome rearrangements are caused by error-prone non-homologous end joining (NHEJ) rather than error-free homologous recombination resulting from double-strand breaks (DSBs). When DSBs and NHEJ occur in several genomic regions, they create favorable conditions for copy number variations (CNVs), presence/absence variations (PAVs), and translocations (Naito et al., 2005; Morita et al., 2009).
Presently, it is well documented that these genetic modifications affect agromorphological variations in plant height, growth habit, number of leaves per plant, leaf color, number of branches per plant, days to flowering, flower color, flowering ability, maturity, number of pods per plant, number of seeds per plant, pod and seed coat color, seed eye color, weight of 100 seeds, and tolerance to the pod borer, Maruca vitrata, (Adekola and Oluleye, 2008; Badr et al., 2014; Nair and Mehta, 2014; Gaafar et al., 2016; Horn et al., 2016; Olasupo et al., 2018). In view of these variations, previous studies attempted to characterize cowpea mutant populations using morphological traits, yield, and yield components and recently seed storage proteins (Adekola and Oluleye, 2007; Gnanamurthy et al., 2012; Badr et al., 2014; Gaafar et al., 2016; Horn et al., 2016; Olasupo et al., 2016) (Badr et al., 2014; Gaafar et al., 2016). To overcome the limits of using these traits, random amplified polymorphic DNA (RAPD; Badr et al., 2014) and inter-simple sequence repeat (ISSR; Badr et al., 2014; Gaafar et al., 2016) were recently used to understand the genetic organization of some cowpea mutant populations. The analysis of ISSR has generated more informative results since these sequences are abundant, widely distributed across the eukaryotic genome, highly reproducible, and use SSR as primers allowing the amplification of inter SSR region (Reddy et al., 2002). ISSRs are useful in the study of genetic diversity, genome mapping, or evolutionary biology in many crop species and they overcome the limitations of other markers such as low reproducibility and high cost of RAPD and AFLP (Amplified fragment length polymorphic), respectively (Reddy et al., 2002; Joshi and Dhawan, 2007). ISSR combines the advantages of SSR, AFLP, and RAPD markers, which do not require prior genome sequence information and are efficient to detect genetic variation among cowpea varieties (Nova et al., 2014; Igwe et al., 2017) or mutant lines (Badr et al., 2014; Gaafar et al., 2016). ISSR primers can be unanchored with 1 to 4 degenerate nucleotides at 3’ or 5’ end to avoid the slippery within the repeat units and smear apparition after DNA electrophoresis. However, previous studies showed that primers anchored at 3’ gave more clear bands (Blair et al., 1999; Gaafar et al., 2016).
The aim of this study was to broaden the genetic basis of cowpea using gamma irradiation technique specifically to develop mutant populations for which their agromorphological characters and genetic diversity were assessed and to use the generated information to select new elite genotypes.
Plant materials and gamma irradiation
Two inbred cowpea varieties, Melakh and Yacine (Tab. 1), widely cultivated in Senegal, were selected from the national germplasm, and used in this study (Badiane et al., 2012). They belong to the early maturity group, which reaches physiological maturity at 64 days after sowing (DAS) under well-watered conditions (Cisse et al., 1997, 2005). In total, 216 dry and healthy seeds for each variety (Melakh and Yacine) were exposed to 300 and 340 Gy of gamma-ray, respectively. The irradiation was performed at the International Atomic Energy Agency (IAEA), Agriculture and Biotechnology Laboratory, A-2444 Seibersdorf, Austria, using a cobalt 60 source Gammacell (Model No. 220). The control seeds were not exposed to gamma irradiation.
Development of mutagenized populations and experimental design
The development of the mutagenized populations was performed in different experimental fields located in the western part of Senegal. The seeds of each generation were sown using 50 cm and 75 cm of intra and inter-row spacing, respectively. The irradiated seeds for each variety (Melakh and Yacine) were sown on a separate field in August 2013 around Bambey during the rainy season for the development of M1 populations. Based on their yield, 12 and 7 mutant plants of Melakh and Yacine, respectively, were selected and harvested for the development of M2 populations. For this purpose, 103 and 87 seeds from M1 plants of Melakh and Yacine, respectively, were sown during the dry season in April 2014 at the “Centre National de Recherches Agronomiques (CNRA)” at Bambey (Senegal) to develop M2 populations. At maturity, the most productive mutant plants, 12 for Melakh and 7 for Yacine, were selected, harvested and their seeds were sown at CNRA in September 2015 to develop M3 populations. For the development of M4 populations, the most productive M3 mutant plants were harvested and the seeds (88 for Melakh and 81 for Yacine) were sown in September 2016 on the experimental field located at Ngolgane in the vicinity of Niakhar (Senegal) in accordance with the experimental design previously described. At the maturity stage, the plants were harvested, and a single descent method was used to develop the M5 population. Thirty-nine (39) and thirty-six (36) seeds of the mutants of Melakh and Yacine, respectively, were sown in December 2017 in a pot filled with sand from Sanghalkam (Senegal), which is well-characterized, and watered 3 times a week with tap water. The mutant plants were grown in the Shadehouse of the “Département de Biologie Végétale” at University Cheikh Anta Diop. The M6 and the M7 populations were sown in May 2017 and August 2017, respectively, at the Teaching and Research Farm of the “Département de Biologie Végétale” at University Cheikh Anta Diop.
Agromorphological characterization
Based on previous studies, irradiation promotes the expression of recessive characters in advanced generations (Schum, 2003; Shin et al., 2011). Therefore, both qualitative and quantitative parameters were analyzed from M5 to M7 populations. For instance, in our studies, seed color and pod length variation were noticed in the 5th generation (M5). The scored qualitative parameters encompassed: rate of germination, leaflet abnormalities, leaflet shape, growth habit, flower color, days to flowering, and seed coat color. The quantitative parameters were the percentage of germination, plant height, pod length, number of pods per plant, number of seeds per pod, width and length of the seed, and weight of 100 seeds. The plant height was measured from the cotyledonary node to the top of the plant at the appearance of the first flower and the length of 5 pods as well using a tape measure (Cow head brand) (International Board for Plant Genetic Resources (IBPGR), 1983). The width and length of the seeds were measured using a vernier caliper (Mutshito®) and weighed using a balance (Sartorius®). The data on the quantitative traits recorded from M5 to M7 were used for statistical analyses.
Analysis of variance (ANOVA) and correlation of the quantitative traits were carried out using R software (R Core Team, 2019, version 3.6.2). In order to determine the association between quantitative and qualitative traits, a standardized Principal Component Analysis (sPCA) was performed with the R software using the adjusted means of the measured traits to assess the contribution of each of them on genetic variability. The phenotypic coefficient of variance, genotypic coefficient of variation (GCV), genetic advance (GA), and broad-sense heritability (h2) were calculated using the R software.
The genotypic variance (σ2g) was calculated using the following formula (Allard, 1960)
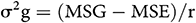
where MSG is the mean square of genotypes, MSE is the mean square of error, and r is the number of advanced generation.
The Phenotypic Variance (σ2p) was assessed as follows:
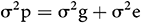
where σ2g is the genotypic variance and σ2e is the error of variance (MSE).
According to Singh and Chaudhary (1985), the estimation of phenotypic and genotypic coefficient of variation was calculated as follows:

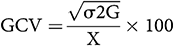
where X is the mean.
GCV and PCV values were considered as low (0–10%), moderate (10–20%), and high (>20%) following the scale by Sivasubramanian and MadhavaMenon (1973).
The Heritability Estimate (broad sense): 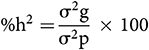
The heritability percentage was considered as low (0–30%), moderate (30–60%), and high (>60%) (Robinson et al., 1949).
The Expected and Estimated Genetic Advance (GA):
GA was calculated using the method of Assefa et al. (1999) and selection intensity (k) was assumed to be 5%, where k = 2.06 is a constant, and  is the phenotypic standard deviation. The Genetic Advance as Percentage of Mean (GA%):
Genetic advance as a percentage of mean was categorized as low (0–10%), moderate (10–20%) and high (>20%) (Johnson et al., 1955). Pearson’s correlation coefficient (r) for trait linkage evaluation was performed using the R software to determine the association between quantitative characters. The genetic distance between mutants and their parents based on quantitative traits was tested using multivariate analysis. To generate dendrogram, similar matrices were used based on Ward’s method cluster analysis (Sneath and Soka, 1973).
Five hundred (500) mg of young leaflets were randomly collected from individual plants of one-month-old and grounded in mortar in accordance with the protocol developed by Fulton et al. (1995). RNA was removed by adding 50 µg/mL of RNAse A (CalBiochem®), and then the tubes were incubated at room temperature for 1 h. The DNA was purified according to the protocol described by Badiane et al. (2012). After precipitation, the DNA was dried for 20 min with a Speed Vac® Plus Sc110 (Savant) and dissolved in 100 µL of x0.1 TE (pH = 8). The quantity and the quality of the DNA extracts were determined using a NanoDrop™ One/OneC Microvolume UV-Vis Spectrophotometer (Thermo Scientific®) at A260, A280, A260/A280, and A260/A230. The samples were then stored at −20°C or used for amplification.
Amplification of DNA and electrophoresis
To analyze the genetic diversity of the population, DNA amplification reaction was performed in tube puReTaq Ready-To-GoTM PCR beads (27-9557-01, GE Healthcare) containing 2.5 U of lyophilized PuReTaq, 200 µM dNTP and 1.5 mM MgCl2, 0.5 µM of each ISSR primer (Tab. 4) (TSINGKE, China) and 25 ng of DNA in a final volume of 25 µL. The tubes were loaded in a Prime thermocycler (TECHNE®, UK) programmed for pre-denaturation of 5 min at 95°C followed by 40 cycles of denaturation of 30 s at 95°C, annealing of 1 min at 38 to 52°C (depending on primer, Tab. 2), extension of 1 min at 72°C and a final extension of 8 min at 72°C. After amplification, the PCR products were separated on 2% agarose gel (Sigma) for 2 h at 70 V. The gel was stained for 30 min with GelRed® X10,000 (Biotium) according to the manufacturer’s instructions and photographed under UV light using Gel Doc system (High-performance UV Transilluminator UVP).
Amplifications were repeated three times for each single ISSR primer in order to retain clear and reproducible bands. On this basis, the total number of amplified bands was calculated, their size estimated, and the percentage of polymorphic bands evaluated. The polymorphic bands were scored using a binary code of presence (1) and absence (0) to construct a data matrix.
The Shannon diversity index, heterozygosity (Nei’s index), and the private alleles were calculated using GenAlex 6.5 software (Peakall and Smouse, 2012). To evaluate the discriminatory power of each marker, the Polymorphic Information Content (PIC) was calculated using the PowerMarker 3.25 software (Liu and Muse, 2005). The genetic variation among and within groups was assessed using molecular variance (AMOVA) in GenAlex 6.5 software (Peakall and Smouse, 2012).
The population structure was analyzed using the Bayesian clustering approach implemented in the STRUCTURE 2.3.3 software (Pritchard et al., 2000), while the number of subpopulations was tested from 1 to 10 independent runs. Using the admixture model (Falush et al., 2003), each simulation set to 100,000 burn-in periods and 10 runs of 200,000 iterations of Markov chain Monte Carlo (MCMC) were performed. These results were uploaded to the STRUCTURE HARVESTER online software (Earl and vonHoldt, 2012) to determine the most likely number of subpopulations using the Evanno Δk method (Evanno et al., 2005). To assign the individuals into clusters, a membership coefficient (q) ≥ 0.7 was used. The genotypes within clusters with membership coefficients (q) < 0.7 were considered as genetically admixed.
Discriminant Analysis of Principal Components (DAPC) was performed on the basis of the binary matrix data in order to confirm or invalidate the pattern of the genetic structure obtained with STRUCTURE and to identify the loci responsible for possible differentiation between genetic groups. This analysis was performed using the adegenet package (Jombart, 2008) of R software (R Core Team, 2019). A Neighbor-Joining (Saitou and Nei, 1987) dendrogram was constructed using the inter-individual distance matrix, calculated on the basis of the Jaccard (1902, 1912) index. This analysis was performed using Darwin 6.0 software (Perrier and Jacquemoud-Collet, 2015).
Agromorphological characterization of the mutants
Variation of qualitative traits among the mutants
The germination rate of the irradiated seeds of Melakh and Yacine was 98.15% and 99.08%, respectively, in the M1 generation. The germination rate for the mutants of Melakh and Yacine were 92.23% and 96.5 in M2, 93.3% and 92.4% in M3, 63.64% and 81.5% in M4, 90% and 92% in M5, 88% and 93% in M6 and 87.5% and 93.82% in M7, respectively, while the germination for the control was 100%. These results suggest that gamma irradiation at 300 or 340 Gy negatively affected the germinative power of the seeds. Growth habit variability appeared in the M5 for mutants of Melakh where 94% were prostrate, 3% erect, and 3% semi-erect as Melakh. During the M6, 3% and 97% of the mutants were prostrate and erected, respectively. The M7 included 62% prostrate, 7% semi-erect and 31% erect. Among the mutants of Yacine, the prostrate phenotype appeared in M5 with 38%, while 61% were erected as Yacine. In the M6, 4% and 96% were prostate and erected, respectively. The semi-erect phenotype appeared for the first time in the M7 with 4%, while 18% and 78% were prostrate and erect, respectively (Tab. 1).
Table 1: Agromorphological characters and pedigree of 40 cowpea mutants and their parent used in this study
The leaflet shape within the M7 mutants of Melakh revealed the existence of 4 leaflet forms, which were globular (6%), subglobular (76%), hastate (6%), and subhastate (12%), while the leaflet form of the control was subhastate. The leaflet of Yacine was subglobular, but 4% of its mutants had subhastate leaflet, indicating that gamma-irradiation induced leaflet shape variability (Figs. 1A–1D). Foliar number abnormalities were 11.11%, 11.5% and 0% in M5, M6 and M7, respectively (Fig. S1). These foliar number abnormalities, such as three primary leaves around the node in some mutants instead of two opposite leaves, revealed that the gamma irradiation affected the genes controlling leaves number in these mutants.
Phenotypic variability in flower color was first observed in the M5 of the mutants of Yacine and Melakh. Among the mutants of Melakh, 22%, 50% and 36% had white flowers with purple border in M5, M6 and M7, respectively, unlike the control, which had white flowers (Figs. 1E–1H). In contrast, three patterns of flower coloration were observed among the mutants of Yacine. In the M5, 42.5% of the mutants showed white flowers like the control, but 35% and 22.5% had white flowers with purple border and purple flowers, respectively. The proportion of the mutants with white flowers with purple border was 48% in M6 and 43% in M7, whereas the mutants with purple flowers represented 13% and 26% in M6 and M7, respectively. These data suggest that gamma irradiation affected the genes controlling flower color of the cowpea. Sterility characterized by flower abortion was observed among only the mutants of Melakh in M5, M6 and M7 with 11%, 5% and 2%, respectively. Among our population, 50% flowering was reached at 45 days after sowing (DAS) in M6 and M7 for Melakh mutants, while this value was 46 and 50 DAS for the mutants of Yacine in M6 and M7, respectively (Fig. S2). The color of the seed coat was unchanged from M1 to M7 for the mutants of Melakh, but some of them showed brown or beige eyes. In the M4 of the mutants of Yacine, the seed coat was brown like the control except for one mutant where brown seeds, white seeds, and white pickled brown seeds were harvested (Fig. 1J). In the M5, 43% had white seeds, 38% of the mutants had brown seeds as the control, and 19% had light brown seeds (Figs. 1K–1M).
Figure 1: Variation of qualitative traits observed in the populations.
Variation of quantitative traits and yield components among the mutants
To advance the mutant populations from M1 to M4, the pedigree method was used, and the selection criteria were based on the plant yield and no shattering pods for the mutants of Yacine only. In contrast, from M5 to M7, the single-seed descent method was used. In M5, the mutants of Melakh were selected based on 100 seed weights, but in M6 and M7, one more yield component (pod length) was included in the selection criteria. The average pod length of Melakh control measured across generations was 19 cm, while the value obtained in the mutants ranged from 12.5 cm to 25 cm across generations M5, M6 and M7 (Fig. 2A). At the same time, the average pod length of Yacine was estimated at 14.65 cm, but the variability of pod length observed among the mutants of Yacine ranged from 8.70 cm to 19 cm across generations M5, M6 and M7.
The number of pods per plant ranged from 1 to 6, 1 to 20 and 2 to 15 in M5, M6 and M7, respectively, for the mutants of Yacine and 3 to 6 for the control. These values ranged from 1 to 7, 2 to 35 and 1 to 43 for the mutants of Melakh and 3 to 10 for the control. The seed length varied from 8.75 mm to 10.72 mm, 8.10 mm to 11.66 mm and 7.46 mm to 12.16 mm for M5, M6 and M7, respectively, for the mutants of Melakh and 8.1 to 10.2 mm for the control (Fig. 2B). For the mutants of Yacine, the seed length varied from 6.12 mm to 10.04 mm, 9.12 mm to 11.20 mm and 7.67 mm to 11.13 mm for M5, M6 and M7, respectively, and 11.2 mm for the control. The number of seeds per pod varied from 9 to 15, 4 to 12 and 3 to 12 for the M5, M6 and M7 of the mutants of Melakh, respectively, and 7 to 14 for the control. For the mutants of Yacine, the number of seeds per pod ranged from 7 to 13, 5 to 12 and 4 to 16 in M5, M6 and M7, respectively, and 8 to 10 for the control. The 100 seed-weight ranged from 16.67 to 28.52, 20.07 to 32.28 and 13.55 to 38.0 g for M5, M6 and M7, respectively, for the mutants of Melakh but the values recorded for the control ranged from 18.35 to 32.12 g. The 100 seed-weight ranged from 10.78 to 24.5, 17.27 to 33.16 and 13.83 to 30.03 g respectively in M5, M6 and M7 populations of the mutants of Yacine and from 16.4 to 30.40 g for the control. Two mutant lines of Melakh (Me51M4-14M5-2M6-M7, Me51M4-39M5-1M6-M7) produced more seeds (44 to 184) per plant regardless of the generation. Similar results were observed among the mutants (Y1M4-11M5-3M6-M7, Y7-M4-1M5-3M6-M7) of Yacine (17 to 150 seeds).
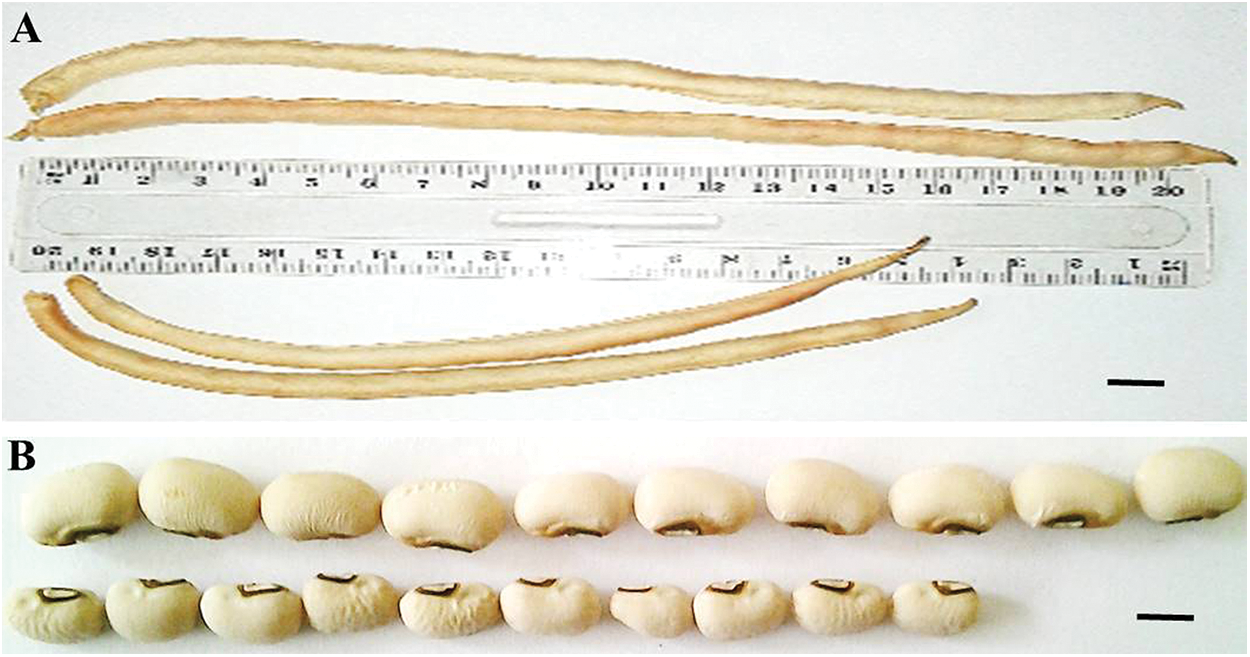
Figure 2: Variation of the quantitative traits observed in the population.
Genotypes clustering based on Principal Components Analysis and correlation between traits
The projection of agromorphological parameters collected from M7 in the PCA biplot showed that the axis 1 explained 28% of the variation (Fig. 3). This axis encompassed the elite mutants in terms of seed length, pod weight, and seed weight (Y7-M4-3M5-1M6-M7 and Me51M4-14M5-1M6-M7) and the early maturing mutant lines (Me51M4-36M5-1M6-M7, Y1-M4-16M5-2M6-M7, and Y7-M4-1M5-1M6-M7) compared with their control parents Yacine and Melakh. The axis 2 explained 19.7% of the variation and was constituted by the mutant lines (Y1-M4-11M5-3M6-M7, Y7-M4-1M5-3M6-M7, Y1-M4-11M5-3M6-M7, Me51M4-39M5-1M6-M7, Me51M4-29M5-1M6-M7, Me51M4-20M5-1M6-M7, Me51M4-10M5-1M6-M7, Me51M4-9M5-1M6-M7, Me51M4-11M5-1M6-M7) which acquired a new growth habit, i.e., prostrate compared with their parents (Fig. 3).
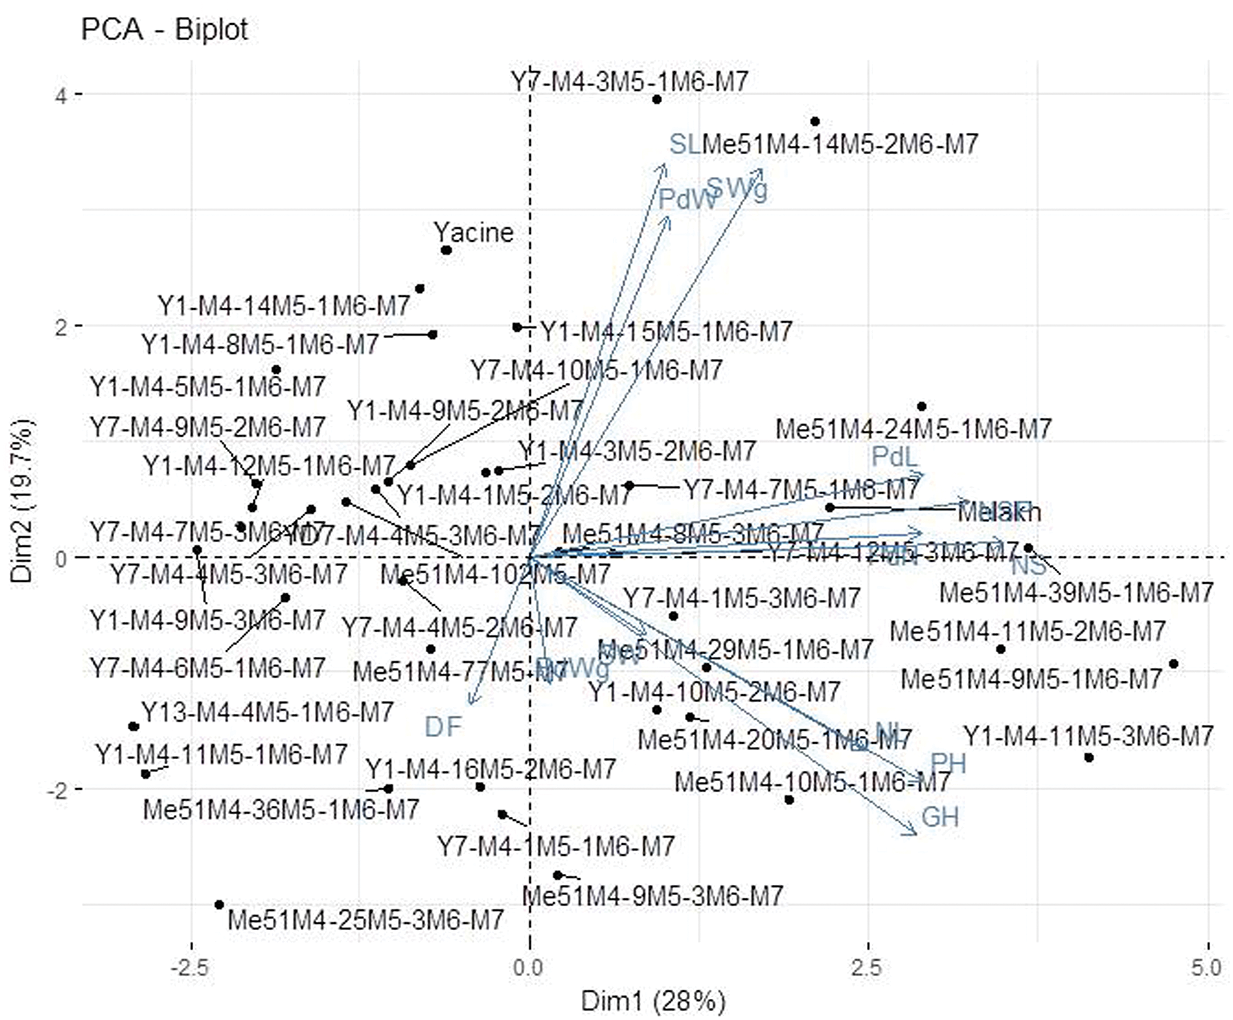
Figure 3: Principal Component Analysis of 40 mutant M7 lines and their parent based on agromorphological data.
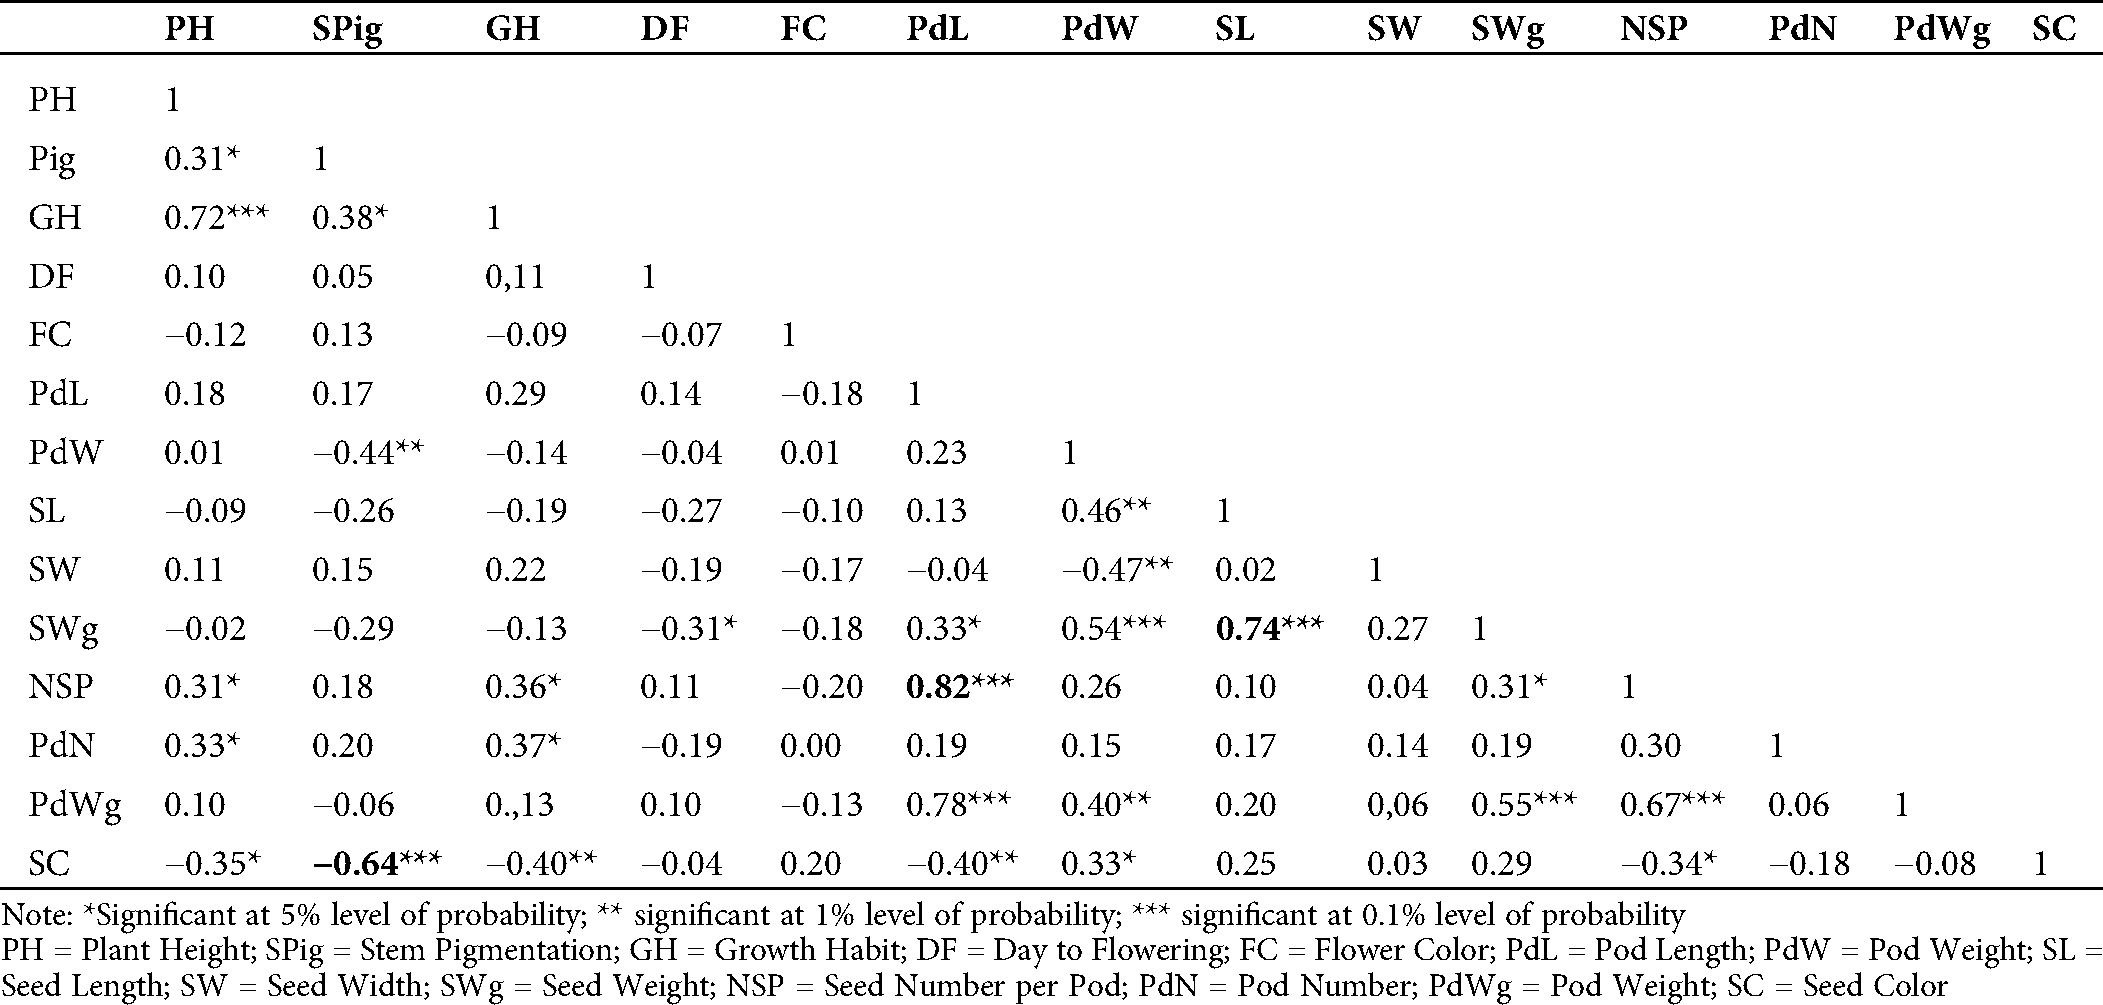
The evaluation of the Pearson’s coefficient between agromorphological characters across the generations (from M5 to M7) showed that stem pigmentation (SPig) was significantly and negatively correlated to seed color (SC) (r = −0.5, p = 0.01 in M5; r = −0.59, p = 0.001 in M6 and r = −0.64, p = 0.001 in M7), the number of seeds per pod (NSP) was significantly and positively correlated to the pod length (PdL) (r = 0.42, p = 0.05 in M5, r = 0.62, p = 0.001 in M6 and r = 0.82, p = 0.001 in M7), seed weight (SWg) and seed length (SL) (r = 0.86, p = 0.001 in M5, r = 0.60, p = 0.001 in M6 and r = 0.74, p = 0.001 in M7) (Tabs. S1, S2 and 2). In addition to these, in the M7, which is supposed to be more stable, the yield component parameters such as pod number (PdN) and growth habit (GH) (r = 0.37, p = 0.05) and pod weight (PWg) and PdL (r = 0.78, p = 0.001) were significantly correlated. The pod width (PdW) was significantly and positively correlated to SWg (r = 0.54, p < 0.001), and PWg (r = 0.40, p = 0.01), and SL (r = 0.46, p = 0.01). Similar observation was made in pod weight (PdWg) and SWg (r = 0.56, p = 0.001). In contrast, seed width (SW) and PdW negatively and significantly correlated (r= −0.47, p = 0.01; Tab. 2).
Table 2: Estimation of Pearson’s correlation between the agromorphological characters in the M7 of the mutant lines
Relationship among mutants based on agromorphological parameters
Based on the agromorphological characters, the M7 population was divided into 3 groups. The first group (green), which encompassed 52% of the individuals, were divided into 3 subgroups. Subgroup 1 included the mutants Me51M4-102M5-M7, Me51M4-36M5-1M6-M7, and Me51M4-77M5-M7) which were sister to Y13M4-4M5-1M6-M7, Y1M4-11M5-1M6-M7 and Me51M4-25M5-3M6-M7. Subgroup 2 only comprised mutants of Yacine except for Me51M4-8M5-3M6-M7, which clustered with genotypes sharing the same characters, such as erect stem and white brown-eyed seeds. Subgroup 3 included only mutants of Yacine. The second group (blue) included 14% of the genotypes, which had erect stems and brown-eyed seeds and contained only mutants of Yacine and the parent. The third group (pink) was the second largest with 33% of the genotypes, which divided into 2 main subgroups. The first subgroup encompassed Melakh and its mutants and 2 mutants of Yacine. The second included mutants of Melakh and 2 mutants of Yacine, which shared several agromorphological characters, such as long pod and white seed with Melakh (Fig. 4).
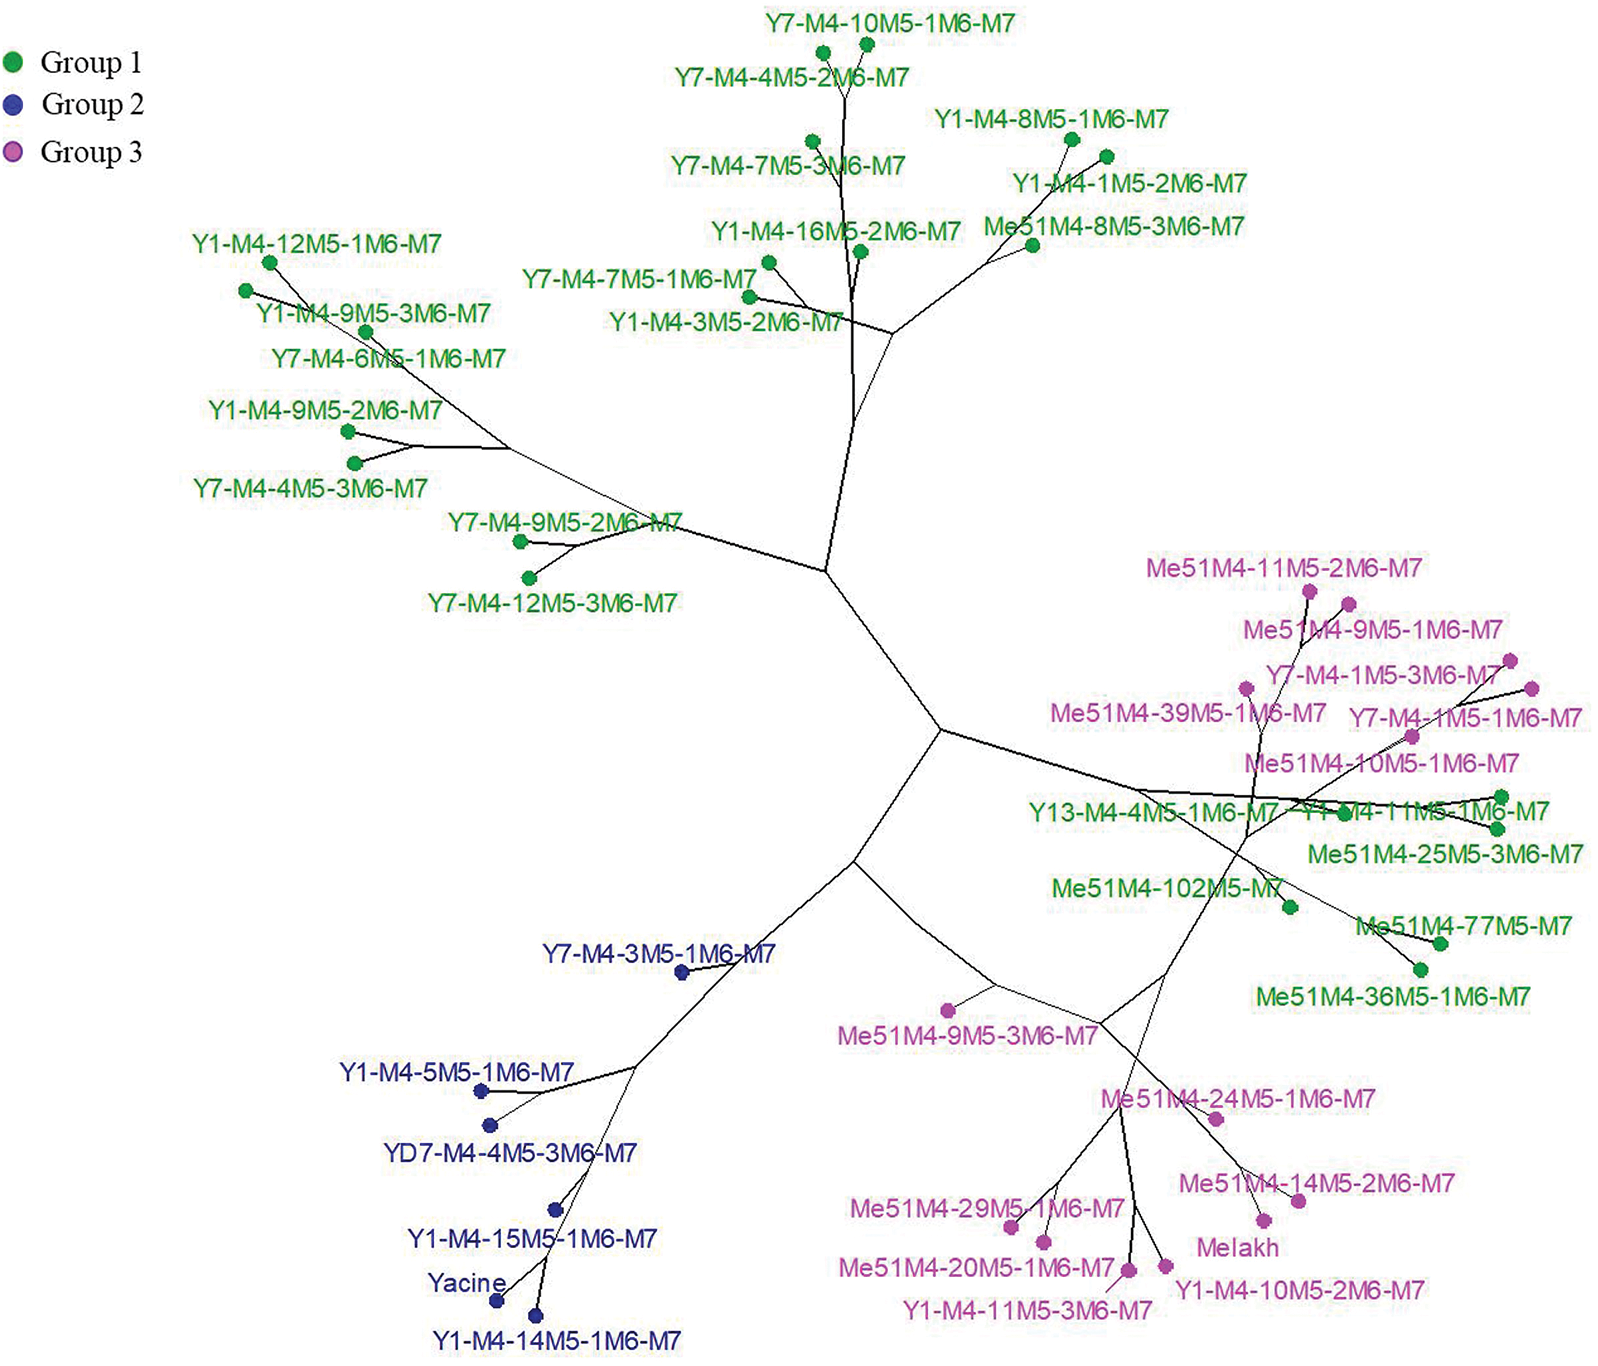
Figure 4: Hierarchical classification of 40 mutant lines and their parents based on agromorphological characters using Ward’s method.
Heritability of agromorphological characters in the mutants
The phenotypic (PCV) and genotypic (GCV) coefficients of variance and the heritability values for the different traits in the mutant populations are presented in Tab. 3. The PCV varied from 9.12% for seed length (SL) to 100.59% for pod number (PdN). Plant height (PH) recorded a high value (75.10%) of PCV. In contrast, days to flowering (DF), pod width (PdW), eye color (EC), and leaflet length (LF) showed low PCV values of 9.37, 10.14, 10.32, and 15.89%, respectively. The GCV values ranged from 5.97% for days to flowering (DF) to 67.12% for pod number (PdN). All the studied traits showed a genetic coefficient of variance (GCV) below 50% except for pod number (PdN, 67.12%) and seed color (SC, 52.59%). The genetic advance (GA) as a percentage of the mean recorded in the mutants ranged from 0.45% for petiole length (PeL) to 92.27% for pod number. High values of heritability were recorded for seed color (SC, 94.48%), stem pigmentation (SPig, 92.83%), flower color (FC, 78.01%), eye color (EC, 68.98%), pod length (PdL, 68.29%), pod width (PdW, 59.06%), seed weight (SWg, 57.58%), number of seeds per pod (NSP, 52.11%), and seed length (SL, 51.19%) (Tab. 3).
Table 3: Estimation of mean values of phenotypic coefficient of variance (PCV), genotypic coefficient of variation (GCV%), broad sense heritability (h2%) and genetic advance as % of the mean (GA%) of eighteen traits (quantitative and qualitative) in the M7 of 40 cowpea mutant lines
Genetic characterization of the mutants
Genetic diversity induced by mutagenesis revealed by ISSR markers
In total, the 13 ISSR markers used in this study gave polymorphism amplifying 129 bands (loci) in the 18 mutants and their two parents. The size of the amplified bands ranged from 150 to 2,000 bp. Of these, 111 (86%) bands were polymorphic with numbers ranging from 5 (UBC827) to 12 (UBC825 and UBC844) for each primer (Tab. 4).
Table 4: List of the Inter-simple sequence repeat (ISSR) primers with their annealing temperatures (Tm) used to genotype the mutants M7 and their parents, total number of bands, number of polymorphic bands, percentage of polymorphic bands and the band size range
The percentage of the polymorphic bands per primer ranged from 60% (UBC809) to 100% (UBC825, UBC844, 17899A, 17899B and HB10). The band frequencies ranged from 0.318 (UBC841) to 0.808 (HB12) with a mean of 0.473 ± 0.145 (Tab. 5). The genetic diversity ranged from 0.142 (UBC841 and UBC823) to 0.293 (UBC844 and 17899B) with a mean of 0.220 ± 0.049. The Polymorphic Information Content (PIC) values for each primer varied between 0.167 (UBC841) and 0.307 (HB09) with a mean of 0.238 ± 0.044 (Tab. 5).
Table 5: Band frequency, genetic diversity and polymorphism information content (PIC) of each ISSR locus
Based on these data, our analyses showed that the average diversity level for all the mutants and their parents was equal to 0.222. The level of genetic diversity observed in group 1 (h = 0.308) was higher than the one in group 2 (h = 0.146; p = 0.0001) and in group 3 (h = 0.212; p = 0.0001). The level of genetic diversity in group 3 was higher than in group 2 (p = 0.016). The genotypes which belonged to group 1 also recorded a greater number of private alleles (17 bands vs. 4 for group 2 and 7 for group 3, Tab. 6).
Table 6: Statistical analyses of genetic diversity level
Shannon’s information index was higher in group 1 (0.463) than in groups 2 (0.211) and 3 (0.319), but for the entire population, this value was 0.331. To investigate the genetic variance within and among genetic pools, AMOVA was carried out in this study. Our results revealed that the majority of the variance rather existed within groups (85%) than among groups (15%) (Tab. 7).
Table 7: Genetic variance within and among groups based on Analysis of Molecular Variance (AMOVA)
Population structure and genetic relationship among genotypes
Using STRUCTURE software (Pritchard et al., 2000), the evaluation of the delta k according to the Evanno method (Evanno et al., 2005) showed the highest peak at k = 3 (Fig. 5A) and the mean value of the logarithm of likelihood (LnP) (D) for k = 1 was lower than that of k = 3, which was the highest peak (Fig. 5B). The representation of the ancestry at k = 3 revealed three (3) genetic pools (Fig. 5C).
Figure 5: Structure of the mutant populations.
Group I included 30% of the mutants, while group II and group III encompassed 50 and 20% of the genotypes, respectively. The genetic relationship revealed by the dendrogram was in agreement with the STRUCTURE analysis, which clearly distinguished three groups. The first group contained 1 mutant of Melakh (Me51M4-39M5-1M6-M7) and 4 mutants of Yacine (Y1-M4-8M5-1M6-M7, Y1-M4-3M5-2M6-M7, Y1-M4-11M5-1M6-M7 and Y7-M4-4M5-3M6-M7). This group encompassed the highest number of admixed individuals. The second genetic pool contained exclusively the mutants of Yacine. Of these, Y1-M4-9M5-2M6-M7 and Y1-M4-9M5-3M6-M7 clustered with a high bootstrap value (98%). The admixed Y7-M4-1M5-1M6-M7 clustered with Y7-M4-6M5-1M6-M7 with 54% bootstrap value. The third genetic pool contained 3 mutants of Yacine (Y13-M4-4M5-1M6-M7, Y7-M4-12M5-3M6-M7 and Y7-M4-10M5-1M6-M7) and 5 mutants of Melakh (Me51M4-10M5-1M6-M7, Me51M4-11M5-2M6-M7, Me51M4-25M5-3M6-M7 and Me51M4-29M5-1M6-M7, Me51M4-77M5-M7). The variety Melakh clustered with its mutant, Me51M4-77M5-M7, with a high bootstrap value (94%) (Fig. 6A).
Figure 6: Neighbor-Joining Dendrogram of the 18 cowpea mutant lines and their parents based on the ISSR data.
The clustering of the genotypes resulting from the DAPC analysis identified 3 groups that did not show any individual genetically admixed (Fig. 6B). This result suggests that DAPC analysis was appropriate to assess mutant population structure by achieving better separation among the groups as it was also showed by the number of clusters identified (Fig. 7A). Groups 1 and 3 differed from each other based on the first axis of the DAPC. This classification was based on the loci 84, 37, 57, 105, 35, 10, and 106, which were the most discriminative, in decreasing order (Fig. 7B). Group 2 differed from the others on the second axis. These findings were based on the loci 97, 78, 87, 21, 105, 7, 82, 64, 47, and 12, which were the most discriminative, in decreasing order (Fig. 7C).
Figure 7: Discriminant Analysis of Principal Components (DAPC) for 18 cowpea mutant lines and their parents based on the ISSR data.
Wide genetic variability is a prerequisite for a successful breeding program, particularly in the era of climate change with its adverse effects leading to the erosion of the plant genetic resources. Thus, to broaden the crop’s genetic basis, a wide range of techniques have been used in the last decades. Among these, induced mutagenesis has been proved to be best for creating novel variation in crop genome and was used in this study to expand variability in cowpea, which experienced a single domestication event during the course of evolution.
Agromorphological variability analysis of the mutants
In this study, the percentage of germination of the irradiated seeds decreased compared with the control (Melakh and Yacine) regardless of the dose and the generation used. These results were in agreement with the findings of Melki and Marouani (2009), Horn et al. (2016), and Olasupo et al. (2016), who recorded similar observations during their studies. In contrast, Horn et al. (2016) recorded zero germination of cowpea-irradiated seeds at 300 Gy. In this study, 98.15% of field establishments were observed for the white-seeded Melakh M1 population at 300 Gy. This value reached 99.08% for brown-seeded Yacine M1 at 340 Gy. These results were in agreement with the findings of Olasupo et al. (2016), who suggested that radio-sensitivity is genotype-dependent as it was associated with seed characteristics (seed coat color, water content, thickness, and weight). Presently, it is well documented that ionizing radiation is injurious to enzymes and growth hormones, leading to biochemical and physiological modifications, cell death, abnormal cell division, tissue and organ failure, and growth disturbance (Lagoda, 2012; Mudibu et al., 2012; Ambavane et al., 2015). We can assume that these type of changes occurred in our irradiated seed materials as 11.11% and 11.50% of the Melakh mutant lines in M5 and M6, respectively, showed abnormities of leave numbers, corroborating the discoveries of Girija and Dhanavel (2009) and Nair and Mehta (2014) performed in cowpea mutants that were bi-foliated, tetra-foliated, penta-foliated, and hexa-foliated (Fig. S1). These disturbances would explain the change observed in leaf shapes of our mutants with 3 new forms (globular, subglobular, and hastate) (Fig. 1). In contrast, the investigations performed by Gnanamurthy et al. (2012) led to the discovery of only a globular form within their mutant populations.
Similar modifications induced early flowering in some Melakh and Yacine mutant lines, which is an important agronomic trait for farmers and breeders, particularly in the Sahel zone where the duration of the rainy season has become shorter. In addition, mutagenesis treatment affected flower coloration, which changed from white to white with purple border in Melakh and from white to white with purple border, purple or dark purple in the mutants of Yacine with a high heritable value (h2 = 78.01%) (Fig. 1, Tab. 3). These findings were in accordance with the observations of Horn et al. (2016) and Girija et al. (2013), who also noticed flower color variation in their cowpea mutant populations.
In this study, similar seed coat color variation was observed in the mutants of Yacine, the first time during the M4 generation, where one single plant produced white seeds, brown seeds, and white-browned seeds (Fig. 1J). However, only brown and white seeds were recorded from M5. Jaeger et al. (2018) reported that seed coat color is an important trait for consumer preference depending on the region. On the other hand, the seed coat color of Melakh mutants remained unchanged (white as the control) regardless of the generation. These results explained the high heritability value (h2 = 94.48%; Tab. 3) recorded for seed coat color in our populations. In accordance with this study, the variation of seed coat color in mutants was also recorded by Gaafar et al. (2016) and Horn et al. (2016), suggesting that mutation affected the candidate genes involved in the control of late stages in the flavonoid biosynthesis pathway namely the basic helix–loop–helix gene for the C locus, the WD-repeat gene for the W locus and the E3 ubiquitin ligase gene for the H locus (Herniter et al., 2019).
During this study, yield component (pod length, pod width, number of seeds per pod, seed length, and seed weight) variation with a high heritability value was noticed among the mutant genotypes compared with the controls. Similar results were recorded by Gnanamurthy et al. (2012), Goyal and Khan (2010), and Horn et al. (2016), which suggested that mutagenesis can be used to improve crop yield, which is one of the most important agronomic characteristics for breeders. High heritability, genetic advance, and genetic coefficient of variation values of pod length and number of seeds per pod recorded in this study suggest that these traits can be considered as attributes for the selection of the mutants. In addition, regardless of the generation (M5 to M7) and the environment, the pod length, and the number of seeds per pod, and the seed length and the seed weight were positively and significantly correlated during this study. In contrast, the variation of the correlation values among the traits might be due to the effect of interaction genotype x environment, which could induce epigenetic modifications impacting gene expression or gene segregation over generations.
The genetic relationship based on the agromorphological characters revealed that the mutant populations were subdivided into 3 groups (Fig. 4). The first group included genotypes that notably deviated from their respective parents, thereby suggesting that the irradiation doses used were efficient enough to induce a heterogeneous population as any polytony was observed in the dendrogram. In the remaining two groups, most of the mutants clustered with their respective control, as reported by Laskar and Khan (2017). Taken together, these findings meet the recommendation of Rohman et al. (2004), who suggested that the cluster contributing to the greatest divergence can help in a breeding program. The PCA results (Fig. 3) in this study revealed that yield-related traits such as pod length, number of seeds per pod and seed weight are major contributors to genetic divergence, which is in accordance with the report of Afuape et al. (2011), who suggested that PCA is suitable for selection of the best performing genotypes for a future breeding program.
Genetic diversity of mutants based on molecular markers
In the present study, the gene diversity and the PIC value, which is a good indicator of the usefulness of a marker to determine its inheritance between offspring and parents, were estimated in our mutants. Our results showed that, in general, the gene diversity and the PIC were close (Fig. 5), suggesting the evenness of allele frequencies in the mutant populations as reported by Shete et al. (2000). According to Botstein et al. (1980), a marker is considered highly informative if the PIC is ≥ 0.50, moderately informative with PIC values ranging from 0.25 to 0.5, and slightly informative at values less than 0.25. Based on this, the UBC827, UBC844, HB9, 17899B, and UBC809 were moderately informative, whereas the remaining 8 markers were slightly informative with PIC scores higher than the scores recorded in the cowpea mutant populations developed by Gaafar et al. (2016). These differences could be attributed to the low irradiation dose (50 Gy) used in their study, which might have induced fewer mutations and less variability compared to the 300 Gy and 340 Gy employed in this study. In addition, Gaafar et al. (2016) used ethidium bromide for DNA staining, which is less sensitive than the GelRed used in our study, leading to more DNA bands scoring. In contrast, the PIC scores reported in the natural populations of Vigna radiata, V. mungo (Tantasawat et al., 2010), and V. unguiculata (Igwe et al., 2017) were higher probably due to a high number of mutations these genomes have undergone through evolution. Our results show that ISSRs are accurate markers to discriminate cowpea mutants for the identification and selection of new genotypes. In this study, the ISSR primers UBC825 (AC repeat motif), UBC844 (CT repeat motif), 17899A and 17899B (CA repeat motif) and HB12 (GA repeat motif) gave 100% polymorphic bands, which suggest that these motifs are abundant in the genome of cowpea. Similar observations have been reported in Arachis hypogea (Ferguson et al., 2004; Mondal et al., 2009) and Vigna mungo (Souframanien and Gopalakrishna, 2004).
Population structure and genetic relationship of the mutants based on ISSR markers
Analyzing population structure in mutants is relevant to understand the organization of the genetic variation, which is driven by the combined effect of recombination, mutation, demographic history, and natural selection. Based on this, and due to the informative nature of the ISSR markers used, the generated data subjected to STRUCTURE analysis showed 3 subpopulations (optimal k = 3). These results were consistent with the organization of the dendrogram (Fig. 6A). The clustering of the Me51M4-39M5-1M6-M7 and Y1-M4-8M5-1M6-M7 mutants, two putative genotypes tolerant to the nematode, Meloidogyne incognita, compared with their parents (Diouf, unpublished data), might suggest that this character is distributed in this group (group 1). In addition, this group encompassed genotypes with long pod length compared with their respective parents. These findings are relevant to select the best mutant genotypes, which can be proposed for variety registration, popularization, novel gene discoveries and breeding programs. These results demonstrate the ability of gamma rays to induce large genetic changes in DNA material. The findings were in accordance with previous studies performed on several crops, such as cowpea (Gaafar et al., 2016; Horn et al., 2016; Ezzat et al., 2019) and chickpea (Amri-Tiliouine et al., 2018). The dendrogram analysis revealed a group (group 2) encompassing only Yacine mutants. In this group, the Y7-M4-4M5-3M6-M7 genotype could be included as it shares several morphological characters, such as the erected shape. Thus, ISSRs are accurate markers to discriminate these genetic lines. In contrast, group 3 was more heterogeneous and comprised Yacine, its mutants, and its progenitor Melakh and its mutants. These results suggested that the assignation of Melakh to the group could be an artifact. The clustering of Yacine and its relative Melakh in the same group 1 demonstrate the discriminating power of the DNA based molecular marker.
Genetic differentiation within and between groups
In the present study, STRUCTURE analysis and the dendrogram results showed 3 groups that aroused our curiosity to understand the variability within and between clusters by assessing the genetic parameters, such as Nei’s genetic diversity and Shannon’s information index, which are important to measure the degree of genetic diversity among and within groups in a population. Our results showed that group 1 had a high Nei’s genetic diversity and Shannon’s information index and a high number (17) of private alleles unlike group 2, which had the lowest diversity, suggesting that the gamma irradiation doses were efficient to induce new alleles in the mutants (Tab. 6). Identification of private alleles is important in plant breeding and conservation, as their presence in a single population might be linked to specific agronomic traits usable for new genotype selection in a mutant population. In accordance with this, the AMOVA results revealed that the majority of the total variation (85%) was noticed within-group variation, suggesting a high level of differentiation, while only 15% of the variation was recorded between-group (Tab. 7). According to Seyoum et al. (2018), small variation between groups might be an advantage due to its usefulness to study marker-traits association. In contrast, a large variation between groups could reduce the possibility to detect the effects of single genes in a genome-wide association study (Flint-Garcia et al., 2005). Based on these and taking into account the important agronomic traits recorded in our mutant populations, a genome-wide association can be performed in order to detect the molecular markers associated with these characters and usable in a molecular breeding program.
To analyze population structure, different methods such as STRUCTURE, Principal Component Analysis, and DAPC can be used. The latter provides complementary information leading to better assignments of individuals to the accurate group, and its advantage is that it is not necessary for the target population to be in Hardy–Weinberg equilibrium. In this study, the DAPC results divided the mutant populations into well-defined 3 groups with less admixture compared to the STRUCTURE results. Indeed, the ancestry value recorded in the STRUCTURE analysis, allowing the assignment Me51M4-14M5-2M6-M7 and Melakh to group 1, was less than 70%. In contrast, this abnormality was resolved using DAPC as it did with Y7-M4-1M5-1M6-M7 and Yacine to group 2 and 3, respectively. These results were in accordance with previous studies carried out in Solanum tuberosum (Deperi et al., 2018), landraces and inbred cultivars of Prunus avium (Campoy et al., 2016), and Panax ginseng germplasm (Lee et al., 2020), which revealed that DAPC gave a better grouping resolution than STRUCTURE. In addition, the DAPC analysis showed that the loci such as 35 and 37 (amplified by ISSR primer HB10), and 57 (amplified by ISSR primer UBC807) greatly contributed to the discrimination of group 1 and group 3. In contrast, loci 97, 78, 21, and 105 amplified by 17899B, UBC844, UBC841, and HB12, respectively, were also involved in the differentiation of group 2 from the other groups (Fig. 7B). The primer HB12 was suspected by Gaafar et al. (2016) to be usable in a marker-assisted selection for high yield genotypes. These results suggest that DAPC is an appropriate method to analyze the organization of the genetic variation within and between mutant population and to identify the best genotypes. For instance, group 1 (Fig. 6B) included white-seeded genotypes and long pod lengths, unlike group 3, which consisted of short pod length genotypes.
Gamma irradiation is a powerful tool to induce genetic variability in cowpea to broaden its genetic basis as significant variations were noticed on the agromorphological (plant growth habit, flower color, pod length and weight, and seed color, size and weight) parameters among our mutant populations. Genetic diversity analysis using datasets generated by molecular markers revealed 3 subpopulations among our mutants. Overall, efficient exploitation of both agromorphological and molecular data led to the identification of promising high yielding new mutant genotypes which can be proposed for multi trial tests to assess their performance, stability and nutritional value in different agroecological conditions and are valuable genetic resources for breeding programs and gene discoveries.
Acknowledgement: We thank the IAEA TC Division for Africa and the NAFA Joint FAO/IAEA Division of Nuclear Techniques in Food and Agriculture for providing funding and technical support to this project. We particularly acknowledge the advice and support of both Mr Thuloane Bernard Tsehlo and Dr Fatma Sarsu, who were the Programme Management Officer and the Technical Officer to the project, respectively.
We would also like to thank the anonymous reviewers for their valuable comments.
Author Contributions: MD, FAB and DD designed the study. MD and SD performed DNA extraction and genotyping. MD and SD performed data analyses, OD performed STRUCTURE and DAPC analyses. MD, SD, FAB and DD drafted the manuscript. All authors contributed to the final version.
Availability of Data and Materials: The data and materials represented in this study are available from the corresponding author upon request.
Funding Statement: The project was funded by the International Atomic energy Agency (IAEA) under RAF5066 and RAF5076.
Conflicts of Interest: The authors declare that the research was conducted in the absence of any commercial or financial relationships that could be construed as a potential conflict of interest.
Adekola OF, Oluleye F. (2007). Induction of genetic variation in Cowpea (Vigna unguiculata L. Walp.) by gamma irradiation. Asian Journal of Plant Science 6: 869–873. DOI 10.3923/ajps.2007.869.873. [Google Scholar] [CrossRef]
Adekola OF, Oluleye F. (2008). Induced tolerance of cowpea mutants to Maruca vitriata (Fabricius) (Lepidoptera: Pyralidae). African Journal of Biotechnology 7: 878–883. [Google Scholar]
Afuape SO, Okocha PI, Njoku D. (2011). Multivariate assessment of the agromorphological variability and yield components among sweet potato (Ipomoea batatas (L.) Lam) landraces. African Journal of Plant Science 5: 123–132. [Google Scholar]
Allard RW. (1960). Principles of plant breeding. New York: John Wiley and Sons Inc., 92–93. [Google Scholar]
Ambavane AR, Sawardekar SV, Sawantdesai SA, Gokhale NB. (2015). Studies on mutagenic effectiveness and efficiency of gamma rays and its effect on quantitative traits in finger millet (Eleusine coracana L. Gaertn). Journal of Radiation Research and Applied Sciences 8: 120–125. DOI 10.1016/j.jrras.2014.12.004. [Google Scholar] [CrossRef]
Amri-Tiliouine W, Laouar M, Abdelguerfi A, Jankowicz-Cieslak J, Jankuloski L, Till BJ. (2018). Genetic variability induced by gamma rays and preliminary results of low-cost TILLING on M2 generation of chickpea (Cicer arietinum L.). Frontiers in Plant Science 9: 1568. DOI 10.3389/fpls.2018.01568. [Google Scholar] [CrossRef]
Assefa K, Ketema S, Tefera H, Nguyen HT, Blum A, Ayele M, Bai G, Simane B, Kefyalew T. (1999). Diversity among germplasm lines of the Ethiopian cereal tef [Eragrostis tef (Zucc.) Trotter]. Euphytica 106: 87–97. DOI 10.1023/A:1003582431039. [Google Scholar] [CrossRef]
Badiane FA, Gowda BS, Cissé N, Diouf D, Sadio O, Timko MP. (2012). Genetic relationship of cowpea (Vigna unguiculata) varieties from Senegal based on SSR markers. Genetics and Molecular Research 11: 292–304. DOI 10.4238/2012.February.8.4. [Google Scholar] [CrossRef]
Badiane FA, Diouf M, Diouf D (2014). Cowpea. In: Singh M, Bisht IS, Dutta M, (eds.Broadening the Genetic Base of Grain Legumes. India, Springer, pp. 95–114. DOI 10.1007/978-81-322-2023-7_5. [Google Scholar] [CrossRef]
Badr A, Ahmed HIS, Hamouda M, Halawa M, Elhiti MA. (2014). Variation in growth, yield and molecular genetic diversity of M2 plants of cowpea following exposure to gamma radiation. Life Science Journal 11: 10–19. [Google Scholar]
Blair MW, Panaud O, McCouch SR. (1999). Inter-simple sequence repeat (ISSR) amplification for analysis of microsatellite motif frequency and fingerprinting in rice (Oryza sativa L.). Theoretical and Applied Genetics 98: 780–792. DOI 10.1007/s001220051135. [Google Scholar] [CrossRef]
Botstein D, White RL, Skolnick M, Davis RW. (1980). Construction of a genetic linkage map in man using restriction fragment length polymorphisms. American Journal of Human Genetics 32: 314. [Google Scholar]
Boukar O, Massawe F, Muranaka S, Franco J, Maziya-Dixon B, Singh B, Fatokun C. (2011). Evaluation of cowpea germplasm lines for protein and mineral concentrations in grains. Plant Genetic Resources 9: 515–522. DOI 10.1017/S1479262111000815. [Google Scholar] [CrossRef]
Boukar O, Fatokun CA, Huynh BL, Roberts PA, Close TJ. (2016). Genomic tools in cowpea breeding programs: Status and perspectives. Frontiers in Plant Science 7: 445. DOI 10.3389/fpls.2016.00757. [Google Scholar] [CrossRef]
Campoy JA, Lerigoleur-Balsemin E, Christmann H, Beauvieux R, Girollet N, Quero-García J, Dirlewanger E, Barreneche T. (2016). Genetic diversity, linkage disequilibrium, population structure and construction of a core collection of Prunus avium L. landraces and bred cultivars. BMC Plant Biology 16: 49. DOI 10.1186/s12870-016-0712-9. [Google Scholar] [CrossRef]
Cisse N, Ndiaye M, Thiaw S, Hall AE. (1997). Registration of ‘Melakh’ cowpea. Crop Science 37: 1978. DOI 10.2135/cropsci1997.0011183x003700060054x. [Google Scholar] [CrossRef]
Cisse N, Ndiaye M, Sene A. (2005). Registration of ‘Yacine’ cowpea. Crop Science 45: 413. DOI 10.2135/cropsci2005.0413a. [Google Scholar] [CrossRef]
Deperi SI, Tagliotti ME, Bedogni MC, Manrique-Carpintero NC, Coombs J, Zhang R, Douches D, Huarte MA. (2018). Discriminant analysis of principal components and pedigree assessment of genetic diversity and population structure in a tetraploid potato panel using SNPs. PLoS One 13: e0194398. DOI 10.1371/journal.pone.0194398. [Google Scholar] [CrossRef]
Diouf D. (2011). Recent advances in cowpea [Vigna unguiculata (L.) Walp.] omics research for genetic improvement. African Journal of Biotechnology 10: 2803–2810. DOI 10.5897/AJBx10.015. [Google Scholar] [CrossRef]
Earl DA, vonHoldt B. (2012). STRUCTURE HARVESTER: A website and program for visualizing STRUCTURE output and implementing the Evanno method. Conservation Genetics Resources 4: 359–361. DOI 10.1007/s12686-011-9548-7. [Google Scholar] [CrossRef]
Evanno G, Regnaut S, Goudet J. (2005). Detecting the number of clusters of individuals using the software structure: A simulation study. Molecular Ecology 14: 2611–2620. DOI 10.1111/j.1365-294X.2005.02553.x. [Google Scholar] [CrossRef]
Ezzat A, Adly M, El-Fiki A. (2019). Morphological, agronomical and molecular characterization in irradiated Cowpea (Vigna unguiculata (L.) Walp.) and detection by start codon target markers. Journal of Radiation Research and Applied Sciences 12: 403–412. DOI 10.1080/16878507.2019.1686578. [Google Scholar] [CrossRef]
Falush D, Stephens M, Pritchard JK. (2003). Inference of population structure using multilocus genotype data: Linked loci and correlated allele frequencies. Genetics 164: 1567–1587. [Google Scholar]
Ferguson ME, Burow MD, Schulze SR, Bramel PJ, Paterson AH, Kresovich S, Mitchell S. (2004). Microsatellite identification and characterization in peanut (A. hypogaea L.). Theoretical and Applied Genetics 108: 1064–1070. DOI 10.1007/s00122-003-1535-2. [Google Scholar] [CrossRef]
Flint-Garcia SA, Thuillet A-C, Yu J, Pressoir G, Romero SM, Mitchell SE, Doebley J, Kresovich S, Goodman MM, Buckler ES. (2005). Maize association population: A high-resolution platform for quantitative trait locus dissection. Plant Journal 44: 1054–1064. DOI 10.1111/j.1365-313X.2005.02591.x. [Google Scholar] [CrossRef]
Fulton TM, Chunwongse J, Tanksley SD, Masaphy S, Levanon D, Henis Y, Venkateswarlu K, Kelly SL. (1995). Microprep protocol for extraction of DNA from tomato and other herbaceous plants. Plant Molecular Biology Reporter 13: 207–209. DOI 10.1007/BF02670897. [Google Scholar] [CrossRef]
Gaafar RM, Hamouda M, Badr A. (2016). Seed coat color, weight and eye pattern inheritance in gamma-rays induced cowpea M2-mutant line. Journal of Genetic Engineering and Biotechnology 14: 61–68. DOI 10.1016/j.jgeb.2015.12.005. [Google Scholar] [CrossRef]
Girija M, Dhanavel D. (2009). Mutagenic effectiveness and efficiency of gamma rays ethyl methane sulphonate and their combined treatments in cowpea (Vigna unguiculata L. Walp.). Global Journal of Molecular Sciences 4: 68–75. [Google Scholar]
Girija M, Gnanamurthy S, Dhanavel D. (2013). Genetic diversity analysis of cowpea mutant (Vigna unguiculata (L.) Walp) as revealed by RAPD marker. Indian Journal of Applied Research 1: 139–147. [Google Scholar]
Gnanamurthy S, Mariyammal S, Dhanavel D, Bharathi T. (2012). Effect of gamma rays on yield and yield components characters R3 generation in cowpea (Vigna unguiculata (L.) Walp). International Journal of Plant Research 2: 39–42. DOI 10.5923/j.plant.20120201.06. [Google Scholar] [CrossRef]
Goyal S, Khan S. (2010). Induced mutagenesis in urdbean (Vigna mungo L. HepperA review. International Journal of Botany 6: 194–206. DOI 10.3923/ijb.2010.194.206. [Google Scholar] [CrossRef]
Herniter IA, Lo R, Muñoz-Amatriaín M, Lo S, Guo YN, Huynh BL, Lucas M, Jia Z, Roberts PA, Lonardi S, Close TJ. (2019). Seed coat pattern QTL and development in cowpea (Vigna unguiculata [L.] Walp.). Frontiers in Plant Science 10: 1346. DOI 10.3389/fpls.2019.01346. [Google Scholar] [CrossRef]
Horn LN, Ghebrehiwot HM, Shimelis HA. (2016). Selection of novel cowpea genotypes derived through gamma irradiation. Frontiers in Plant Science 7: 869. DOI 10.3389/fpls.2016.00262. [Google Scholar] [CrossRef]
International Board for Plant Genetic Resources (IBPGR). (1983). Cowpea descriptors, pp. 1–30. Rome. [Google Scholar]
Igwe DO, Afiukwa CA, Ubi BE, Ogbu KI, Ojuederie OB, Ude GN. (2017). Assessment of genetic diversity in Vigna unguiculata L. (Walp) accessions using inter-simple sequence repeat (ISSR) and start codon targeted (SCoT) polymorphic markers. BMC Genetics 18: 98. DOI 10.1186/s12863-017-0567-6. [Google Scholar] [CrossRef]
Jaccard P. (1902). Lois de distribution florale dans la zone alpine. Bulletin de la Société Vaudoise des Sciences Naturelles 38: 69–130. [Google Scholar]
Jaccard P. (1912). The distribution of the flora in the Alpine zone. New Phytologist 11: 37–50. DOI 10.1111/j.1469-8137.1912.tb05611.x. [Google Scholar] [CrossRef]
Jaeger SR, Antúnez L, Ares G, Swaney-Stueve M, Jin D, Harker FR. (2018). Quality perceptions regarding external appearance of apples: Insights from experts and consumers in four countries. Postharvest Biology and Technology 146: 99–107. DOI 10.1016/j.postharvbio.2018.08.014. [Google Scholar] [CrossRef]
Jombart T. (2008). adegenet: A R package for the multivariate analysis of genetic markers. Bioinformatics 24: 1403–1405. DOI 10.1093/bioinformatics/btn129. [Google Scholar] [CrossRef]
Johnson HW, Robinson HF, Comstock RE. (1955). Estimates of genetic and environmental variability in soybeans. Agronomy Journal 47: 314–318. DOI 10.2134/agronj1955.00021962004700070009x. [Google Scholar] [CrossRef]
Joshi P, Dhawan V. (2007). Assessment of genetic fidelity of micropropagated Swertia chirayita plantlets by ISSR marker assay. Biologia Plantarum 51: 22–26. DOI 10.1007/s10535-007-0005-0. [Google Scholar] [CrossRef]
Jukanti AK, Gaur PM, Gowda CLL, Chibbar RN (2012). Nutritional quality and health benefits of chickpea (Cicer arietinum L.A review. British Journal of Nutrition 108: S11–S26. DOI 10.1017/S0007114512000797. [Google Scholar] [CrossRef]
Lagoda PJI (2012). Effects of radiation on living cells and plants. In: Shu QY, Forster BP, Nakagawa H (eds.Plant Mutation Breeding and Biotechnology. Joint FAO/IAEA Division of Nuclear Techniques in Food and Agriculture International Atomic Energy Agency, pp. 123–134. Vienna, CABI, FAO, Oxfordshire, Rome. DOI 10.1079/9781780640853.0123. [Google Scholar] [CrossRef]
Laskar RA, Khan S (2017). Assessment on induced genetic variability and divergence in the mutagenized lentil populations of microsperma and macrosperma cultivars developed using physical and chemical mutagenesis. PLoS One 12: 1–18. DOI 10.1371/journal.pone.0184598. [Google Scholar] [CrossRef]
Lee KJ, Lee JR, Sebastin R, Cho GT, Hyun DY. (2020). Molecular genetic diversity and population structure of ginseng germplasm in RDA-genebank: Implications for breeding and conservation. Agronomy 10: 68. DOI 10.3390/agronomy10010068. [Google Scholar] [CrossRef]
Li CD, Fatokun CA, Ubi B, Singh BB, Scoles GJ. (2001). Determining genetic similarities and relationships among cowpea breeding lines and cultivars by microsatellite markers. Crop Science 41: 189–197. DOI 10.2135/cropsci2001.411189x. [Google Scholar] [CrossRef]
Liu K, Muse SV. (2005). PowerMarker: An integrated analysis environment for genetic marker analysis. Bioinformatics 21: 2128–2129. DOI 10.1093/bioinformatics/bti282. [Google Scholar] [CrossRef]
Melki M, Marouani A. (2009). Effects of gamma rays irradiation on seed germination and growth of hard wheat. Environmental Chemistry Letters 8: 307–310. DOI 10.1007/s10311-009-0222-1. [Google Scholar] [CrossRef]
Mondal S, Sutar SR, Badigannavar AM. (2009). Assessment of genetic diversity in cultivated groundnut (Arachis hypogaea L.) with differential responses to rust and late leaf spot using ISSR markers. Indian Journal of Genetics and Plant Breeding 69: 219–224. [Google Scholar]
Morita R, Kusaba M, Iida S, Yamaguchi H, Nishio T, Nishimura M. (2009). Molecular characterization of mutations induced by gamma irradiation in rice. Genes & Genetic Systems 84: 361–370. DOI 10.1266/ggs.84.361. [Google Scholar] [CrossRef]
Mudibu J, Nkongolo KKC, Kalonji-Mbuyi A, Kizungu RV. (2012). Effect of gamma irradiation on morpho-agronomic characteristics of soybeans (Glycine max L.). American Journal of Plant Sciences 3: 720–726. DOI 10.4236/ajps.2012.33039. [Google Scholar] [CrossRef]
Nair R, Mehta AK. (2014). Induced mutagenesis in cowpea [Vigna unguiculata (L.) Walp] var. Arka Garima. Indian Journal of Agricultural Research 48: 247–257. DOI 10.5958/0976-058X.2014.00658.1. [Google Scholar] [CrossRef]
Naito K, Kusaba M, Shikazono N, Takano T, Tanaka A, Tanisaka T, Nishimura M. (2005). Transmissible and nontransmissible mutations induced by irradiating Arabidopsis thaliana pollen with γ-rays and carbon ions. Genetics 169: 881–889. DOI 10.1534/genetics.104.033654. [Google Scholar] [CrossRef]
Nova MV, Leite NGA, Houllou LM, Medeiros LV, Neto AL, Hsie BS, Borges-Paluch LR, Santos BS, Araujo CSF, Rocha AA. (2014). Genetic variability and resistance of cultivars of cowpea [Vigna unguiculata (L.) Walp] to cowpea weevil (Callosobruchus maculatus Fabr.). Genetics and Molecular Research 13: 2323–2332. DOI 10.4238/2014.March.31.12. [Google Scholar] [CrossRef]
Olasupo FO, Ilori CO, Forster BP, Bado S. (2016). Mutagenic effects of gamma radiation on eight accessions of cowpea (Vigna unguiculata [L.] Walp.). American Journal of Plant Science 7: 339–351. DOI 10.4236/ajps.2016.72034. [Google Scholar] [CrossRef]
Olasupo FO, Ilori CO, Forster BP, Bado S. (2018). Selection for novel mutations induced by gamma irradiation in cowpea (Vigna unguiculata [L] Walp.). International Journal of Plant Breeding and Genetics 12: 1–12. DOI 10.3923/ijpbg.2018.1.12. [Google Scholar] [CrossRef]
Peakall R, Smouse PE. (2012). GenAlEx 6.5: Genetic analysis in Excel. Population genetic software for teaching and research-an update. Bioinformatics 28: 2537–2539. DOI 10.1093/bioinformatics/bts460. [Google Scholar] [CrossRef]
Perrier X, Jacquemoud-Collet J. (2015). DARwin software. 2006. Darwin Cirad Fr darwin. [Google Scholar]
Pritchard JK, Stephens M, Donnelly P. (2000). Inference of population structure using multilocus genotype data. Genetics 155: 945–959. [Google Scholar]
Quin FM. (1995). Introduction. In: Singh BB, Mohan-Raj DR, Dashiell KE, Jackai LEN, Advances in Cowpea Research. Ibadan: Co-Publication of International Institute of Tropical Agriculture (IITA); Japan International Research Center for Agricultural Sciences (JIRCASix–xv. [Google Scholar]
R Core Team (2019). R: A language and environment for statistical computing. Vienna, Austria: R Foundation for Statistical Computing. https://www.r-project.org/. [Google Scholar]
Reddy MP, Sarla N, Siddiq EA. (2002). Inter simple sequence repeat (ISSR) polymorphism and its application in plant breeding. Euphytica 128: 9–17. DOI 10.1023/A:1020691618797. [Google Scholar] [CrossRef]
Robinson HF, Comstock RE, Harvey PH. (1949). Estimates of heritability and the degree of dominance in Corn. Agronomy Journal 41: 353–359. DOI 10.2134/agronj1949.00021962004100080005x. [Google Scholar] [CrossRef]
Rohman MM, Hakim MA, Sultana NA, Kabir ME, Hasanuzzan M, Ali M. (2004). Genetic divergence analysis in sorghum (Sorghum bicolor L.). Asian Journal of Plant Science 3: 211–214. DOI 10.3923/ajps.2004.211.214. [Google Scholar] [CrossRef]
Saitou N, Nei M. (1987). The neighbor-joining method: A new method for reconstructing phylogenetic trees. Molecular Biology and Evolution 4: 406–425. DOI 10.1093/oxfordjournals.molbev.a040454. [Google Scholar] [CrossRef]
Schum A. (2003). Mutation breeding in ornamentals: An efficient breeding method? XXI International Eucarpia Symposium on Classical versus Molecular Breeding of Ornamentals-Part I 612: 47–60. DOI 10.17660/actahortic.2003.612. [Google Scholar] [CrossRef]
Seyoum M, Du XM, He SP, Jia YH, Pan Z, Sun JL. (2018). Analysis of genetic diversity and population structure in upland cotton (Gossypium hirsutum L.) germplasm using simple sequence repeats. Journal of Genetics 97: 513–522. DOI 10.1007/s12041-018-0943-7. [Google Scholar] [CrossRef]
Shete S, Tiwari H, Elston RC. (2000). On estimating the heterozygosity and polymorphism information content value. Theoretical Population Biology 57: 265–271. DOI 10.1006/tpbi.2000.1452. [Google Scholar] [CrossRef]
Shin JM, Kim BK, Seo SG, Jeon SB, Kim JS, Jun B, Kang SY, Lee JS, Chung MN, Kim SH. (2011). Mutation breeding of sweet potato by gamma-ray radiation. African Journal of Agricultural Research 6: 1447–1454. [Google Scholar]
Singh RK, Chaudhary BD. (1985). Biometrical methods in quantitative genetic analysis. pp. 318. Kalyani, New Delhi, India. [Google Scholar]
Sivasubramanian S, MadhavaMenon P. (1973). Genotypic and phenotypic variability in rice. Madras Agricultural Journal 60: 1093–1096. [Google Scholar]
Sneath PS, Soka LRR. (1973). Numerical Taxonomy. San Francisco, CA: WH Freeman. [Google Scholar]
Souframanien J, Gopalakrishna T. (2004). A comparative analysis of genetic diversity in blackgram genotypes using RAPD and ISSR markers. Theoretical and Applied Genetics 109: 1687–1693. DOI 10.1007/s00122-004-1797-3. [Google Scholar] [CrossRef]
Tantasawat P, Trongchuen J, Prajongjai T, Thongpae T, Petkhum C, Seehalak W, Machikowa T. (2010). Variety identification and genetic relationships of mungbean and blackgram in Thailand based on morphological characters and ISSR analysis. African Journal of Biotechnology 9: 4452–4464. DOI 10.1016/j.scienta.2009.12.033. [Google Scholar] [CrossRef]
SUPPLEMENTARY FILES
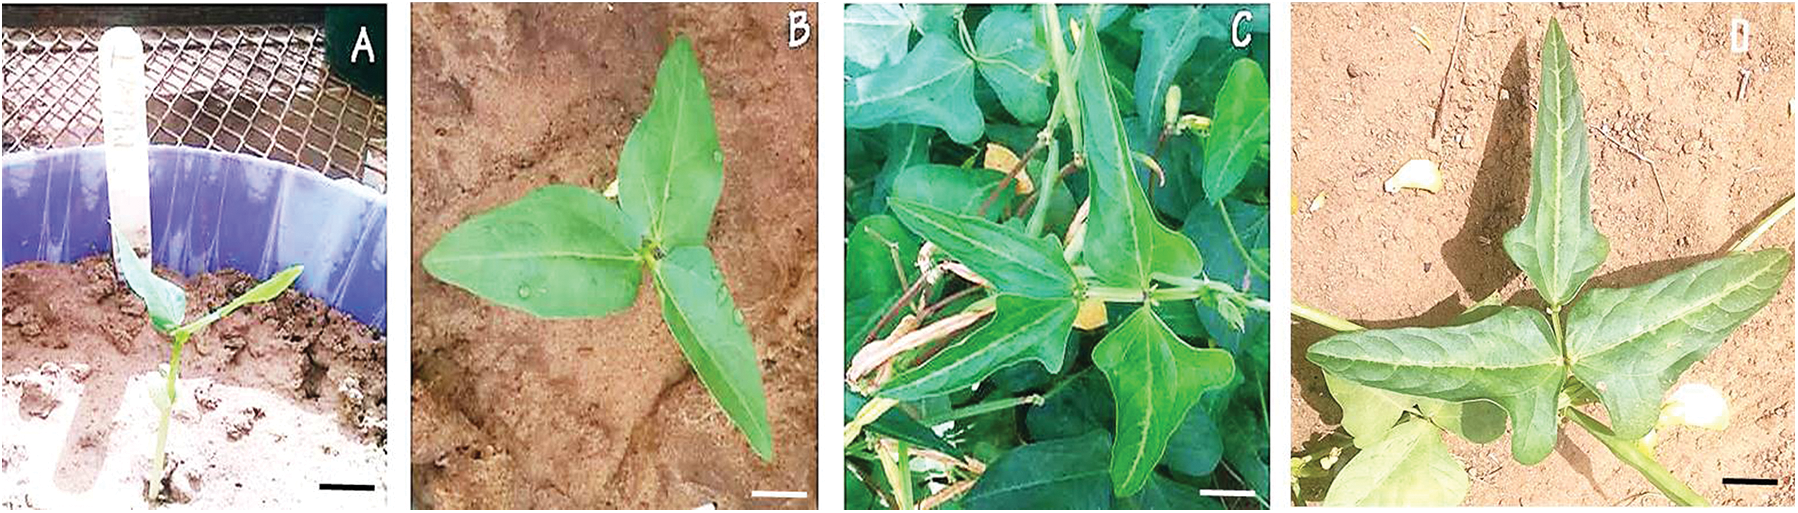
Figure S1: First Leave abnormalities observed among the Melakh mutants.
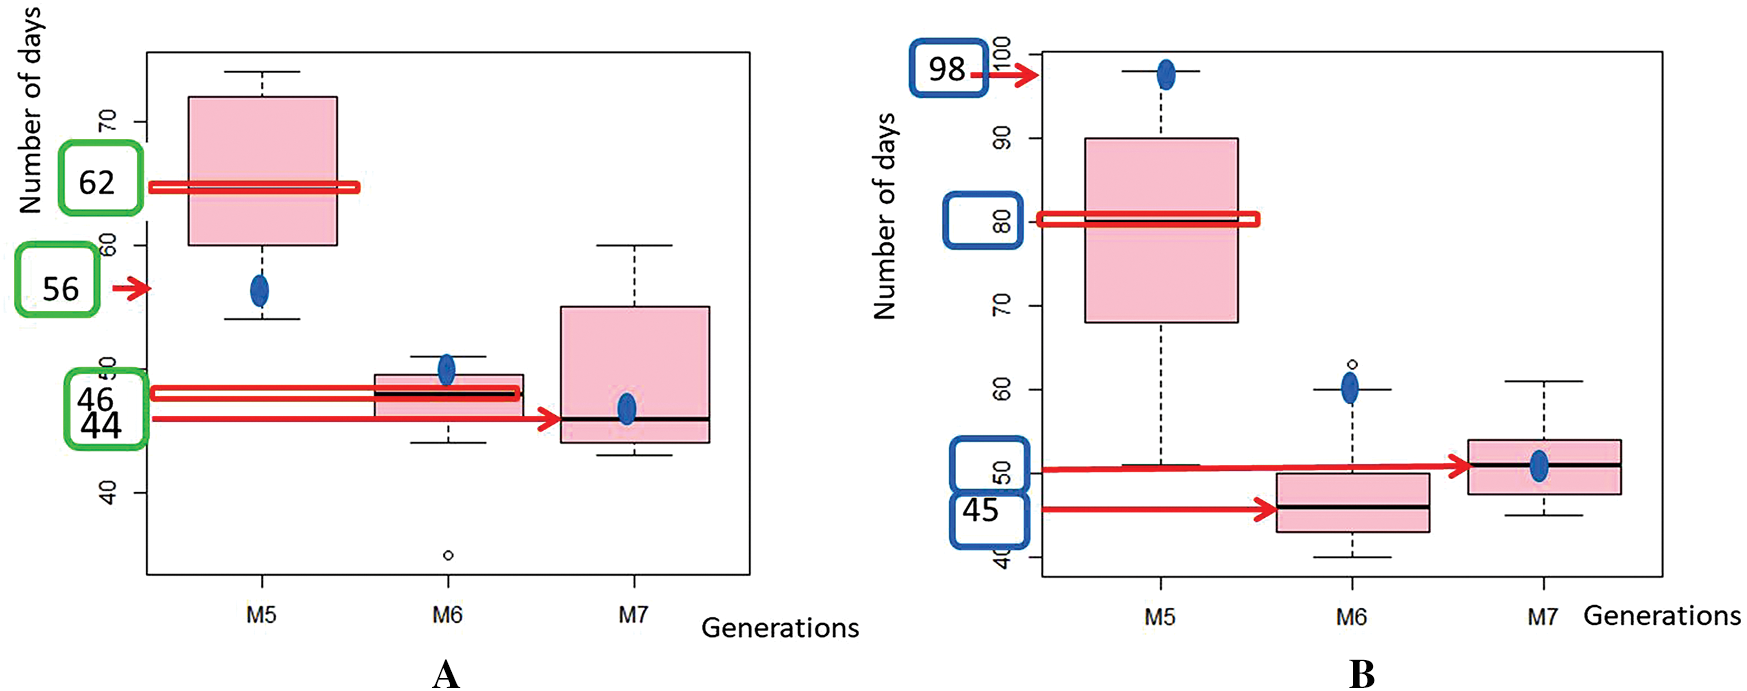
Figure S2: Variation of the days to flowering (DF) in the populations.
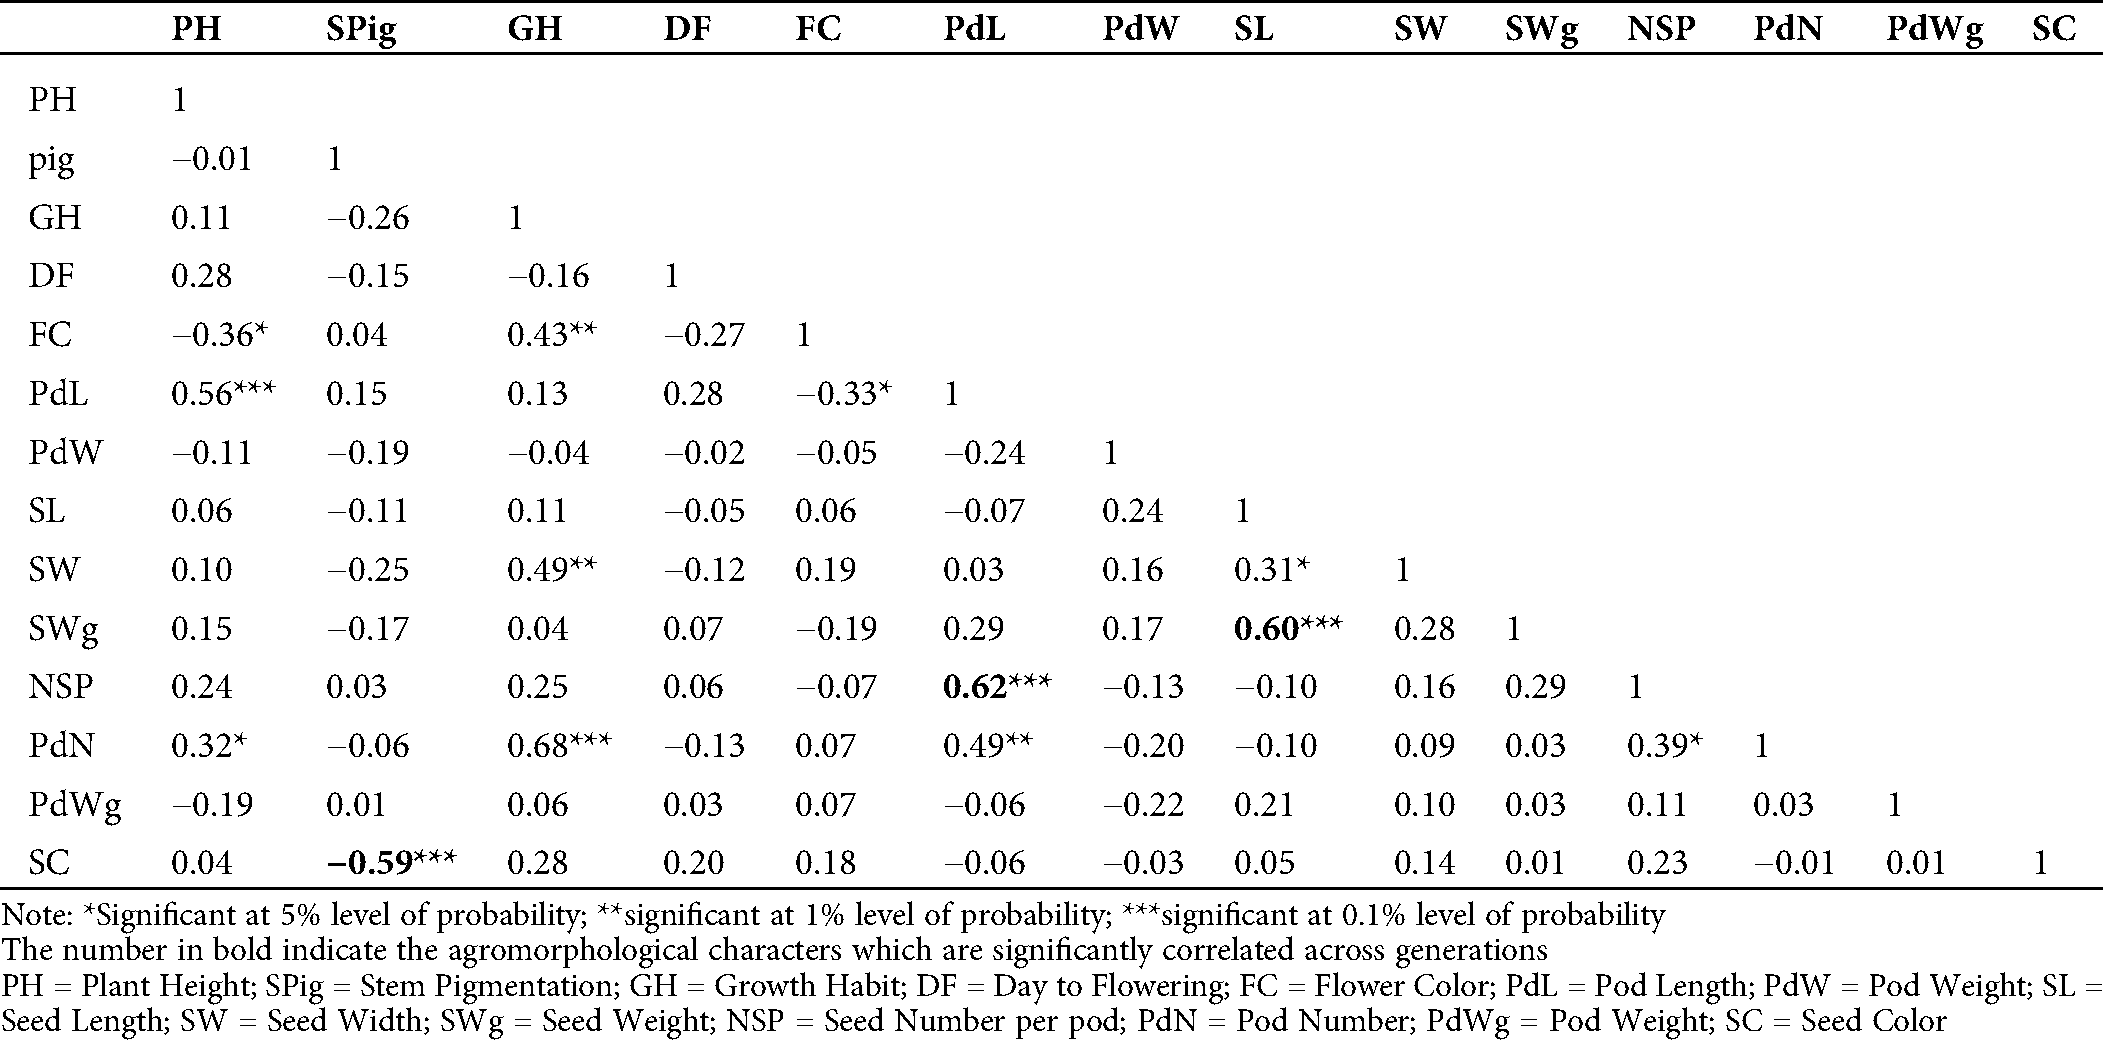
Table S1: Estimation of Pearson’s correlation between the agromorphological characters in the M5 of the mutant lines
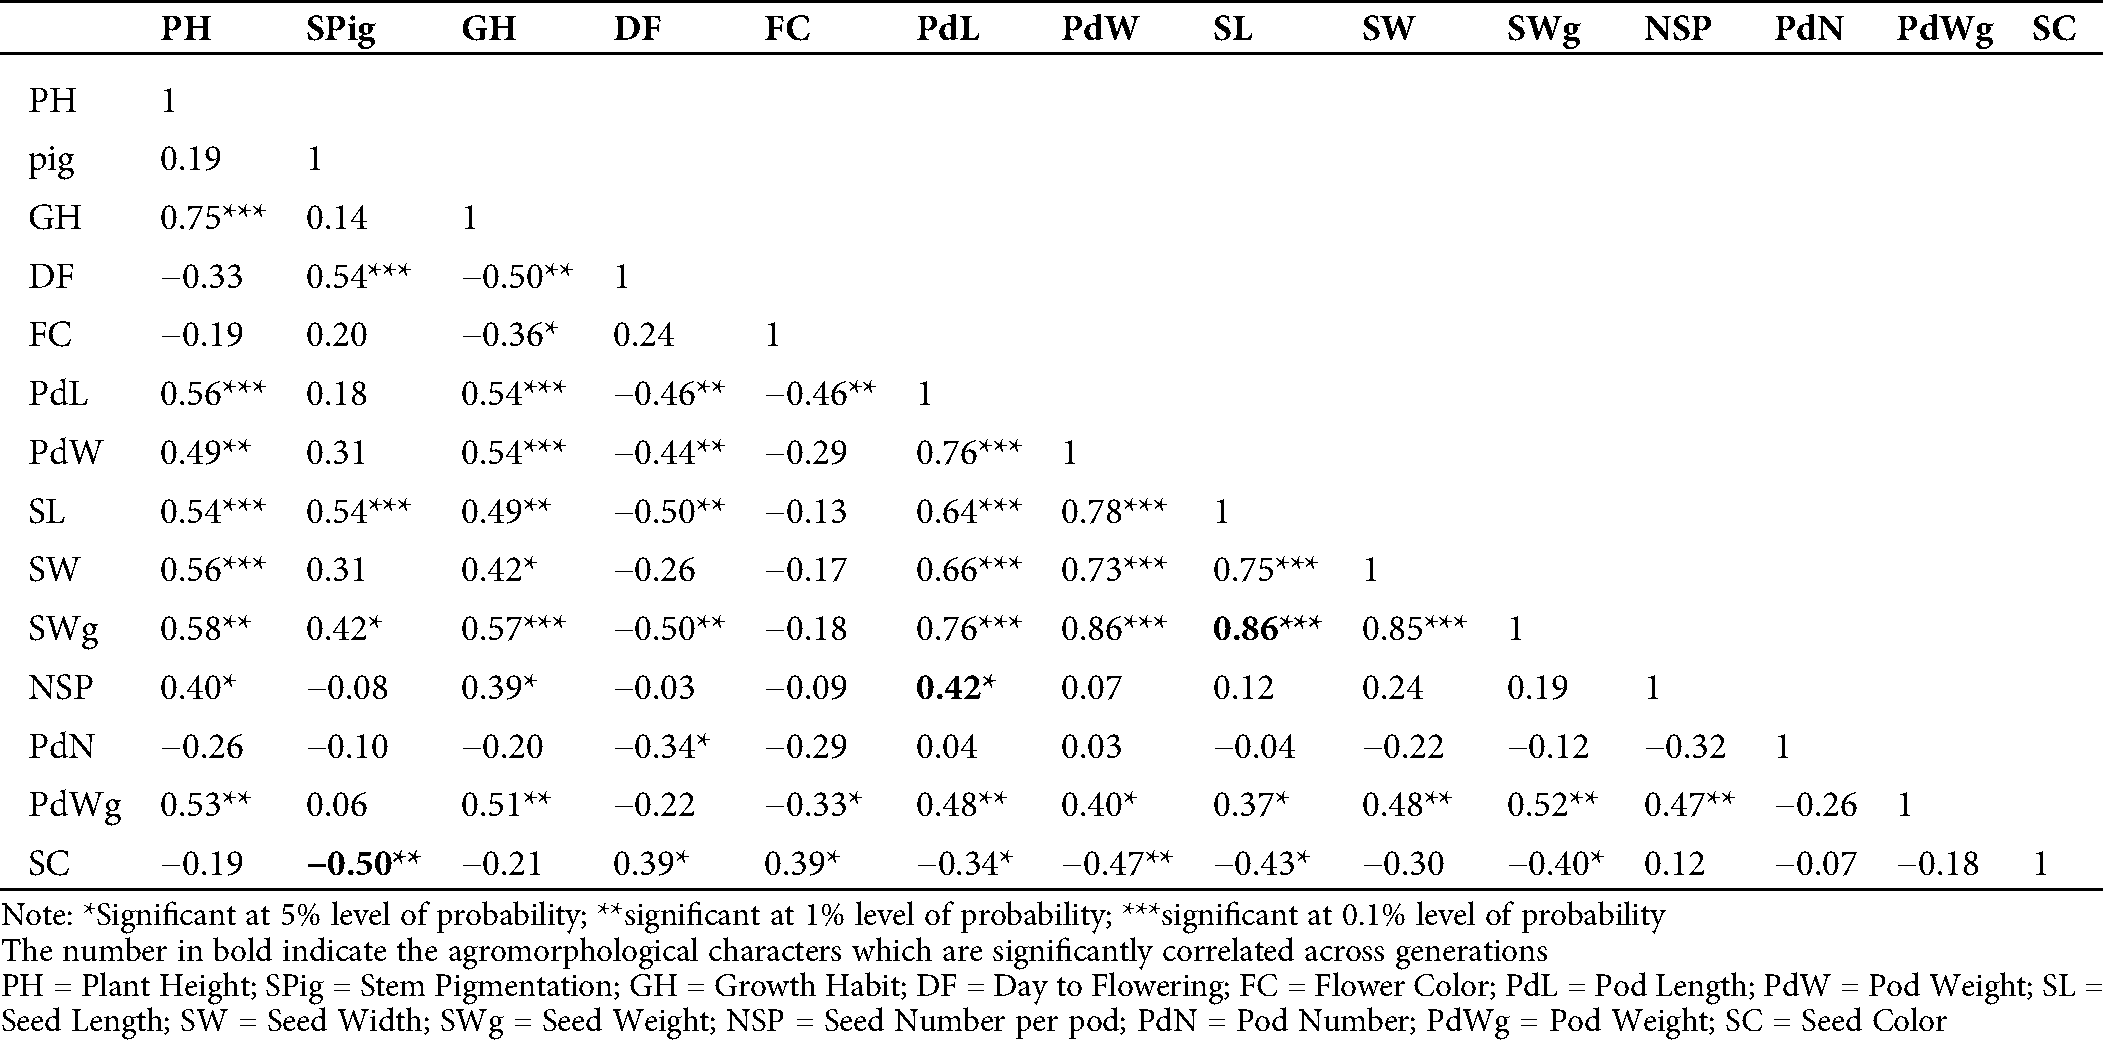
Table S2: Estimation of Pearson’s correlation between the agromorphological characters in the M6 of the mutant lines
 | This work is licensed under a Creative Commons Attribution 4.0 International License, which permits unrestricted use, distribution, and reproduction in any medium, provided the original work is properly cited. |