DOI:10.32604/biocell.2021.013869
www.techscience.com/journal/biocell
| Biocell DOI:10.32604/biocell.2021.013869 | www.techscience.com/journal/biocell |
| Article |
Transcriptome based high-throughput SSRs and SNPs discovery in the medicinal plant Lagenaria siceraria
Wuhan Academy of Agricultural Sciences, Wuhan, 430065, China
*Address correspondence to: Xia Chen, chenxia_001@126.com; Guolin Zhou, glzhou@126.com
Received: 25 August 2020; Accepted: 19 October 2020
Abstract: Lagenaria siceraria (Molina) Standley has unique biological characteristics with high nutritional and medicinal values. It is an important pharmaceutical plant with various biologically active ingredients. Genetic improvement and deeper genomic studies require a rich resource of molecular markers. The application of next-generation sequencing technology, especially for transcriptome profiling, has greatly facilitated high throughput single nucleotide polymorphism (SNP) and simple sequence repeat (SSR) discovery. In this study, we sequenced the transcriptome of three major cultivars of L. siceraria and obtained 64.88 GB of clean data. The assembled high-quality reads were clustered into 89,347 unigenes, which were annotated by non-redundant protein database, Swiss-Port, Eukaryotic Ortholog Groups, Kyoto Encyclopedia of Genes and Genomes, and gene ontology databases. A total of 8,891 SSR and 35,873 SNP markers were predicted from unigenes by MISA and SAM tools, respectively. Characterization of the predicted markers in L. siceraria showed that the SSR and SNP densities were 60 and 243 markers per Mb of genome, respectively, and the estimated ratio of transition to transversion of SNP was 2.016. These markers will be very useful for genetic studies in L. siceraria, especially for the high-density linkage map construction and genome-wide association studies. Further genomic studies based on these results will facilitate the identification of novel genes or alleles of pharmaceutical importance.
Keywords: Lagenaria siceraria; Transcriptome sequencing; SNP; SSR; Genetic improvement
Markers assisted study, especially based on genetic and molecular markers, is an indispensable tool for selection and manipulation of germplasm in breeding, population genetics, molecular ecology, conservation genetics, and other life sciences experiments. Among different kinds of molecular markers restriction fragment length polymorphism (RFLP), random amplified polymorphic DNA (RAPD), amplified fragment length polymorphism (AFLP), inter-simple sequence repeat (ISSR), simple sequence repeat (SSR), and single nucleotide polymorphism (SNP) have been globally adapted for the last three decades (Grover and Sharma, 2016; Nadeem et al., 2018; Sunnucks, 2000). Among these markers types, SSR and SNP are considered the most versatile and widely used markers (Wang et al., 2019a).
The SSR markers, also named microsatellites, are known for their diverse and user-friendly characteristics such as co-dominance, genomic abundance, random distribution, smaller locus size, simplicity of use, high clarity, reproducibility, low operational cost, hyper-variability, amenability to automation, ease of multiplexing, and high polymorphism (Rashid et al., 2016; Wang et al., 2019b). The point mutations based single nucleotide polymorphisms (SNPs) with bi-allelic, abundant, and ubiquitous nature are the most extensive type of variation in the genome sequence of an organism (Nadeem et al., 2018). The SNP markers help reveal the key functional variation in a candidate gene (Rashid et al., 2016).
The next-generation sequencing technologies, high-throughput sequencing of genomic DNA, and cDNA obtained from extracted RNA of plant tissues have accelerated the exploitation and development of SSR and SNP markers on a larger scale (Grabherr et al., 2011; Kumar et al., 2012). The mRNA based transcriptome sequencing yields the SSRs and SNPs that are potentially linked with protein-coding sequences in genic regions, and these markers are a very powerful tool in multiplex research fields (Codina-Solà et al., 2015) such as population biology (Gramazio et al., 2018), association analysis (Xie et al., 2016), haplotype evaluation (Rashid et al., 2016), modern breeding, and molecular ecology and evolution (De Wit and Palumbi, 2013).
Lagenaria siceraria (Molina) Standley (family Cucurbitaceae), commonly known as bottle gourd, is a plant of high nutrition and medicinal values and is considered one of the earliest plants to be domesticated on earth (Lim, 2012; Shah and Seth, 2010). It is native to Africa and has been widely cultivated in tropical and subtropical regions (Lim, 2012; Prajapati et al., 2010). L. siceraria fruit is traditionally known for its cardiotonic, cardioprotective, general tonic and aphrodisiac properties and useful to treat various anti-cancer (Izawa and Kuroda, 2010) allergic and inflammatory disorders like bronchial asthma, rhinitis, bronchitis, and rheumatism (Prajapati et al., 2010; Shah and Seth, 2010). Extracts of fruits of L. siceraria have anti-inflammatory, analgesic, hepatoprotective, anti-hyperlipidemic, diuretic and antibacterial activities (Prajapati et al., 2010; Shah and Seth, 2010). These properties of L. siceraria fruit are attributed to its saponins, cucurbitacin, carbohydrates, and flavonoids (Izawa and Kuroda, 2010; Shah and Seth, 2010). It contains a high choline level along with required metabolic precursors for brain function (Rahman, 2003). The extracts of L. siceraria fruits have been reported for immunomodulatory activity in experimental animals (Gangwal et al., 2009). Due to its significant nutritional, and pharmaceutical importance (Lim, 2012; Prajapati et al., 2010; Rahman, 2003; Shah and Seth, 2010), it is necessary to improve varieties of L. siceraria with wide adaptability and enrich it with prebiotic and potentially active biomolecules (Ahmad et al., 2011).
The currently available genetic and genomic tools for L. siceraria are very limited as compared to other crop plants. Previous studies have been reported for the genetic variability (Mladenović et al., 2012), diversity, divergence (Chetariya and Vaddoria, 2017), heterosis (Damor et al., 2016) through traditional genetic analysis. Only a few studies were based on modern genomic tools such as genetic mapping (Wu et al., 2019), DNA-markers based diversity (Kumar et al., 2018), transcriptome analysis for root tissues (Yang et al., 2014), and comparative transcriptome analysis (Zhang et al., 2020). These studies mainly used Random Amplified Polymorphic DNA (RAPD) marker and morphological markers. Recently, some studies report the whole genome sequence of bottle gourd and studied the Cucurbitaceae evolution and provided the base to map some useful genes (Wu et al., 2017). A genome-wide study for identification of GRAS transcriptional factor in bottle guard genome was reported (Sidhu et al., 2020). Furthermore, a multi-omic database has also been generated for bottle gourd (Wang et al., 2018). However, the lack of genetic maps, larger high-throughput marker collections, and suited mapping populations are limiting gene isolation and L. siceraria breeding. The poorly studied genome of bottle gourd is another limiting factor for SNP markers discovery. In the current study, we focused on the transcriptome sequencing based high-throughput identification of molecular markers. We evaluated the transcriptome sequences of L. siceraria, identified and characterized the SSR and SNP markers. The results of this study provide rich molecular tools to facilitate germplasm characterization, breeding, and functional genomics in this pharmacologically important plant.
Plant materials and growth conditions
Three cultivars of bottle gourd (Hang, Fu, and USA) were used in this study. These commercial cultivars are highly grown and consumed in Wuhan, China. The seeds were obtained from the Vegetable Institute of Wuhan Academy of Agricultural Sciences, Wuhan, China, and plants were grown in a greenhouse of the same Institute. No special ethical license is required for working with these plant materials. Plants were grown in a substrate composed of sandy soil: vermiculite: perlite: organic fertilizer in 4:4:1:1. The pH of the culture substrate was maintained at 7.0, and the water content was maintained at 70% relative humidity. The greenhouse conditions were maintained at 25–28°C and 18–20°C day and night temperature, respectively, photoperiod 14 h/d with a light intensity of 87.5 µmol/m2s was maintained. Pest control was performed according to standard practices. Leaf samples were harvested from three individual plants (biological replicates) of each cultivar, immediately frozen in liquid nitrogen, and stored at −80°C until further use.
cDNA preparation, transcriptome sequencing, assembly and quality control
Three independent biological replicates for three cultivars of Lagenaria siceraria were used for cDNA library preparation and sequencing. The total RNA was extracted from each sample and sequencing libraries were generated using NEBNext®Ultra™ RNA Library Prep Kit for Illumina® (NEB, USA) following manufacturer’s recommendations, and index codes were added to attribute sequences to each sample. The clustering of the index-coded samples was performed on a cBot Cluster Generation System using TruSeq PE Cluster Kit v3-cBot-HS (Illumia) according to the manufacturer’s instructions. After cluster generation, the library preparations were sequenced on an Illumina Hiseq X Ten platform and paired-end reads were generated. The quality of the transcriptome sequencing library was evaluated; (1) by examining the distribution of inserted fragments on unigenes, the randomness of mRNA fragmentation and the degradation of mRNA were evaluated, (2) by drawing the length distribution map of the inserted fragment, the discrete degree of the length of the inserted fragment was evaluated, (3) by drawing the saturation map, we can evaluate the capacity of the library and the adequacy of the mapped reads compared to the unigenes library.
As per the sequencing strategy of the machine, the average read length was 100 bp. Raw data (raw reads) were firstly processed through in-house perl scripts. In this step, clean data (clean reads) were obtained by removing reads containing adapter, joint sequences, sequencing splices, primer sequences, with less than 5 mass value, Poly-N (more than or equal to 5% N-base), Poly-A and low quality reads from raw data. At the same time, Q20, Q30, Q40, GC-content, and sequence duplication level of the clean data were calculated and most of the base quality scores can reach or exceed Q30. The QPhred values were estimated to evaluate the sequencing quality. All the downstream analyses were based on clean data with high quality. The clean reads were saved to fastq format (Cock et al., 2010) and assembled using Trinity (Grabherr et al., 2011) with default parameters to obtain the unigenes. Base type distribution test was used to detect the GC contents separation. The whole sequencing process was stable and horizontal because of the principle of random interruption and base complementary pairing.
Gene structure analysis clustering and functional annotation
Transcoder software was used to predict the coding region sequence of unigenes and its corresponding amino acid sequence, while Trinity (Grabherr et al., 2011) was used for coding sequences (CDS) prediction. The blast (Altschul et al., 1997) software was used to compare the unigene sequence with NCBI non-redundant protein sequences (NR) (Deng et al., 2006). A manually annotated and reviewed protein sequence database (Swiss Prot) (Apweiler et al., 2004), Gene Ontology (GO) (Ashburner et al., 2000), Clusters of Orthologous Groups of proteins (COG) (Tatusov et al., 2000), KOG (Koonin et al., 2004), eggnog4.5 (Huerta-Cepas et al., 2016), and Kyoto Encyclopedia of Genes and Genomes (KEGG) (Kanehisa et al., 2004) database. The kobas2.0 (Xie et al., 2011) program was used to get the KEGG ontology result of unigenes, and Hmmer (Eddy, 1998) software was used to compare with Protein family (Pfam) (Finn et al., 2014) database after predicting the amino acid sequence, to get the annotation information of unigenes.
SSR analysis was carried out for unigenes with a length >1 kb by using MIcroSAtellite identification tool (MISA) v 1.0 to detect microsatellite or simple sequence repeat (SSR) loci (http://pgrc.ipk-gatersleben.de/misa/misa.html). The minimum repetition parameter was ten for mono-, six for di-, and five for tri-, tetra, penta-, and hexa-nucleotide SSR motifs, respectively. If the distance between two repeated motifs was shorter than 100 nucleotides then they were considered as compound microsatellites (Thakur and Randhawa, 2018). The primer 3 v2.3.5 (Untergasser et al., 2012) (http://primer3.sourceforge.net/releases.php) with default parameters was used to design three primer pairs for all SSR markers. After SSR markers identification, 59 SSR markers were randomly selected for validation. Polymerase Chain Reaction (PCR) with the primers of the above selected SSR markers was carried out on the DNA samples extracted from the fresh leaves of Hang cultivar using the DNeasy Plant Mini Kit (QIAGEN). The amplified PCR products were visualized on 1% agarose gel.
To identify the putative single nucleotide polymorphic sites (SNPs), the high-quality transcriptome sequences and unigenes in each sample were assembled and compared by STAR software (Dobin et al., 2013) and the BAM format comparison files were obtained. The single nucleotide polymorphism (SNP) sites were identified through the SNP calling process of GATK (Lim, 2012) for RNA-Seq. Picard - tools v1.41 and samtools v0.1.18 were used to sort, remove duplicated reads, and merge the bam alignment results of each sample. The SNP quality criteria were set by sequencing depth > 2 and the < 3 mismatches in the 35 bp range of marker. The identified SNPs were further filtered for low quality by SNP calling and only SNPs with distance > 5 were retained. Then, the SNPs were further analyzed to evaluate their effect on the expression level of genes and/or the types of protein products. The SNPs obtained were further characterized manually.
Expression evaluation and differential expression analysis
The bowtie2 v 2.3.4 program (Langmead and Salzberg, 2012) was used to compare the sequenced reads with the unigene library. According to the comparison results, the expression level was estimated by combining with RSEM (v. 1.3.1) (Li and Dewey, 2011). The fragment per kilobase of transcript per million mapped reads (FPKM) value was used to express the expression abundance of corresponding unigenes. The false discovery rate (FDR) < 0.01 and the difference multiple fold change (FC) ≥ 2 was set as the filtering standard. The DESeq program was used to screen the differentially expressed genes. The Benjamin Hochberg method was used to correct the P-value of the original hypothesis test and FDR values were estimated to reduce the false-positives caused by independent statistical hypothesis tests for a large number of gene expression values. The corrected P-value was kept as a key index of differential expression gene (DEGs) screening. The DEGs were further filtered for FDR < 0.01 and the difference multiple FC ≥ 2. For the samples without biological duplication, Ebseq (Leng et al., 2013) was used to analyze the differential expression gene set between the two samples. Pearson's correlation coefficient was used as the evaluation index of correlation among samples (Anders and Huber, 2010). Further Gene Ontology (GO) enrichment analysis of the differentially expressed genes (DEGs) was implemented by the topGO software, and the statistical enrichment of differential expression genes in KEGG pathways was analyzed.
RNA-seq and transcriptome assembly
The high-throughput sequencing (Illumina Hiseq X Ten) data was generated and then transformed into the raw data by base calling analysis. A total of 24.65, 25.66, and 32.32 million raw reads were extracted for the cultivar USA, Fu, and Hang, respectively (Tab. 1). After sequence cleaning for quality control, a total of 64.88 GB clean data was obtained, and the percentage of Q30 base of all products was more than 92.52. A total of 87.29%, 84.94%, and 85.33% of cleaned reads were mapped to unigenes for three cultivars of L. siceraria USA, Fu, and Hang, respectively (Tab. 1).
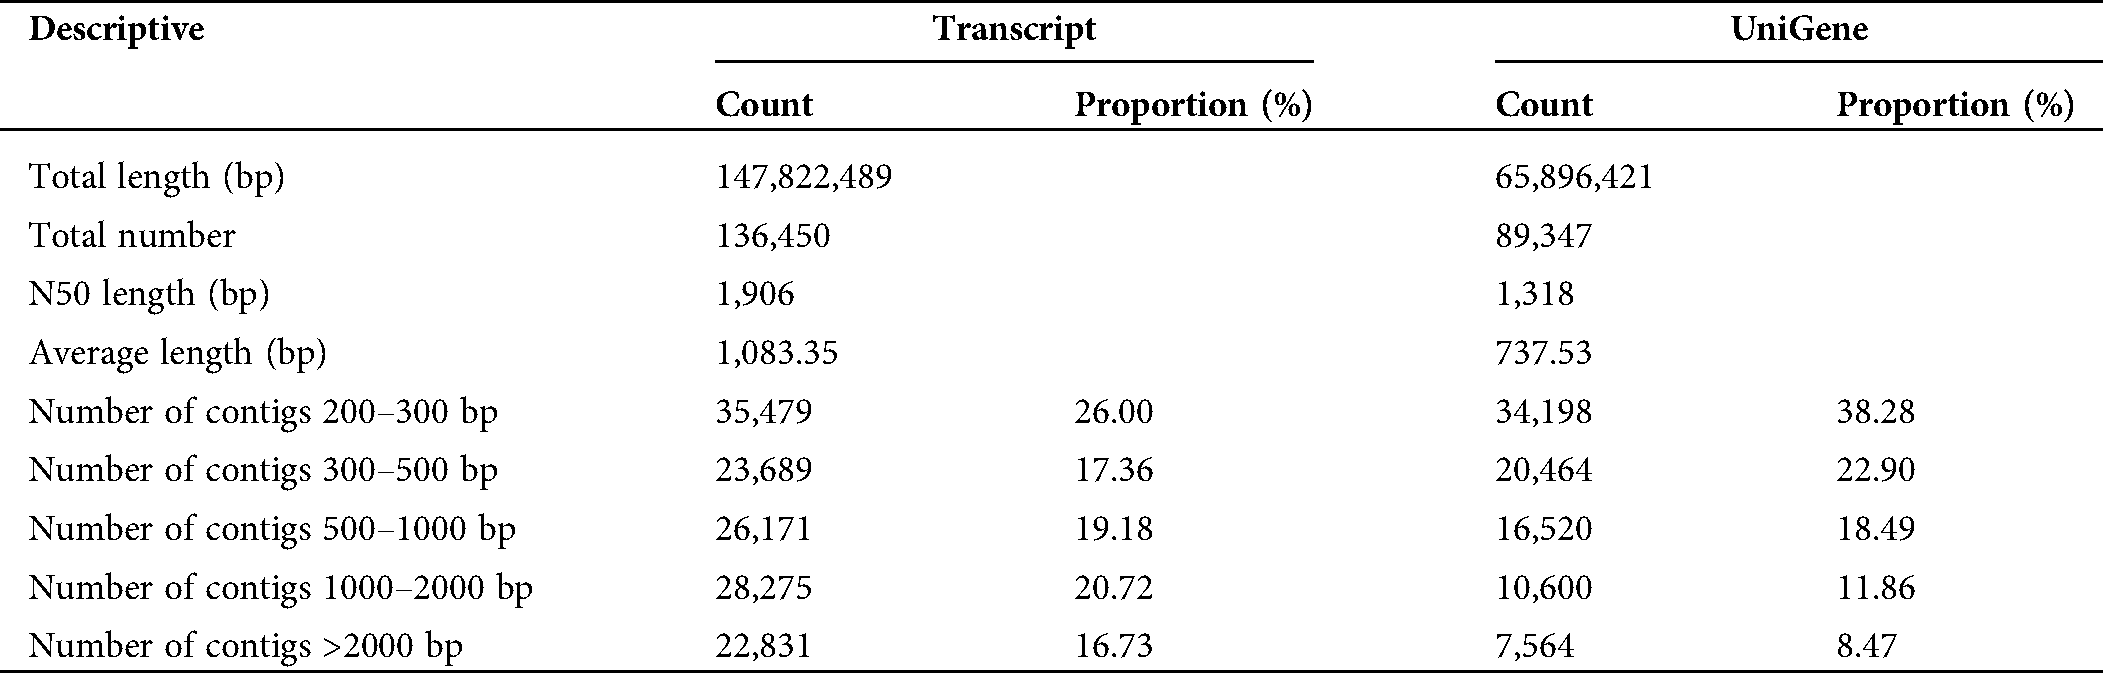
The assembly of clean reads provided the 136,450 transcripts with an average length of 1,083.35 bp, which further yielded 89,347 high-confident tentative consensus sequences (non-redundant sequences or unigenes). The assembled unigenes had an average length of 737.53 bp, comprising 65.896 Mb in total (Tab. 2). Among the total unigenes, 1,318 (N50) showed high assembly integrity. The 80% of the unigenes (71,182) had short size (300–100 bp) while 8.47% unigenes (7,564) displayed long size (> 2000 bp) (Fig. 1).
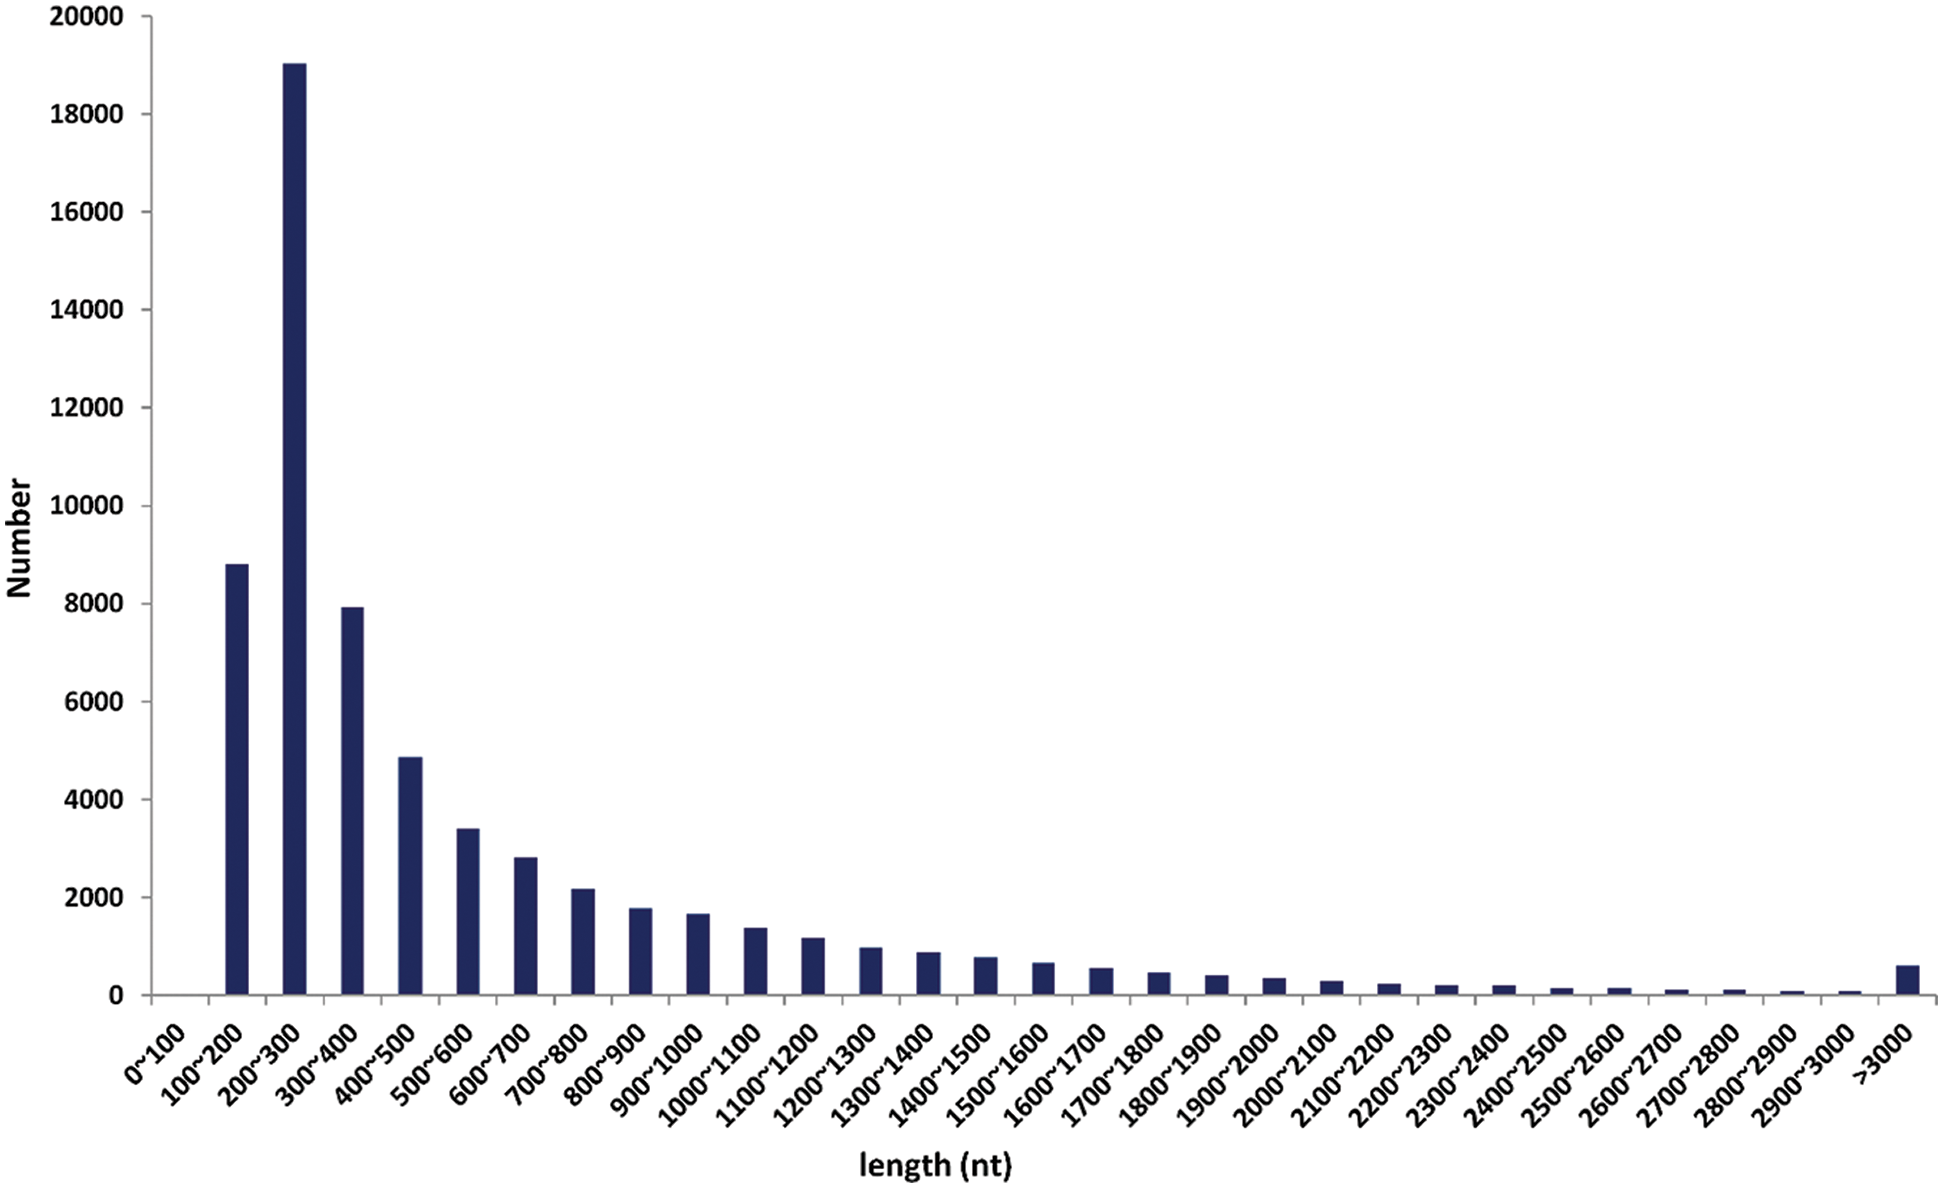
Figure 1: The length (in nucleotides (nt)) based distribution of clean reads after sequence assembly.
Table 1: Data descriptive summary for de novo transcriptome assembly of three Lagenaria siceraria cultivars
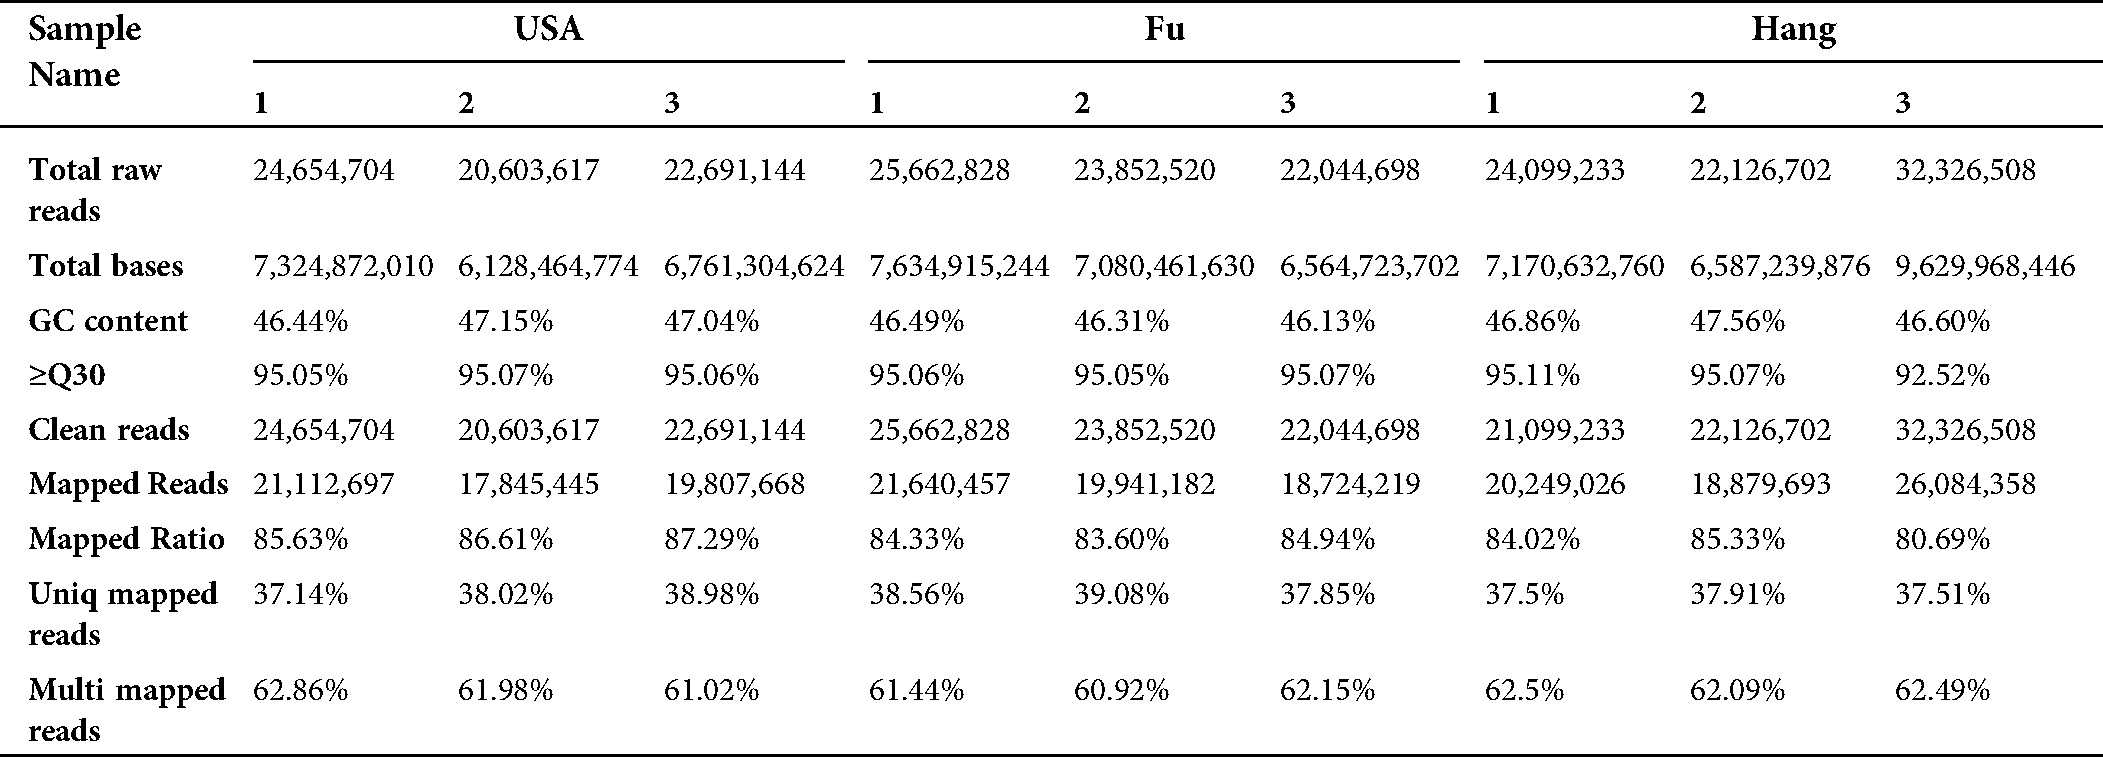
Table 2: Characteristics descriptive of de novo transcriptome assembly of Lagenaria siceraria transcripts and unigenes
Functional annotation of unigenes
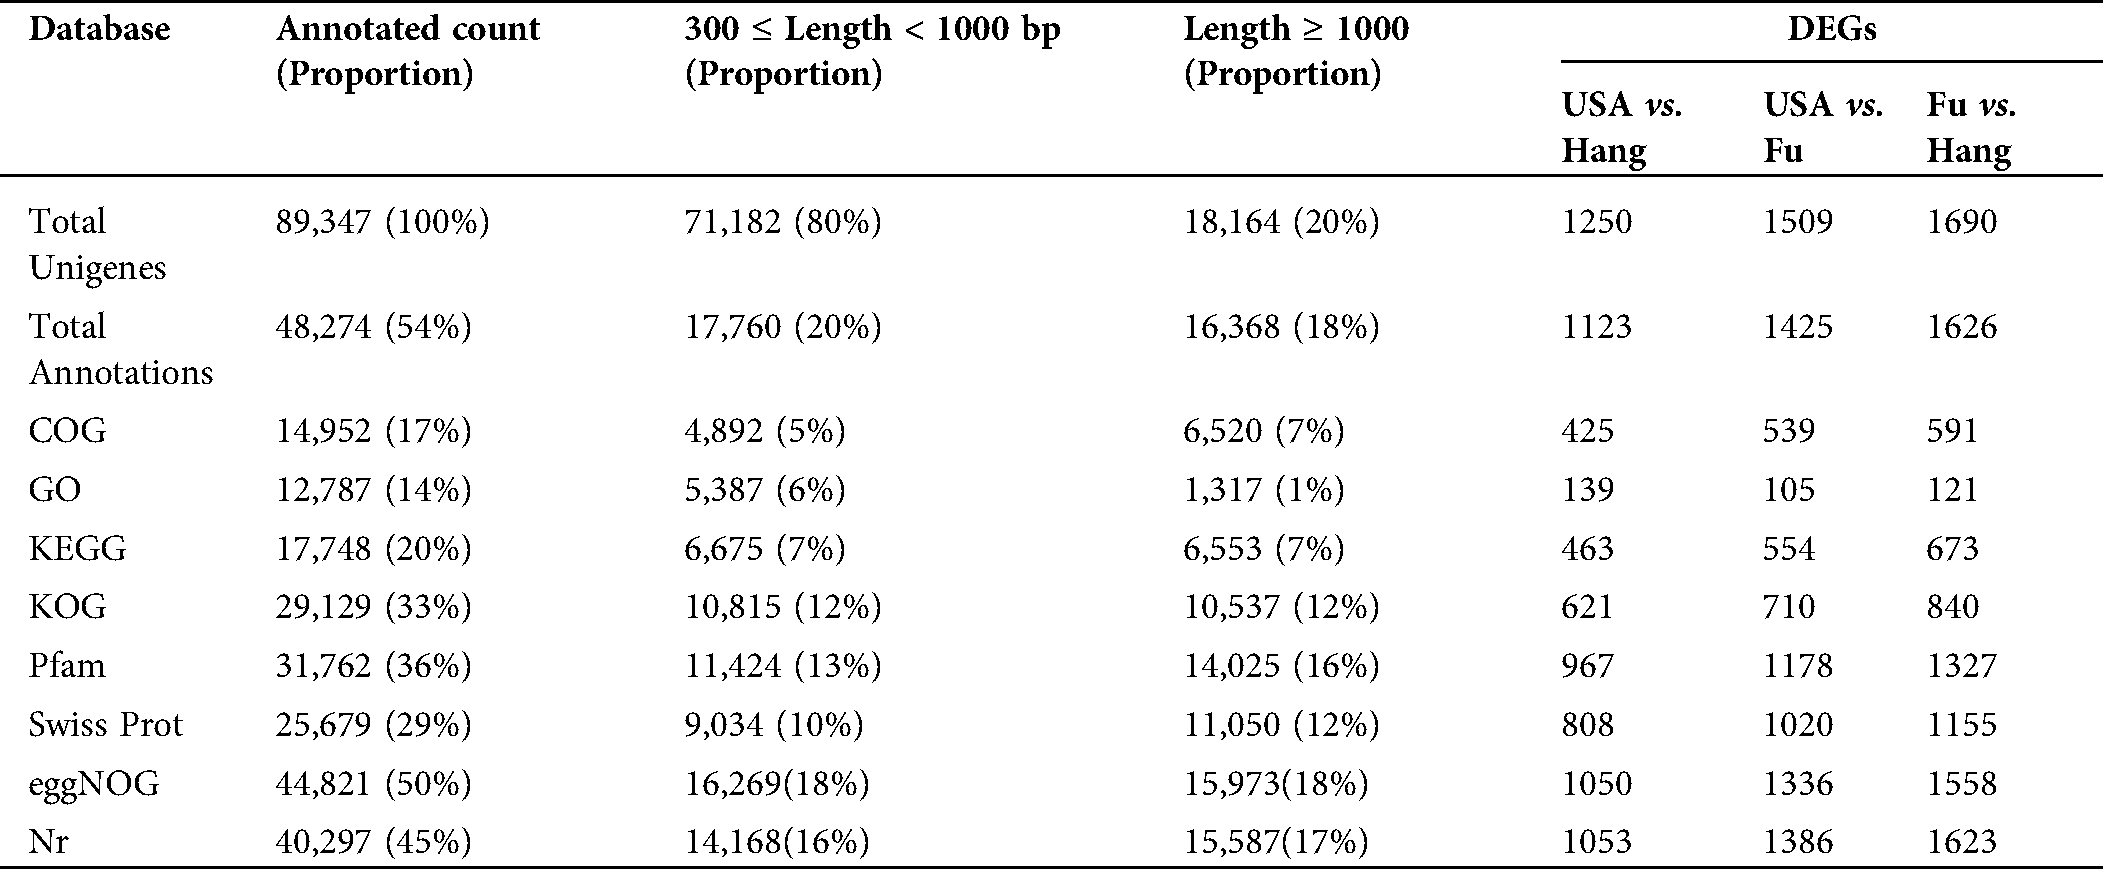
The assembled unigenes of L. siceraria were evaluated for functional annotation using the seven known databases. A total of 48,274 (54%) unigenes were annotated to at least one of all seven databases. Out of the total 89,347 unigenes, 40,297 (45%), 31,762 (36%), and 25,679 (29%) unigenes could be annotated using the NR, Pfam, and SwissProt databases respectively (Tab. 3). In particular, 12,787 unigenes (14%) showed significant identity to the gene ontology (GO) database. All the identified GO terms distributed into 4,505 functional groups were classified into three major-, and 54 sub-classes. Among the three categories, maximum (33,858) unigenes in 2,339 subclasses of ‘Biological processes’ to minimum (16,697) unigenes in 504 subclasses of ‘Cellular Components’ were observed, while (19,783) unigenes were in 1,662 subclasses of ‘Molecular function’. As per ontology terms of class ‘Cellular Components’, maximum (1,627) unigenes hit the subclass ‘Nucleus’ followed by ‘plasma membrane’ (1,339), and ‘cytosol’ (971). Among the GO-terms in ‘Molecular functions’, maximum (1,418) unigenes were involved in ‘ATP binding’ followed by ‘Zinc ion binding’ (604), while ‘oxidation-reduction process’ with 879 unigenes followed by ‘translation’ with 580 unigenes were in top trend in the ‘Biological processes’ (Suppl. Tab. 1).
Furthermore, 17% (14,952) unigenes could be annotated into the COG database. Among the COG function classes ‘General function prediction only’ was on top selection followed by ‘Translation, ribosomal structure and biogenesis’ and ‘post-transitional modifications, proteins turnover, chaperons’ with 2,068, 1,787 and 1,377 unigenes respectively. The same categories in the KOG database with 4,856, 2,079 and 2,837 unigenes and the eggnog database with 7,413, 2,314 and 3,663 unigenes were also observed to be the major functional classes (Suppl. Tab. 1). The functions of unigenes were further surveyed by KEGG pathway analysis. It was revealed that the 17,748 (20%) unigenes governed the 128 pathways. The maximum (1,249) unigenes were observed in ‘Ribosome’ pathway as a top functional ortholog.
Table 3: Functional annotation unigenes extracted from Lagenaria siceraria transcriptome sequences in seven databases
Gene expression, differential expression, and pathway enrichment analyses
An average of 19.59, 20.10, and 21.74 million reads, were mapped for USA, FU, and Hang with average unique mapping rates of 38.05%, 38.50%, and 37.64%, and multiple mapping rates of 61.95%, 61.50%, and 62.36%, respectively (Tab. 1). A non-standard normal distribution was observed by FPKM values-based gene expression level and density distribution pattern for each sample (Fig. 2A). The genes with similar expression patterns were clustered together into various groups. The correlation between samples was analyzed on the basis of expressed genes and Pearson’s coefficient of correlation. The clear groups of each cultivar were observable (Fig. 2B), which indicated the genetic similarity amid the repeats (r2 ≥ 0.9) while showing dissimilarities between cultivars. Among the mapped reads, a minimum of 1,250 unigenes was differentially expressed by more than two-folds. All the differentially expressed genes (DEGs) could further be classified as up-regulated and down-regulated (Fig. 2C, Tab. 4). The DEGs were further evaluated for their functional annotation. All the DEGs could be classified for a maximum of 139 gene ontology (GO) terms (Fig. 3A). In the top twenty GO terms, maximum genes were related to ‘metabolic process’, ‘cell’ and ‘cell parts’, and ‘catalytic activity’, while in COG function classification, the majority of genes hit the ‘Translation, ribosomal structure and biogenesis’, ‘General functions predictions, and ‘Posttranslational modifications, protein turnover, chaperones’ (Fig. 3B). Furthermore, the KEGG pathway analysis was performed for DEGs, and 434 functional pathways were observed. Among the top twenty KEGG pathways, ‘Ribosome’ pathway with 21.98% unigenes has maximum hits (Fig. 3C).
Table 4: The summary of up- and down-regulated differentially expressed genes (DEGs) in transcriptome expression analysis of Lagenaria siceraria
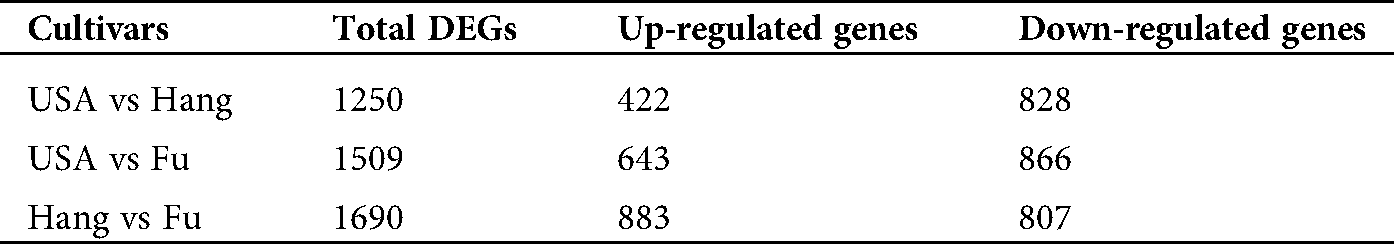
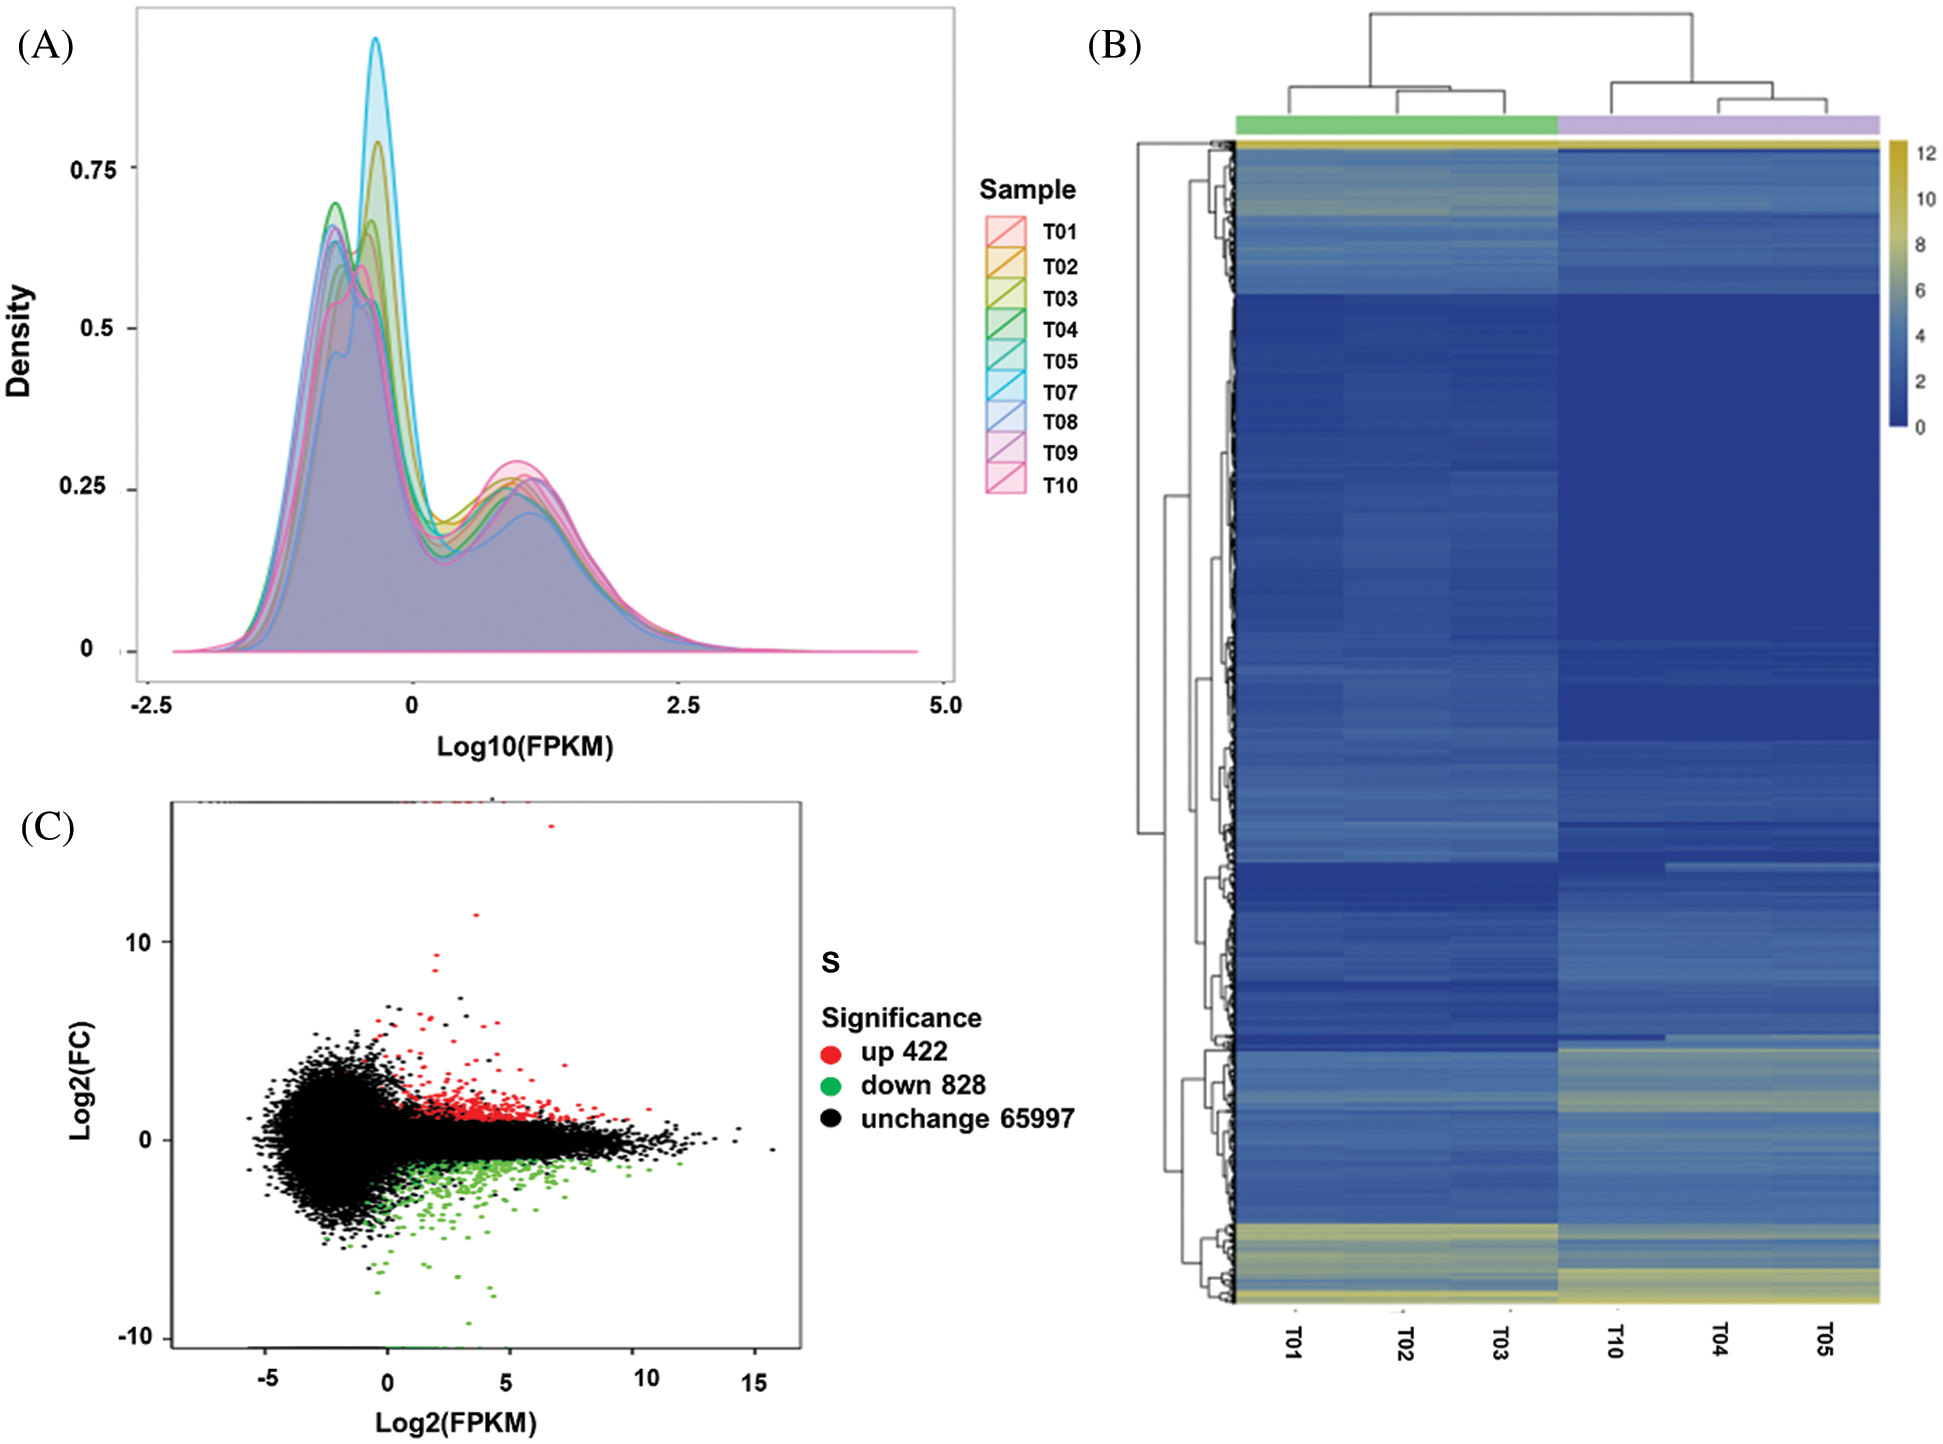
Figure 2: Illustration of Expression analysis, A: The FPKM density map to reflect the overall gene expression pattern of each sample for three Lagenaria siceraria cultivars USA (T1, T2, T3), Hang (T4, T5, T10), and Fu (T7, T8, T9); B: The correlation between samples on the basis of differentially expressed genes; C: Ma map to describe the relationship among expression level, log2foldchange.
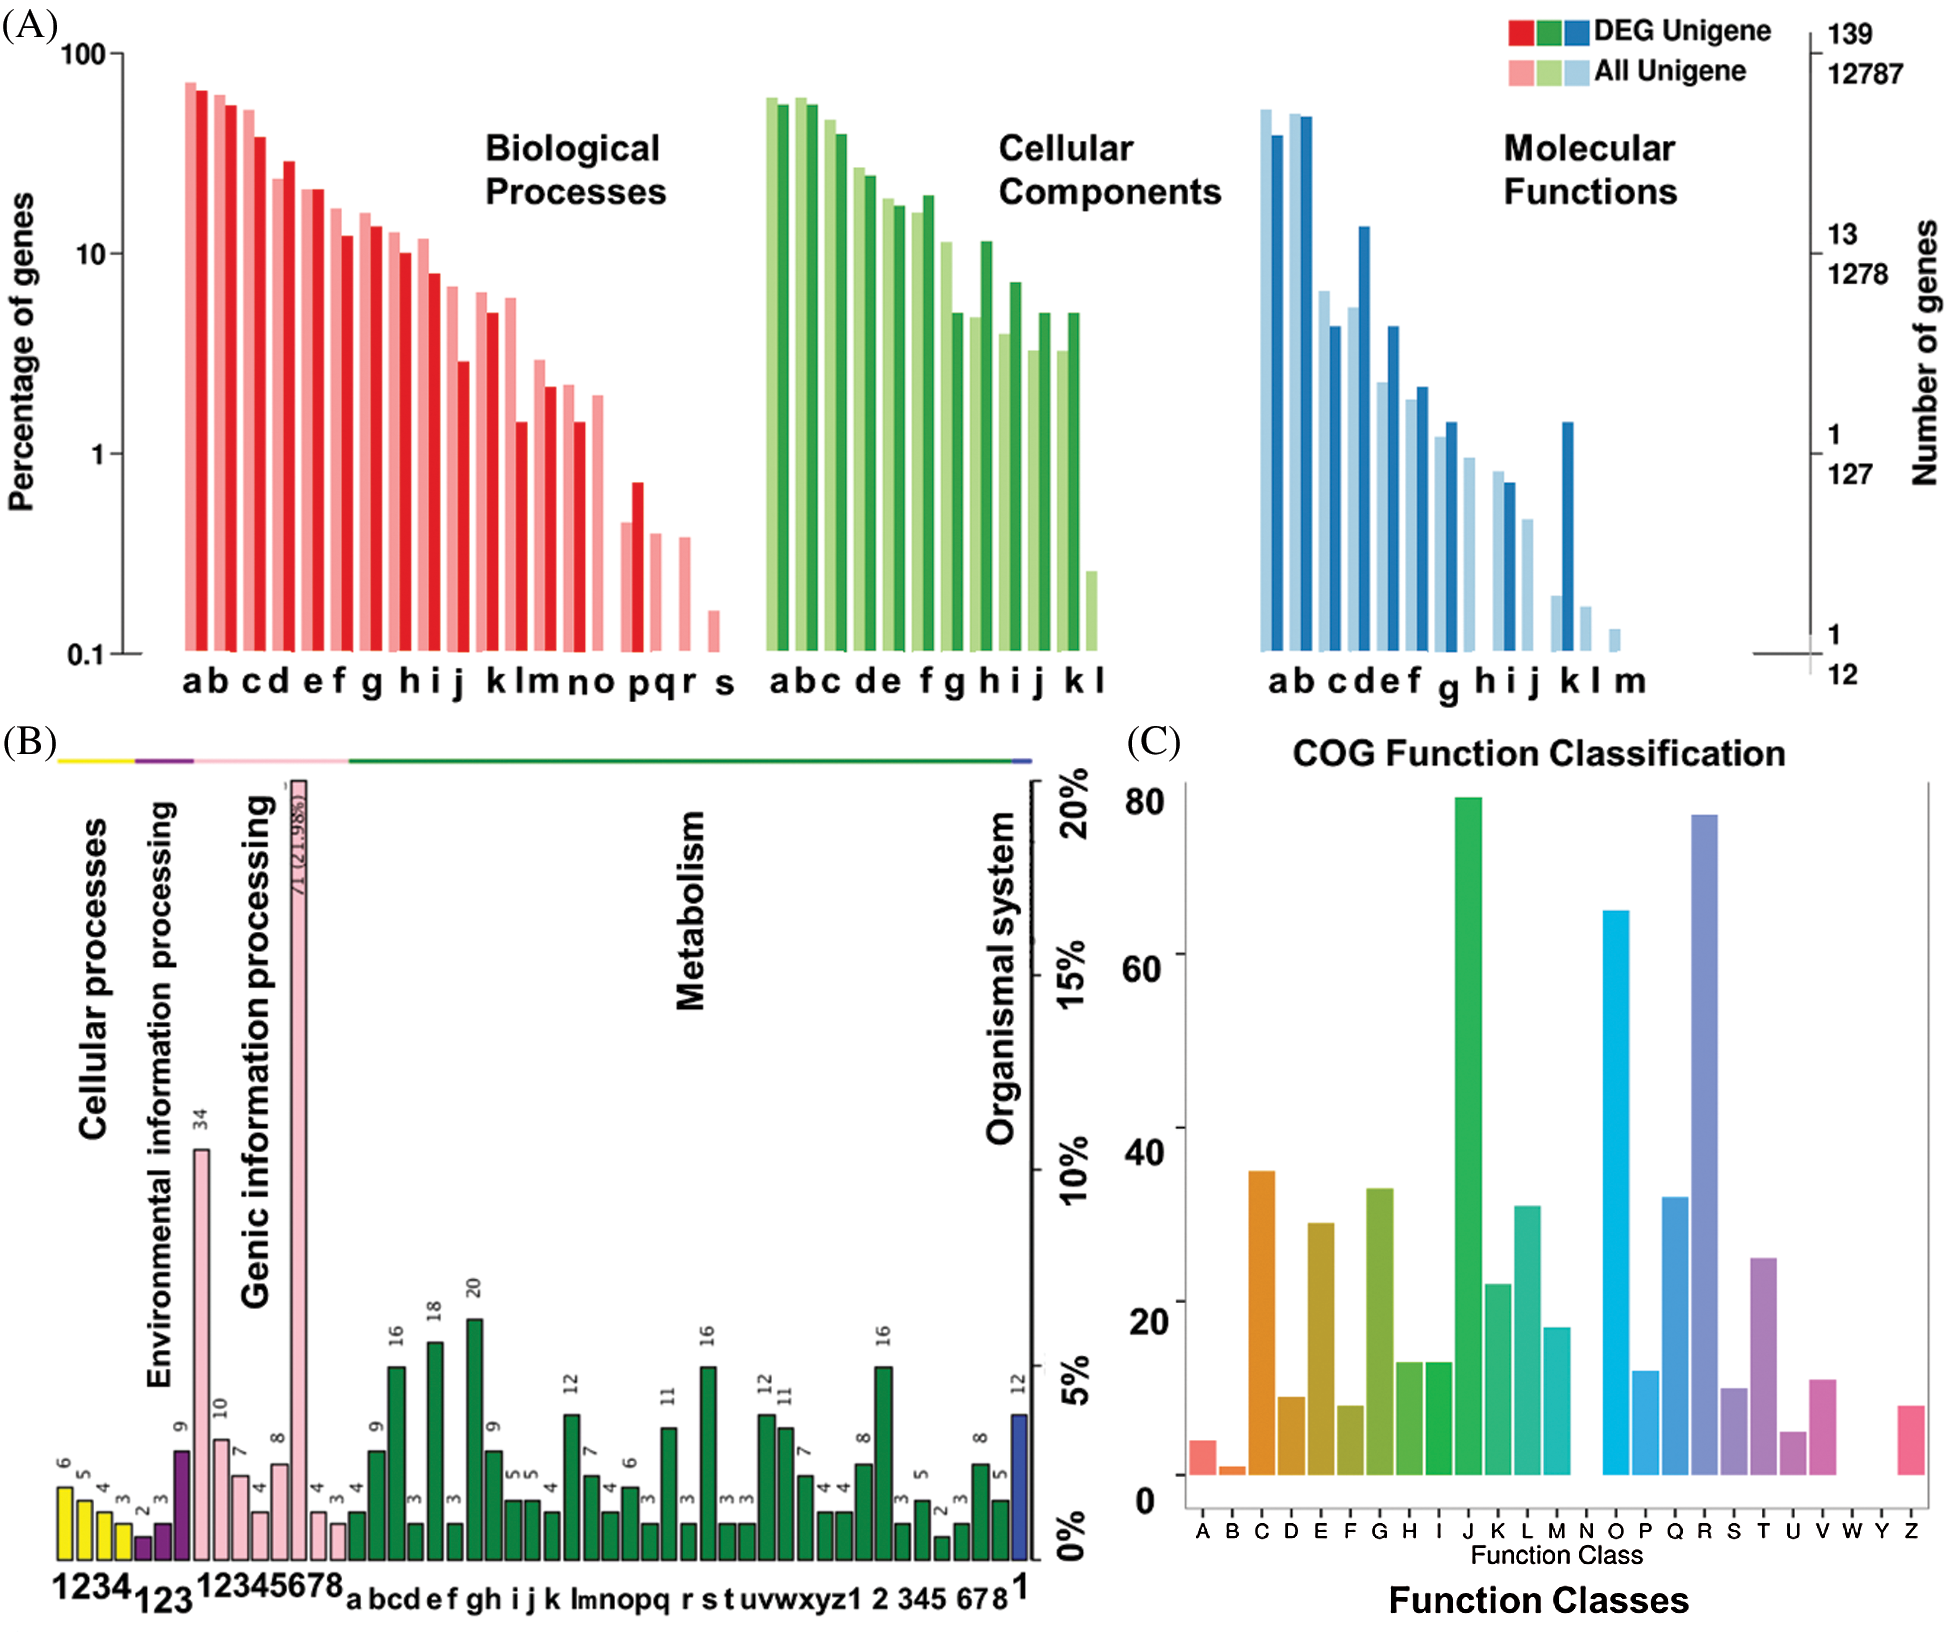
Figure 3: Simplified genes annotation information on the bases of similarity on A: Gene ontology (GOslim), B: Cluster of indigenous groups of proteins (COG), and C; KEGG metabolic pathways databases.
Identification, characterization, and functional enrichment of SSR in transcriptome
SSR identification and characterization
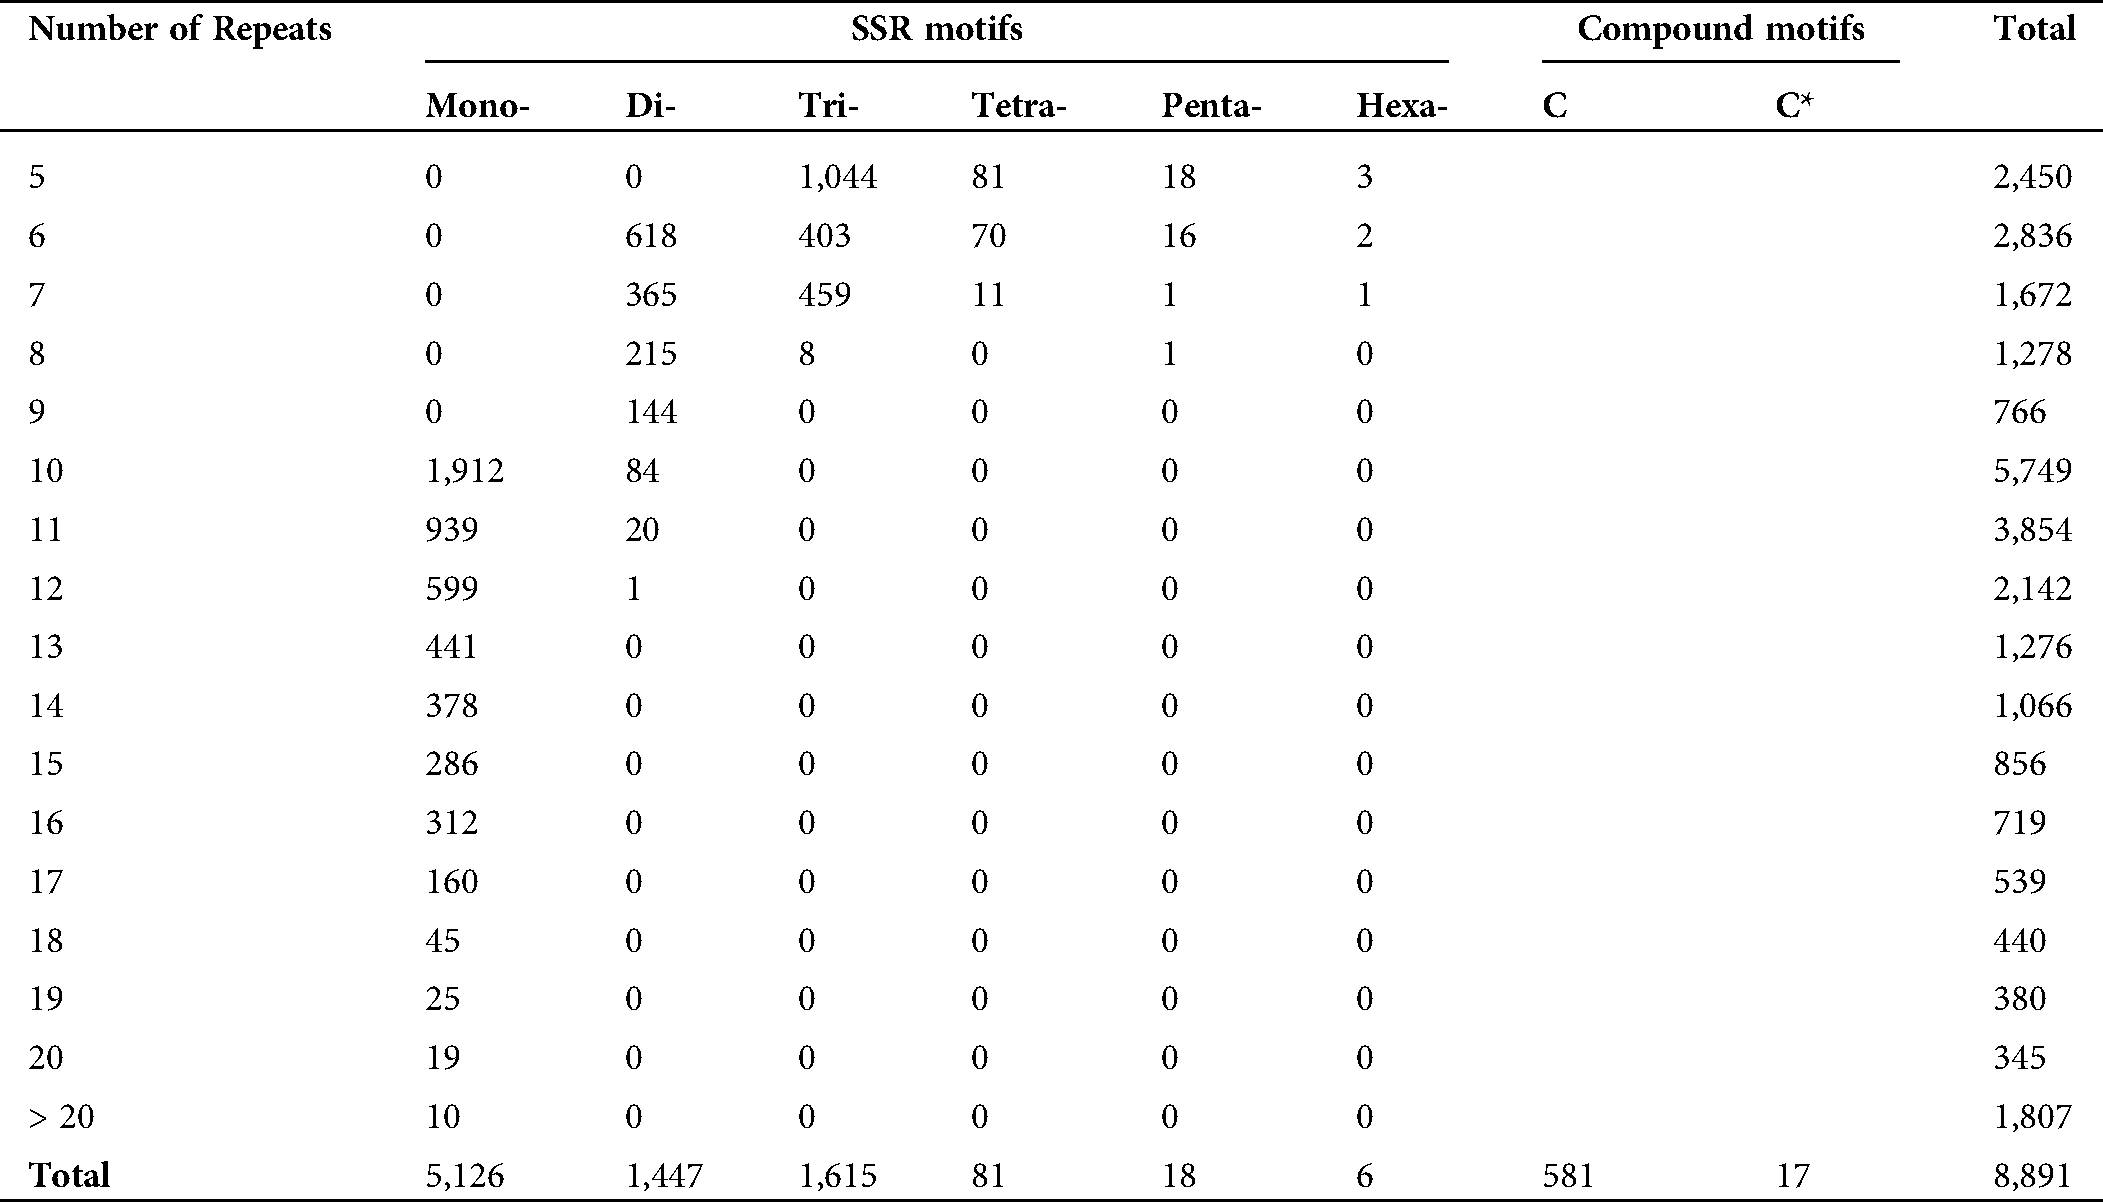
In order to reduce the bias of transcript length and noise at a low level of expression, the unigenes having fragments per kilobase of transcript per million mapped reads (FPKM) ≥1 were selected to identify simple sequence repeats (SSRs). A total of 8,891 microsatellite motifs were identified on 6,705 mapped and/or 6,030 annotated unigenes, i.e., 7.5% and 6.74% of total unigenes. It accounted for 60 SSRs/Mb genome density. The total length of the SSR motifs was 153,577 bp, which provided the relative density of 57.89 bp/kb. Of the total SSRs, mono-nucleotide microsatellites were the most abundant (5,126, 57.65%) with 61,542 bp length, followed by di- (1,447, 16.27%), tri- (1,615, 18.16%), tetra- (81, 0.91%), penta- (18, 0.20%), and hexa-nucleotide (6, 0.07%), types (Tab. 5). The A (50.72%) and T (46.72%) motifs were the most abundant in mono-nucleotide repeats. Among di-nucleotide motifs, AT (16.86%), TA (14.23%), TC (17.21%), and AG (17.96%) with a total count of 959 were the most abundant types, while there were only three GC and one CG motifs. Among tri-nucleotide, the most abundant motif was GAA (12.58%), followed by TTC (9.12%), AGA (7.01%) motif types, while only one GTA was observed (Suppl. Tab. 2).
An average length of L. siceraria microsatellites was 17.27 bp. The length variation of microsatellites was significantly affected by the repeat motif size. The hexa-nucleotide with an average 34 bp length was the longest motif type followed by penta- (25.83 bp), tetra- (20.54 bp), tri- (16.39 bp), and di-nucleotide (14.31 bp) motif types, while the mono-nucleotide motifs had the shortest average length (12.01 bp). The longest microsatellite identified was 42 bp, which was composed of a 7-fold repetition of a hexa-nucleotide motif. Along with these motif types, the compound motif types as ‘c’ motifs containing two types of repeats separated by few nucleotides, and ‘c*’ motifs in which two types of repeats are not separated by nucleotide stretch were observed as well. Among the total microsatellites, 6.53% (581) were ‘c’ type, and 0.19% (17) were ‘c*’ type compound motifs with an average length of 72.20 bp and 34.11 bp, respectively. The longest compound motif was 320 bp containing 4 mono- and one tri-nucleotide motifs with multiple repeats. A total of 51 SSR markers were observed for 41 unigenes in the top ortholog group ‘Ribosome’ pathways (K03010) (Suppl. Tab. 1).
The mono-nucleotides showed the widest range, from 1 to 9, in repetition numbers, while for di-, tri-, teta-, penta, and hexa-nucleotide SSRs, this range was 1–6, 1–5, 1–4, 1–3, and 1–2, respectively. The majority of the motifs (1,986) contained 10 repeats, followed by 5 repeat motifs (1,146). Also, the majority of unigenes (74.77%, 5,013) contained only one SSR motif, while 19.55% (1,311), 1.33% (290), 1.16% (78), 0.13% (9), and 0.06% (4) unigenes have two three, four, five, and six SSR motifs.
Table 5: Distribution of SSR motif repeats in transcriptome data of Lagenaria siceraria
SSR functional enrichment analysis
The 6,030 SSRs possessing annotated unigenes also included the 351 DEGs. Among these annotated unigenes, 7,758 unigenes (87%) showed significant similarities in non-redundant (nr) database proteins. The Gene Ontology annotation showed 424 unigenes (4.77%) were assigned with one or more GO term IDs. Among the total 53 GO classification for SSR containing unigenes, ‘Biological Processes’ terms appeared most for a total of 986 unigenes, followed by ‘Cellular Components’ and ‘Molecular Functions’, with 662 and 414 unigenes, respectively. Among the major-class ‘Biological Process’, the ‘metabolic process’ and ‘cellular process’ were on top identification with a maximum of 200 and 198 unigenes. Among the ‘Cellular Components’, most of the unigenes were expressed for ‘Cell’, ‘Cell parts’, and ‘organelles’ with 151, 151, and 111 unigenes, while among the ‘Molecular Functions’, the ‘catalytic activity’, and ‘binding’ were on top hit with 183 and 173 unigenes respectively. KEGG analysis could annotate the 2,892 (32.5%) of SSR containing unigenes (Fig. 4A, Suppl. Tab. 3).
A total of 2,250 (25.3%) and 4,658 (52.39%) of SSR containing unigenes could be annotated to COG and KOG databases, respectively. Among the function classes of both databases, ‘General function prediction only’ was on top selection, followed by ‘Translation, ribosomal structure and biogenesis’ and ‘post-transitional modifications, proteins turnover, chaperons’.
A total of 59 SSR were randomly selected to check whether PCR products could be observed on agarose gel (Suppl. Tab. 4). As shown in Fig. 5, all the SSR yielded PCR products in single band, some were brighter than others, and PCR product sizes corresponded to the expected sizes. This result demonstrates that the SSR primers generated in this study are functional and pending a polymorphism test in various genotypes; they have high potential applications in breeding and genomic studies.
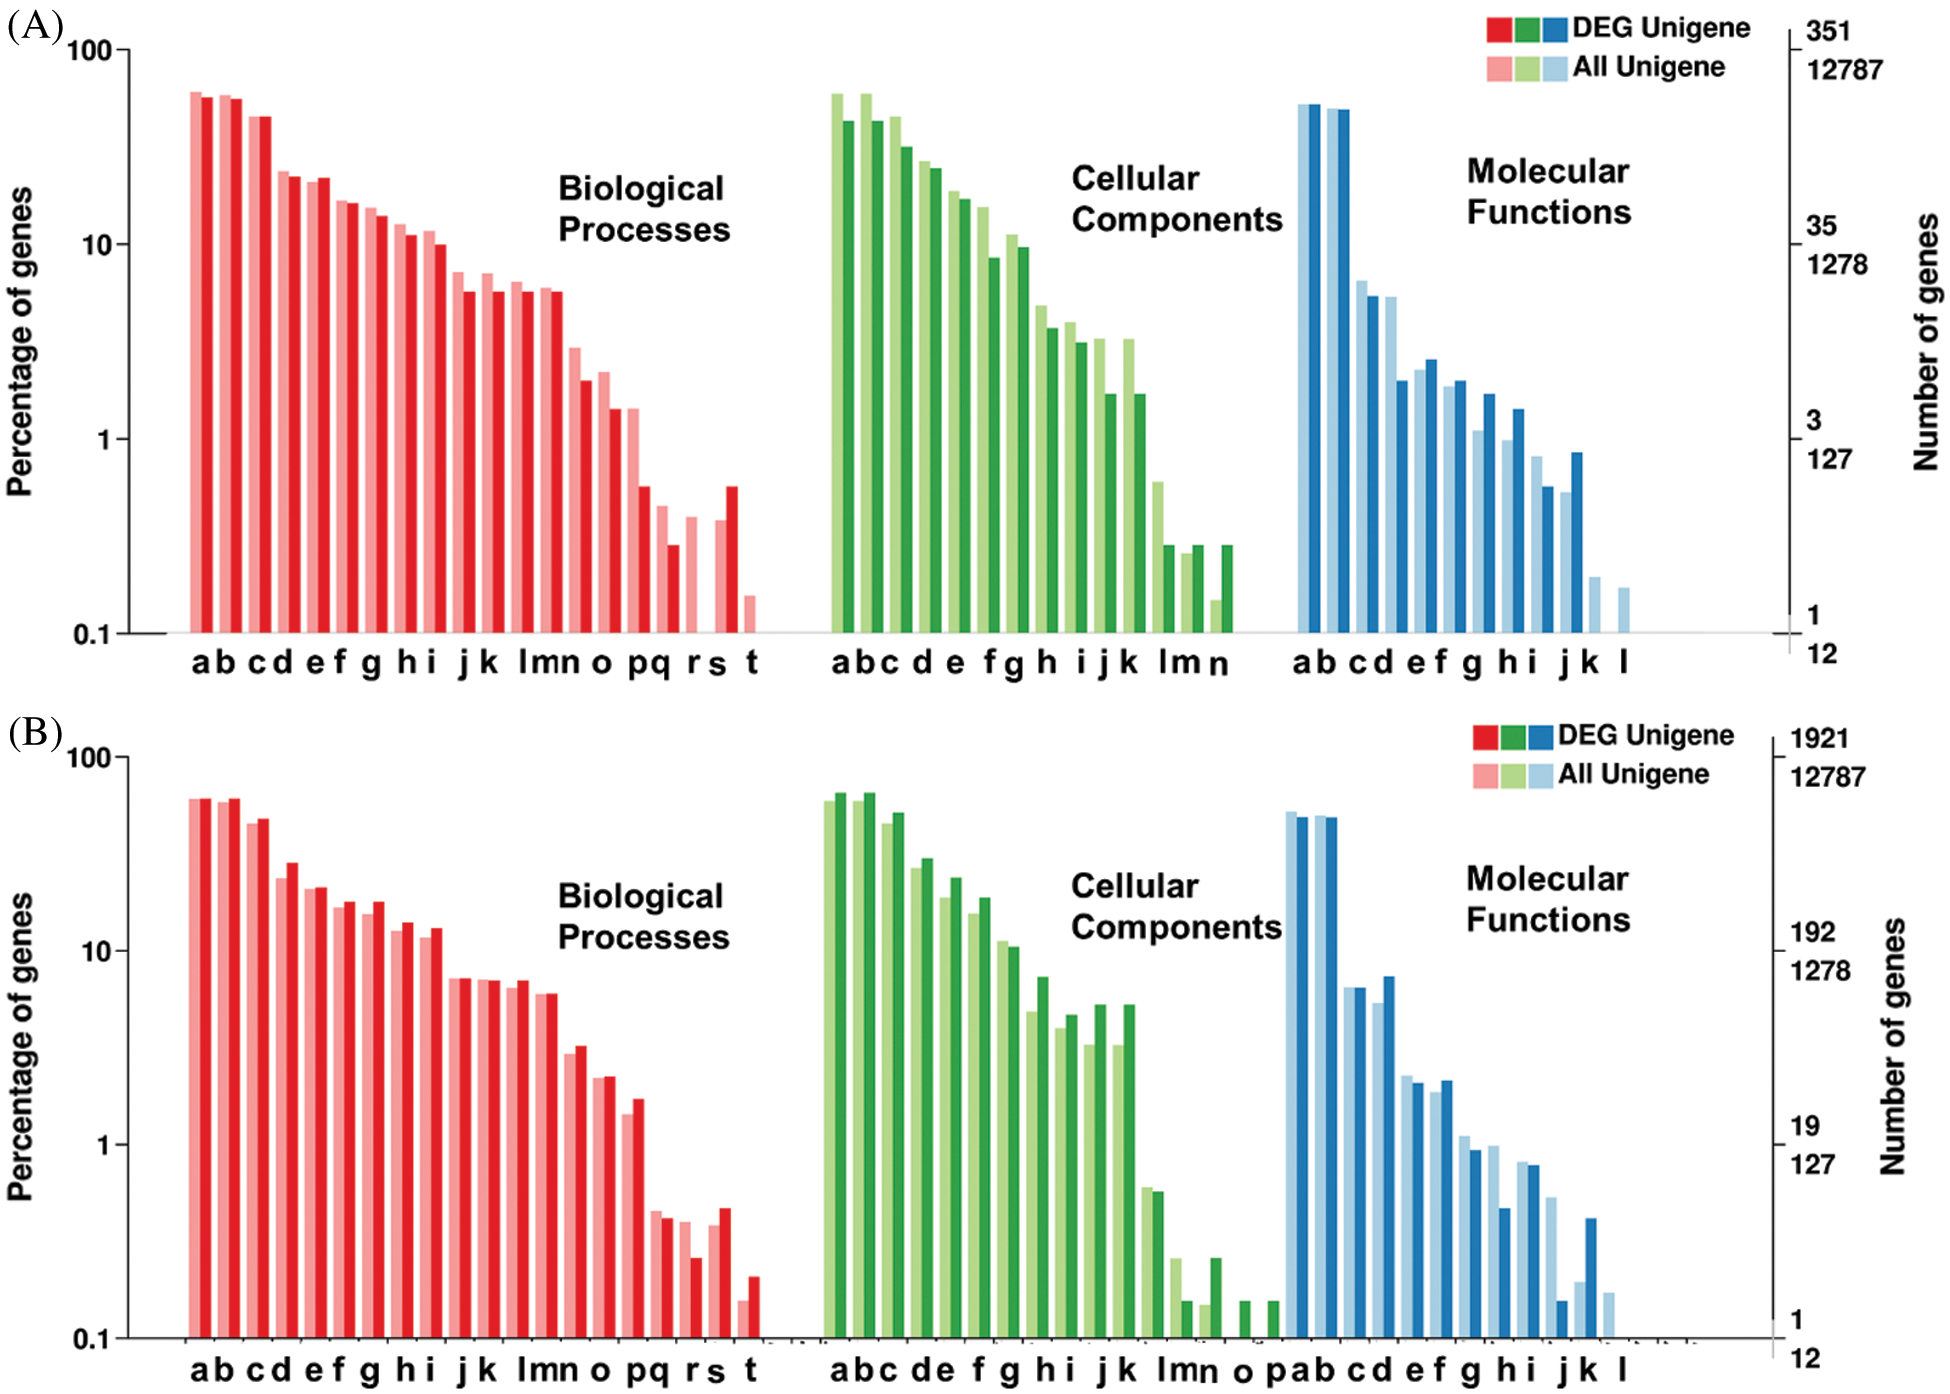
Figure 4: Classification of unigenes and differentially expressed gene for Functional annotation on gene ontology database (GO) for A: SSRs containing unigenes, and B: SNPs containing unigenes.
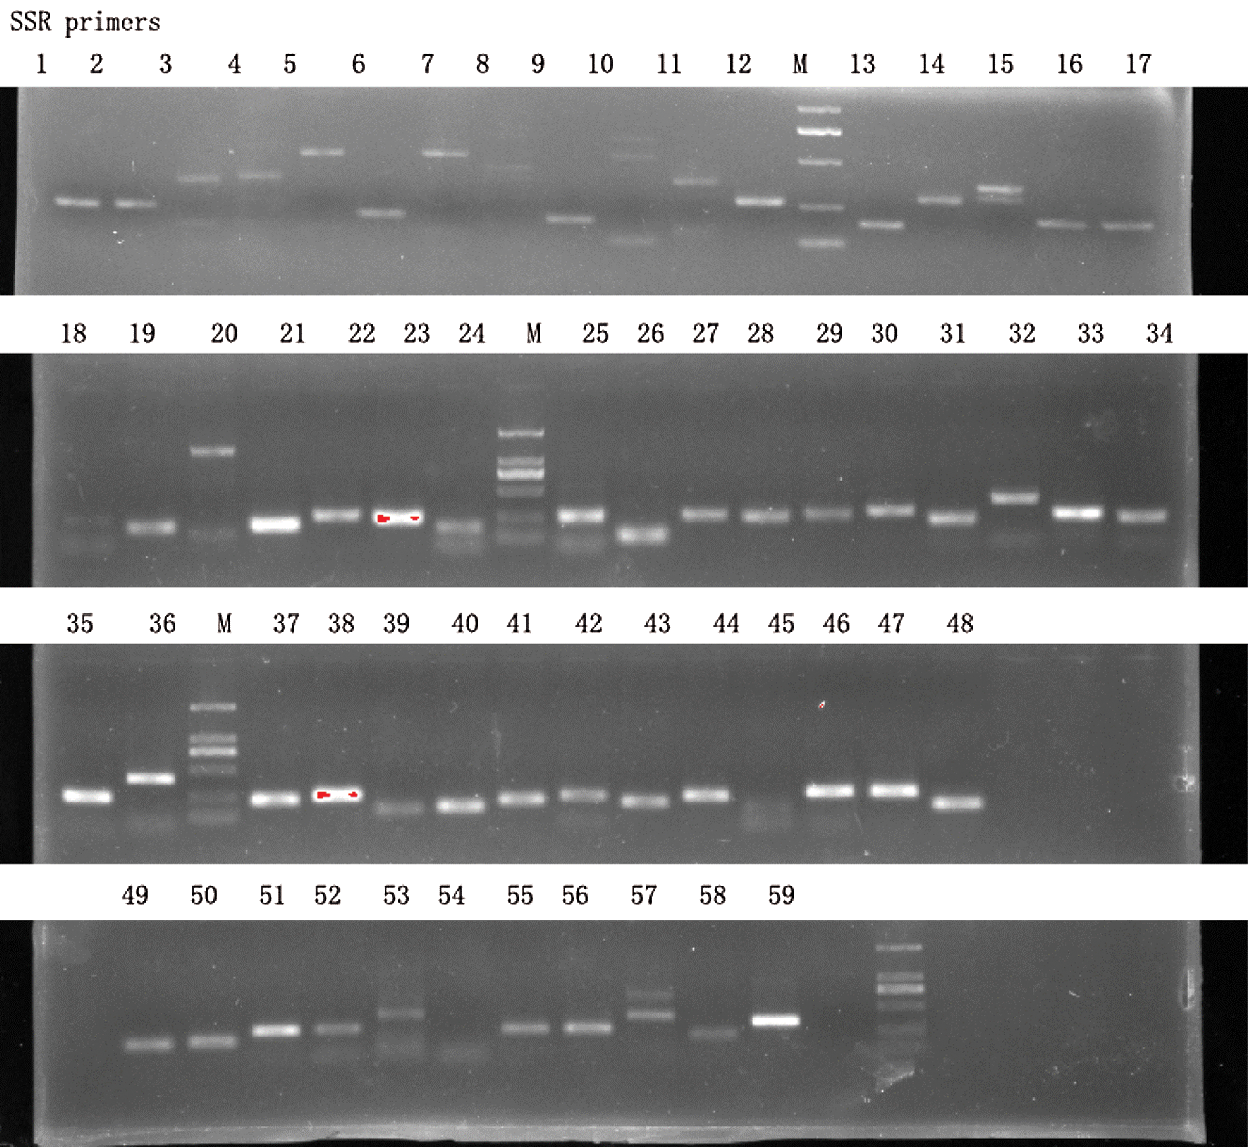
Figure 5: Agarose gel validation of 59 selected SSR markers using Hang cultivar DNA samples. M represents DNA ladder marker of 1 kb.
Identification and characterization of SNP variants in transcriptome
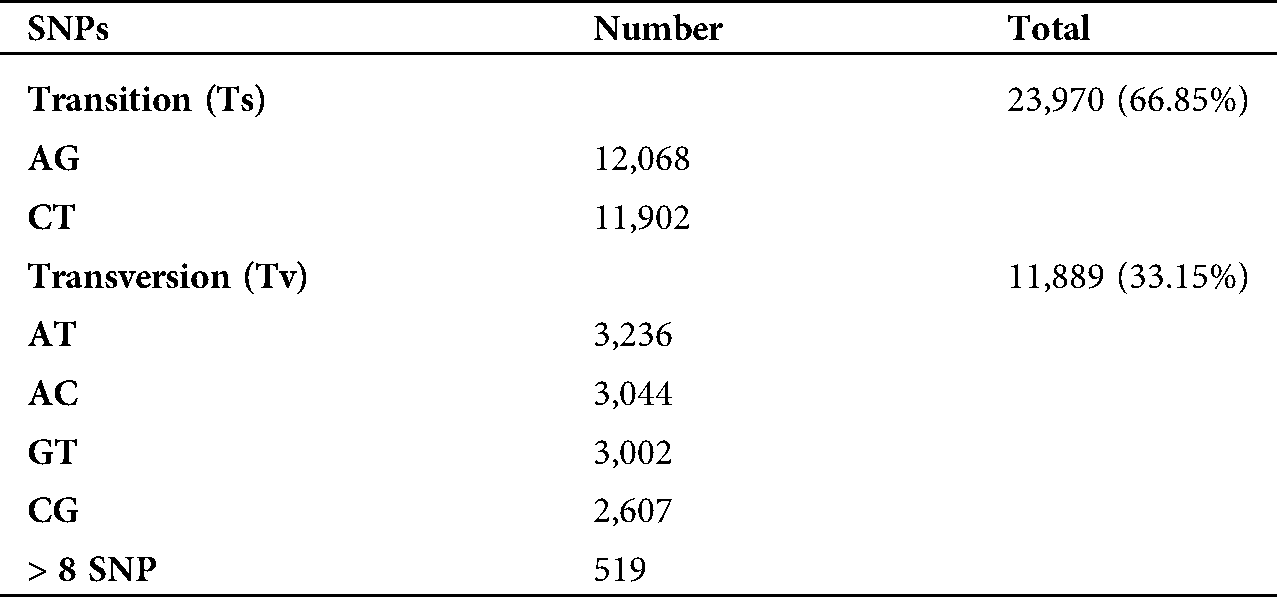
A total of 35,873 single nucleotide polymorphism (SNP) sites with an average of 243 SNPs per Mb of genome were identified. Among the total SNPs, 30,589 SNPs were found to be located in 12,983 annotated unigenes. The majority of SNPs (68.14%) were homozygous, while the heterozygous SNPs accounted for 31.86% (Tab. 6). The total number of transition (Ts) and transversion (Tv) mutations were 23,970 (66.85%) and 11,889 (33.15%), respectively, with a Ts/Tv ratio of 2.016 (Tab. 7, Suppl. Tab. 5). The amount for A/G transition substitutions was similar to C/T, while the frequency of four transversion substitutions (A/T, A/C, G/C, G/T) was equal as well (Tab. 7).
Table 6: Distribution of single nucleotide polymorphic (SNP) markers in Lagenaria siceraria transcriptome
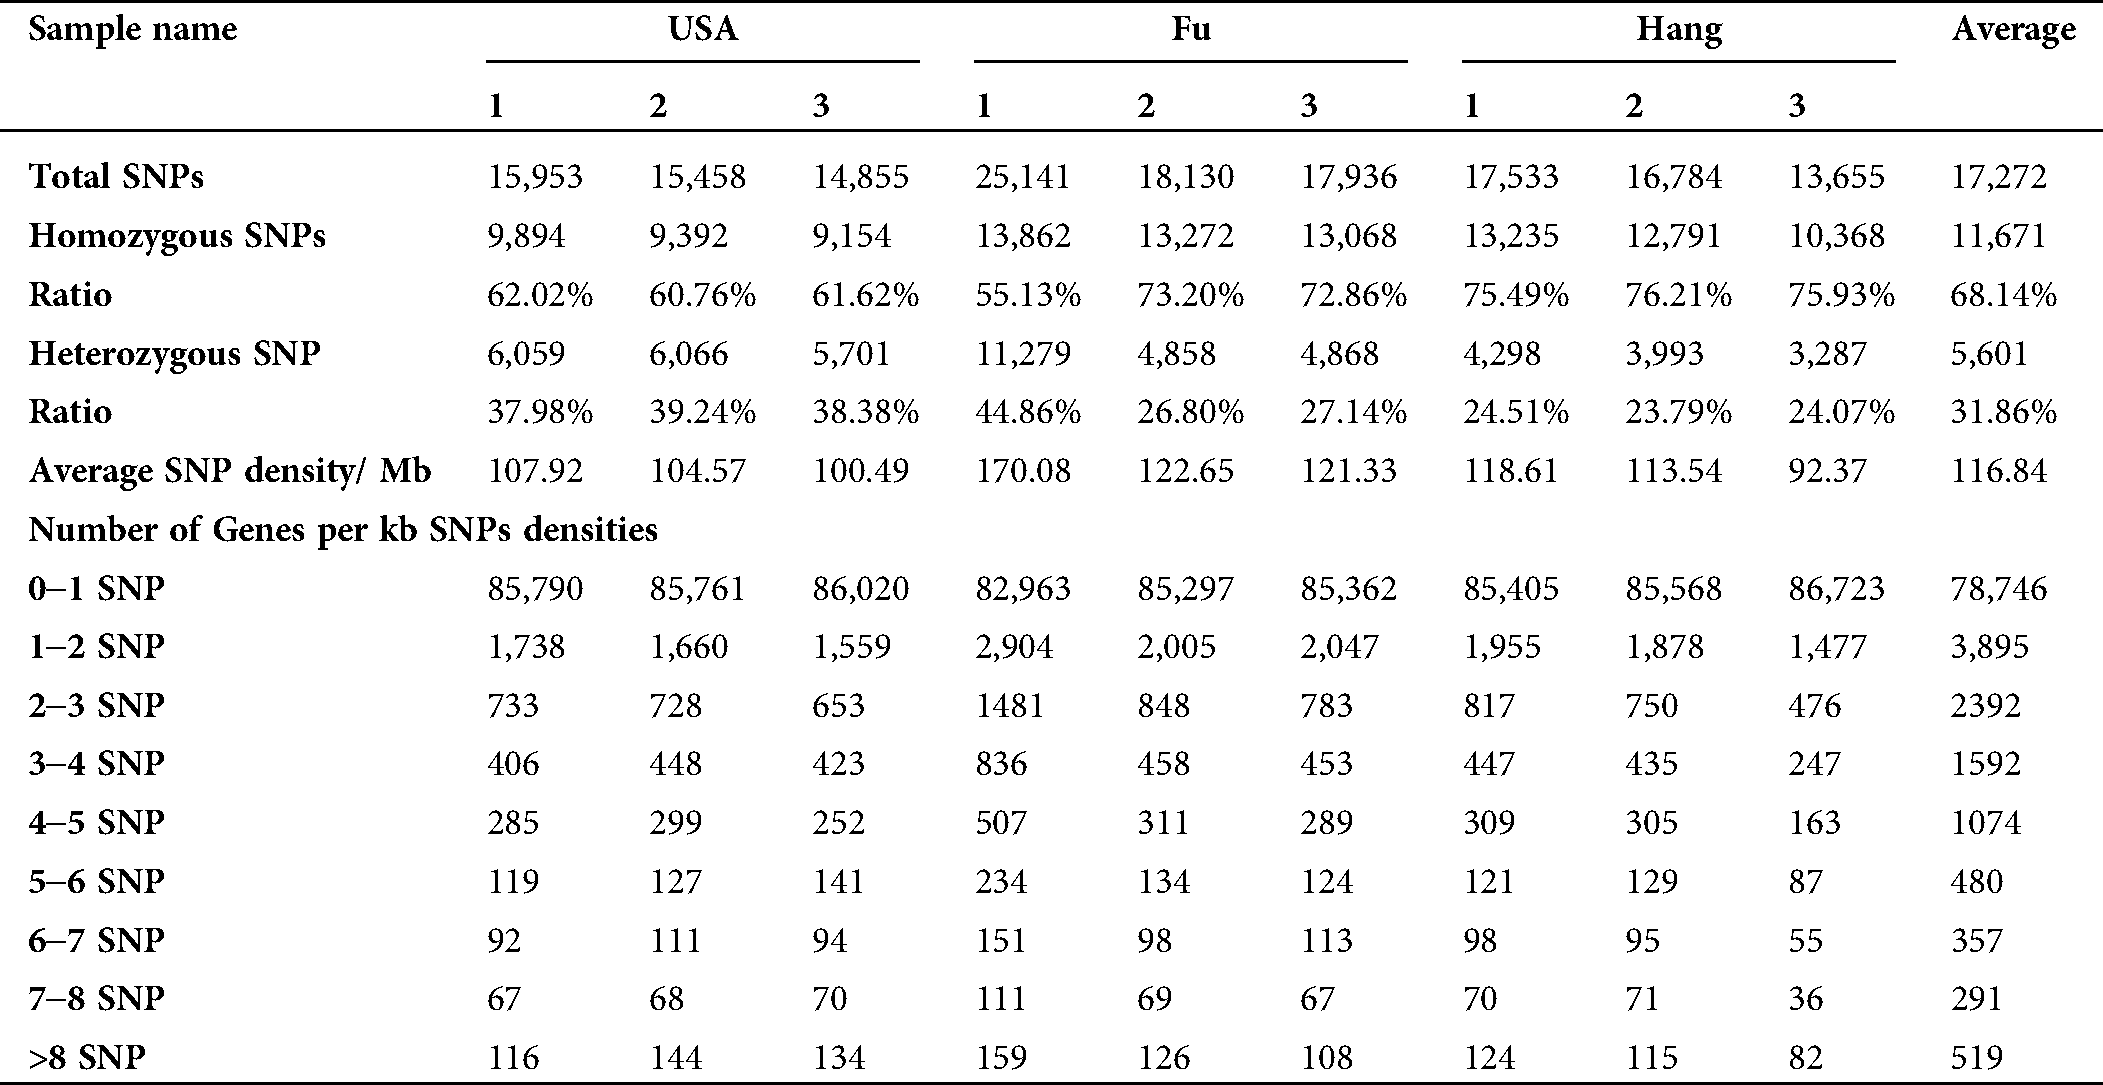
Table 7: Transition (Ts) and transversion (Tv) mutation statistics in the Lagenaria siceraria genome
SNP read depth and distribution
As the prediction accuracy of SNPs is closely related to the read depth (RD) in SNPs position (Li et al., 2013), the RD for each SNP position was calculated and plotted (Fig. 6A). The overall average RD was 15.75. Maximum (76%) SNPs showed the RD between 1 to 10 followed by 17% SNPs with 10 to 50 RD while the SNPs with 51 to 200 and >200 RD accounted for 5.47% and 1%, respectively.
The distribution of SNPs among unigenes is important to identify the marker density in the genome (Liu et al., 2011). The information on SNP distribution is also significant while using the SNPs to construct the linkage map. In this study, we found that all the SNPs were distributed in 14.5% (12,983) of total unigenes. Among these annotated unigenes, unigenes with one SNP were more common (51%), and those with no more than 10 SNPs occupied 98% of total unigenes. A total of 249 unigenes containing more than 10 SNPs were observed. The detailed SNPs distribution among those unigenes and SNP density were shown in Figs. 6B and 6C. The mutation rate among unigenes was investigated, as well as the SNP frequency within unigenes was calculated (Fig. 6D). The majority of unigenes showed a very low (0.00–0.01%) mutation rate. The top twenty annotated unigenes with the highest SNP frequency were listed in Suppl. Tab. 6.
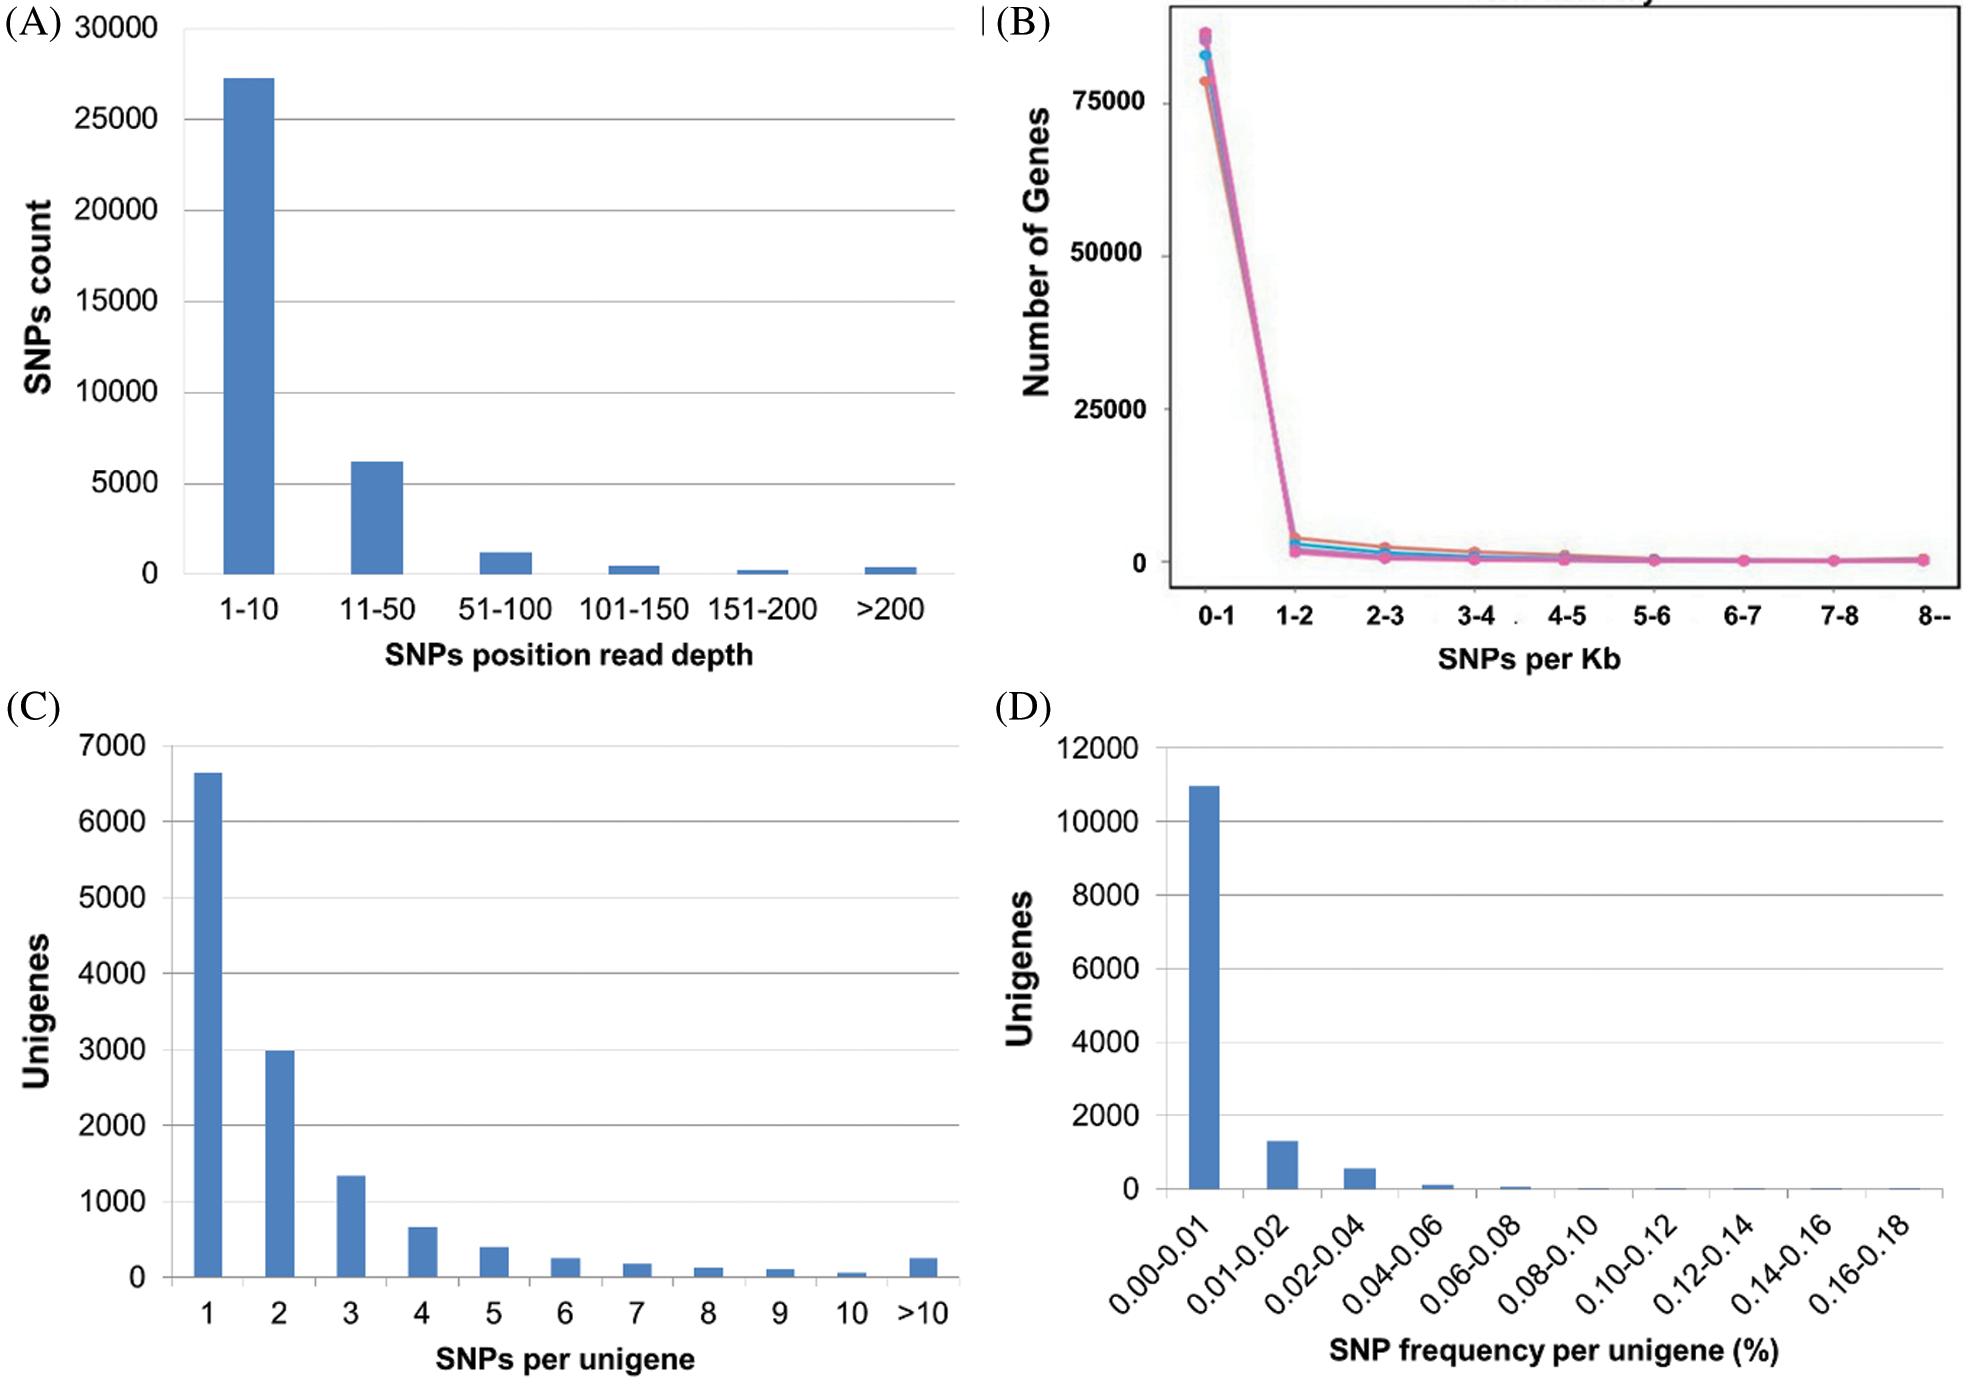
Figure 6: The frequencies and density of SNPs in unigenes, A: Number of unigenes with SNPs read depth, B: SNP density per kilobases of unigenes, C: SNP density per unigene, D: Mutation rate in percentage.
SNP functional enrichment analysis
Among the total 12,787 unigenes containing SNPs including 1,921 differentially expressed genes, 11,667 unigenes (90%) showed significant hit to the non-redundant (nr) database proteins. The unigenes were annotated by the corresponding top best BLASTx hit. After the Gene Ontology annotation, 1,921 unigenes (14.8%) were assigned with one or more GO term IDs. Among the total 54 GO terms for unigenes containing SNPs, ‘Biological Processes’ was on top hit with 5,765 GO terms followed by ‘Cellular Components’ and ‘Molecular Functions’ with 3,067 and 2,934 GO terms identification, respectively. Among the major-class ‘Biological Process’, the ‘metabolic process’ and ‘cellular process’ were on top identification with maximum unigenes. Among the ‘Cellular Components’, most of the unigenes were expressed for ‘Cell’, ‘Cell parts’ and ‘Organelles’ while among the ‘Molecular Functions’, the ‘catalytic activity’ and ‘molecular binding were on top hit. KEGG analysis could annotate the 5,577 (43%) of unigenes containing SNPs. A total of 1,182 SNP markers were observed for the 476 unigenes related to top KEGG ‘Ribosome’ pathways, which deals which RNA polymerase II synthesis and relevant processes (Suppl. Tab. 1, Fig. 4B).
The 32% (4,154) and 59% (7,656) of SNPs containing unigenes could be annotated to COG and KOG databases, respectively. Among the function classes of both databases ‘General function prediction only’ was on top selection followed by ‘Translation, ribosomal structure and biogenesis’ and ‘post-transitional modifications, proteins turnover, chaperons’.
Medicinal plants are significant in terms of financial income, healthcare, livelihood security, and cultural identity to the human populations (Hamilton, 2004). The majority (up to 80%) of the population in developing countries primarily depends on herbal medicine for the basic treatment of diseases (Hamilton, 2004; Pourmohammad, 2013). About 10% of 50,000 different herbal plant species are now commercially cultivated to fulfill the public market demands (Pourmohammad, 2013). To meet the increasing demand for medicinal plants in pharmaceuticals, it is required to take a variety of measures such as conservation of wild resources by adopting appropriate traditional and advanced techniques, developing new high-yielding varieties, or improving the existing cultivars using the molecular marker-based techniques (Chen et al., 2016). Hence, we used the highly grown commercial cultivars of L. siceraria and performed the transcriptomic study to facilitate the markers-based breeding and research programs. Due to its significant contribution in nutrition pharmaceuticals, L. siceraria has been studied widely in multiple fields including pharmacognostic (Shah and Seth, 2010), cultivation, genetic diversity (Chetariya and Vaddoria, 2017; Mladenović et al., 2012), domestication, and breeding (Damor et al., 2016) but less studied for the exploitation of molecular markers. The present study aimed at developing a large amount of SSR and SNP markers for L. siceraria through transcriptome sequencing.
Molecular markers, especially SSR and SNP markers, are indispensable tools to evaluate the genetic diversity, QTL/gene identification and manipulation, wild resource in situ and ex situ conservation of medicinal plants. The DNA fingerprinting technology-based molecular markers could allow the authentication of medicinal plants and species taxonomy (Li et al., 2003; Oleszek et al., 2002; Um et al., 2001). Markers assisted selection based molecular breeding technology facilitates the identification of desirable chemotypes (Fico et al., 2003). Moreover, molecular markers, especially SSR and SNP markers, have a significant impact in the research field of traditional herbal medicinal plants for improved yield and biotic and abiotic stress control.
High-throughput sequencing has been used frequently to exploit SSR and SNP markers for herbal medicinal plants on a large scale (Liu et al., 2015; Otto et al., 2017; Su et al., 2016; Wang et al., 2019b; Wei et al., 2016; Yun et al., 2012). As most of the functional genes at the corresponding developmental stage could be involved in the transcriptome, next-generation sequencing could enable the deep and efficient probing of the transcriptome (Grabherr et al., 2011) and ensures a sufficient resource for gene-associated markers discovery. Here, we have identified a total of 8,891 SSR and 35,873 SNP markers with high quality from the transcriptome of three L. siceraria cultivars using high-throughput sequencing, which will not only enhance the genetic resource but also help in the assessment of genetic diversity and conservation of this important herbal plant. Most of the identified SSR (75%) were within the mapped unigenes. An analysis of the localization of microsatellite repeated motifs showed that mono-nucleotides were preferentially localized in unigenes and were in the most proportion.
SSR markers have been extensively used in constructing genetic maps of cucurbit species (Fernandez-Silva et al., 2008; Levi et al., 2009). Until now, only a few microsatellites have been available for Cucurbita, and transferability from other cucurbits, such as cucumber, has been demonstrated to be very low (Fernandez-Silva et al., 2008). Thence, the development of SSRs for this genus is highly desirable. In a study of linkage mapping in 2008, Gong et al. (2008) reported the development of SSRs-enriched partial genomic libraries from an Austrian oil-pumpkin variety Cucumis pepo subsp. pepo and one accession of Cucumis moschata, generating a collection of 1,058 putative SSRs (Gong et al., 2008). Transcriptome-based SSRs have several advantages as they are related to genes. Being functional markers, they can be used as candidate genes to study their association with phenotypic variation, and their flanking sequences are more likely to be conserved among close or distant species, making their use as markers for comparative mapping easier.
The detection of false-positive SNPs is a common problem in the high-through transcriptome sequencing (Cánovas et al., 2010). Different SNP calling programs could generate inconsistent SNP datasets, along with errors in data (Clevenger et al., 2015). Three common programs, namely Bowtie 2 built in SAMtools, Freebayes, and GATK Unified Genotyper, are used to call SNPs. GATK is the most conservative, and SAMtools is the most aggressive program. Freebayes and SAMtools are much more consistent with each other (Clevenger et al., 2015). To remove the false-positive SNPs, different methods were used by researchers, such as removing all polymorphisms associated with genes that have paralogs (Barbazuk et al., 2007; Tang et al., 2006), setting some parameters like read depth (Li et al., 2012), minimum allele frequency (Byers et al., 2012), genotype score (Peace et al., 2012), base quality (Allen et al., 2013), and mapping quality (Uitdewilligen et al., 2013). The read depth and minimum allele frequency are the most commonly used parameters to investigate the false positives (Clevenger et al., 2015). Another study used the window approach to eliminate false-positive SNPs, i.e., potential alleles differed by 10% or more in the window surrounding the SNPs (Han et al., 2011). In this study, we detected the SNPs with read depth > 2, mismatches rate < 3 in 35 bp range of marker, and SNPs with distance > 5 bp, which could filter most of the false-positive SNPs, and generate high-quality SNPs.
The estimated SNP frequency in L. siceraria was 243 per Mb. The transition/transversion ratio (2.016) was also higher than Pacific oyster (1.3) (Tseng, 2012) and Drosophila (1.5) (Vera et al., 2013). Read depth is a key parameter affecting the predicting accuracy of SNPs (Li et al., 2013). One advantage of the Illumina sequencing platform is the high read depth, which ensures the detection of true SNPs. In this study, the average read depth of SNP position was 15.75, which was enough to guarantee the accuracy of discovered SNPs. It also could ensure that most of the expected SNPs in the sequenced population could be detected (Quinn et al., 2013). SNPs with much higher read depth should be excluded since too high read depth might be caused by paralogous sequence variants (Helyar et al., 2012). Heterozygosity and homozygosity analysis of these SNPs indicate most of these SNPs were polymorphic in the transcriptome. Another advantage of SNP discovery using transcriptome data is to find the SNPs directly associated with interesting traits, such as disease resistance or growth advantages. These SNPs can be possibly used in the further genome-wide association studies and genome selection breeding program of L. siceraria.
The SNP frequency in each unigene was calculated in this study. The SNP frequencies ranged from one per unigene to 55 per unigene. The unigenes with high-density polymorphic markers detected in this study could be used in the population diversity or population differentiation analysis. We arbitrarily evaluated the SNPs in deferentially expressed genes as well, which could be highly associated with the gene functions. GO and KEGG pathways analysis showed the most significant hits to the biological and catalytic process in cells, cell parts, and organelles for catalysis activities and molecular bindings in ‘Ribosome’ pathway. All of these are supporting the synthesis and regulation of bioactive ingredients, which provides an insight into the functional genomic understanding of various pharmaceutical functions.
Therefore, the SSRs and SNPs that are located in the corresponding unigenes should be given priority for molecular breeding of L. siceraria.
In this study, next-generation sequencing of transcriptomes from three L. siceraria cultivars was used for high throughput SSR and SNP markers identification. About 64.88 GB of cleaned data were generated and assembled into 89,347 unigenes. A total of 8,891 and 35,873 high-quality SSR and SNP markers were predicted from the assembled reads of the transcriptome data. The predicted SSR and SNP markers were observed to be on 6,030 and 12,983 annotated unigenes. This study provided a valuable resource of SSR and SNP markers for population genetics, molecular breeding, and association studies of L. siceraria. The results of the present study would increase the knowledge about functional genes and the healthful effects of L. siceraria.
Supplementary Material: The supplementary material is available online at DOI: 10.32604/biocell.2021.013869.
Authors Contribution: Hongyuan Zhang and Min Zhang: designed the study. Hongyuan Zhang, Xia Chen, Jie Tan, Shuping Huang, collected fruit samples, performed transcriptome analysis and data interpretation and validation; Hongyuan Zhang and Xia Chen: Drafted the manuscript; Min Zhang and Guolin Zhou: supervised the study, provided funding and revised the manuscript. All authors have read and approved the final version of the manuscript.
Availability of Data and Materials: The raw RNA-seq data has been submitted to NCBI SRA under BioProject ID PRJNA605136.
Funding Statement: This work was financially supported by Wuhan Academy of Agricultural Sciences Innovation Project (CXJSFW202001-2), Wuhan Academy of Agricultural Sciences Collaborative Innovation Project (XTCX202003-03), National Natural Science Fund Project of China (31701936).
Conflicts of Interest: The author(s) declare that there is no conflict of interest regarding the publication of this paper.
Ahmad I, Irshad M, Rizvi MMA. (2011). Nutritional and medicinal potential of Lagenaria siceraria. International Journal of Vegetable Science 17: 157–170. DOI 10.1080/19315260.2010.526173. [Google Scholar] [CrossRef]
Altschul SF, Madden TL, Schäffer AA, Zhang J, Zhang Z, Miller W, Lipman DJ. (1997). Gapped BLAST and PSI-BLAST: A new generation of protein database search programs. Nucleic Acids Research 25: 3389–3402. DOI 10.1093/nar/25.17.3389. [Google Scholar] [CrossRef]
Allen AM, Barker GL, Wilkinson P, Burridge A, Winfield M, Coghill J, Uauy C, Griffiths S, Jack P, Berry S. (2013). Discovery and development of exome-based, co-dominant single nucleotide polymorphism markers in hexaploid wheat (Triticum aestivum L.). Plant Biotechnology Journal 11: 279–295. DOI 10.1111/pbi.12009. [Google Scholar] [CrossRef]
Anders S, Huber W. (2010). Differential expression analysis for sequence count data. Genome Biology 11: R106. DOI 10.1186/gb-2010-11-10-r106. [Google Scholar] [CrossRef]
Apweiler R, Bairoch A, Wu CH, Barker WC, Boeckmann B, Ferro S, Gasteiger E, Huang H, Lopez R, Magrane M. (2004). UniProt: The universal protein knowledgebase. Nucleic Acids Research 32: D115–D119. DOI 10.1093/nar/gkh131. [Google Scholar] [CrossRef]
Ashburner M, Ball CA, Blake JA, Botstein D, Butler H, Cherry JM, Davis AP, Dolinski K, Dwight SS, Eppig JT. (2000). Gene ontology: Tool for the unification of biology. Nature Genetics 25: 25–29. DOI 10.1038/75556. [Google Scholar] [CrossRef]
Barbazuk WB, Emrich SJ, Chen HD, Li L, Schnable PS. (2007). SNP discovery via 454 transcriptome sequencing. Plant Journal 51: 910–918. DOI 10.1111/j.1365-313X.2007.03193.x. [Google Scholar] [CrossRef]
Byers RL, Harker DB, Yourstone SM, Maughan PJ, Udall JA. (2012). Development and mapping of SNP assays in allotetraploid cotton. Theoretical and Applied Genetics 124: 1201–1214. DOI 10.1007/s00122-011-1780-8. [Google Scholar] [CrossRef]
Cánovas A, Rincon G, Islas-Trejo A, Wickramasinghe S, Medrano JF. (2010). SNP discovery in the bovine milk transcriptome using RNA-Seq technology. Mammalian Genome 21: 592–598. DOI 10.1007/s00335-010-9297-z. [Google Scholar] [CrossRef]
Clevenger J, Chavarro C, Pearl SA, Ozias-Akins P, Jackson SA. (2015). Single nucleotide polymorphism identification in polyploids: A review, example, and recommendations. Molecular Plant 8: 831–846. DOI 10.1016/j.molp.2015.02.002. [Google Scholar] [CrossRef]
Cock PJ, Fields CJ, Goto N, Heuer ML, Rice PM. (2010). The Sanger FASTQ file format for sequences with quality scores, and the Solexa/Illumina FASTQ variants. Nucleic Acids Research 38: 1767–1771. DOI 10.1093/nar/gkp1137. [Google Scholar] [CrossRef]
Codina-Solà M, Rodríguez-Santiago B, Homs A, Santoyo J, Rigau M, Aznar-Laín G, Del Campo M, Gener B, Gabau E, Botella MP. (2015). Integrated analysis of whole-exome sequencing and transcriptome profiling in males with autism spectrum disorders. Molecular Autism 6: 21. DOI 10.1186/s13229-015-0017-0. [Google Scholar] [CrossRef]
Chen SL, Yu H, Luo HM, Wu Q, Li CF, Steinmetz A. (2016). Conservation and sustainable use of medicinal plants: Problems, progress, and prospects. Chinese Medicine 11: 37. DOI 10.1186/s13020-016-0108-7. [Google Scholar] [CrossRef]
Chetariya C, Vaddoria M. (2017). Genetic divergence analysis in bottle gourd [Lagenaria siceraria (Mol.) Standl.]. Journal of Applied and Natural Science 9: 1949–1953. DOI 10.31018/jans.v9i4.1470. [Google Scholar] [CrossRef]
Damor A, Patil J, Parmer H, Vyas N. (2016). Studies on genetic variability, heritability and genetic advance for yield and quality traits in bottle gourd [Lageneria seceraria (Molina) Standl.] genotypes. International Journal of Environmental Science and Technology 5: 2301–2307. [Google Scholar]
De Wit P, Palumbi SR. (2013). Transcriptome-wide polymorphisms of red abalone (Haliotis rufescens) reveal patterns of gene flow and local adaptation. Molecular Ecology 22: 2884–2897. DOI 10.1111/mec.12081. [Google Scholar] [CrossRef]
Deng Y, Li J, Wu S, Zhu Y, Chen Y, He F, Chen Y, Deng LY, Li J, Wu S. (2006). Integrated nr database in protein annotation system and its localization. Computer Engineering 32: 71–74. [Google Scholar]
Dobin A, Davis CA, Schlesinger F, Drenkow J, Zaleski C, Jha S, Batut P, Chaisson M, Gingeras TR. (2013). STAR: Ultrafast universal RNA-seq aligner. Bioinformatics 29: 15–21. DOI 10.1093/bioinformatics/bts635. [Google Scholar] [CrossRef]
Eddy SR. (1998). Profile hidden Markov models. Bioinformatics 14: 755–763. DOI 10.1093/bioinformatics/14.9.755. [Google Scholar] [CrossRef]
Fernandez-Silva I, Eduardo I, Blanca J, Esteras C, Pico B, Nuez F, Arus P, Garcia-Mas J, Monforte AJ. (2008). Bin mapping of genomic and EST-derived SSRs in melon (Cucumis melo L.). Theoretical and Applied Genetics 118: 139–150. DOI 10.1007/s00122-008-0883-3. [Google Scholar] [CrossRef]
Fico G, Spada A, Braca A, Agradi E, Morelli I, Tomé F. (2003). RAPD analysis and flavonoid composition of Aconitum as an aid for taxonomic discrimination. Biochemical Systematics and Ecology 31: 293–301. DOI 10.1016/S0305-1978(02)00153-9. [Google Scholar] [CrossRef]
Finn RD, Bateman A, Clements J, Coggill P, Eberhardt RY, Eddy SR, Heger A, Hetherington K, Holm L, Mistry J. (2014). Pfam: The protein families database. Nucleic Acids Research 42: D222–D230. DOI 10.1093/nar/gkt1223. [Google Scholar] [CrossRef]
Gangwal A, Parmar S, Sheth N. (2009). Isolation and immunomodulatory activity of phytoconstituents of Lagenaria siceraria. InPharm Communique 2: 46–50. [Google Scholar]
Gong L, Stift G, Kofler R, Pachner M, Lelley T. (2008). Microsatellites for the genus Cucurbita and an SSR-based genetic linkage map of Cucurbita pepo L. Theoretical and Applied Genetics 117: 37–48. DOI 10.1007/s00122-008-0750-2. [Google Scholar] [CrossRef]
Grabherr MG, Haas BJ, Yassour M, Levin JZ, Thompson DA, Amit I, Adiconis X, Fan L, Raychowdhury R, Zeng Q. (2011). Full-length transcriptome assembly from RNA-Seq data without a reference genome. Nature Biotechnology 29: 644–652. DOI 10.1038/nbt.1883. [Google Scholar] [CrossRef]
Gramazio P, Plesa IM, Truta AM, Sestras AF, Vilanova S, Plazas M, Vicente O, Boscaiu M, Prohens J, Sestras RE. (2018). Highly informative SSR genotyping reveals large genetic diversity and limited differentiation in European larch (Larix decidua) populations from Romania. Turkish Journal of Agriculture Forestry 42: 165–175. DOI 10.3906/tar-1801-41. [Google Scholar] [CrossRef]
Grover A, Sharma P. (2016). Development and use of molecular markers: Past and present. Critical Reviews in Biotechnology 36: 290–302. DOI 10.3109/07388551.2014.959891. [Google Scholar] [CrossRef]
Hamilton AC. (2004). Medicinal plants, conservation and livelihoods. Biodiversity and Conservation 13: 1477–1517. DOI 10.1023/B:BIOC.0000021333.23413.42. [Google Scholar] [CrossRef]
Han Y, Kang Y, Torres-Jerez I, Cheung F, Town CD, Zhao PX, Udvardi MK, Monteros MJ. (2011). Genome-wide SNP discovery in tetraploid alfalfa using 454 sequencing and high resolution melting analysis. BMC Genomics 12: 350. DOI 10.1186/1471-2164-12-350. [Google Scholar] [CrossRef]
Helyar SJ, Limborg MT, Bekkevold D, Babbucci M, Van Houdt J, Maes GE, Bargelloni L, Nielsen RO, Taylor MI, Ogden R. (2012). SNP discovery using next generation transcriptomic sequencing in Atlantic herring (Clupea harengus). PLoS One 7: e42089. DOI 10.1371/journal.pone.0042089. [Google Scholar] [CrossRef]
Huerta-Cepas J, Szklarczyk D, Forslund K, Cook H, Heller D, Walter MC, Rattei T, Mende DR, Sunagawa S, Kuhn M. (2016). eggNOG 4.5: A hierarchical orthology framework with improved functional annotations for eukaryotic, prokaryotic and viral sequences. Nucleic Acids Research 44: D286–D293. DOI 10.1093/nar/gkv1248. [Google Scholar] [CrossRef]
Izawa K, Kuroda M. (2010). Chemical ecology. In: Liu HWB, Mander L, eds., Comprehensive Natural Products II: Chemistry and Biology. Elsevier Science, pp. 23–56. [Google Scholar]
Kanehisa M, Goto S, Kawashima S, Okuno Y, Hattori M. (2004). The KEGG resource for deciphering the genome. Nucleic Acids Research 32: D277–D280. DOI 10.1093/nar/gkh063. [Google Scholar] [CrossRef]
Koonin EV, Fedorova ND, Jackson JD, Jacobs AR, Krylov DM, Makarova KS, Mazumder R, Mekhedov SL, Nikolskaya AN, Rao B, Rogozin IB, Smirnov S, Sorokin AV, Sverdlov AV, Vasudevan S, Wolf YI, Yin JJ, Natale DA. (2004). A comprehensive evolutionary classification of proteins encoded in complete eukaryotic genomes. Genome Biology 5: R7. DOI 10.1186/gb-2004-5-2-r7. [Google Scholar] [CrossRef]
Kumar R, Kumar R, Prasad BD, Solankey S, Kumar J, Bamaniya B. (2018). Genetic variation study using morphological and DNA marker-based genotyping in bottle gourd (Lagenaria siceraria (Mol.) Standl.). Current Journal of Applied Science Technology 31: 1–10. [Google Scholar]
Kumar S, Banks TW, Cloutier S. (2012). SNP discovery through next-generation sequencing and its applications. International Journal of Plant Genomics 2012: 831460. [Google Scholar]
Langmead B, Salzberg SL. (2012). Fast gapped-read alignment with Bowtie 2. Nature Methods 9: 357–359. DOI 10.1038/nmeth.1923. [Google Scholar] [CrossRef]
Leng N, Dawson JA, Thomson JA, Ruotti V, Rissman AI, Smits BM, Haag JD, Gould MN, Stewart RM, Kendziorski C. (2013). EBSeq: An empirical Bayes hierarchical model for inference in RNA-seq experiments. Bioinformatics 29: 1035–1043. DOI 10.1093/bioinformatics/btt087. [Google Scholar] [CrossRef]
Levi A, Wechter P, Davis A. (2009). EST-PCR markers representing watermelon fruit genes are polymorphic among watermelon heirloom cultivars sharing a narrow genetic base. Plant Genetic Resources 7: 16–32. DOI 10.1017/S1479262108014366. [Google Scholar] [CrossRef]
Li B, Dewey CN. (2011). RSEM: Accurate transcript quantification from RNA-Seq data with or without a reference genome. BMC Bioinformatics 12: 323. DOI 10.1186/1471-2105-12-323. [Google Scholar] [CrossRef]
Li S, Zhang X, Sun Z, Li F, Xiang J. (2013). Transcriptome analysis on Chinese shrimp Fenneropenaeus chinensis during WSSV acute infection. PLoS One 8: e58627. DOI 10.1371/journal.pone.0058627. [Google Scholar] [CrossRef]
Li X, Acharya A, Farmer AD, Crow JA, Bharti AK, Kramer RS. (2012). Prevalence of single nucleotide polymorphism among 27 diverse alfalfa genotypes as assessed by transcriptome sequencing. BMC Genomics 13: 568. DOI 10.1186/1471-2164-13-568. [Google Scholar] [CrossRef]
Li Y, Li Y, Lin J, Xu Y, Yan F, Tang L, Chen F. (2003). Identification of bulb from Fritillaria cirrhosa by PCR with specific primers. Planta Medica 69: 186–188. DOI 10.1055/s-2003-37699. [Google Scholar] [CrossRef]
Lim T. (2012). Lagenaria siceraria. Edible medicinal and non-medicinal plants. Fruits. Dordrecht: Springer. 2: 298–313. DOI 10.1007/978-94-007-1764-0. [Google Scholar] [CrossRef]
Liu J, Hou J, Jiang C, Li G, Lu H, Meng F, Shi L. (2015). Deep sequencing of the Scutellaria baicalensis Georgi transcriptome reveals flavonoid biosynthetic profiling and organ-specific gene expression. PLoS One 10: e0136397. DOI 10.1371/journal.pone.0136397. [Google Scholar] [CrossRef]
Liu S, Zhou Z, Lu J, Sun F, Wang S, Liu H, Jiang Y, Kucuktas H, Kaltenboeck L, Peatman E. (2011). Generation of genome-scale gene-associated SNPs in catfish for the construction of a high-density SNP array. BMC Genomics 12: 53. DOI 10.1186/1471-2164-12-53. [Google Scholar] [CrossRef]
Mladenović E, Berenji J, Ognjanov V, Ljubojević M, Čukanović J. (2012). Genetic variability of bottle gourd Lagenaria siceraria (Mol.) Standley and its morphological characterization by multivariate analysis. Archives of Biological Sciences 64: 573–583. DOI 10.2298/ABS1202573M. [Google Scholar] [CrossRef]
Nadeem MA, Nawaz MA, Shahid MQ, Doğan Y, Comertpay G, Yıldız M, Hatipoğlu R, Ahmad F, Alsaleh A, Labhane N. (2018). DNA molecular markers in plant breeding: Current status and recent advancements in genomic selection and genome editing. Biotechnology & Biotechnological Equipment 32: 261–285. DOI 10.1080/13102818.2017.1400401. [Google Scholar] [CrossRef]
Oleszek W, Stochmal A, Karolewski P, Simonet AM, Macias FA, Tava A. (2002). Flavonoids from Pinus sylvestris needles and their variation in trees of different origin grown for nearly a century at the same area. Biochemical Systematics Ecology 30: 1011–1022. DOI 10.1016/S0305-1978(02)00060-1. [Google Scholar] [CrossRef]
Otto LG, Mondal P, Brassac J, Preiss S, Degenhardt J, He S, Reif JC, Sharbel TF. (2017). Use of genotyping-by-sequencing to determine the genetic structure in the medicinal plant chamomile, and to identify flowering time and alpha-bisabolol associated SNP-loci by genome-wide association mapping. BMC Genomics 18: 599. DOI 10.1186/s12864-017-3991-0. [Google Scholar] [CrossRef]
Peace C, Bassil N, Main D, Ficklin S, Rosyara UR, Stegmeir T, Sebolt A, Gilmore B, Lawley C, Mockler TC. (2012). Development and evaluation of a genome-wide 6K SNP array for diploid sweet cherry and tetraploid sour cherry. PLoS One 7: e48305. DOI 10.1371/journal.pone.0048305. [Google Scholar] [CrossRef]
Pourmohammad A. (2013). Application of molecular markers in medicinal plant studies. Acta Universitatis Sapientiae, Agriculture and Environment 5: 80–90. DOI 10.2478/ausae-2014-0006. [Google Scholar] [CrossRef]
Prajapati RP, Kalariya M, Parmar SK, Sheth NR. (2010). Phytochemical and pharmacological review of Lagenaria sicereria. Journal of Ayurveda and Integrative Medicine 1: 266. DOI 10.4103/0975-9476.74431. [Google Scholar] [CrossRef]
Quinn EM, Cormican P, Kenny EM, Hill M, Anney R, Gill M, Corvin AP, Morris DW. (2013). Development of strategies for SNP detection in RNA-seq data: Application to lymphoblastoid cell lines and evaluation using 1000 genomes data. PLoS One 8: e58815. DOI 10.1371/journal.pone.0058815. [Google Scholar] [CrossRef]
Rahman AH. (2003). Bottle gourd (Lagenaria siceraria) a vegetable for good health. Natural Product Radiance 2: 249–250. [Google Scholar]
Rashid MAR, Zhao Y, Zhang H, Li J, Li Z. (2016). Nucleotide diversity, natural variation, and evolution of Flexible culm-1 and Strong culm-2 lodging resistance genes in rice. Genome 59: 473–483. DOI 10.1139/gen-2016-0019. [Google Scholar] [CrossRef]
Shah BN, Seth AK. (2010). Pharmacognostic studies of the Lagenaria siceraria (Molina) Standley. International Journal of PharmTech Research 2: 121–124. [Google Scholar]
Sidhu NS, Pruthi G, Singh S, Bishnoi R, Singla D. (2020). Genome-wide identification and analysis of GRAS transcription factors in the bottle gourd genome. Scientific Reports 10: 14338. DOI 10.1038/s41598-020-71240-2. [Google Scholar] [CrossRef]
Su X, Li Q, Chen S, Dong C, Hu Y, Yin L, Yang J. (2016). Analysis of the transcriptome of Isodon rubescens and key enzymes involved in terpenoid biosynthesis. Biotechnology & Biotechnological Equipment 30: 592–601. DOI 10.1080/13102818.2016.1146086. [Google Scholar] [CrossRef]
Sunnucks P. (2000). Efficient genetic markers for population biology. Trends in Ecology & Evolution 15: 199–203. DOI 10.1016/S0169-5347(00)01825-5. [Google Scholar] [CrossRef]
Tang J, Vosman B, Voorrips RE, Van Der Linden CG, Leunissen JA. (2006). QualitySNP: A pipeline for detecting single nucleotide polymorphisms and insertions/deletions in EST data from diploid and polyploid species. BMC Bioinformatics 7: 438. DOI 10.1186/1471-2105-7-438. [Google Scholar] [CrossRef]
Tatusov RL, Galperin MY, Natale DA, Koonin EV. (2000). The COG database: A tool for genome-scale analysis of protein functions and evolution. Nucleic Acids Research 28: 33–36. DOI 10.1093/nar/28.1.33. [Google Scholar] [CrossRef]
Thakur O, Randhawa GS. (2018). Identification and characterization of SSR, SNP and InDel molecular markers from RNA-Seq data of guar (Cyamopsis tetragonoloba, L. Taub.) roots. BMC Genomics 19: 951. DOI 10.1186/s12864-018-5205-9. [Google Scholar] [CrossRef]
Tseng MC. (2012). Evolution of microsatellite Loci of tropical and temperate anguilla eels. International Journal of Molecular Sciences 13: 4281–4294. DOI 10.3390/ijms13044281. [Google Scholar] [CrossRef]
Uitdewilligen JG, Wolters AMA, D’hoop BB, Borm TJ, Visser RG, Van Eck HJ. (2013). A next-generation sequencing method for genotyping-by-sequencing of highly heterozygous autotetraploid potato. PLoS One 8: e62355. DOI 10.1371/journal.pone.0062355. [Google Scholar] [CrossRef]
Um JY, Chung HS, Kim MS, Na HJ, Kwon HJ, Kim JJ, Lee KM, Lee SJ, Lim JP, Hwang WJ. (2001). Molecular authentication of Panax ginseng species by RAPD analysis and PCR-RFLP. Biological & Pharmaceutical Bulletin 24: 872–875. DOI 10.1248/bpb.24.872. [Google Scholar] [CrossRef]
Untergasser A, Cutcutache I, Koressaar T, Ye J, Faircloth BC, Remm M, Rozen SG. (2012). Primer3—New capabilities and interfaces. Nucleic Acids Research 40: e115. DOI 10.1093/nar/gks596. [Google Scholar] [CrossRef]
Vera M, Alvarez-Dios J-A, Fernandez C, Bouza C, Vilas R, Martinez P. (2013). Development and validation of single nucleotide polymorphisms (SNPs) markers from two transcriptome 454-runs of turbot (Scophthalmus maximus) using high-throughput genotyping. International Journal of Molecular Sciences 14: 5694–5711. DOI 10.3390/ijms14035694. [Google Scholar] [CrossRef]
Wang Y, Shahid MQ, Ghouri F, Ercişli S, Baloch FS (2019a). Development of EST-based SSR and SNP markers in Gastrodia elata (herbal medicine) by sequencing, de novo assembly and annotation of the transcriptome. 3 Biotech 9: 292. [Google Scholar]
Wang Y, Shahid MQ, Ghouri F, Ercişli S, Baloch FS, Nie F (2019b). Transcriptome analysis and annotation: SNPs identified from single copy annotated unigenes of three polyploid blueberry crops. PLoS One 14: e0216299. DOI 10.1371/journal.pone.0216299. [Google Scholar] [CrossRef]
Wang Y, Xu P, Wu X, Wu X, Wang B, Huang Y, Hu Y, Lin J, Lu Z, Li G. (2018). GourdBase: A genome-centered multi-omics database for the bottle gourd (Lagenaria sicerariaan economically important cucurbit crop. Scientific Reports 8: 3604. DOI 10.1038/s41598-018-22007-3. [Google Scholar] [CrossRef]
Wei Z, Sun Z, Cui B, Zhang Q, Xiong M, Wang X, Zhou D. (2016). Transcriptome analysis of colored calla lily (Zantedeschia rehmannii Engl.) by Illumina sequencing: De novo assembly, annotation and EST-SSR marker development. PeerJ 4: e2378. DOI 10.7717/peerj.2378. [Google Scholar] [CrossRef]
Wu S, Shamimuzzaman M, Sun H, Salse J, Sui X, Wilder A, Wu Z, Levi A, Xu Y, Ling KS, Fei Z. (2017). The bottle gourd genome provides insights into Cucurbitaceae evolution and facilitates mapping of a Papaya ring-spot virus resistance locus. Plant Journal 92: 963–975. DOI 10.1111/tpj.13722. [Google Scholar] [CrossRef]
Wu X, Wu X, Wang Y, Wang B, Lu Z, Xu P, Li G. (2019). Molecular genetic mapping of two complementary genes underpinning fruit bitterness in the bottle gourd [Lagenaria siceraria (Mol.) Standl.]. Frontiers in Plant Science 10: 1493. DOI 10.3389/fpls.2019.01493. [Google Scholar] [CrossRef]
Xie C, Mao X, Huang J, Ding Y, Wu J, Dong S, Kong L, Gao G, Li CY, Wei L. (2011). KOBAS 2.0: A web server for annotation and identification of enriched pathways and diseases. Nucleic Acids Research 39: W316–W322. DOI 10.1093/nar/gkr483. [Google Scholar] [CrossRef]
Xie J, Tian J, Du Q, Chen J, Li Y, Yang X, Li B, Zhang D. (2016). Association genetics and transcriptome analysis reveal a gibberellin-responsive pathway involved in regulating photosynthesis. Journal of Experimental Botany 67: 3325–3338. DOI 10.1093/jxb/erw151. [Google Scholar] [CrossRef]
Yang X, Zhang M, Xu J, Liu G, Yao X, Li P, Zhu L. (2014). Transcriptome analysis of root development in bottle gourd (Lagenaria siceraria). In: XXIX International Horticultural Congress on Horticulture: Sustaining Lives, Livelihoods and Landscapes (IHC20141110, pp. 41–48. DOI 10.17660/ActaHortic.2016.1110.7. [Google Scholar] [CrossRef]
Yun H, Hou L, Song M, Wang Y, Zakus D, Wu L, Wang W. (2012). Genomics and traditional Chinese medicine: A new driver for novel molecular-targeted personalized medicine? Current Pharmacogenomics and Personalized Medicine 10: 16–21. DOI 10.2174/1875692111201010016. [Google Scholar] [CrossRef]
Zhang H, Tan J, Zhang M, Huang S, Chen X. (2020). Comparative transcriptomic analysis of two bottle gourd accessions differing in fruit size. Genes 11: 359. DOI 10.3390/genes11040359. [Google Scholar] [CrossRef]
Supplementary Materials
Supplementary Table 1. The annotation information for unigenes including the SSRs and SNPs containing Unigenes.
Supplementary Table 2. The transcriptome sequence based SSR and the primers details.
Supplementary Table 3. The gene ontology (GO) terms annotation summary for all annotated unigenes, and SSRs and SNPs containing unigenes.
Supplementary Table 4. List of the SSR primers used for validation on agarose gel.
Supplementary Table 5. The transcriptome sequence-based SNPs details.
Supplementary Table 6. Annotation of the top twenty unigenes with the highest SNP frequency in the Lagenaria siceraria genome.
 | This work is licensed under a Creative Commons Attribution 4.0 International License, which permits unrestricted use, distribution, and reproduction in any medium, provided the original work is properly cited. |