DOI:10.32604/biocell.2021.014349
www.techscience.com/journal/biocell
| Biocell DOI:10.32604/biocell.2021.014349 | www.techscience.com/journal/biocell |
| Article |
Formulating etoposide in a nanoemulsion containing polyunsaturated fatty acids potentiates its anti-proliferation and anti-invasion activities against the ovarian cancer cells
1Department of Biochemistry, Faculty of Science, King Abdulaziz University, Jeddah, Saudi Arabia
2Regenerative Medicine Unit, King Fahd Center for Medical Research, King Abdulaziz University, Jeddah, Saudi Arabia
*Address correspondence to: Mayson H. Alkhatib, mhalkhatib@kau.edu.sa
Received: 19 September 2020; Accepted: 21 December 2020
Abstract: Incorporation of etoposide (ETP) into nanoemulsion (NE) containing polyunsaturated fatty acids (PUFAs) may potentially augment its antiproliferation effect on the cancer cells. The current study aimed to examine the in vitro antitumor activity of a novel formulation (ETP-BC/EP-NE) produced by combining the anticancer drug (ETP) with NE (BC/EP-NE) consisting of the black currant seed and organic evening primrose oils. The produced formulas were physically characterized using zetasizer measurements. Their cytotoxic effect was testified at concentrations ranges from 0.0001 to 5 μM using CCK-8. Apoptotic and anti-invasion effects were evaluated using the assays of mitochondrial membrane potential, annexin V-FITC double staining, DNA fragmentation, and collagen-based cell invasion. According to the zetasizer characterization, the nano-suspensions of ETP-BC/EP-NE have z-average diameters of 87.63 ± 3.30 nm with an average surface zeta potential of −0.605 ± 0.003 mV. A reduction of 50% in the growth of SK-OV-3 cells was found at a distinctly lower concentration of ETP-BC/EP-NE (IC50 = 0.04 ± 0.2 μM) than that of ETP (IC50 = 4.75 ± 0.1 μM). Results indicated that ETP-BC/EP-NE had a greater apoptotic effect than ETP on SK-OV-3 cells, which was attributed to the larger amount of late apoptotic cells (41.9 ± 1.05%), higher loss of mitochondrial membrane potential, and more intensive fragmented DNA. The ETP-BC/EP-NE treatment suppressed the cellular invasion by 55%, whereas ETP impeded the cellular invasion by only 3%. Formulating ETP with PUFAs in NE had ameliorated the efficacy of ETP.
Keywords: Black currant seed oil; Organic evening primrose oil; Chemotherapeutic agent; Cellular growth; Apoptosis
Cancer incidence and mortality are growing rapidly worldwide. According to the Global Cancer Statistics of 2018, there will be 9.6 million deaths caused by cancer (Bray et al., 2018). Although 1.9% of the total deaths are caused by ovarian cancer, most of the patients (∼60%) with this kind of cancer are diagnosed at a late stage. Besides, the multidrug resistance (MDR) impedes the treatments in the second and third lines of chemotherapy, which could lead to increasing ovarian cancer recurrence (Patel et al., 2018).
Etoposide (ETP) is a chemotherapeutic drug that belongs to the podophyllotoxin family. It affects the cell cycle at the G2 phase (Jiang et al., 2016a). Additionally, it induces cell death by inhibiting the activity of topoisomerase II. ETP works by attaching to the topoisomerase II and DNA, which leads to the DNA double-strand breakage (Mehrabi et al., 2016). It is commonly used for the treatments of numerous cancer diseases such as lung, gastric, ovarian, testicular, and several other cancer diseases (Shin et al., 2016). Similar to many chemotherapeutics, the administration of ETP is combined with several difficulties, such as poor solubility, MDR, short biological half-life, and harmful side effects. Therefore, it is necessary to propose new deliveries for the chemotherapeutic agents that improve their selectivity at the target site (Wang et al., 2014; Mehrabi et al., 2016).
Among different nano-delivery systems, nanoemulsions are one of the most promising approaches that have been established to overcome the main hurdles linked with the standard drug delivery systems (Lovelyn and Attama, 2011; Patil et al., 2016). Nanoemulsions are heterogeneous dispersions of two immiscible liquids phase (oil and water) that are combined through the use of surfactants/cosurfactants (Jaiswal et al., 2015). Recently, different nanoemulsion formulations produced by solubilizing various essential oils exhibited potential anticancer activities in vitro and in vivo (Alkhatib et al., 2019; Alkhatib et al., 2020; AlMotwaa et al., 2020). The nanoemulsion based on the polyunsaturated fatty acid (PUFA) may potentially enhance the antineoplastic efficacy of the chemotherapeutic agents against malignant cells and may also lead to cell apoptosis (Ramasamy et al., 2017). Because of that, loading ETP in nanoemulsion based on mixing two oils containing PUFA may contribute to the reduction of ETP doses and the associated severe adverse side effects.
Black currant seed oil (BC) and organic evening primrose (EP) oil were purchased from Chateau Cosmetics Botanical Beauty (FL, USA). Etoposide (ETP) was acquired from Ebewe Pharma GmbH (Unterach, Austria). Formaldehyde, Tween 80, and span 20 were purchased from Sigma (MO, USA).
Fetal bovine serum (FBS) was obtained from Gibco™ Life Technologies (NY, USA).Trypsin-EDTA (0.25%), phosphate-buffered saline (PBS), penicillin-streptomycin, and Dulbecco’s modified eagle’s medium (DMEM) were acquired from UFC biotechnology, Inc., (Riyadh, KSA). 4’,6-diamidino-2-phenylindole (DAPI) dihydrochloride was procured from Invitrogen life technologies (NY, USA). Coomassie brilliant blue was acquired from Fisher Scientific (PA, USA). The ovarian cancer cell line (SK-OV-3) was obtained from the Tissue Culture Bank at King Fahd Center for Medical Research, King Abdulaziz University (Jeddah, KSA).
Annexin V-FITC Apoptosis Detection Kit (Cat. No. MBS668896) was acquired from MyBioSource, Inc. (San Diego, USA). Cell counting kit- 8 (CCK-8) (Lot. No. LE612) was purchased from Dojindo Molecular Technology, Inc. (Kumamoto, Japan). Cell Death Detection ELISA plus kit (Lot. No. 19315700) was procured from Roche (Mannheim, Germany). Mitochondria Staining Kit (Cat. No. CS0390) was obtained from Sigma-Aldrich (MO, USA). QCM™ collagen cell invasion assay (Cat. No. ECM551) was purchased from Merck KGaA (Darmstadt, Germany).
Preparation of BC/EP mixed oils nanoemulsion formulas
The drug-free, oil-in-water nanoemulsion (BC/EP-NE), was prepared by the high energy method. In brief, volume fractions of different components of 2% BC, 2% EP, 7% Tween 80, 3% Span 20, and 86% distilled water were blended at 25°C. After that, the mixture was sonicated with the Omni Sonic Ruptor 4000 Ultrasonic Homogenizer (NY, USA). The ultrasonic power supply transforms the voltage to high-frequency (20 kHz) electrical energy. The probe, in turn, received the produced electrical energy and converted to mechanical energy to be directed to the titanium tip, which has a 4.0 mm diameter. The tip was immersed in the solution and used to radiate the energy into the emulsion. This emulsion was sonicated for 20 min until it became clear and transparent. It should be mentioned that the drug-loaded formulations (ETP-BC/EP-NE) were prepared by directly solubilizing 0.29 μL of 20 mg/mL ETP in 99.7 μL BC/EP-NE.
Physical characterization of the prepared nanoemulsion formulations
Absorption spectra for droplet size distributions of BC/EP-NE and ETP-BC/EP-NE were plot at a wavelength ranging from 200 to 600 nm using GENESYS 10S UV-Vis spectrophotometer (Thermo Scientific™, USA). The particle sizes and zeta potentials of the dispersed nanodroplets for BC/EP-NE and ETP-BC/EP-NE were measured using the Zetasizer (Malvern Instruments Ltd., UK) at 25°C.
The release profiles of free-ETP and ETP-BC/EP-NE were determined by the dialysis procedure. In brief, 1.0 mL of the tested formula was transferred into the dialysis bag (Cut-off 3.5 Da, Spectra Lab., CA, USA). Then, the bag was submerged into phosphate buffer (200 mL, pH 7.4) and stirred at 100 rpm. Approximately 1.0 mL of the buffer was taken at a determined interval (1, 2, 3, 4, 5, 6, and 24 h) and replaced by another 1.0 mL of fresh buffer. The absorbance of the removed buffer at a specific time (A1) and wavelength of 300 nm was determined using the GENESYS 10S UV-Vis spectrophotometer (Thermo Scientific™, USA). The percentage release of the tested formula at each time was measured by dividing the absorbance of the removed solution (A1) by A0, which is the absorbance of the initial drug sample added to the dialysis bag, and then multiplying by 100.
The SK-OV-3 cells (2 × 10⁶), generously supplied by the Cell Regenerative Unit (Jeddah, KSA), were plated in a culture flask (25 cm2) containing 5 mL of medium, supplemented with 10% FBS, 1% penicillin/streptomycin, and incubated at the culture conditions, which were 5% CO2 humidified atmosphere and 37°C. For subculture, every 48 h, cell media (DMEM) was discarded, and cells were rinsed with PBS, followed by detachment from flasks by adding 1.0 mL of 0.25% trypsin. The cells were nourished with DMEM until 90% confluence was obtained.
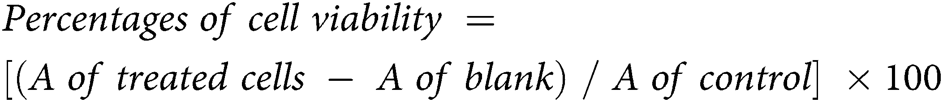
The CCK-8 assay was used for the determination of the antiproliferation and cytotoxicity by measuring the number of viable cells subjected to the tested formulation. The 1 × 10⁴ of SK-OV-3 cells were cultured in 100 μL of a medium in each well of 96 well-plates and incubated at 37°C for 24 h in a CO2 humidified atmosphere incubator. Then, cells were treated with 200 μL of ETP, BC/EP-NE and ETP-BC/EP-NE at different micromolar concentrations (5, 3, 1, 0.1, 0.01, 0.005, and 0.0001), which were serially diluted with DMEM and incubated for 24 h at the same culture conditions. To measure the cell viability, 5 μL of CCK-8 reagent was added in the dark into each well, mixed gently, and incubated for 3 h at culture conditions. After that, the absorbance (A) of treated cells, media containing cells (control), and media (blank), was measured at λ = 450 nm in a BioTek Microplate Reader (VT, USA). The calculations were implemented as follows:
Annexin V-FITC/PI for apoptosis detection
In a six well-plate, cells (3 × 10⁵/well) were cultured in each well containing 2 mL of growth media and incubated for 24 h at 37°C. Then, 2 mL of IC50 for the tested formula was added to each well and incubated at culture conditions. Following 24 h incubation, cells were harvested, rinsed two times with pre-cold PBS, spun down (300 g), re-suspended in 100 μL of 1X binding buffer, and transferred to a flow cytometry tube. Then, 5 μL of each Fluorescein isothiocyanate (FITC) and propidium iodide (PI) supplemented to the cell suspension, incubated at 25°C in the dark (20 min), and then completed with 400 μL of binding buffer. Finally, cells were evaluated within one hour using a flow cytometer (FACS AriaTM III, BD Biosciences, CA, USA).
Visualization of the cell morphology
Cells were seeded at 1 × 10⁴ per well into a 96-well plate at which each well contained 100 μL of the growth medium, followed by incubation at 37°C for 24 h. Then, 200 μL of treatments, ETP, BC/EP-NE, and ETP-BC/EP-NE were added to each well and incubated at culture conditions. After removing the media, cells were rinsed with PBS (100 μL), fixed with formaldehyde (200 μL, 4%), and stained by the addition of 100 μL of 5% Coomassie blue dye for 10 min. Finally, cells were cleaned several times with tap water, followed by drying overnight at 25°C. The morphological changes of treated SK-OV-3 cells were detected using a phase-contrast inverted microscope (Olympus, Japan).
Apoptosis detection using DAPI stain
DAPI is a blue-fluorescent DNA stain that fluoresces brightly once binding to A-T regions of dsDNA. Cells (5 × 10⁴/well) were cultured in 500 μL of DMEM in 24 well-plates and incubated for 24 h, at 37°C. Then, 500 μL of the IC50 of ETP, BC/EP-NE, and ETP-BC/EP-NE were added and incubated at cultured conditions. Following incubation, cells were rinsed with PBS (300 μL), fixed via 4% formaldehyde (200 μL), stained for 2 min with DAPI stain (300 μL, 300 nM) and visualized using a fluorescent microscope at 437 μm (Leica CRT6000, Germany).
Mitochondrial membrane potential measurement (ΔΨm)
JC-1 is a cytofluorimetric, lipophilic, cationic dye used to evaluate SK-OV-3 cells’ mitochondrial membrane potential. Briefly, cells (1 × 10⁴/well) were cultured into 100 μL of DMEM in 96 well-plates and incubated for 24 h at 37°C. Then, 200 μL of IC50 of ETP, BC/EP-NE, and ETP-BC/EP-NE were added to each well and incubated at culture conditions. Following incubation, SK-OV-3 cells were stained by JC-1 solution (JC-1 stain, JC-1buffer solution, and DMEM media) and incubated at 37°C for 30 min. Finally, the fluorescence was examined at excitation (Ex): 525 nm/emission (Em): 590 for red fluorescence and at Ex: 490 nm/Em: 530 for green fluorescence using a fluorescence microplate reader (Synergy™ HTX, BioTek, USA).
Cell death assay for the detection of DNA fragmentation
Apoptotic DNA fragmentation (mono- and oligonucleosomes) was analyzed by utilizing a cell death detection ELISA kit, which was carried out as stated by the manufacturer’s instructions. Briefly, SK-OV-3 cells (1 × 10⁴/well) were cultivated into 96 well-plates at which each well contained 100 μL of growth medium followed by incubation at 37°C for 24 h. Following incubation, 200 μL of IC50 of ETP, BC/EP-NE, and ETP-BC/EP-NE were added and incubated for 24 h. After that, the 96 well-plate was centrifuged (200 × g), and the cells were re-suspended in lysis solution (200 μL/well). The 20 μL of lysates were relocated into the streptavidin-coated microplate, followed by the addition of 80 μL of an immunoreagent. After that, the microplate was covered and incubated at 300 rpm on a shaker for 2 h. Then, 100 μL of ABTS stain was added to each well and incubated on a plate shaker at 250 rpm for 10 min. After that, the ABTS stop solution (100 μL) was added, and the optical densities (A) were determined at 405 nm. The specific enrichment of mono- and oligo nucleosomes (Enrichment factor) was considered according to the subsequent equation:

The invasion of SK-OV-3 cells was evaluated by using a Chemicon QCM™ 24-well collagen-based invasion assay kit. Briefly, SK-OV-3 cells at (3 × 10⁵/well) were cultured in 2 mL of DMEM into 6 well-plates and incubated at culture conditions. Then, SK-OV-3 cells were treated with 2 mL of formulation and incubated for 24 h. After that, 300 µL of media without FBS was supplemented to each insert and incubated at 25°C for 30 min to rehydrate the collagen layer. After that, 250 µL of media were extracted, and 250 µL of cell suspension was added into each insert suspended in 500 µL of the media with 10% FBS in the lower chamber. Then, the plate was covered and incubated for 24 h in a CO2 incubator. After that, all non-invaded cells were detached, and the insert was placed in 400 µL of cell stain for 20 min at 25°C. After that, the insert was rinsed, gently cleaned with a cotton-tipped swab, transferred into 200 µL of extraction buffer, and left for 15 min at 25°C. Finally, 100 µL of the extracted buffer was shifted to a 96-well culture plate for colorimetric measurement at 560 nm. The invasion ability of the cells was measured according to the following equation:

Statistical analyses between results were evaluated by one-way ANOVA. The significant differences between the two variables were assessed by pairwise t-tests. The variations between the samples were considered and ranked into significant (*p < 0.05), highly significant (**p < 0.01) and very highly significant (***p < 0.001). All the results were expressed as mean ± SD and done in triplicate. All statistical analyses were carried out using MegaStat Excel Software (version 10.3, Butler University, Indianapolis).
Physical characterization of the prepared NE
The influence of droplet size distributions on the absorption spectrum was displayed in Fig. 1. According to Fig. 1a, the maximum absorption for both tested formulas, BC/EP-NE and ETP-BC/EP-NE, was detected at 300 nm (λmax). However, the absorptions of ETP-BC/EP-NE were greater than BC/EP-NE absorptions at each determined λ. Apparently, the shapes of the peaks for tested formulas, BC/EP-NE and ETP-BC/EP-NE, were lower and broader. The kurtosis of the measured absorptions for BC/EP-NE and ETP-BC/EP-NE were 2.7 and 1.6, respectively, which indicate the platykurtic distribution of the absorptions for both tested formulas around λmax.
The droplet sizes and surface charges were measured by the zetasizer. As illustrated in Figs. 1b and 1c, the z-average diameters of BC/EP-NE have been significantly increased when loaded with ETP (p < 0.001). The minimal percentages of the variation coefficients among the nanodroplet sizes for BC/EP-NE and ETP-BC/EP-NE, which were 4.88 and 3.76, respectively, indicated the homogeneous size distribution for both formulas. Regarding the zeta potentials, Figs. 1d and 1e exhibited similar negative charges for both tested formulas with considerable differences in the charge magnitudes (p < 0.001).
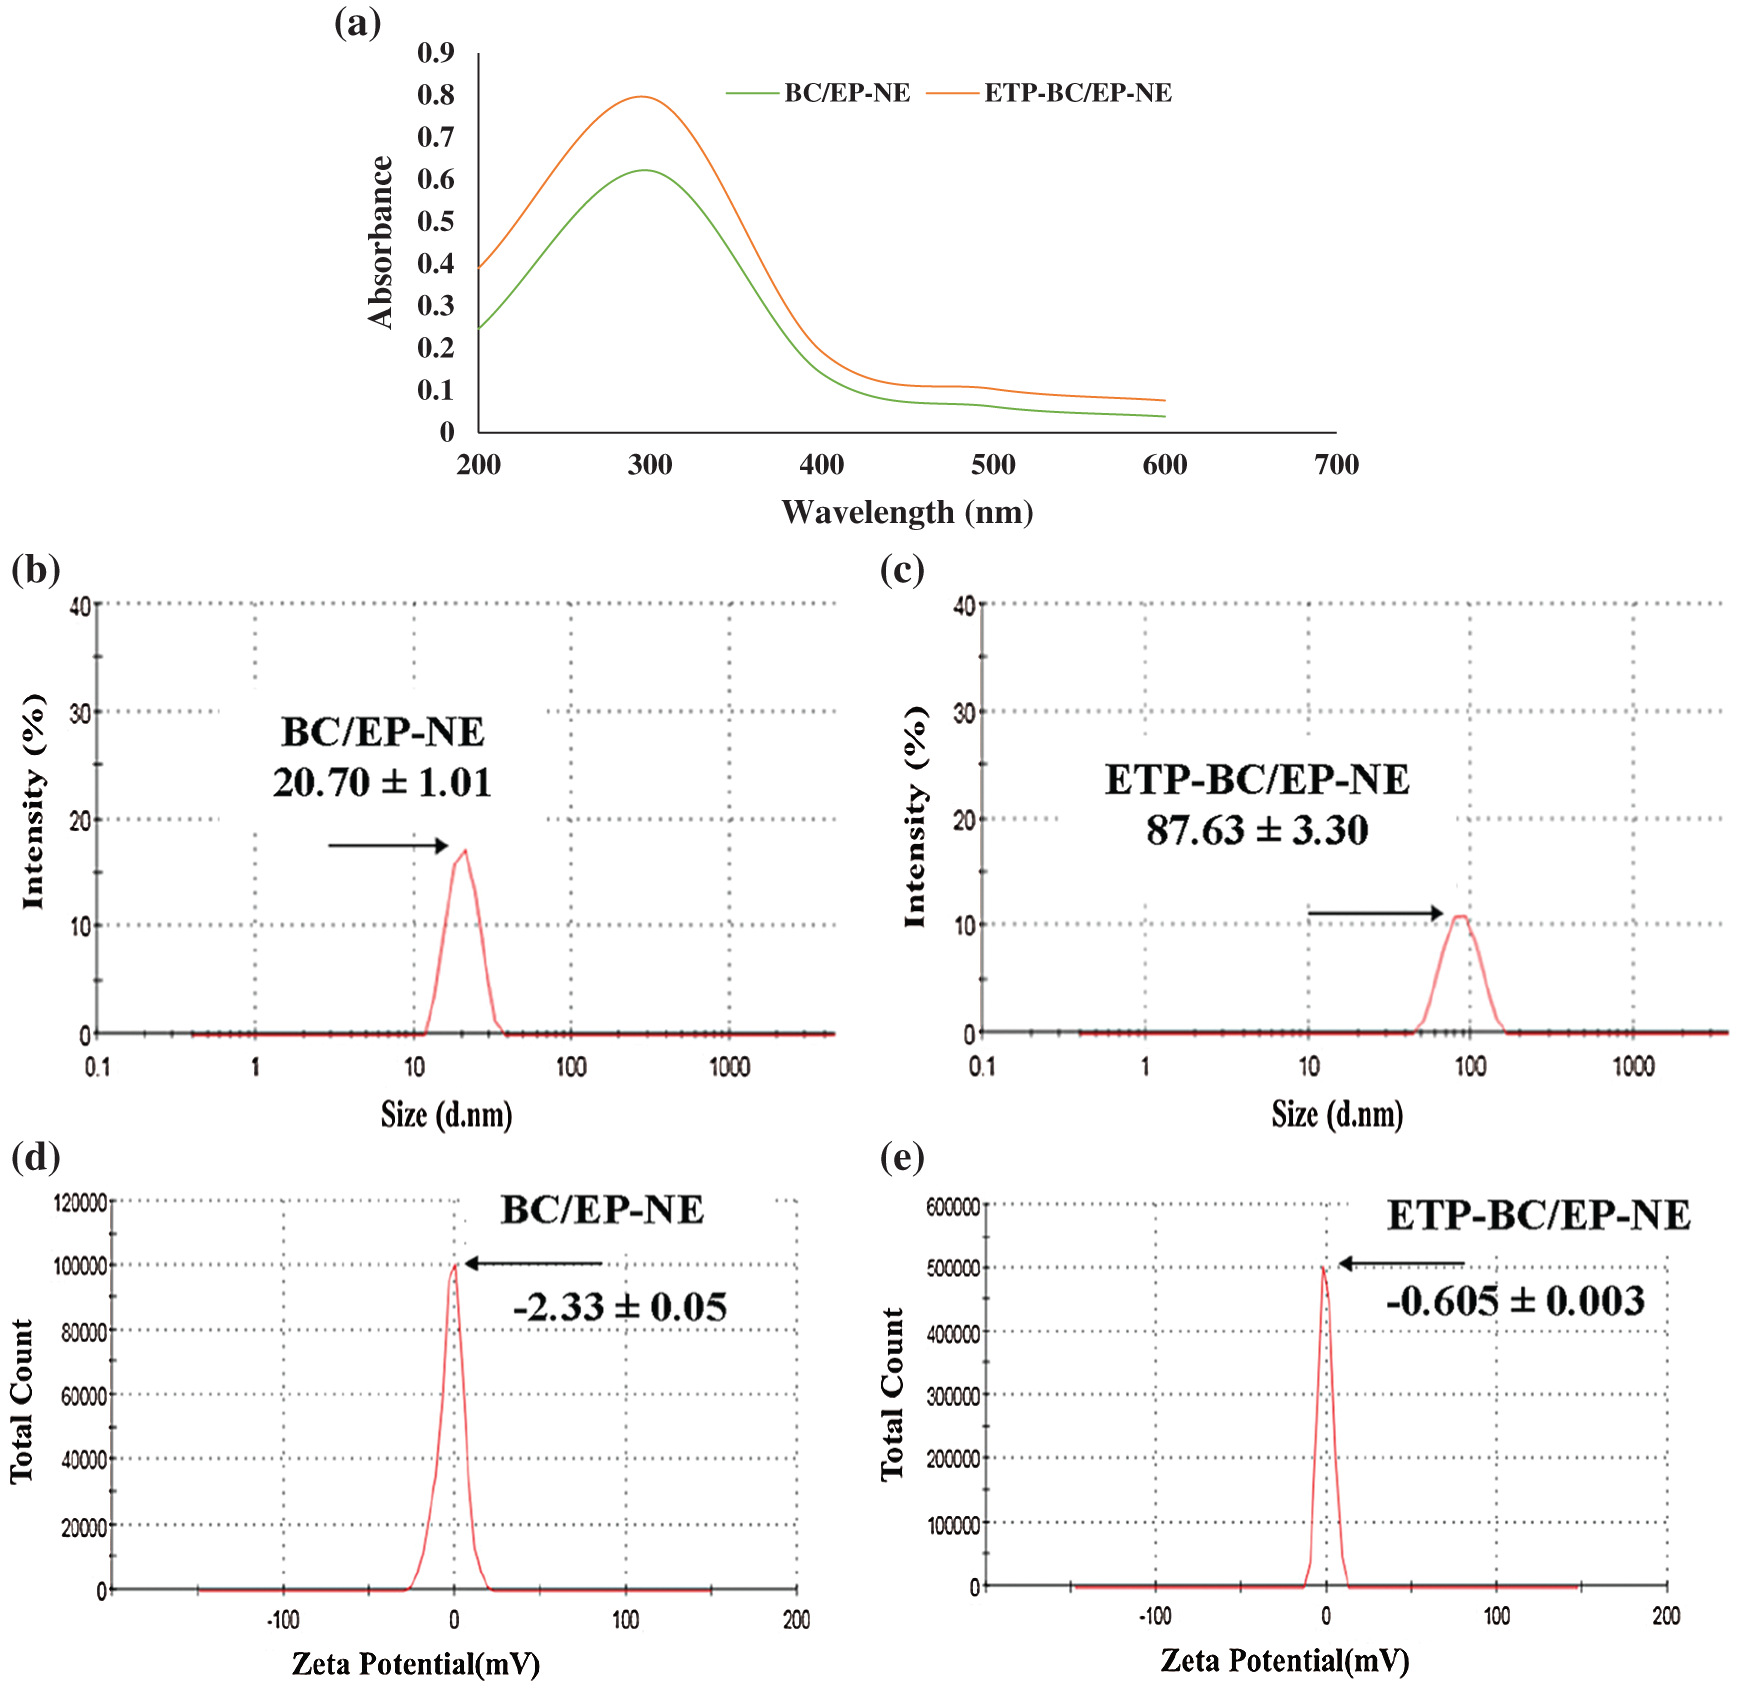
Figure 1: (a) Absorption spectra for droplet size distributions of BC/EP-NE and ETP-BC/EP-NE at various wavelengths using UV-Vis spectrophotometer. (b, c) Droplet size distributions of BC/EP-NE and ETP-BC/EP-NE, respectively. (d, e) Zeta potential spectra of BC/EP-NE and ETP-BC/EP-NE, respectively. Graphs and Measurements of (b–e) were implemented using Zetasizer.
The release of ETP-BC/EP-NE and ETP in phosphate buffer (0.5 mM, pH 7) was determined at different periods of time as shown in Fig. 2. The release of ETP-BC/EP-NE was faster than the ETP solution. In the first hour, the release of ETP-BC/EP-NE was increased to 86.6%. In contrast, 25% of the ETP solution was released within 2 h. After 24 h, approximately most of the ETP-BC/EP-NE (96%) was released, whereas 50% of ETP solution was released.
CCK-8 assay for cell proliferation
The anti-proliferation activities of the tested treatments against the cancer cellular growth were determined, as shown in Fig. 3. SK-OV-3 cells were treated with ETP, BC/EP-NE and ETP-BC/EP-NE at different concentrations (5, 3, 1, 0.1, 0.01, 0.005, 0.0001 µM). When the concentration increased, the graph showed a gradual decrease in the % cellular growth of all tested formulas. In particular, the growth of the cells treated with ETP-BC/EP-NE and BC/EP-NE was markedly less than that of ETP treated cells at all selected concentrations. The half-maximal inhibitory concentrations (IC50) of ETP-BC/EP-NE (0.04 ± 0.2 μM) and BC/EP-NE (0.0036 ± 0.2 μM) were significantly less than that of ETP (4.75 ± 0.1 μM) (p < 0.001).
Annexin V-FITC/PI apoptosis assay
Cells treated with various formulations were discriminated according to their stages of apoptosis, as shown in Fig. 4. Interestingly, the maximum amount of late apoptotic cells with the least amount of viable cells were detected in the cells treated with ETP-BC/EP-NE. In contrast, the maximum amount of early apoptotic cells was notified in cells treated with ETP. The amounts of necrotic cells were similar in all the treated cells.
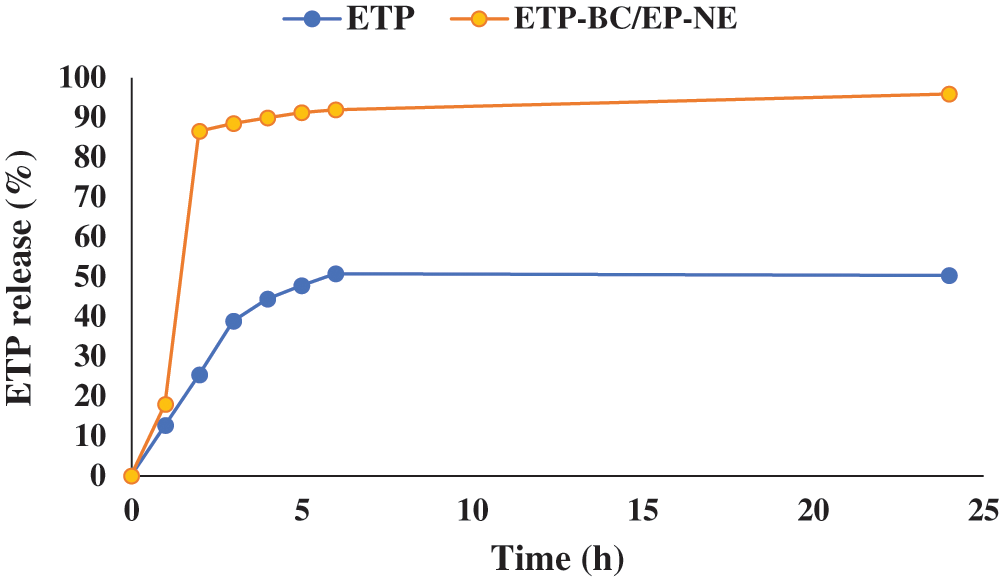
Figure 2: The in vitro release profile of ETP and ETP-BC/EP-NE dissolved in phosphate buffer (0.5 mM, pH 7).
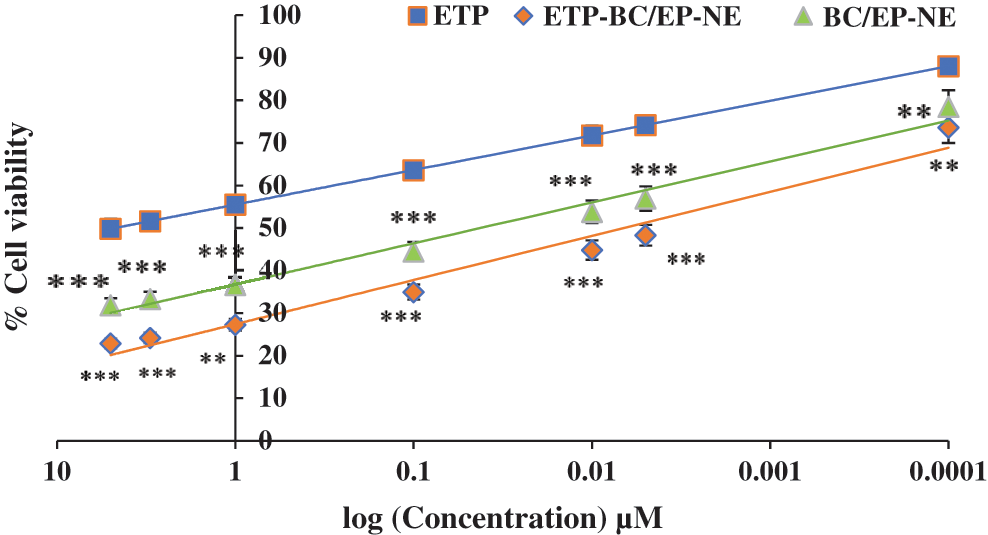
Figure 3: Percentages of SK-OV-3 cellular growth, measured by CCK-8 assay kit, in response to various concentrations of ETP, BC/EP-NE, and ETP-BC/EP-NE during 24 h incubation. Data were expressed as mean ± SD. Error bars represent the ± SD. Asterisks (**, ***) referred to highly (p < 0.01) and very highly (p < 0.001) significant differences between ETP and the NE formulas, evaluated by the one-factor ANOVA.
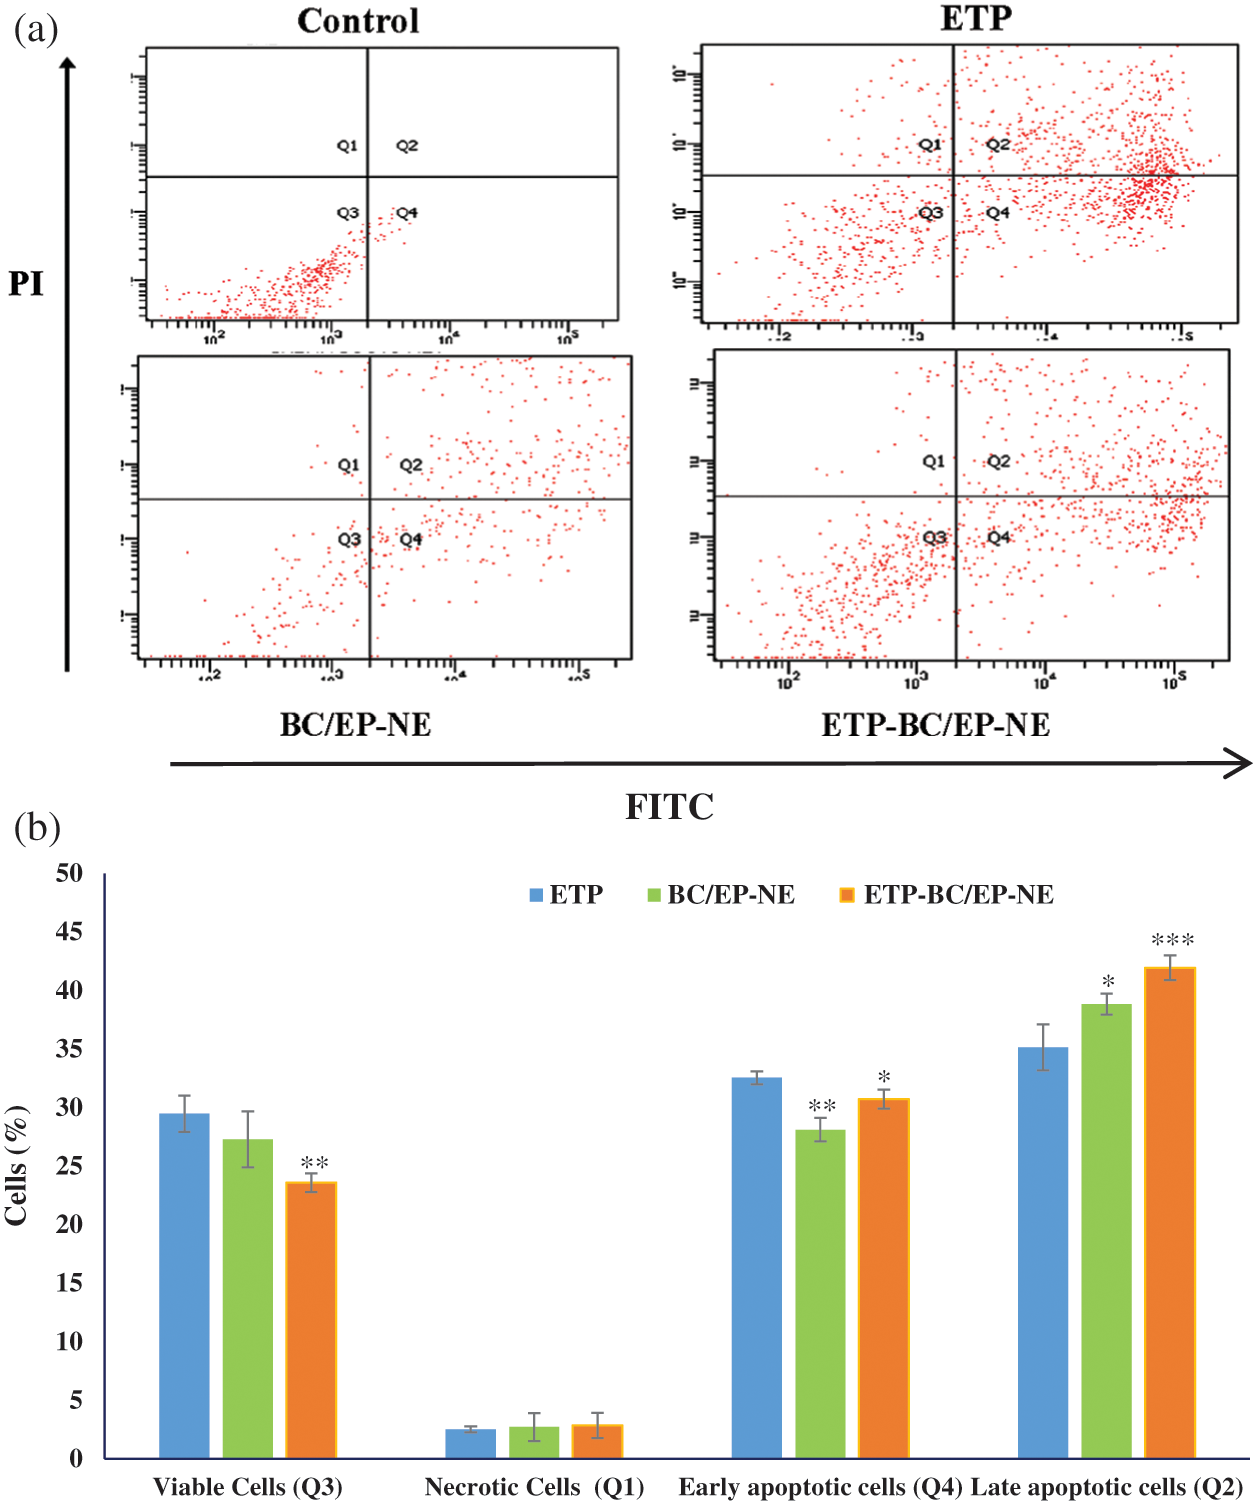
Figure 4: (a) FITC/PI flow cytometry plots, divided into four quarters according to the type of stained cells, for SK-OV-3 cells treated with the tested formulas at their IC50 for 24 h. Cells were classified as viable (Q3), necrotic (Q1), early apoptotic (Q4) and late apoptotic cells (Q2). (b) Histogram showing the % of different types of cells subjected to the tested formulas. Error bars represent the standard deviation. The (*, **) referred to significant (p < 0.05) and highly (p < 0.01) significant differences between ETP and the NE formulas, respectively, evaluated by the one-factor ANOVA.
The effect of the tested treatments on the DNA fragmentation was displayed in Fig. 5. The largest fragmented DNA ratio in SK-OV-3 cells cytoplasm was evidently detected when cells were treated with ETP-BC/EP-NE, while the smallest ratio was found in the ETP treated cells (Fig. 5a). Likewise, the chromatid condensations were extensively visualized in the light and fluorescence microscopy images of the cells treated with ETP-BC/EP-NE (Figs. 5b and 5c).
Mitochondrial membrane potential
The mitochondrial membrane potential of treated SK-OV-3 cells was displayed in Fig. 6. Compared to the control, SK-OV-3 cells treated with ETP-BC/EP-NE exhibited noticeably higher green fluorescence intensity and lower red fluorescence intensity compared to the other treatments, BC/EP-NE and ETP (p < 0.001). Additionally, ETP-BC/EP-NE treatment (8.8 ± 0.02) displayed a considerably lower red/green fluorescence ratio relative to ETP (10.3 ± 0.04) and BC/EP-NE (9.5 ± 0.03) (p < 0.001).
The percentages of invading SK-OV-3 cells when subjected to the IC50 of ETP, BC/EP-NE, and ETP-BC/EP-NE were clarified in Fig. 7. Relative to the untreated cells (control), ETP-BC/EP-NE treatment suppressed the invasion of the cells by 55%, while ETP treatment reduced the invasion of the cells by only 3%. It should be mentioned that BC/EP-NE diminished the cell invasion by 30%.
The particle sizes of the drug nanocarriers, which are smaller than 200 nm, play a major role in the cellular penetration and uptake by the cancer cells (Singh et al., 2015; Teja and Damodharan, 2018). In the current study, the greater absorptions of ETP-BC/EP-NE than BC/EP-NE at each determined λ could be an indication that ETP-BC/EP-NE has a larger droplet size than BC/EP-NE. It is notable to point that there is a direct association between absorbance and droplet size distribution. A previous study by Goh et al. (2014) demonstrated that the absorbance was directly proportional to the size of the nanoparticles studied in the range of 15–40 nm. The increased diameters of ETP-BC/EP-NE than BC/EP-NE were confirmed with the zetasizer measurements. This increase might imply that the ETP was conjugated inside the BC/EP-NE formulas. In agreement with our findings, a previous study by Alkhatib et al. (2018) showed that the droplet size of garlic-NE increased when loaded with mitomycin C. The sizes of the nanodroplets of BC/EP-NE and ETP-BC/EP-NE were homogeneously distributed with average diameters smaller than 100 nm. Also, the quick release of ETP-BC/EP-NE than the ETP solution at the initial hours (~2 h) could be due to the smaller size and negative charge of ETP-BC/EP-NE. It has been recently reported that the nanoemulsion with smaller particle sizes has a greater surface area that leads to better cellular absorption (Halnor et al., 2018).
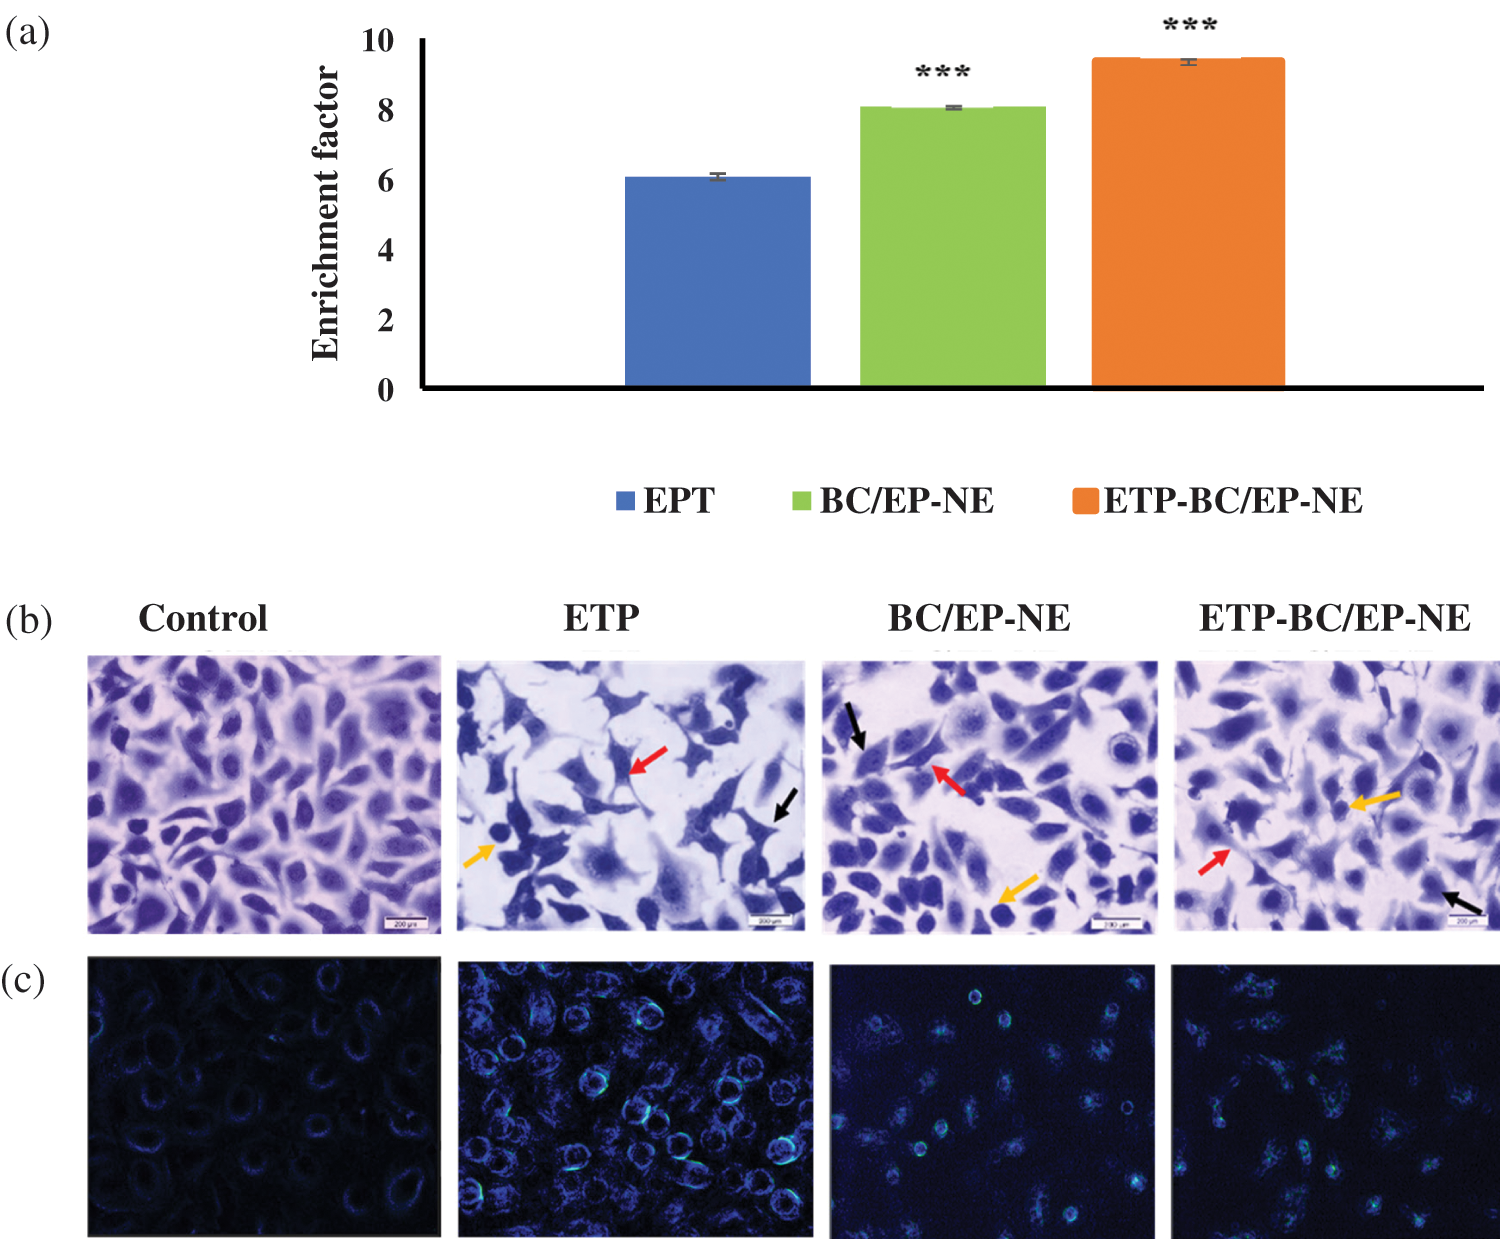
Figure 5: (a) The ratio of nucleosomes in the cytoplasm of SK-OV-3 cells, measured by cell death detection ELISA plus assay, when treated with various formulations for 24 h. Error bars represent ± SD. The (***) referred to the very highly significant differences (p < 0.001) between ETP and the NE formulas, evaluated by the one-factor ANOVA. (b) Light and (c) Fluorescence microscopy images for SK-OV-3 cells treated for 24 h with IC50 of ETP, BC/EP-NE and ETP-BC/EP-NE (magnification 40X). Red, yellow, and green arrows represent membrane blebbing, apoptotic bodies and condensed chromatids, respectively.
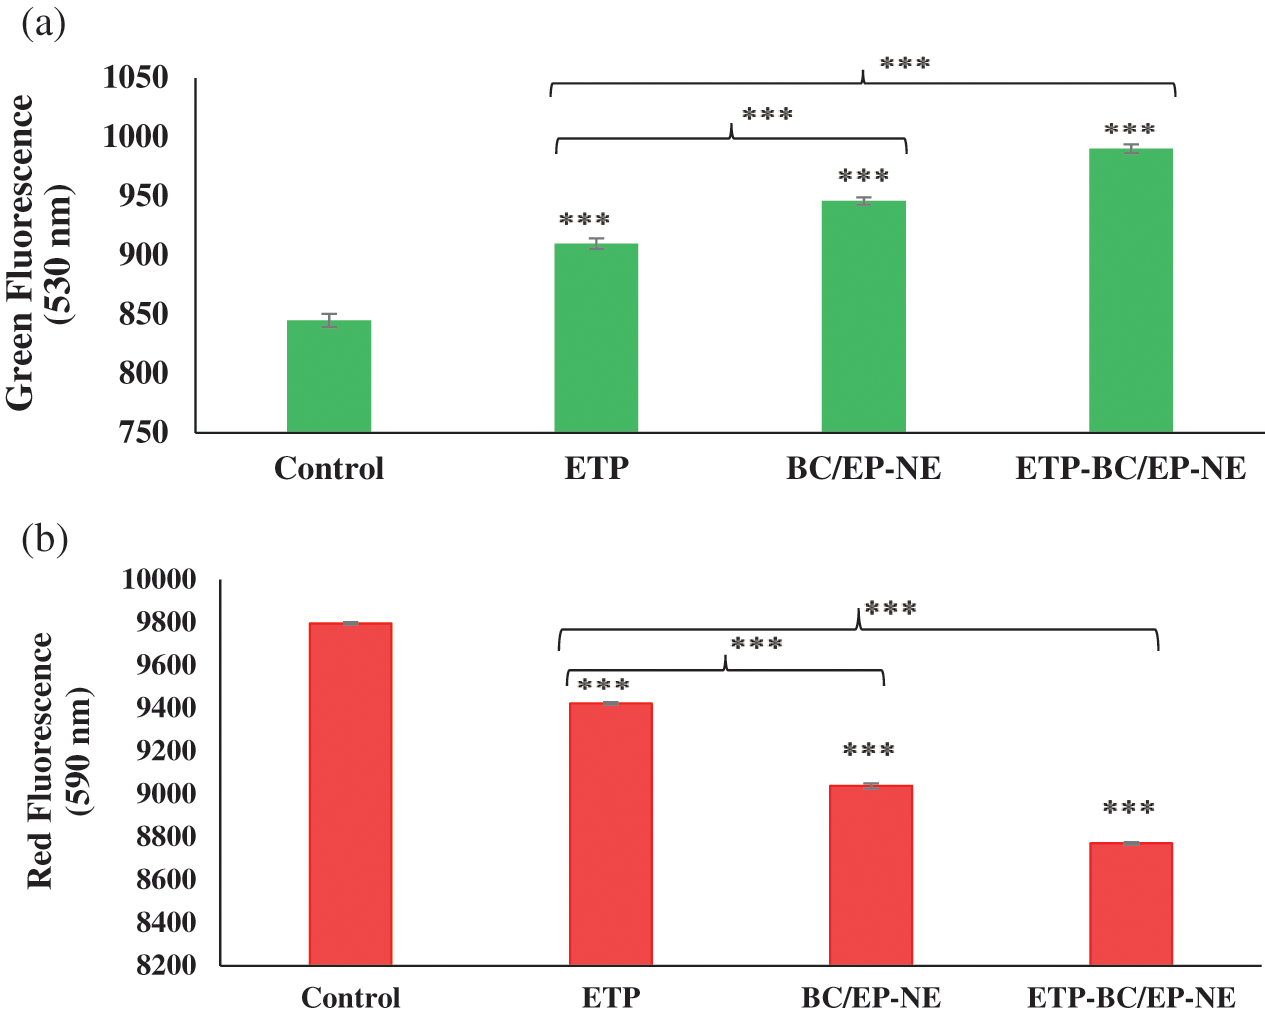
Figure 6: Mitochondrial membrane potential assay using JC-1 stain for SK-OV-3 cells treated with the IC50 of the tested formulas. (a, b) represent the green and red fluorescence intensity of the treated cells, respectively. Error bars represent the ± SD. (***) refers to very highly significant differences between the tested formulas (p < 0.001), evaluated by the one-factor ANOVA.
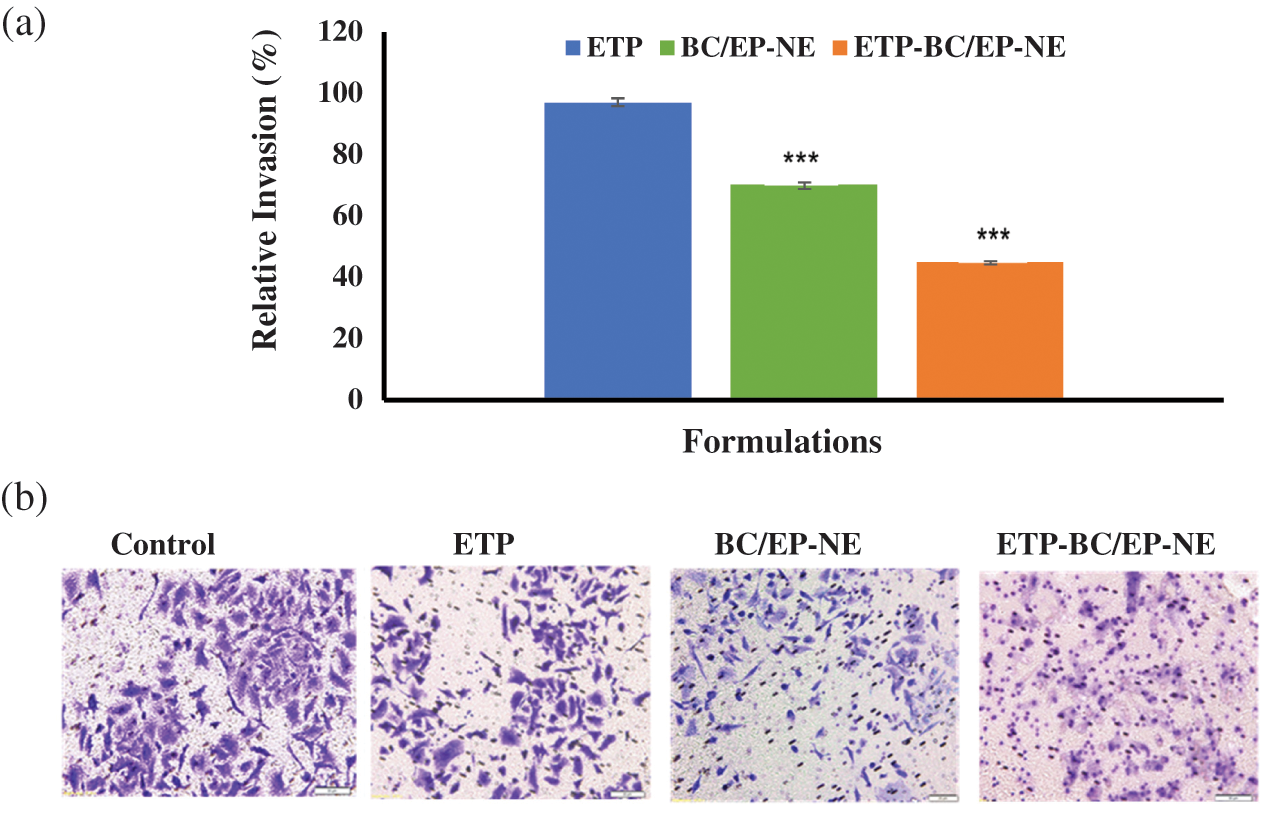
Figure 7: (a) Percentages of the invading SK-OV-3 cells following 24-h treatment with ETP, BC/EP-NE, and ETP-BC/EP-NE, measured by the collagen-based cell invasion assay. Error bars represent ± SD. (***) referred to very highly significant differences between ETP and the NE formulas (p < 0.001), evaluated by the one-factor ANOVA. (b) Light microscopy images of the invading cells (20X magnifications).
In the present study, all the ETP, BC/EP-NE, and ETP-BC/EP-NE displayed a dose-dependent antiproliferation effect on the SK-OV-3 ovarian cancer cells. In agreement with our results, Wang et al. (2015) showed that the etoposide, paclitaxel, and etoposide-paclitaxel loaded poly lactic-co-glycolic acid nanoparticles showed a time and dose-dependent cytotoxicity in MG63 cells.
In fact, the ETP-BC/EP-NE showed a notable reduction in the % of cellular growth, which could be ascribed to the potent anticancer effect of PUFAs and the chemotherapeutic effect of the ETP. It has been found that the essential oils, black currant seed, and organic evening primrose oils with a high content of gamma-linolenic acid (GLA) were potential in supporting the anti-cancer therapy (Timoszuk et al., 2018). The IC50 of ETP-BC/EP-NE was considerably lower than ETP, which can be attributed to the small particle size and the quick release of ETP-BC/EP-NE at the target site that facilitates its cellular uptake. A previously published study by Jiang et al. (2016b) showed that the IC50 value of etoposide-loaded lipid nanocarriers was less than the ETP solution by nine-fold, which leads to higher inhibition rates of etoposide-loaded nanocarriers over than ETP.
The apoptosis of SK-OV-3 cells was evaluated by mitochondrial membrane potential, Annexin V-FITC, DNA fragmentation, light, and fluorescence microscopy. The changes in the mitochondrial membrane potential (Δψm) can be optically measured by the red/green fluorescence intensity ratio occurring during the process of apoptosis (Mitra et al., 2011). Our findings displayed that the ratio of red to green fluorescence intensity of the cells treated with ETP-BC/EP-NE was lower than that of ETP and BC/EP-NE treated cells. Consequently, the mitochondrial membrane potentials (ΔΨm) of SK-OV-3 cells were declined when cells were treated with ETP-BC/EP-NE. Moreover, the annexin V-FITC staining technique revealed that the late apoptotic cells increased when SK-OV-3 cells were treated with ETP-BC/EP-NE. Additionally, Coomassie and DAPI stained images of the ETP-BC/EP-NE treated cells exhibited intense fragmented DNA and condensed chromatin when compared with other tested treatments. The bioactive compounds of black currant oils have potential health-promoting properties. It has been found that black currant extract induces apoptosis of human gastric cancer cells (MKN-45) and epithelial cell lines (TE-1) cells through mitochondrial pathways (Liu and Li, 2016).
Regarding the invasion assessment of the treated cells, the percentages of the invaded SK-OV-3 cells were lower when cells were treated with ETP-BC/EP-NE. This could be due to the potential effect of GLA included in the nanoemulsion. The previous study of Cao et al. (2016) emphasized that the GLA can inhibit inflammatory responses, metastasis, and tumor growth.
Formulating ETP in a nanoemulsion based on mixing two oils rich in polyunsaturated fatty acid, black currant seed oil (BC) and organic evening primrose (EP) oils, had immensely inhibited the growth of SK-OV-3 ovarian cancer cells by stimulating apoptosis and impeding the cellular invasions ability. This novel formulation, ETP-BC/EP-NE, has a potent therapeutic effect on the ovarian cancer cells that need to be confirmed in animal models.
Acknowledgement: This project was funded by the Deanship of Scientific Research (DSR), King Abdulaziz University, Jeddah, under Grant No. DF-606-247-1441. The authors, therefore, acknowledge DSR’s technical and financial support.
Availability of Data and Materials: The data used to generate the figures are available from the corresponding author on reasonable request.
Author Contribution: The authors confirm contribution to the paper as follows: study conception and design: MHA and SMA; data collection: SMA; analysis and interpretation of results: MHA and SMA; draft manuscript preparation: MHA, SMA and HMG. All authors reviewed the results and approved the final version of the manuscript.
Funding Statement: This work was supported by the Deanship of Scientific Research (DSR), King Abdulaziz University, Jeddah, under Grant No. DF-606-247-1441.
Conflicts of Interest: The authors declare that they have no conflicts of interest to report regarding the present study.
Alkhatib MH, Al-Otaibi WA, Wali AN. (2018). Antineoplastic activity of mitomycin C formulated in nanoemulsions-based essential oils on HeLa cervical cancer cells. Chemico-Biological Interactions 291: 72–80. DOI 10.1016/j.cbi.2018.06.009. [Google Scholar] [CrossRef]
Alkhatib MH, Alyamani SA, Abdu A. (2020). Incorporation of methotrexate into coconut oil nanoemulsion potentiates its antiproliferation activity and attenuates its oxidative stress. Drug Delivery 27: 422–430. DOI 10.1080/10717544.2020.1736209. [Google Scholar] [CrossRef]
Alkhatib MH, AlMotwaa SM, Alkreathy HM. (2019). Incorporation of ifosfamide into various essential oils -based nanoemulsions ameliorates its apoptotic effect in the cancers cells. Scientific Reports 9: 695–705. DOI 10.1038/s41598-018-37048-x. [Google Scholar] [CrossRef]
AlMotwaa SM, Alkhatib MH, Alkreathy HM. (2020). Incorporating ifosfamide into salvia oil-based nanoemulsion diminishes its nephrotoxicity in mice inoculated with tumor. Bioimpacts 10: 9–16. DOI 10.15171/bi.2020.02. [Google Scholar] [CrossRef]
Bray F, Ferlay J, Soerjomataram I, Siegel RL, Torre LA, Jemal A. (2018). Global cancer statistics 2018: GLOBOCAN estimates of incidence and mortality worldwide for 36 cancers in 185 countries. CA: A Cancer Journal for Clinicians 68: 394–424. DOI 10.3322/caac.21492. [Google Scholar] [CrossRef]
Cao D, Luo J, Zang W, Chen D, Xu H, Shi H, Jing X. (2016). Gamma-linolenic acid suppresses NF-κβ signaling via CD36 in the lipopolysaccharide-induced inflammatory response in primary goat mammary gland epithelial cells. Inflammation 39: 1225–1237. [Google Scholar]
Goh EG, Xu X, McCormick PG. (2014). Effect of particle size on the UV absorbance of zinc oxide nanoparticles. Scripta Materialia 78–79: 49–52. DOI 10.1016/j.scriptamat.2014.01.033. [Google Scholar] [CrossRef]
Halnor VV, Pande VV, Borawake DD, Nagare H. (2018). Nanoemulsion: A novel platform for drug delivery system. Journal of Materials Science and Nanotechnology 6: 104–124. [Google Scholar]
Jaiswal M, Dudhe R, Sharma PK. (2015). Nanoemulsion: An advanced mode of drug delivery system. 3 Biotech 5: 123–127. DOI 10.1007/s13205-014-0214-0. [Google Scholar] [CrossRef]
Jiang H, Pei L, Liu N, Li J, Li Z, Zhang S (2016a). Etoposide-loaded nanostructured lipid carriers for gastric cancer therapy. Drug Delivery 23: 1379–1382. DOI 10.3109/10717544.2015.1048491. [Google Scholar] [CrossRef]
Jiang H, Geng D, Liu H, Li Z, Cao J (2016b). Co-delivery of etoposide and curcumin by lipid nanoparticulate drug delivery system for the treatment of gastric tumors. Drug Delivery 23: 3665–3673. DOI 10.1080/10717544.2016.1217954. [Google Scholar] [CrossRef]
Liu B, Li Z. (2016). Black currant (Ribes nigrum L.) extract induces apoptosis of MKN-45 and TE-1 cells through MAPK-and PI3K/Akt-mediated mitochondrial pathway. Journal of Medicinal Food 19: 365–373. DOI 10.1089/jmf.2015.3521. [Google Scholar] [CrossRef]
Lovelyn C, Attama AA. (2011). Current state of nanoemulsions in drug delivery. Journal of Biomaterials and Nanobiotechnology 2: 626–639. DOI 10.4236/jbnb.2011.225075. [Google Scholar] [CrossRef]
Mehrabi M, Esmaeilpour P, Akbarzadeh A, Saffari Z, Farahnak M, Farhangi A, Chiani M. (2016). Efficacy of pegylated liposomal etoposide nanoparticles on breast cancer cell lines. Turkish Journal of Medical Sciences 46: 567–571. DOI 10.3906/sag-1412-67. [Google Scholar] [CrossRef]
Mitra M, Dilnawaz F, Misra R, Harilal A, Verma RS, Sahoo SK, Krishnakumar S. (2011). Toxicogenomics of nanoparticulate delivery of etoposide: Potential impact on nanotechnology in retinoblastoma therapy. Cancer Nanotechnology 2: 21–36. DOI 10.1007/s12645-010-0010-4. [Google Scholar] [CrossRef]
Patel NR, Piroyan A, Ganta S, Morse AB, Candiloro KM, Solon AL, Nack AH, Galati CA, Bora C, Maglaty MA, O'Brien SW, Litwin S, Davis B, Connolly DC, Coleman TP. (2018). In vitro and in vivo evaluation of a novel folate-targeted theranostic nanoemulsion of docetaxel for imaging and improved anticancer activity against ovarian cancers. Cancer Biology & Therapy 19: 554–564. DOI 10.1080/15384047.2017.1395118. [Google Scholar] [CrossRef]
Patil Y, Amitay Y, Ohana P, Shmeeda H, Gabizon A. (2016). Targeting of pegylated liposomal mitomycin-C prodrug to the folate receptor of cancer cells: Intracellular activation and enhanced cytotoxicity. Journal of Controlled Release 225: 87–89. DOI 10.1016/j.jconrel.2016.01.039. [Google Scholar] [CrossRef]
Ramasamy T, Sundaramoorthy P, Ruttala HB, Choi Y, Shin WH, Jeong JH, Ku SK, Choi H, Kim HM, Yong CS, Kim JO. (2017). Polyunsaturated fatty acid-based targeted nanotherapeutics to enhance the therapeutic efficacy of docetaxel. Drug Delivery 24: 1262–1272. DOI 10.1080/10717544.2017.1373163. [Google Scholar] [CrossRef]
Shin HJ, Kwon HK, Lee JH, Anwar MA, Choi S. (2016). Etoposide induced cytotoxicity mediated by ROS and ERK in human kidney proximal tubule cells. Scientific Reports 6: 34064–34077. DOI 10.1038/srep34064. [Google Scholar] [CrossRef]
Singh R, Kesharwani P, Mehra NK, Singh S, Banerjee S, Jain NK. (2015). Development and characterization of folate anchored Saquinavir entrapped PLGA nanoparticles for anti-tumor activity. Drug Development and Industrial Pharmacy 41: 1888–1901. DOI 10.3109/03639045.2015.1019355. [Google Scholar] [CrossRef]
Teja SP, Damodharan N. (2018). 23 Full factorial model for particle size optimization of methotrexate loaded chitosan nanocarriers: A design of experiments (DoE) approach. BioMed Research International 2018: 7834159. DOI 10.1155/2018/7834159. [Google Scholar] [CrossRef]
Timoszuk M, Bielawska K, Skrzydlewska E. (2018). Evening primrose (Oenothera biennis) biological activity dependent on chemical composition. Antioxidants 7: 108–119. DOI 10.3390/antiox7080108. [Google Scholar] [CrossRef]
Wang B, Yu XC, Xu SF, Xu M. (2015). Paclitaxel and etoposide co-loaded polymeric nanoparticles for the effective combination therapy against human osteosarcoma. Journal of Nanobiotechnology 13: 22–33. DOI 10.1186/s12951-015-0086-4. [Google Scholar] [CrossRef]
Wang J, Zhu R, Sun X, Zhu Y, Liu H, Wang SL. (2014). Intracellular uptake of etoposide-loaded solid lipid nanoparticles induces an enhancing inhibitory effect on gastric cancer through mitochondria-mediated apoptosis pathway. International Journal of Nanomedicine 9: 3987–3998. DOI 10.2147/IJN.S64103. [Google Scholar] [CrossRef]
 | This work is licensed under a Creative Commons Attribution 4.0 International License, which permits unrestricted use, distribution, and reproduction in any medium, provided the original work is properly cited. |