DOI:10.32604/biocell.2021.012371
www.techscience.com/journal/biocell
| Biocell DOI:10.32604/biocell.2021.012371 | www.techscience.com/journal/biocell |
| Article |
Fibroblast growth factor 9 promotes kidney cell proliferation via WNT signaling-mediated activation of ANXA4
1School of Bioengineering, Wuhu Institute of Technology, Wuhu, 241003, China
2Department of Reproductive Medicine, Liaocheng People’s Hospital, Liaocheng, 252000, China
*Address correspondence to: Hongmin Guo, guoguo8494@163.com
Received: 28 June 2020; Accepted: 23 December 2020
#These authors contributed equally to this work
Abstract: Fibroblast growth factors (FGFs) play pivotal roles in cell migration and proliferation. However, the identity of the FGF that plays a dominant role in kidney cell proliferation remains unclear. Therefore, in this study, we investigated the dominant FGF among all FGFs. To this end, RNA-sequencing, qRT-PCR, western blotting, and ChIP assays were performed. FGF9 showed the highest expression among all FGFs, and its overexpression significantly promoted proliferation in the mouse kidney cell line C57BL/6 and increased JNK and AKT phosphorylation levels. Further, RNA-seq analysis identified 365 upregulated and 276 downregulated genes in FGF9-overexpressed cells. These differentially expressed genes were classified primarily into 20 biological pathways and were enriched in 31 gene ontology terms. qRT-PCR revealed that the expression of WNT and NF-κB signaling genes, as well as ANXA4 expression patterns, correlated with the RNA-seq data, while FGF9-overexpressed cells accumulated more β-catenin, a key WNT signaling protein, compared to control cells. Moreover, downregulation of the gene that encodes β-catenin or ANXA4 inhibited C57BL/6 cell proliferation. Additionally, the expression of ANXA4 was lower in CTNNB1-knockdown cells than in the control group. Additionally, the ChIP assay revealed that a transcription factor complex containing TCF4 and β-catenin directly binds to the ANXA4 promoter. Taken together, these results suggest a role of FGF9 in the regulation of kidney cell migration. These findings may prove useful in the development of future therapies.
Keywords: Fibroblast growth factor; Kidney cell; Proliferation; ANXA4; WNT
The kidneys are very important organs both morphologically and functionally as they serve to maintain salt, water, and acid-base homeostasis, as well as to secrete waste products in the form of urine (Márquez et al., 2002). However, the intricate structure of the nephron is required for the kidney to carry out its function. Hence, kidney growth and maturation require the completion of nephrogenesis and further terminal differentiation (Nigam Sk and Brenner, 1996). Moreover, cell proliferation is a key process in organ development, and although previous studies have focused on morphological analysis during kidney development and the role of cell proliferation in nephron diseases (Márquez et al., 2002; Song and Yosypiv, 2012; Lee et al., 2015), reports detailing the underlying mechanisms associated with kidney cell proliferation, remain limited. Nevertheless, the studies that have been performed in this field have reported that hepatic nuclear factor-alpha (HNFα) regulates 14 downstream genes associated with kidney cell proliferation (Grigo et al., 2008). Furthermore, although upregulation of fibroblast growth factor (FGF)9 and FGF1 was detected in adult rat kidney cortical and outer medullary tissues (Cancilla et al., 2001), the function of these proteins in kidney cell proliferation during development is unclear.
The FGF family of proteins comprises 23 members in mammalian genomes (Mohammadi et al., 2005); these are involved in regulating mammalian metabolism and development. Specifically, the role of FGFs has been characterized in embryogenesis, somitogenesis, body plan formation, gastrulation, skin wound healing, and organogenesis (Feldman et al., 1995; Goldfarb, 1996; Martin, 1998; Sun et al., 1999; Dubrulle and Pourquié, 2004; Kanazawa et al., 2010). FGF1, specifically, has been shown to participate in blood sugar homeostasis via regulating insulin sensitivity (Suh et al., 2014). Meanwhile, bFGF/FGF2 promotes skin fibroblast migration by activation of the PI3K-RAC1-JNK signaling pathway (Kanazawa et al., 2010). Additionally, FGF21 has been reported to be highly sensitive to starvation stress or drug administration while also playing a key role in glucose homeostasis, as well as in the protection of the liver and heart from injury (Lin et al., 2013; Liang et al., 2014; Lin et al., 2014). In addition, FGF9 protects against fibrosis during cardiac fibroblast malformation (Sun et al., 2019); meanwhile, abnormal activation of FGF9 during the development of the anorectum in rat embryos results in anorectal (Liu et al., 2019). Still further, FGF23-klotho protects against early chronic kidney disease in Type 2 diabetes (Ribeiro et al., 2019). However, the function of FGFs in kidney cell proliferation remains unclear.
A previous study using RNA-seq based transcriptome dissection reported that diverse pathway genes are under the control of bFGF, including WNT, hedgehog, and inflammatory response signaling genes in skin fibroblasts (Xuan et al., 2016). Consequently, WNT/β-catenin signaling plays a key role in fibroblast migration and proliferation (Wang et al., 2017). Additionally, the canonical WNT pathway, β-catenin-TCF/LEF-1 signaling, is reportedly activated by hepatocyte growth factor/scatter factor (HGF/SF), epidermal growth factor (EGF), insulin-like growth factor (IGF)-1, insulin, and IGF-2 (Muller et al., 2002; Lu et al., 2003; Deval et al., 2006; Heo et al., 2012). Furthermore, PI3K-activates PKB/AKT to phosphorylate GSK-3β at the Ser9 residue, thereby inhibiting GSK-3β activity and subsequently activating the β-catenin-TCF/LEF-1 axis in insulin signaling (Cross et al., 1995; Weston and Davis, 2001). EGF stimulation also triggers the translocation of β-catenin to the nucleus to promote its transactivation irrespective of the stability and phosphorylation of β-catenin (by GSK-3β) (Lu et al., 2003). In addition, EGF-ERK2 increases β-catenin transactivation and enhances α-catenin phosphorylation at Ser641 by CK2 to promote tumor cell invasion (Ji et al., 2009). Meanwhile, β-catenin has been reported to promote cell proliferation in renal cancer cells (Yang et al., 2017). Furthermore, a whole-genome aimed at identifying the sequences bound by the β-catenin-TCF/LEF transcription factor complex revealed that the TCF/LEF transcription regulation complex binds to the cis-element sequences T/AC/GAAAG present at downstream target gene promoters (Schuijers et al., 2014). These findings indicate that diverse mechanisms modulate β-catenin activity (Lu and Hunter, 2004).
In the present study, the dominantly expressed FGFs were analyzed in kidney cells, and their associated regulatory mechanisms were characterized using molecular and biochemical assays. Consequently, this study identified the role of FGF9 in kidney cell proliferation and provided useful information for further exploration of the FGF-regulated cell proliferation mechanism.
Mouse kidney cell line culture
The C57BL/6 mouse kidney cell line was obtained from American Type Cell Collection (ATCC, Manassas, VA) and was grown in Dulbecco’s Modified Eagle’s medium (DMEM) containing 5.5 mM glucose, 1% penicillin-streptomycin, and 10% fetal bovine serum.
Cell proliferation was measured using the Cell Counting Kit-8 (CCK-8, Dojindo Bio., Japan) following the manufacturer’s instruction. Briefly, the cells (2.6 × 10⁴ cells/well, 100 mL) were digested with trypsin and subsequently transferred to 96-well plates, with five parallel wells assigned for each treatment.
Overexpression of FGF9 and silencing of CTNNB1 and ANXA4 in C57BL/6 mouse kidney cells
The FGF9 open reading frame was amplified from the cDNA of C57BL/6 mouse kidney cells by PCR and cloned into the pcDNA3.1 (+) (Cat. No. V79020; Thermo Fisher Scientific, Inc., Waltham, USA) expression vector to create FGF9 overexpression plasmids. The primer information for CTNNB1 silencing is shown as follow: FGF9 CF: ATGGCTCCCTTAGG TGAAGTTGG, FGF9 CR: TCAACTTTGGCTTAG AATATCCTTATA. The negative control siRNA (ON-TARGETplus si CONTROL non-targeting pool, D-001810) and CTNNB1 siRNA duplex (ON-TARGET plus SMART pool, L-004018) were obtained from Dharmacon RNA Technologies (Chicago, IL, USA). RNAs (shRNAs) targeting ANXA4 (shANXA4F: CGCGTccccCCGATGAAGACGCCATTATttcaagagaATAATGGCGTCTTCATCGGtttttGGAAAT; shANXA4R: cgatTTCCaaaaaCCGA TGAAGACGCCATTATtctcttgaaATAATGGCGTCTTCATCGGGGGGA) and negative control non-specific shRNA (NC shRNA) were synthesized by Songon Biotech Co. (Shanghai, China; Liu et al., 2017). Fibroblasts that reached 30%–50% confluence were used for transfection with 2 µg of the FGF9 overexpression plasmid or 30 nM of the siRNA duplex using Lipofectamine 2000 (Invitrogen) and Opti-MEM® I Reduced Serum Medium (Gibco), according to the manufacturer’s instructions.
Total RNA extracted from C57BL/6 mouse kidney cells, with or without FGF9-overexpression, was used for RNA-sequencing experiments. The RNA-seq experiments and further data analyses were performed by Songon Biotech Co., Ltd. (Shanghai, China), and data were deposited in a personal computer, which will be released upon request.
GO and KEGG enrichment analyses
Differentially expressed genes were analyzed further based on statistical outcomes by assessing their association with biological processes using the gene ontology (GO) database (Consortium, 2006). Fisher’s exact test was performed to enrich the GO category. The false discovery rate (FDR) was further calculated to correct the P-value, with a smaller FDR indicating a smaller error in judging the P-value (Dupuy et al., 2007). The enrichment of GO terms among differentially expressed probe sets was identified using the one-tailed Fisher’s exact test (Dunnick et al., 2012). KEGG, Biocarta, and Reactome were employed to analyze pathway enrichment for differentially expressed genes. Fisher’s exact test was followed by Benjamini–Hochberg (BH) multiple testing correction to select the significant pathways, and the threshold of significance was defined by P-value and FDR (Draghici et al., 2007).
Chromatin immunoprecipitation (ChIP) assay was performed using a chromatin immunoprecipitation assay kit (Cat No. 17-295, Millipore, Billerica, MA), according to the manufacturer’s instructions. Approximately 1 µg of anti-β-catenin antibody (Abcam, ab32572) or 1 µg of anti-TCF4 antibody (Cell Signaling Technology, 2566) was added to the reaction solution to immunoprecipitate DNA fragments. The resulting immunoprecipitated (IP) DNA was compared with the DNA precipitated with anti-mouse IgG antibody (Abcam, ab190475) using quantitative PCR (qPCR) with SYBR Green (cat. no. 4472908) for F1, F2, or F3 regions; Thermo Fisher Scientific, Inc.), according to the manufacturer’s protocol. ChIP-PCR was performed with an initial denaturation at 95°C for 3 min, followed by 40 cycles of denaturation for 30 s at 95°C, annealing for 30 s at 58°C, and extension at 72°C for 30 s, followed by a final extension at 72°C for 5 min. GAPDH was used as a reference gene to normalize the data. The primer sequences for qRT-PCR are listed as follow: F1 (F: ATCTTGAGGGAGACTTGGACA, R: CTCTGGATGAATACCTGTGGC), F2 (F: CTCTGAGTGAGTCGCGAGGTTAT, R: G AGTTGGTCTCCAATGTTGTTTG), and F3 (F: TGTGATT CAAGAGCTCGAGAC, R: AAGCTCGAATGACGTA CGTTC).
Total RNA extraction, cDNA synthesis, and qRT-PCR
Approximately 2 µg of total RNA from C57BL/6 mouse kidney cells was reverse-transcribed using the GoScript Reverse Transcription Kit (Reverse Transcription System, Promega) as per the manufacturer’s methods. Gene expression was quantified as described previously via qRT-PCR assay (Xuan et al., 2016). The primers information are listed as follow: GAPDH (F: GCCAAGGTCATCCATGACAACT, R:GAGGGGCCATCCACAGTCTT), FGF1 (F: TGCTCTACTGCAGCAACG, R: C TAGTCAGAAGACACCGG), FGFR2 (F: CAAGAAC GGCGGCTTCTTC, R: GGAAGAAACAGTATGGCCT) FGR3 (F: CAAGCTCTACTGCGCTACC, R: GTCCAC CTGTATGCAGCT), FGF4 (F: TACTGCAACGTGG GCATC, R: GGAAGTGGGTTACCTTCA), FGF5 (F: GAAGTAGCGCGACGTTTTC, R: GGCTTAACACA CTGGCTTC), FGG6 (F: CTCTACTGCAACGTGGG C,R:GGAAGTGAGTGACAGTCA), FGF7 (F: AGAC TGTTCTGTCGCACC, R: CCGCTGTGTGTCCATTT AG), FGF8 (F: ACCTACCAGCTCTACAGCC, R: GG CGGGTAGTTGAGGAACT), FGF9 (F: CTGCAGGA CTGGATTTCATTT, R: GTTCAGGTACTTTGTCA GGG), FGF10 (F: TGTCCGCTGGAGAAGGCTGT TC, R:CTATGTTTGGATCGTCATGG), FGF11 (F: ATCGTCACCAAACTGTTCTG, R: CAGGAACAC TGTGGAGAGAA), FGF12 (F: TCAGCCAGCAGG GATATTTC, R: CACGACTTTGCCTCCATTCA), FGF13 (F: TAACCTCATCCCTGTGGG, R: GAGAA CTCCGTGAGATCG), FGF14 (F: CAACCTCATCC CAGTGGGA, R: GGGACTGTTTCACCAACATC), FGF15 (F: ACTCCGCTGGTCCCTATGTC, R: CTAC ATCCTCCACCATCCT), FGF16 (F: GCTTCCACC TTGAGATCTTC, R: GAGATCTCTGGACATGGAG) FGF17(F:CCAGCTCTACAGCCGGAC, R: GGGGC GGAGCCCACAAAT), FGF18 (F: CCAGCTCTATA GCAGGAC, R: GCTTGGTGACTGTGGTGT), FGF 19 (F: AACTTTATCCCCATATTTCACC, R: GAAG CTGGGACTCTTCACT), FGF20 (F: TCAGAGAA ATTGACTTCTG, R: GTGTACATCAGTAGGTCTT), FGF21 (F: GATGACGACCAAGACACTG, R: CGGC CCTGTAAAGGCTCT), FGF22 (F: GCCTCTTCTC CTCCACTC, R: CGAGACCAAGACTGGCAG). FG F23 (F: ACAGCCAGGACCAGCTATC, R: CTCGCGAGAGCAGGATACA), ANXA4 (F: ACCAGCAGCAATATGGACGG, R: TTCGGTTCCGGGAACAGAG), CTNNB1 (F: TCGCCAGGATGATCCCAGC, R: GC CCATCCATGAGGTCCTG), SMO (F: ACCTATGCC TGGCACACTTC, R: AGGAAGTAGCCTCCCACGAT, PTCH (F: CAAACTCCTGGTGCAAACCG, R: CCGGGATTCTCAGCCTTGTT), and GLI1 (F: CCAGAGTTCAAGAGCCTGG. R: CC TCGCTCCATAAGGCTCAG).
Protein was extracted from cells using a lysis solution (7 M urea, 2 M thiourea, 40 mM Trizma base, 2% CHAPS, 1% protease inhibitor, and 40 mM dithiothreitol (DTT)). The cell lysates were centrifuged at 15,000 × g for 15 min, and the supernatants were harvested for total protein concentration measurement via the Bradford protein assay (Bio-Rad, Richmond, CA, USA). Next, 20 µg of protein from each sample was resolved using the SDS-PAGE and subsequently transferred onto Immobilon-P Transfer Membranes (MILLIPORE JAPAN, Tokyo, Japan). The membranes were incubated in 1× TBS containing 0.05% Tween-20 and 5% milk for 2 h and incubated further with the primary antibodies at 25°C for 1 h. Anti-GAPDH (1:2500, Abcam, ab9485), anti-phospho-SAPK/JNK (Thr183/Tyr185) antibody (1:1000, Cell Signaling Technology, 4668), anti-JNK1 + JNK2 + JNK3 antibody (1:1000, Abcam, ab179461), anti-phospho-AKT (Ser473) antibody (1:2000, Cell Signaling Technology, 4060), anti-p-IκBα antibody (1:500, Santa Cruz Biotechnology, sc-8404), anti-β-catenin antibody (1:1000, Cell Signaling Technology, 8480), anti-AKT antibody (1:1000, Cell Signaling Technology, 4691), anti-β-catenin antibody (1:2000, Abcam, ab32572), and anti-ANXA4 antibody (1:2000, Abcam, ab256456) were used as primary antibodies. After incubation, the membranes were washed with 1× TBS twice and incubated for 1 h with an anti-mouse or anti-rabbit HRP-linked secondary antibody (1:2000, Cell Signaling Technology). Antigen-antibody complexes were detected with an electrochemiluminescence (ECL) kit (GE healthcare). The protein band density was quantified using the ImageJ software (National Institute of Health, Bethesda, MD, USA), and the relative levels were normalized to GAPDH levels.
Prism 5 (GraphPad Software, San Diego, CA) software was used for statistical analysis. Student’s t-test was used to analyze significant differences between two groups.
Expression patterns of FGFs in C57BL/6 mouse kidney cells
qRT-PCR was performed to evaluate the expression levels of 23 FGF family member genes in C57BL/6 mouse kidney cells. The results indicate that FGF1, 5, 7, 8, 9, 10, 11, 12, 16, and 17 exhibited the highest expression levels among the 23 FGFs. Among these, FGF9 exhibited the highest expression, followed by FGF1. Meanwhile, FGF2, FGF6, FGF13, FGF14, FGF19, FGF20, FGF21, and FGF23 were found to be rarely expressed in the kidney cells (Fig. 1).
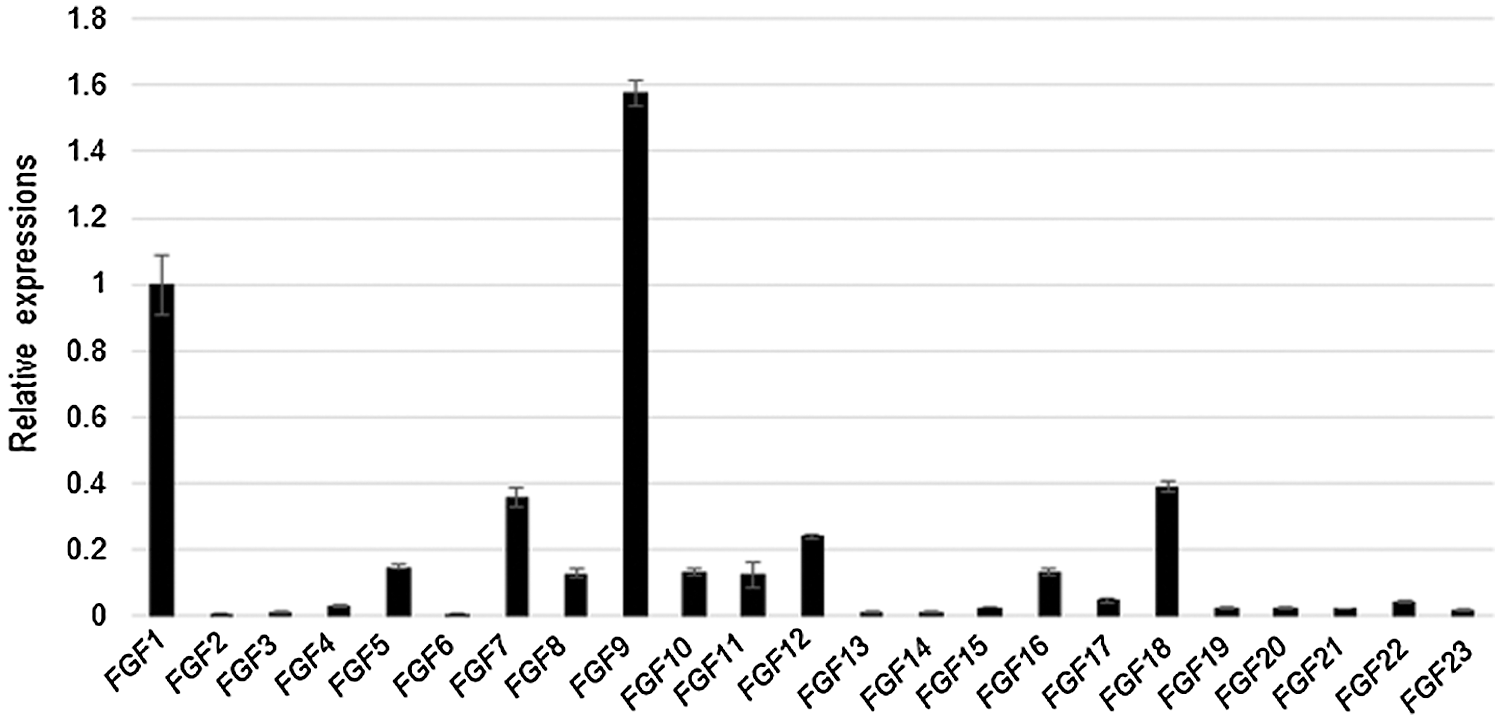
Figure 1: FGF expression patterns in kidney cells.
Overexpression of FGF9 promotes kidney cell proliferation
As FGF9 was the predominantly expressed FGF in kidney cells, its function was further investigated via overexpression in C57BL/6 mouse kidney cells. The qRT-PCR results indicate that the FGF9 expression levels, but not those of FGF1 or FGF21, were higher in the overexpressed cells compared to those in the non-transfected control cells (Fig. 2A). Using the FGF9-overexpressed cells, the proliferation rate was examined by CCK-8, and cell density measurement showed that FGF9 overexpression significantly promoted the proliferation of C57BL/6 cells (Fig. 2B). Next, AKT and JNK levels in the control and FGF9 overexpressing cells were analyzed. Western blotting results indicate that FGF9 overexpression induced phosphorylation of AKT and JNK without affecting the total AKT or JNK levels (Figs. 2C and 2D).
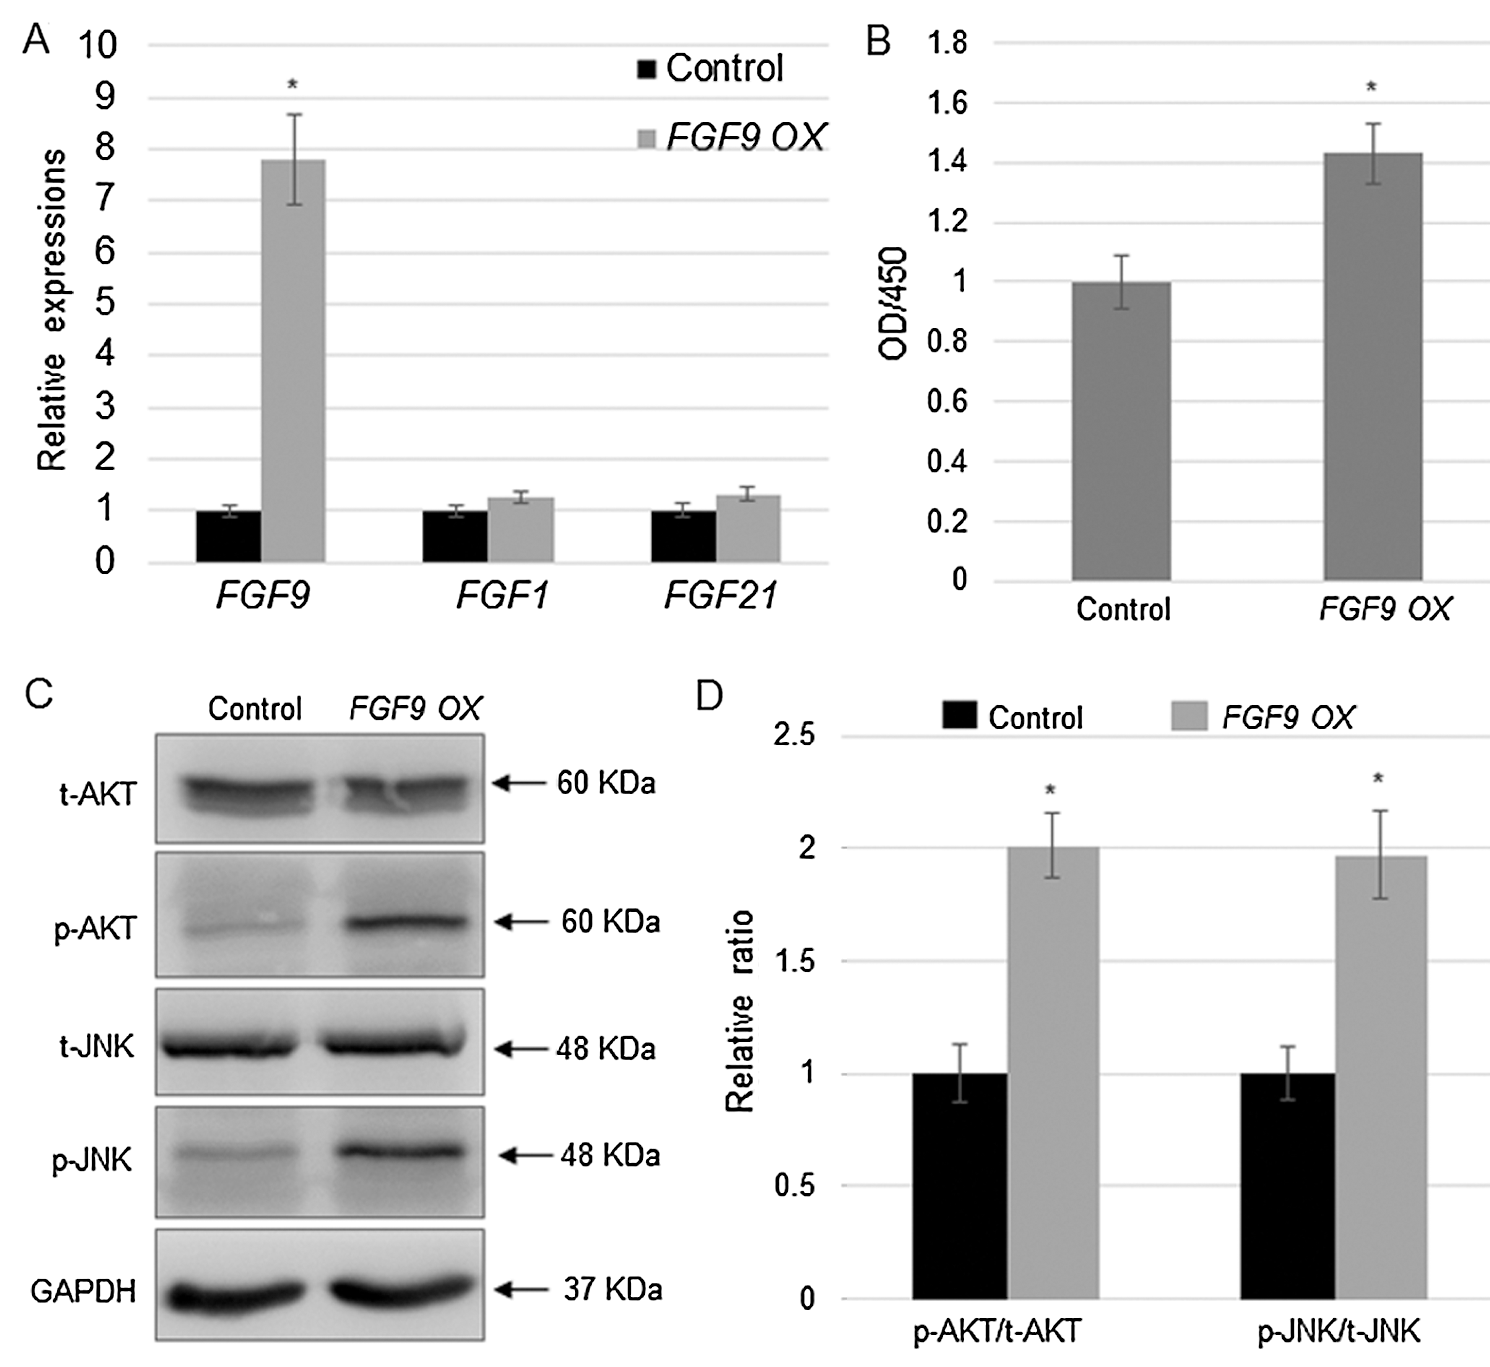
Figure 2: FGF9 overexpression activates cell proliferation and induces AKT and JNK phosphorylation.
Screening the FGF9-regulating transcriptome
To screen FGF9-regulating genes and pathways, RNA-seq based transcriptome analysis was performed by using the FGF9-overexpressing and control C57BL/6 mouse kidney cells. The RNA-seq results indicate that a total of 641 genes were differentially expressed following the overexpression of FGF9 (1.5-fold change; P < 0.05). Among these, 365 downregulated genes and 276 upregulated genes were identified (Fig. 3A). Further, qRT-PCR revealed that the expression of WNT pathway genes (SMO, CTNNB1, and PTCH), hedgehog pathway genes (GLI1), and ANXA4 was upregulated upon FGF9 overexpression, which was consistent with the RNA-seq data (Fig. 3B). The differentially expressed genes were further analyzed for their association with biological process GO terms. GO analysis indicated that 31 terms were enriched for these differentially expressed genes (P < 0.01) and that they were involved in diverse biological processes, including multicellular organismal development, nucleosome assembly, DNA-template transcription, and positive regulation of interleukin (IL)-10 secretion (Fig. 4A). In addition, out of the 641 differentially expressed genes, 102 were classified into known pathways (P < 0.05). Pathway analysis using the KEGG database was then performed to classify the differentially expressed genes. The dendrograms, a portion of which are presented in Fig. 4B, demonstrate the significance of the seven up- and nine downregulated pathways, including WNT, NF-κB, and hedgehog signaling pathways.
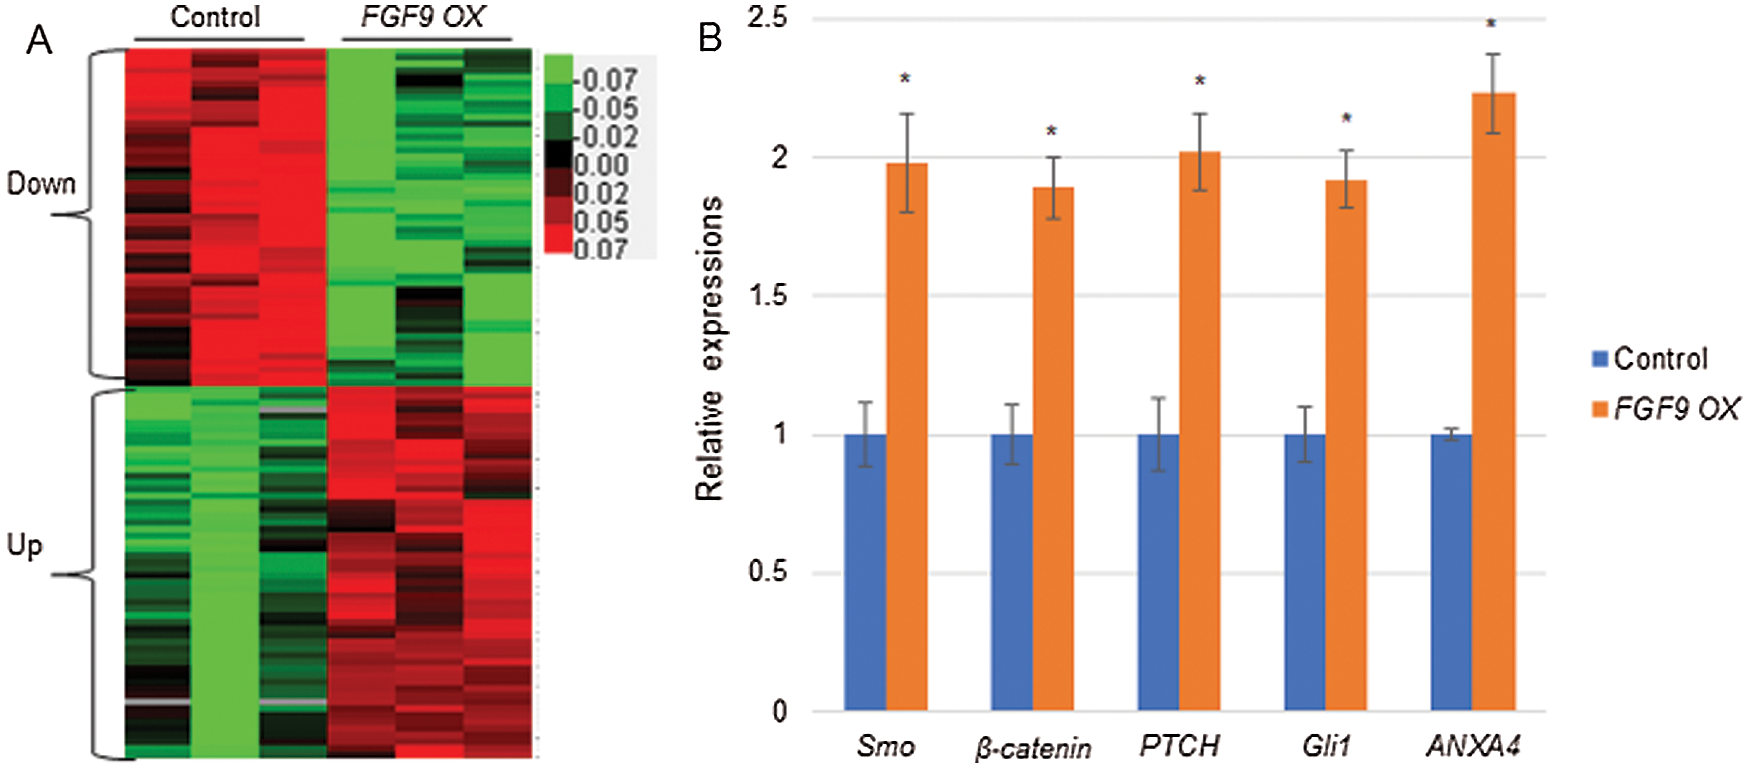
Figure 3: Heatmap and gene expression analysis.
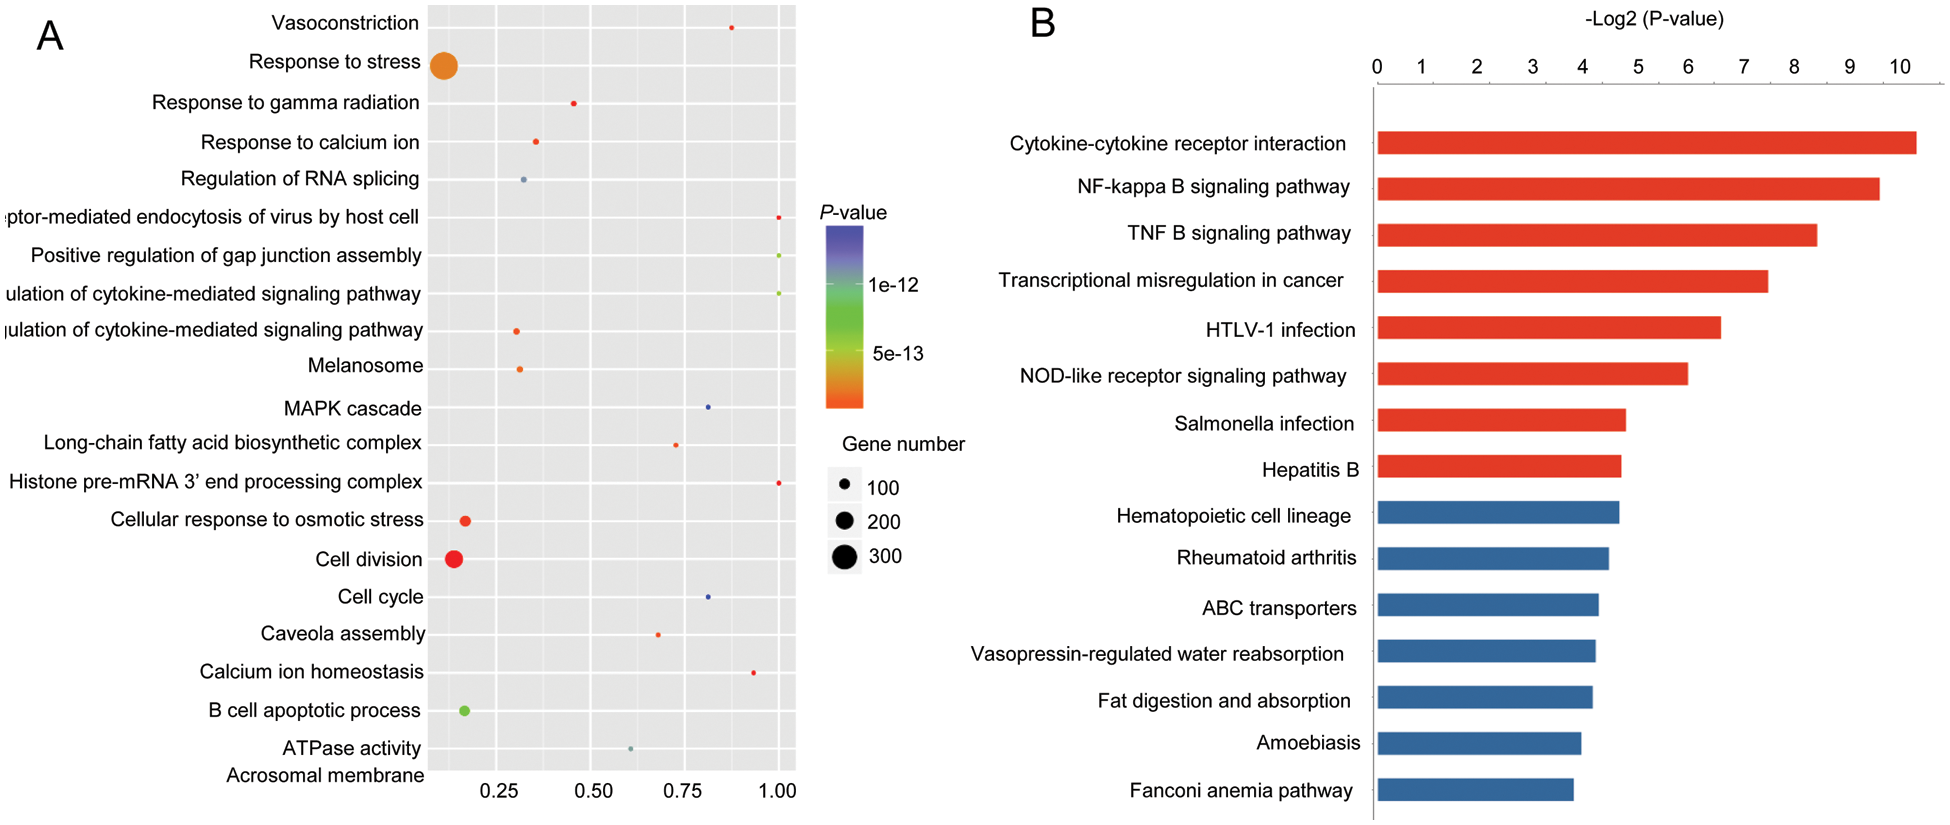
Figure 4: GO and KEGG analyses of FGF9-regulating genes.
β-catenin knockdown inhibits kidney cell proliferation
As FGF9 overexpression activated the expression of WNT pathway genes (SMO, CTNNB1, and PTCH), the expression of the key WNT signaling transcription factor, i.e., β-catenin was analyzed by western blot analysis. In agreement with the qRT-PCR results, β-catenin accumulated to a greater extent in the FGF9-overexpressing cells as compared to that in the control cells (Figs. 5A and 5B). Further, the role of β-catenin in kidney cell proliferation was examined using a specific shRNA against β-catenin (CTNNB1) and NC siRNA (control) in C57BL/6 cells (Fig. 5C). Moreover, to verify the qPCR results, Western blot analysis was performed to analyze β-catenin protein levels. The results indicate that β-catenin level was higher in FGF9 OX than that in the control, while it was significantly lower in CTNNB1 siRNA than in NC siRNA transfected cells (Fig. 5D). In addition, CTNNB1 knockdown significantly inhibited kidney cell proliferation (Fig. 5E).
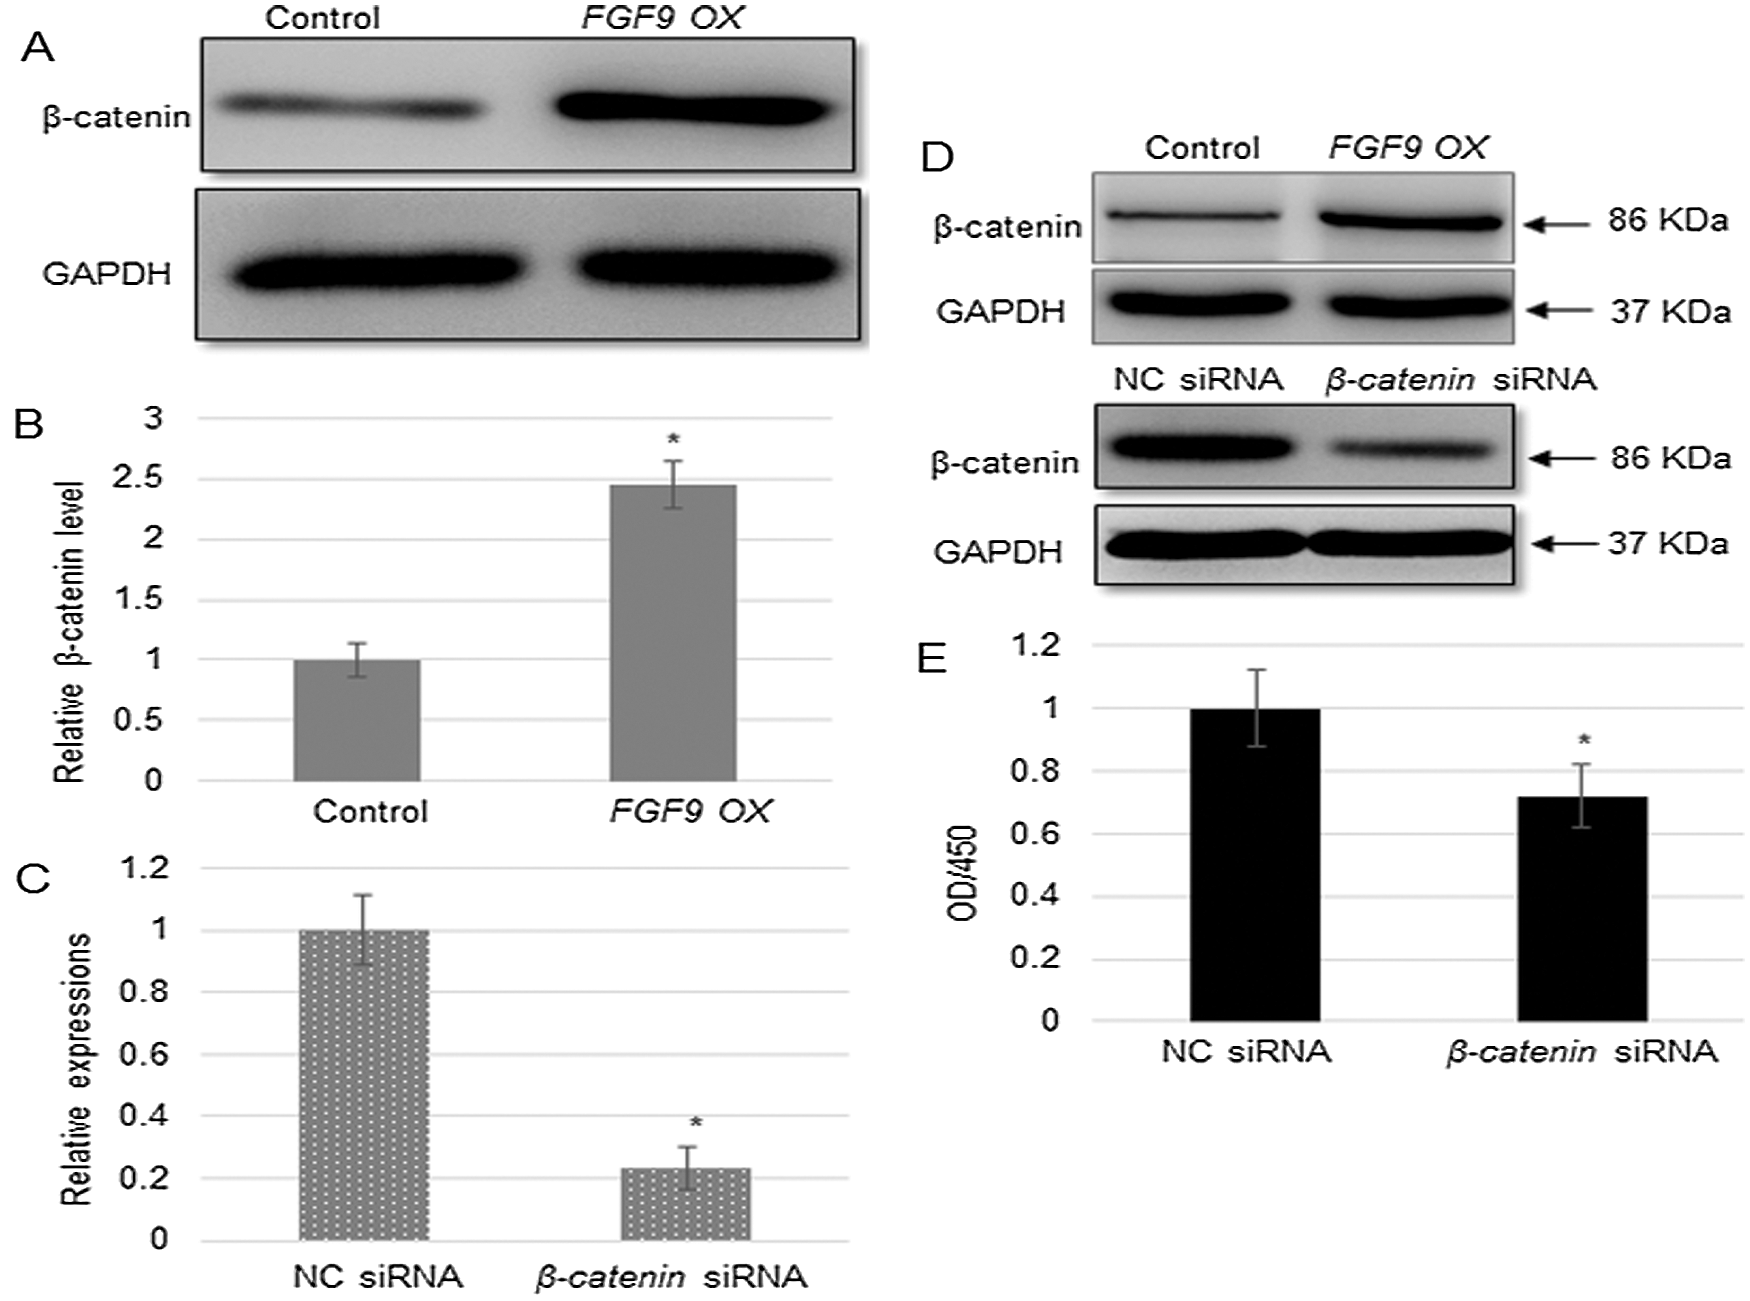
Figure 5: β-catenin expression and CTNNB1-induced suppression of cell proliferation.
ANXA4 positively regulates kidney cell proliferation downstream of CTNNB1
ANXA4 was induced by FGF9 overexpression; therefore, its expression level was examined in CTNNB1 knockdown cells. The qRT-PCR results show that CTNNB1 suppression reduced ANXA4 expression (Fig. 6A). Moreover, as ANXA4 was previously reported to play a role in the proliferation of hepatocellular carcinoma cells (Liu et al., 2017), its function in kidney cell proliferation was further examined. The NC shRNA and specific shRNA were confirmed to significantly downregulate the expression of ANXA4 at transcript (Fig. 6B) and protein levels (Fig. 6C), whereas ANXA4 knockdown significantly inhibited kidney cell proliferation (Fig. 6D). As the β-catenin complex functions as a transcription activator to regulate downstream gene expression, the potential binding between the transcription factor complex, containing TCF4 and β-catenin, to the ANXA4 promoter region was investigated. The TCF4 or β-catenin antibody immunoprecipitation and subsequent ChIP-PCR showed that the TCF4 and β-catenin complex bound to F2, not the F1 or F3 regions, in the ANXA4 promoter (Fig. 6E).
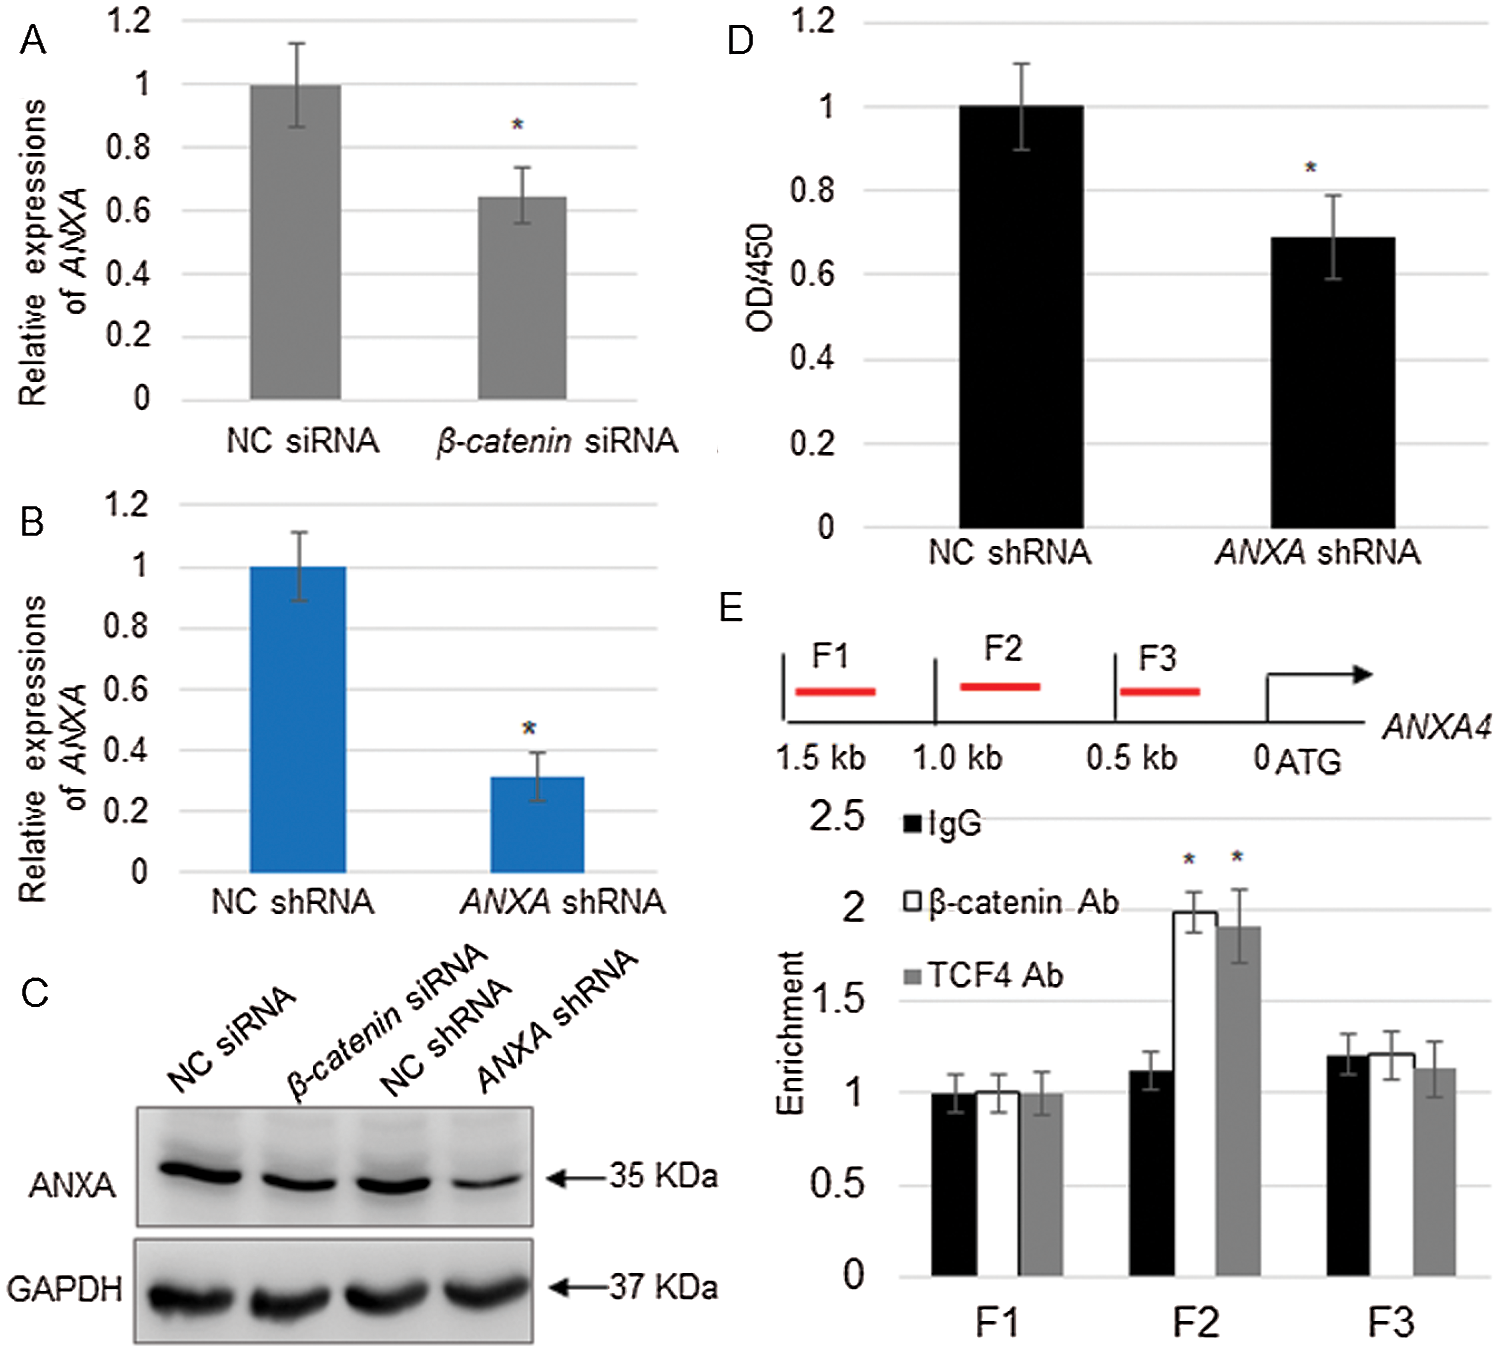
Figure 6: β-catenin complex directly activates ANXA4 expression.
The kidney is a highly complex organ that is integral to the maintenance of salt, water, and acid-base balance, while also serving as a filter to secrete waste products from the body (Márquez et al., 2002). Although the role that cell proliferation plays in general tissue maturation is well-characterized, the underlying mechanism associated with kidney cell proliferation remains largely unknown. Meanwhile, considering that studies have reported upregulation of FGF9 and FGF1 in adult rat kidney cortical and outer medullary tissues (Cancilla et al., 2001), we sought to verify the expression patterns of FGFs and to characterize the function of the predominately expressed FGF in kidney cell proliferation. FGFs play a key role in diverse biological processes, including protection against diabetes-induced complications, cell migration and proliferation, and sugar metabolism, as well as skin wound repair. Specifically, FGF9 was reported to protect against fibrosis in cardiac fibroblasts (Sun et al., 2019), whereas its abnormal activation during anorectal development in rat embryos resulted in anorectal malformations (Liu et al., 2019). FGF9 was also shown to alter the Wallerian degeneration process by accelerating macrophage infiltration (Lv et al., 2019). Additionally, FGF9 has been identified as a potential novel biomarker for the diagnosis of prostate cancer (Cui et al., 2019), suggesting that it has multiple functions in different tissues. So far, FGF23 and its partner klotho function in combination to protect against early chronic kidney disease in Type 2 diabetes. However, the function of FGF9 in kidney cells has not been analyzed.
Using C57BL/6 mouse kidney cells, 23 FGFs were examined for their expression patterns. The results suggest that in this cell line, FGF1 and FGF9 are the two predominant members based on their transcription levels, with FGF9 exhibiting the highest expression among the 23 FGFs. As compared to these two FGFs, the other FGFs either showed low expression levels or negligible expression. However, extensive analyses have also found that FGF21 is significantly induced by wounding, drugs, and starvation (Lin et al., 2013; Liang et al., 2014; Lin et al., 2014; Song et al., 2016a; Song et al., 2016b), thereby implicating it in the protection of the liver and heart from injury, in glucose homeostasis, and skin wound healing. Hence, other FGFs might also become activated under certain conditions in kidney cells.
Further, FGF9 overexpression promotes C57BL/6 cell proliferation and activates JNK and AKT similar to bFGF stimuli (Xuan et al., 2016), suggesting that FGF9, and potentially other FGFs, may activate similar downstream signaling events. To further elucidate the FGF9 regulatory mechanism, RNA-seq analysis was performed using FGF9-overexpressing C57BL/6 mouse kidney cells. The expression of many genes was altered upon the activation of FGF9-mediated signaling, including 365 downregulated genes and 276 upregulated genes. These genes were enriched in 31 GO terms, including positive regulation of IL-10 secretion, nucleosome assembly, DNA-template transcription, and multicellular organismal development. Additionally, KEGG analysis showed that 16 pathways were significantly enriched, including WNT, NF-κB, and hedgehog signaling pathways. These findings imply that FGF9 might regulate inflammatory responses by modulating NF-κB signaling. Hence, further studies to investigate the role of FGF9 in protecting the kidney under disease conditions will be of significant interest.
Wnt signaling is involved in cell differentiation, survival and proliferation (Gordon and Nusse, 2006), while hedgehog signaling plays important roles in the development of invertebrate and vertebrate organisms and acts as the key regulator in diverse cellular processes (Bushman, 2007). Wnt pathway genes (SMO, CTNNB1, and PTCH) and the hedgehog pathway gene (GLI1) are the key players and significantly respond to FGF9 overexpression. Further analysis following the knockdown of CTNNB1, a master regulator of WNT signaling, inhibited C57BL/6 mouse kidney cell proliferation. Interestingly, CTNNB1 suppression reduced the expression of ANXA4, which was induced by FGF9 overexpression. ANXA4 was previously reported to play a role in the proliferation of hepatocellular carcinoma cells (Liu et al., 2017), while its suppression inhibited C57BL/6 mouse kidney cell proliferation, suggesting that β-catenin may partially regulate ANXA4 to regulate C57BL/6 cell proliferation.
β-catenin-TCF/LEF forms a transcription factor complex that binds to the putative cis-elements (T/AC/GAAAG) present in the promoter region of downstream genes to regulate diverse biological processes (Schuijers et al., 2014). The ChIP assay using β-catenin antibody further revealed that this transcription complex binds to the ANXA4 promoter. Additionally, TCF4, a member of the β-catenin complex that binds to DNA sequences, was also confirmed to directly bind the promoter region of ANXA4. This result further confirmed that β-catenin functions upstream to control ANXA4 transcription, by which C57BL/6 cell proliferation was modulated. Our findings provide evidence that the predominant expression of FGF9 in kidney cells might be important for cell activation and proliferation and that the FGF9-β-catenin-ANXA4 pathway may be involved in this process. Therefore, this study expands the current understanding of FGF9 signaling and describes a new regulatory mechanism for understanding kidney cell proliferation.
In conclusion, this study employed the C57BL/6 mouse kidney cell line to identify the predominantly expressed FGFs in kidney cells. Our results found FGF9 to be the most dominantly expressed, while FGF9 overexpression resulted in the promotion of cell proliferation. We also demonstrated that FGF9-overexpressing cells accumulate more β-catenin than control cells, while CTNNB1 or ANXA4 knockdown inhibited cell proliferation. Hence, our results revealed that FGF9 promotes cell proliferation via the activation of ANXA4, which serves to broaden our understanding of the FGF regulatory mechanism and provides scope for further exploration of FGF-regulated cell proliferation.
FGFs play a significant role in a broad spectrum of biological processes like cell migration and proliferation. However, their expression patterns in kidney cell proliferation remain poorly understood. In the current study, we used the C57BL/6 mouse kidney cell line to identify the dominantly expressed FGFs in kidney cells. Our results revealed FGF9 to be the most dominantly expressed, while FGF9 overexpression resulted in the promotion of cell proliferation. RNA-seq based transcriptome analysis revealed differentially expressed genes in FGF9 overexpressed cells. The results of qRT-PCR were consistent with the RNA-seq data. We also demonstrated that the FGF9 overexpressed cells accumulated more β-catenin than the control cells, while the suppression of β-catenin or ANXA4 resulted in inhibition of cell proliferation. In summary, our results showed FGF9 to be the most dominantly expressed in the kidney cells. It was shown to promote cell proliferation via activation of ANXA4. Our results extend the understanding of the FGF regulatory mechanism and provide scope for further exploration of FGF-regulated cell proliferation.
Acknowledgement: We appreciate very much the colleges from the School of Bioengineering, Wuhu Institute of Technology for the critical reading of our manuscript.
Author Contribution: The authors confirm contribution to the paper as follows: Study conception and design: Ting Li; data collection: Xinhui Sun; analysis and interpretation of results: Ting Li. Nannan Li; draft manuscript preparation: Ting Li. Hongmin Guo. All authors reviewed the results and approved the final version of the manuscript.
Availability of Data and Materials: The readers can access the data used in the study by contact corresponding author.
Funding Statement: This work was funded by Wuhu Institute of Technology Talent Project [wzyrc201801], the Natural Science Foundation of Anhui Province [KJ2018A0691], and the Project of Cultivating Outstanding Talents in Colleges [gxgwfx2019072] and Science and Technology Development Plan Project of TCM.
Conflicts of Interest: The authors declare that they have no conflicts of interest to report regarding the present study.
Bushman W (2007). Hedgehog signaling in development and cancer. In: Chung LWK, Isaacs WB, Simons JW (eds.Prostate Cancer Contemporary Research. pp. 107–118. Totowa, NJ: Humana Press. [Google Scholar]
Cancilla B, Davies A, Cauchi JA, Risbridger GP, Bertram JF (2001). Fibroblast growth factor receptors and their ligands in the adult rat kidney. Kidney International 60: 147–155. DOI 10.1046/j.1523-1755.2001.00781.x. [Google Scholar] [CrossRef]
Consortium GO (2006). The gene ontology (GO) project in 2006. Nucleic Acids Research 34: D322–D326. DOI 10.1093/nar/gkj021. [Google Scholar] [CrossRef]
Cross DA, Alessi DR, Cohen P, Andjelkovich M, Hemmings BA (1995). Inhibition of glycogen synthase kinase-3 by insulin mediated by protein kinase B. Nature 378: 785–789. DOI 10.1038/378785a0. [Google Scholar] [CrossRef]
Cui G, Shao M, Gu X, Guo H, Zhang S, Lu J, Ma H (2019). The value of FGF9 as a novel biomarker in the diagnosis of prostate cancer. Artificial Cells, Nanomedicine, and Biotechnology 47: 2241–2245. DOI 10.1080/21691401.2019.1620250. [Google Scholar] [CrossRef]
Deval E, Friend V, Thirant C, Salinas M, Jodar M, Lazdunski M, Lingueglia E (2006). Regulation of sensory neuron-specific acid-sensing ion channel 3 by the adaptor protein Na+/H+ exchanger regulatory factor-1. Journal of Biological Chemistry 281: 1796–1807. DOI 10.1074/jbc.M509669200. [Google Scholar] [CrossRef]
Draghici S, Khatri P, Tarca AL, Amin K, Done A, Voichita C, Georgescu C, Romero R (2007). A systems biology approach for pathway level analysis. Genome Research 17: 1537–1545. DOI 10.1101/gr.6202607. [Google Scholar] [CrossRef]
Dubrulle J, Pourquié O (2004). fgf8 mRNA decay establishes a gradient that couples axial elongation to patterning in the vertebrate embryo. Nature 427: 419–422. DOI 10.1038/nature02216. [Google Scholar] [CrossRef]
Dunnick J, Brix A, Cunny H, Vallant M, Shockley K (2012). Characterization of polybrominated diphenyl ether toxicity in Wistar Han rats and use of liver microarray data for predicting disease susceptibilities. Toxicologic Pathology 40: 93–106. DOI 10.1177/0192623311429973. [Google Scholar] [CrossRef]
Dupuy D, Bertin N, Hidalgo CA, Venkatesan K, Tu D, Lee D, Rosenberg J, Svrzikapa N, Blanc A, Carnec A, Carvunis AR, Pulak R, Shingles J, Reece-Hoyes J, Hunt-Newbury R, Viveiros R, Mohler WA, Tasan M, Roth FP, Le Peuch C, Hope IA, Johnsen R, Moerman DG, Barabási AL, Baillie D, Vidal M (2007). Genome-scale analysis of in vivo spatiotemporal promoter activity in Caenorhabditis elegans. Nature Biotechnology 25: 663–668. DOI 10.1038/nbt1305. [Google Scholar] [CrossRef]
Feldman B, Poueymirou W, Papaioannou VE, DeChiara TM, Goldfarb M (1995). Requirement of FGF-4 for postimplantation mouse development. Science 267: 246–249. DOI 10.1126/science.7809630. [Google Scholar] [CrossRef]
Goldfarb M (1996). Functions of fibroblast growth factors in vertebrate development. Cytokine & Growth Factor Reviews 7: 311–325. DOI 10.1016/S1359-6101(96)00039-1. [Google Scholar] [CrossRef]
Gordon MD, Nusse R (2006). Wnt signaling: Multiple pathways, multiple receptors, and multiple transcription factors. Journal of Biological Chemistry 281: 22429–22433. DOI 10.1074/jbc.R600015200. [Google Scholar] [CrossRef]
Grigo K, Wirsing A, Lucas B, Klein-Hitpass L, Ryffel GU (2008). HNF4α orchestrates a set of 14 genes to down-regulate cell proliferation in kidney cells. Biological Chemistry 389: 179–187. DOI 10.1515/BC.2008.011. [Google Scholar] [CrossRef]
Heo J, Sachs F, Wang J, Hua SZ (2012). Shear-induced volume decrease in MDCK cells. Cellular Physiology and Biochemistry 30: 395–406. DOI 10.1159/000339033. [Google Scholar] [CrossRef]
Ji H, Wang J, Nika H, Hawke D, Keezer S, Ge Q, Fang B, Fang X, Fang D, Litchfield DW, Aldape K, Lu Z (2009). EGF-induced ERK activation promotes CK2-mediated disassociation of α-catenin from β-catenin and transactivation of β-catenin. Molecular Cell 36: 547–559. DOI 10.1016/j.molcel.2009.09.034. [Google Scholar] [CrossRef]
Kanazawa S, Fujiwara T, Matsuzaki S, Shingaki K, Taniguchi M, Miyata S, Tohyama M, Sakai Y, Yano K, Hosokawa K, Kubo T, Rappoport JZ (2010). bFGF regulates PI3-kinase-Rac1-JNK pathway and promotes fibroblast migration in wound healing. PLoS One 5: e12228. DOI 10.1371/journal.pone.0012228. [Google Scholar] [CrossRef]
Lee EJ, Park EY, Mun H, Chang E, Ko JY, Kim DY, Park JH (2015). Soluble receptor for advanced glycation end products inhibits disease progression in autosomal dominant polycystic kidney disease by down-regulating cell proliferation. FASEB Journal 29: 3506–3514. DOI 10.1096/fj.15-272302. [Google Scholar] [CrossRef]
Liang Q, Zhong L, Zhang J, Wang Y, Bornstein SR, Triggle CR, Ding H, Lam KSL, Xu A (2014). FGF21 maintains glucose homeostasis by mediating the cross talk between liver and brain during prolonged fasting. Diabetes 63: 4064–4075. DOI 10.2337/db14-0541. [Google Scholar] [CrossRef]
Lin Z, Tian H, Lam KSL, Lin S, Hoo RCL, Konishi M, Itoh N, Wang Y, Bornstein SR, Xu A, Li X (2013). Adiponectin mediates the metabolic effects of FGF21 on glucose homeostasis and insulin sensitivity in mice. Cell Metabolism 17: 779–789. DOI 10.1016/j.cmet.2013.04.005. [Google Scholar] [CrossRef]
Lin Z, Wu F, Lin S, Pan X, Jin L, Lu T, Shi L, Wang Y, Xu A, Li X (2014). Adiponectin protects against acetaminophen-induced mitochondrial dysfunction and acute liver injury by promoting autophagy in mice. Journal of Hepatology 61: 825–831. DOI 10.1016/j.jhep.2014.05.033. [Google Scholar] [CrossRef]
Liu H, Zhang H, Li M, Tian H, Tang X, Bai Y (2019). Abnormal expression of Fgf9 during the development of the anorectum in rat embryos with anorectal malformations. Gastroenterology Research and Practice 2019: 1–7. DOI 10.1155/2019/1986196. [Google Scholar] [CrossRef]
Liu YY, Ge C, Tian H, Jiang JY, Zhao FY, Li H, Chen TY, Yao M, Li JJ (2017). The transcription factor Ikaros inhibits cell proliferation by downregulating ANXA4 expression in hepatocellular carcinoma. American Journal of Cancer Research 7: 1285–1297. [Google Scholar]
Lu Z, Ghosh S, Wang Z, Hunter T (2003). Downregulation of caveolin-1 function by EGF leads to the loss of E-cadherin, increased transcriptional activity of β-catenin, and enhanced tumor cell invasion. Cancer Cell 4: 499–515. DOI 10.1016/S1535-6108(03)00304-0. [Google Scholar] [CrossRef]
Lu Z, Hunter T (2004). Wnt-independent beta-catenin transactivation in tumor development. Cell Cycle 3: 571–573. [Google Scholar]
Lv W, Deng B, Duan W, Li Y, Song X, Ji Y, Li Z, Liu Y, Wang X, Li C (2019). FGF9 alters the Wallerian degeneration process by inhibiting Schwann cell transformation and accelerating macrophage infiltration. Brain Research Bulletin 152: 285–296. DOI 10.1016/j.brainresbull.2019.06.011. [Google Scholar] [CrossRef]
Márquez MG, Cabrera I, Serrano DJ, Sterin-Speziale N (2002). Cell proliferation and morphometric changes in the rat kidney during postnatal development. Anatomy and Embryology 205: 431–440. DOI 10.1007/s00429-002-0262-9. [Google Scholar] [CrossRef]
Martin GR (1998). The roles of FGFs in the early development of vertebrate limbs. Genes and Development 12: 1571–1586. DOI 10.1101/gad.12.11.1571. [Google Scholar] [CrossRef]
Mohammadi M, Olsen SK, Ibrahimi OA (2005). Structural basis for fibroblast growth factor receptor activation. Cytokine & Growth Factor Reviews 16: 107–137. DOI 10.1016/j.cytogfr.2005.01.008. [Google Scholar] [CrossRef]
Muller T, Bain G, Wang X, Papkoff J (2002). Regulation of epithelial cell migration and tumor formation by beta-catenin signaling. Experimental Cell Research 280: 119–133. DOI 10.1006/excr.2002.5630. [Google Scholar] [CrossRef]
Nigam Sk AA, Brenner BM (1996). Development and maturation of the kidney. In: Brenner BM, Rector FC (eds.The kidney. pp. 7298. Philadelphia: Saunders. [Google Scholar]
Ribeiro AL, Mendes F, Carias E, Rato F, Santos N, Neves PL, Silva AP (2019). FGF23-klotho axis as predictive factors of fractures in type 2 diabetics with early chronic kidney disease. Journal of Diabetes Complications 34: 107476. DOI 10.1016/j.jdiacomp.2019.107476. [Google Scholar] [CrossRef]
Schuijers J, Mokry M, Hatzis P, Cuppen E, Clevers H (2014). Wnt-induced transcriptional activation is exclusively mediated by TCF/LEF. EMBO Journal 33: 146–156. DOI 10.1002/embj.201385358. [Google Scholar] [CrossRef]
Song R, Yosypiv IV (2012). Development of the kidney medulla. Organogenesis 8: 10–17. DOI 10.4161/org.19308. [Google Scholar] [CrossRef]
Song Y, Ding J, Jin R, Jung J, Li S, Yang JQ, Wang AN, Li ZJ (2016a). Expression and purification of FGF21 in Pichia pastoris and its effect on fibroblast-cell migration. Molecular Medicine Reports 13: 3619–3626. DOI 10.3892/mmr.2016.4942. [Google Scholar] [CrossRef]
Song YH, Zhu YT, Ding J, Zhou FY, Xue JX, Jung JH, Li ZJ, Gao WY (2016b). Distribution of fibroblast growth factors and their roles in skin fibroblast cell migration. Molecular Medicine Reports 14: 3336–3342. DOI 10.3892/mmr.2016.5646. [Google Scholar] [CrossRef]
Suh JM, Jonker JW, Ahmadian M, Goetz R, Lackey D, Osborn O, Huang Z, Liu W, Yoshihara E, van Dijk TH, Havinga R, Fan W, Yin YQ, Yu RT, Liddle C, Atkins AR, Olefsky JM, Mohammadi M, Downes M, Evans RM (2014). Endocrinization of FGF1 produces a neomorphic and potent insulin sensitizer. Nature 513: 436–439. DOI 10.1038/nature13540. [Google Scholar] [CrossRef]
Sun J, Wang Z, Shi H, Gu L, Wang S, Wang H, Li Y, Wei T, Wang Q, Wang L (2019). LncRNA FAF inhibits fibrosis induced by angiotensinogen II via the TGFbeta1-P-Smad2/3 signalling by targeting FGF9 in cardiac fibroblasts. Biochemical and Biophysical Research Communications 521: 814–820. DOI 10.1016/j.bbrc.2019.10.175. [Google Scholar] [CrossRef]
Sun X, Meyers EN, Lewandoski M, Martin GR (1999). Targeted disruption of Fgf8 causes failure of cell migration in the gastrulating mouse embryo. Genes and Development 13: 1834–1846. DOI 10.1101/gad.13.14.1834. [Google Scholar] [CrossRef]
Wang X, Zhu Y, Sun C, Wang T, Shen Y, Cai W, Sun J, Chi L, Wang H, Song N, Niu C, Shen J, Cong W, Zhu Z, Xuan Y, Li X, Jin L (2017). Feedback activation of basic fibroblast growth factor signaling via the Wnt/β-catenin pathway in skin fibroblasts. Frontiers in Pharmacology 8: 32. [Google Scholar]
Weston CR, Davis RJ (2001). Signaling specificity—A complex affair. Science 292: 2439–2440. DOI 10.1126/science.1063279. [Google Scholar] [CrossRef]
Xuan Y, Chi L, Tian H, Cai W, Sun C, Wang T, Zhou X, Shao M, Zhu Y, Niu C, Sun Y, Cong W, Zhu Z, Li Z, Wang Y, Jin L (2016). The activation of the NF-κB-JNK pathway is independent of the PI3K-Rac1-JNK pathway involved in the bFGF-regulated human fibroblast cell migration. Journal of Dermatological Science 82: 28–37. DOI 10.1016/j.jdermsci.2016.01.003. [Google Scholar] [CrossRef]
Yang CM, Ji S, Li Y, Fu LY, Jiang T, Meng FD (2017). β-Catenin promotes cell proliferation, migration, and invasion but induces apoptosis in renal cell carcinoma. OncoTargets and Therapy 10: 711–724. DOI 10.2147/OTT.S117933. [Google Scholar] [CrossRef]
 | This work is licensed under a Creative Commons Attribution 4.0 International License, which permits unrestricted use, distribution, and reproduction in any medium, provided the original work is properly cited. |